investor day - group.qbe.com media/asx... · morning tea lunch group strategy and ... investor day:...
TRANSCRIPT


INVESTOR DAY
10 MAY 2016

2
INVESTOR DAY: AGENDA
ARRIVAL AND COFFEE
EUROPE | Richard Pryce – EO CEO
AUSTRALIA AND NEW ZEALAND | Tim Plant – ANZ CEO
EMERGING MARKETS | David Fried – EM CEO
NORTH AMERICA | David Duclos – NA CEO
OPERATIONAL EFFECTIVENESS | Colin Fagen – Group COO / Dominic Clayden – Global Claims Director
INVESTOR THESIS AND FINANCIAL TARGETS | Pat Regan – Group CFO
WRAP UP AND Q&A | John Neal / Executive Team
MORNING TEA
LUNCH
GROUP STRATEGY AND OUTLOOK | John Neal – Group CEO
INVESTMENTS | Gary Brader – Group Chief Investment Officer

3
QBE IS A DISTINCTIVE TOP 20 GLOBAL P&C INSURER
UNIQUE GLOBAL
FOOTPRINT
Established in major hubs:
London, New York,
Singapore, Hong Kong,
Bermuda
Strong position in an
attractive home market,
Australia
Operations in 22 high-
growth markets across AP
and LatAm
FOCUS ON
COMMERCIAL AND
SPECIALTY LINES
World-class underwriting
expertise with a strong
Lloyd’s franchise
Deep understanding of our
customers’ unique needs
Innovation culture
improving products and
customer value proposition
GLOBAL
CAPABILITIES
DELIVERED LOCALLY
Shared services and centres
of excellence
Scalable global platforms:
investment in technology and
data analytics
Ability to service truly global
brokers and customers

4
FOCUSED COMMERCIAL AND SPECIALTY INSURER WITH STRONG POSITIONS IN KEY MARKETS
$15B
2015
GWP
UNIQUE GLOBAL FOOTPRINT
ACROSS 37 COUNTRIES
~80% OF BUSINESS IS COMMERCIAL
AND SPECIALTY LINES
• Leading (#2) corporate and commercial insurer
• Broadly diversified product and distribution
footprint
• Established as a true corporate and specialty insurer
• Market leader in Crop
• Highly regarded franchise in the London Market
• Capability to write business in 140 countries
• Meaningful footprint in 22 markets
• Leading franchise in specialty and commercial
insurance

5
WE HAVE SUCCESSFULLY STABILISED AND TRANSFORMED
SIMPLIFIED
AND REFOCUSED
IMPROVED
PROFITABILITY
STRENGTHENED
BALANCE SHEET
1. Adjusted figure excludes Argentine Workers’ Compensation business and $41M deferred acquisition cost write down on the sale of M&LS
Operating expenses Debt to equityEmployees
GWP COR Surplus above S&P ‘A’
1
1

6
OUR PLANS ASSUME CHALLENGING MACRO ENVIRONMENT
Rates are low, with investment
income below pre-GFC levels
Pricing environment
remains difficult
Global GDP
growth is subdued
1. AP excludes Mainland China, India and JapanSource: Bloomberg; Swiss Re Economic Research & Consulting
SUBDUED
GROWTH
PROLONGED
LOW RATES
SOFT
PRICING
1

7
UNDERLYING TRENDS ARE DISRUPTING “BUSINESS AS USUAL”
DIGITISATIONDigitally enhanced customer experiences
BIG DATAIncreasing application of big data and telematics
REGULATIONCapital and solvency requirements
VALUE CHAINReshaping of the
insurance value chain
ALTERNATIVE SOURCES OF
CAPITALNew sources of capital inflows from
alternative managers
CUSTOMERSIncreasingly sophisticated and seeking direct
interaction with insurers
MARKET DYNAMICSConsolidation across market
DISRUPTIVE
TRENDS

8
A FOCUSED STRATEGIC AGENDA
CLAIMS
EXCELLENCE
Capturing scale advantage in our core: Commercial and Specialty
DATA AND
ANALYTICS
OPERATIONAL
EFFICIENCYApplying industry-leading
capability
Sharing best-in-class claims
expertise across regions
Capturing efficiency and
scale benefits (e.g., GSSC)
CUSTOMER AND
PARTNER-LED GROWTH Deepening major customer and
broker relationships
WORLD CLASS
TALENTAttracting and retaining
top talent
UNDERWRITING
EXCELLENCEDriving underwriting
excellence across regions

9
A FOCUSED STRATEGIC AGENDA
• Divested: North American ML&S, Argentine
Workers’ Compensation, Central and Eastern
European businesses, Italian MedMal, Aviation
• Remediated: Wholesale review of all
businesses with >100% COR
• Grown: North American Specialty, European
Retail (Commercial Lines), Emerging Markets
CUSTOMER AND
PARTNER-LED GROWTH Deepening major customer and
broker relationships
WORLD CLASS
TALENTAttracting and retaining
top talent
UNDERWRITING
EXCELLENCEDriving underwriting
excellence across regions
2016F2013
$18.0B
GWP~$14.5B
GWP
>100% COR 90-100% COR <90% COR

10
A FOCUSED STRATEGIC AGENDA
CUSTOMER AND
PARTNER-LED GROWTH Deepening major customer and
broker relationships
WORLD CLASS
TALENTAttracting and retaining
top talent
UNDERWRITING
EXCELLENCEDriving underwriting
excellence across regions
RETENTIONCORPORATE &
SPECIALTY
EMERGING
MARKETS

11
A FOCUSED STRATEGIC AGENDA
CUSTOMER AND
PARTNER-LED GROWTH Deepening major customer and
broker relationships
WORLD CLASS
TALENTAttracting and retaining
top talent
UNDERWRITING
EXCELLENCEDriving underwriting
excellence across regions
PURPOSE & VISION ONE QBE VALUESLEADERSHIP &
TECHNICAL ACADEMIES

12
CLEAR FINANCIAL TARGETS
WELL
CAPITALISED
FRANCHISE
STRENGTH
PERFORMANCE
IMPROVEMENT
GROWING CASH
FLOWS
• Operating expense savings of $300M
• Improvement in COR to ~93%
• Long-term return on tangible equity 13-15%1
• S&P ‘A+’ rating or better
• GWP growth of ~3% per annum across the cycle
• Cumulative cash remittance >$2.5B over 2016-18
• Payout ratio of up to 65%
1. Equates to ROE of ~10%

13
INVESTOR DAY: AGENDA
ARRIVAL AND COFFEE
EUROPE | Richard Pryce – EO CEO
AUSTRALIA AND NEW ZEALAND | Tim Plant – ANZ CEO
EMERGING MARKETS | David Fried – EM CEO
NORTH AMERICA | David Duclos – NA CEO
OPERATIONAL EFFECTIVENESS | Colin Fagen – Group COO / Dominic Clayden – Global Claims Director
INVESTOR THESIS AND FINANCIAL TARGETS | Pat Regan – Group CFO
WRAP UP AND Q&A | John Neal / Executive Team
MORNING TEA
LUNCH
GROUP STRATEGY AND OUTLOOK | John Neal – Group CEO
INVESTMENTS | Gary Brader – Group Chief Investment Officer

14
WE HAVE A STRONG CORE BUSINESS
2015 GWP OF $4.4B
GWP BY TYPE OF BUSINESS GWP BY DOMICILE1
International
MarketsRetail
(Commercial
Lines)
Global
Reinsurance
UK & Ireland
Europe
USA
LatAm
Canada
Other
LEAD ON ~75% OF
BUSINESS BY GWP
TOP QUARTILE
PERFORMER AT LLOYD’S
STRONG UK AND
LONDON MARKET
PRESENCE
BUSINESS
SIZE
COMPETITIVE
POSITION
BUSINESS
MIX
GBP
EUR
UK &
Ireland
CADOther
USD
GWP BY CURRENCY
RECOGNISED
INDUSTRY EXPERTISE
• CORPORATE & SPECIALTY FOCUS
• CAPABILITY TO WRITE IN OVER 140 COUNTRIES
• GLOBAL REINSURANCE
1. Based on current year underwriting

15
PORTFOLIO
UNDERWRITING MANAGEMENT STRUCTURED INTO THREE DIVISIONS
RETAIL
(COMMERCIAL LINES) INTERNATIONAL MARKETS QBE RE1
Property, Liability, Motor,
Financial & Specialty Markets (F&SM)
Marine, Oil & Gas, Political Risk &
Violence, International Property,
International Liability
Property, Casualty, US multi-line
European multi-line, Specialty
DISTRIBUTION
Liability
PropertyF&SM
Motor
SME
Credit
Lines
28%
19%25%
19%
7%2%
Liability
Property
F&SM
Marine
Energy
Political Risk & Violence
18%
27%
4%
22%
25%
3%Liability
Property
European
Multi-line
Specialty
26%
34%
25%
16%
2015 COR: 93% 2015 COR: 91% 2015 COR: 76%
• London
• 8 UK Regional offices
• 6 European countries
• London
• Toronto
• Vancouver
• Singapore
• Dubai
• New Orleans
• Houston
• Miami
• London
• New York
• Tokyo
• Brussels
• Dublin
• Bermuda
• LatAm
GWP
$2.4BGWP
$1.3B
GWP
$1.0B
1. Includes $0.3B of global reinsurance risks written by NA but managed by QBE EO

16
DELIVERED STRONG FY15 RESULTS DESPITE HIGHLY COMPETITIVE MARKET CONDITIONS
GWP
NEP
Note: Excludes reinsurance GWP written by QBE NA; 2015 exchange rate of 1.5271 GBP/USD applied to 2014 GWP and NEP
• Improvement in COR driven by:
- Improved loss experience by portfolio
adjustment
- Focus on underwriting excellence
- Claims and cost reduction initiatives
- Positive prior year development
• GWP up 4% on a constant currency basis,
despite continued market pressure on
premiums
• Well positioned franchise; able to withstand
challenging market conditions
COR (%)
$B, CONSTANT CURRENCY
TOP-LINE
GROWTH
PROFITABILITY
IMPROVEMENT
PERFORMANCE
DRIVERS

17
KEY STRATEGIC PRIORITIES
STRENGTHEN POSITION AS A LEADING SPECIALTY COMMERCIAL INSURER
AND REINSURER WITH GLOBAL EXPOSURE
Preserve margins through continued underwriting
excellence, claims management and cost control
Maintain leadership positions in our core markets,
with strong customer focus
Selective and disciplined profitable growth
through extended distribution
Positioned to capture further upside should
market conditions improve

18
HOW WE WILL DELIVER ON OUR STRATEGIC PRIORITIES
• Strengthen customer and broker relationships to protect profitable portfolios,
increase up-sell and cross-sell
• Drive new, high quality business at lower acquisition cost through extended
distribution footprint
• Maintain best-in-class underwriting skill and discipline and export London
underwriting expertise by deploying our specialist products in regional hubs
• Accelerate the use of data and analytics in underwriting, claims and sales/
distribution to improve upsell/cross sell and margins
• Attract, retain, motivate and reward the best people in our chosen sectors
• Encourage a performance and execution culture across the organisation
• Continue implementing global claims excellence program
• Improve global claims excellence program, sharing our claims excellence expertise with other regions
WORLD CLASS
TALENT
UNDERWRITING
EXCELLENCE
CUSTOMER AND
PARTNER-LED GROWTH
DATA &
ANALYTICS
CLAIMS
EXCELLENCE

19
POSITIONED FOR SELECTIVE AND DISCIPLINED GROWTH
Exporting
underwriting
expertise to
emerging markets
(e.g., new hubs in
Miami, Singapore)
Establishing a
global QBE brand
and product
offering in a core
product
Expanding
footprint through
product diversity
and strong
specialty focus
Building industry
practice groups,
multinational
service and
underwriting
capability
Example:
Hubs
Examples:
Oil & Gas, Marine,
Real Estate, Financial
Lines, Life (QBE Re)
Examples:
Canada, Europe
Example:
Global brokers
QBE
COLLABORATIONMAJOR TRADING
PARTNERS
PROVEN
EXPERTISE
EXTENDED
DISTRIBUTION
MAJOR TRADING
PARTNERS

20
INVESTOR DAY: AGENDA
ARRIVAL AND COFFEE
EUROPE | Richard Pryce – EO CEO
AUSTRALIA AND NEW ZEALAND | Tim Plant – ANZ CEO
EMERGING MARKETS | David Fried – EM CEO
NORTH AMERICA | David Duclos – NA CEO
OPERATIONAL EFFECTIVENESS | Colin Fagen – Group COO / Dominic Clayden – Global Claims Director
INVESTOR THESIS AND FINANCIAL TARGETS | Pat Regan – Group CFO
WRAP UP AND Q&A | John Neal / Executive Team
MORNING TEA
LUNCH
GROUP STRATEGY AND OUTLOOK | John Neal – Group CEO
INVESTMENTS | Gary Brader – Group Chief Investment Officer

21
QBE IS A TOP 3 INSURER WITH A
NUMBER OF UNIQUE ATTRIBUTES
WE HAVE A STRONG POSITION IN AN ATTRACTIVE MARKET
1. Avg COR taken from 2012-2014 using all years where data is availab le2. Excludes reinsurance, includes LMISource: APRA (2015); KPMG General Insurance Industry Review; Company financial reports; AXCO; SNL; Finans Norge; GDV; Danish FSA, IBC; Insurance Sweden;
management estimates
Strong position in
commercial
Recognised and
respected brand
Diversified mix
across products and
customers
Sufficiently large to
drive economies of
scale
Ability to draw on
QBE’s global
capabilities
Est. General Insurance Market GWP (A$B)2
AUSTRALIA IS AN ATTRACTIVE
INSURANCE MARKET
1

22
QBE IS A LEADING COMMERCIAL AND SPECIALTY INSURER IN AUSTRALIA AND NEW ZEALAND
GWP
$3.8B
GWP
$3.8B
Commercial & Specialty Personal
HIGHLY DIVERSIFIED
PORTFOLIO
MULTI-CHANNEL
DISTRIBUTION
BROAD AND DEEP
CUSTOMER BASE
International
brokers
Cluster
groups &
Local
brokers
Financial
institutions
Corporate
partners &
Direct
• Leading corporate and
commercial insurer
• Support international &
Australian brokers. Strong set
of existing corporate partners
• Strong position in SME and
Commercial
Commercial & Specialty Personal

23
ANZO HAS DELIVERED STRONG RESULTS
GWP
UNDERLYING GWP GROWTH MAINTAINED STRONG PROFITABILITY
$B, CONSTANT CURRENCY
Note: 2015 exchange rate of 0.7503 AUD/USD applied to 2012, 2013, 2014 GWP and NEP
NEP
COR (%)

24
ADDRESSING CTP PROFITABILITY
• Increase in claims
frequency dominated by
low severity, low value
claims
• Price increases:
- 3.7% in June 2015
- 2.2% in February 2016
- 6.4% in May 2016
• Ongoing monitoring of
scheme by NSW
Government
OVERVIEW QBE CTP BUSINESS CLAIMS FREQUENCY
Source: State Insurance Regulatory Authority; Motor Accidents Authority

25
LMI NEP RELATIVELY STABLE
Note: Includes Hong Kong operations1. NPAT and NEP in 2014 and 2015 excludes impact of earnings pattern change2. Target NEP reflects new reinsurance arrangement
NEP RELATIVELY STABLE
1 1
Outlook
2 2 2
ALLOWING FOR MODERATION
Outlook

26
HOW WE WILL DELIVER ON OUR STRATEGIC PRIORITIES
UNDERWRITING
EXCELLENCE
• Ensure more disciplined underwriting through continued process
improvement
CUSTOMER AND
PARTNER-LED GROWTH
• Customer experience program to increase retention, growth and advocacy
• Focus on key segments, strategic planning with major broker partners
OPERATIONAL
EFFICIENCY
• Continue implementation of Guidewire platform and associated processes
• Leverage the GSSC and implement new phase of cost transformation
DATA &
ANALYTICS
• Embed data analytics capabilities as part of global program
• Improve customer segmentation and redefine how we interact with customers
CLAIMS
EXCELLENCE• Continue implementing global claims excellence program

27
INVESTOR DAY: AGENDA
ARRIVAL AND COFFEE
EUROPE | Richard Pryce – EO CEO
AUSTRALIA AND NEW ZEALAND | Tim Plant – ANZ CEO
EMERGING MARKETS | David Fried – EM CEO
NORTH AMERICA | David Duclos – NA CEO
OPERATIONAL EFFECTIVENESS | Colin Fagen – Group COO / Dominic Clayden – Global Claims Director
INVESTOR THESIS AND FINANCIAL TARGETS | Pat Regan – Group CFO
WRAP UP AND Q&A | John Neal / Executive Team
MORNING TEA
LUNCH
GROUP STRATEGY AND OUTLOOK | John Neal – Group CEO
INVESTMENTS | Gary Brader – Group Chief Investment Officer

28
QBE EMERGING MARKETS: UNIQUE FOOTPRINT IN ATTRACTIVE MARKETS
Mexico
Puerto Rico
Colombia
Ecuador
Brazil
Argentina
Chile
India
Hong Kong
MacauPhilippines
Thailand
Vietnam
MalaysiaSingapore
Indonesia
PNG Solomon
Islands
Vanuatu
New Caledonia
FijiFrench
Polynesia
OPERATIONS IN 22 MARKETS IN AP AND LATAM WITH 3,200+ EMPLOYEES
Miami (Hub)

29
DELIVERING ON OUR STRATEGY – IMPROVED PROFITABILITY AND CONTINUED GROWTH
EMERGING MARKETS IS GROWING PROFITABILITY IMPROVING
$B, CONSTANT CURRENCY
NEP
AP LatAm
COR (%)
Note: LatAm GWP and COR excludes Argentine Workers Compensation
2014 GWP 2015 GWP
Emerging
Markets
AP LatAm Emerging
Markets
2014 2015

30
ADDRESSABLE MARKET OPPORTUNITY ~$85B BY 2020
AP: $41B ADDRESSABLE MARKET BY 2020
9% CAGR
LATAM: $44B ADDRESSABLE MARKET BY 2020
8% CAGR
2020 BY MARKET 2020 BY PRODUCT
2020 BY MARKET 2020 BY PRODUCT

31
A CLEAR STRATEGY FOR PROFITABLE GROWTH
EMERGING
MARKETS GOAL
OUR
CHANNELS
OUR
STRATEGIC PILLARS
OUR
STRATEGIC ENABLERS
DELIVER DOUBLE DIGIT GROWTH
ASIA PACIFIC LATIN AMERICA
MTP Agents Brokers Bancassurance Partnerships
QBE GROUP’S PURPOSE IS TO GIVE PEOPLE THE
CONFIDENCE TO ACHIEVE THEIR AMBITIONS
SPECIALTY COMMERCIAL SMEs PERSONAL
Be a leader in Marine, Liability,
CAR / EAR
Be a leader in corporate & commercial for mid-sized local,
national & multinational
Be a leader in SME with comprehensive risk solutions delivered through innovative
technology
Grow our business through Affinity and strategic
partnerships
PEOPLE
Engage, support & develop our people
CENTRES OF
EXCELLENCE
Provide regional underwriting & distribution expertise to local teams
TECHNOLOGY
& OPERATIONS
Support growth with higher productivity, efficiency,
consistency and alignment
with Group Operating Model
CUSTOMERS
Always at the centre of our growth
ONEMAKE IT HAPPEN
MADE POSSIBLE

32
FOUR STRATEGIC PILLARS UNDERPIN OUR EMERGING MARKETS STRATEGY
Collaboration with EO
providing unified
specialist P&I product
to region
Established
successful model
leveraging ANZO
claims process
Development of
technology platform
to support growth of
SME business
Successful
partnership with
HSBC in HK and
Argentina
Example: Marine
P&I
Example: HK
Employees Comp
Example: Qnect Example: HSBC
bancassurance
SPECIALTY MAJOR TRADING
PARTNERSCOMMERCIAL SMEs PERSONAL
Leading travel
insurance provider in
Brazil
Example: Brazil Affinity
Singapore based
office supporting
Asia
Leading EC insurer in
HK market
Operational in HK,
Singapore and
Argentina

33
EM IS UNDERGOING TRANSFORMATION AND ALIGNMENT ACROSS THE DIVISION AND GROUP
FOUNDATION REFINE EXCELLENCE
• Combined AP and LatAm and
implemented EM governance
• Launched profitable growth
strategies
• Established regional Centres of
Excellence (Singapore, Miami)
• Sold Argentine Workers’
Compensation
• Remediated Colombian SOAT
• Expand core
businesses,
channels and
footprint
• Transition to QBE
Global Operational
Model
• Leverage GSSC
• Roll out innovative
technology platforms
• Be a top 3 multinational company
in our region
• Become a leading Commercial
Specialty Insurer, innovation-
driven SME insurer
• Make meaningful contribution to
Group’s top line and bottom line
• Share operational excellence
across Division
• Be recognised as a customer and
employee centric organisation
2012-2015 2016 2017 2018 2019 2020

34
INVESTOR DAY: AGENDA
ARRIVAL AND COFFEE
EUROPE | Richard Pryce – EO CEO
AUSTRALIA AND NEW ZEALAND | Tim Plant – ANZ CEO
EMERGING MARKETS | David Fried – EM CEO
NORTH AMERICA | David Duclos – NA CEO
OPERATIONAL EFFECTIVENESS | Colin Fagen – Group COO / Dominic Clayden – Global Claims Director
INVESTOR THESIS AND FINANCIAL TARGETS | Pat Regan – Group CFO
WRAP UP AND Q&A | John Neal / Executive Team
MORNING TEA
LUNCH
GROUP STRATEGY AND OUTLOOK | John Neal – Group CEO
INVESTMENTS | Gary Brader – Group Chief Investment Officer
35
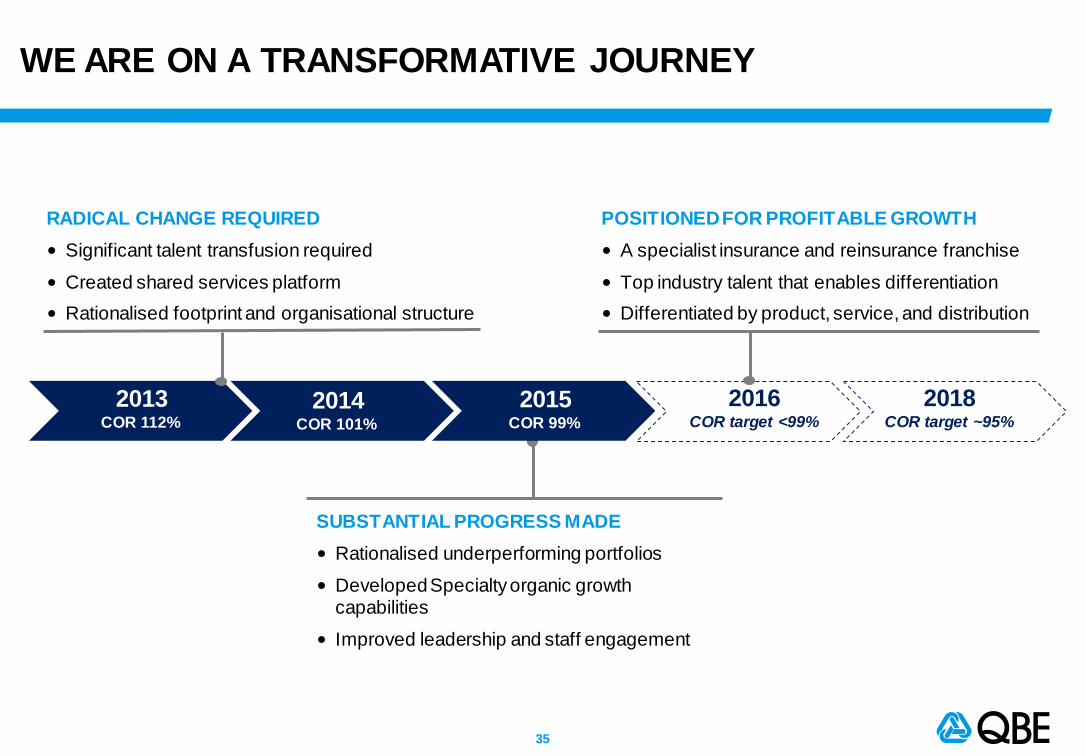
WE ARE ON A TRANSFORMATIVE JOURNEY
RADICAL CHANGE REQUIRED
• Significant talent transfusion required
• Created shared services platform
• Rationalised footprint and organisational structure
SUBSTANTIAL PROGRESS MADE
• Rationalised underperforming portfolios
• Developed Specialty organic growth capabilities
• Improved leadership and staff engagement
POSITIONED FOR PROFITABLE GROWTH
• A specialist insurance and reinsurance franchise
• Top industry talent that enables differentiation
• Differentiated by product, service, and distribution
2016COR target <99%
2013COR 112%
2014COR 101%
2018COR target ~95%
2015COR 99%

36
WE HAVE TURNED A CORNER IN 2015 AND ARE POSITIONED FOR PROFITABLE GROWTH
POSITIONED FOR PROFITABLE GROWTH
1. All FTE counts include internal staff, GSSC staff and third party contractors. Sale of M&LS contributed to change in FTE count 2. Pie chart excludes M&LS premium ($383M) which was divested during 20153. Programs and Affiliated Agencies are reported within Standard Lines. The Affiliated Agency business (formally Consumer) represents personal insurance delivered
through our builder and non-builder channels
COR (%)
Footprint1
SUBSTANTIAL PROGRESS MADE
40
140Headcount
Locations
Reinsurance
Crop
Specialty
Affiliated Agencies3
Standard Lines
Program3
2015 GWP: $5.0B2, 99% COR

37
HOW WE WILL DELIVER ON OUR STRATEGIC PRIORITIES
• Create and sustain a culture which fosters and develops people
• A performance driven and results based environment
• Right people, right role in the right place serving the customer
TALENT AND
LEADERSHIP
• Disciplined technical underwriting and risk selection
• Data driven underwriting decisions to manage the portfolio
• Continuous improvement in underwriting quality of the portfolio
IMPROVE
UNDERWRITING
EXECUTION
• A cost effective and scalable service model
• Create a comprehensive and low complexity underwriting hub
ACHIEVE
OPERATIONAL
EFFICIENCY
• Institutionalise sales excellence
• Effective producer management and segmentation
• Deliver value of a national and global franchise
STRENGTHEN
CUSTOMER
RELATIONSHIPS
CLAIMS
EXCELLENCE• Execute claims operating model changes and transformation

38
UNLOCKING FRANCHISE VALUE THROUGH OUR SPECIALIST APPROACH
SPECIALTY CROP1
MARKET LEADER
AFFILIATED AGENCIES2
UNIQUE POINT OF SALE
CAPABILITY
1. “Policy Count” refers to coverage count which reflects the number of crops planted per policy year2. ‘Reported within the Standard Lines business
GWP
($M)
ORGANIC GROWTH CAPABILITY
Policy
Count
( ‘000)
STANDARD
LINES
STABLE AND SPECIALIZED
PLATFORM
REINSURANCE
A value proposition
centered around the
breadth of our Specialty
and Standard Lines
product offerings LONG-TERM SOLUTIONS TO
GLOBAL CLIENTS
GWP
($M)
GWP
($M)
GWP
($B)

39
BUILDING A LEADING SPECIALTY FRANCHISE IN NORTH AMERICA
$254M
$423M
$320M
~$600M
1. New lines includes Inland Marine and Healthcare
Targeting a $1B portfolio and a low 90s COR
Specialty GWP ($M)
Driving profitable
organic growth
Established
reputation as the
“Specialist’s Specialist”
Culture
of innovation
and excellence
Market-leading
underwriting
and claims expertise

40
A DIFFERENTIATED SPECIALTY AND
STANDARD PRODUCT OFFERING
DELIVERING A SUSTAINABLE BRAND AND PROFIT
DRIVING A SUSTAINABLE
LONG-TERM COR ~95%
1. Excludes $383M M&LS premium
GWP growth
of +3% per annum
Improving expense
ratio by up to 4 points
Improving quality
and predictability of earnings
Retaining, attracting
and developing top talent
Perfecting
a “Go To Market” capability
Portfolio mix
$5.0B
$

41
INVESTOR DAY: AGENDA
ARRIVAL AND COFFEE
EUROPE | Richard Pryce – EO CEO
AUSTRALIA AND NEW ZEALAND | Tim Plant – ANZ CEO
EMERGING MARKETS | David Fried – EM CEO
NORTH AMERICA | David Duclos – NA CEO
OPERATIONAL EFFECTIVENESS | Colin Fagen – Group COO / Dominic Clayden – Global Claims Director
INVESTOR THESIS AND FINANCIAL TARGETS | Pat Regan – Group CFO
WRAP UP AND Q&A | John Neal / Executive Team
MORNING TEA
LUNCH
GROUP STRATEGY AND OUTLOOK | John Neal – Group CEO
INVESTMENTS | Gary Brader – Group Chief Investment Officer

42
GROUP OPERATIONS HAS BEEN DEVELOPED TO
ENABLE QBE TO BEST LEVERAGE GLOBAL SCALE
Established GSSC,
simplified
organisation, setup
global procurement
team. Further
efficiencies to be
realised
Unifying claims
operations across
regions to leverage
best-in-class
capabilities and
create shared
standards
Building a leading
capability to drive
measurable
performance impacts
and create a culture of
data-driven decision
making
1. Represents total cost savings targeted between 2016-2018 and equates to a ~2% reduction in expense ratio. The net level of reduction in year-on-year costs will be impacted by underlying inflation, business growth and reinvestment initiatives
OPERATIONAL
EFFICIENCY
$300M expense
savings 2016-181
CLAIMS
EXCELLENCE
>$200M p.a.
claims benefit
DATA
& ANALYTICS
>150 FTE

43
WE’VE TAKEN A NUMBER OF ACTIONS TO REDUCE COSTS OVER THE LAST THREE YEARS
~$2.1B Underwriting/
distribution
HR
Australia/
New Zealand
Emerging
Markets
GSSC
Group
Established GROUP SHARED
SERVICES CENTRE (‘GSSC’) in
the Philippines
Delivered GROUP
PROCUREMENT SAVINGS
programme
Consolidated TECHNOLOGY
infrastructure and increased
outsourcing
Technology
Europe
North
America
Finance
~14,750
FTEs
Other mgt.
Other support
2015 COST BASE
AND FTE BASE
KEY ACTIONS
2012-15

44
LOOKING FORWARD: SIGNIFICANT OPPORTUNITIES FOR FURTHER COST REDUCTION, LEVERAGING GLOBAL SCALE
SHARED SERVICES
& AUTOMATION
FUNCTIONAL
EXCELLENCE
PROCUREMENT
• Create global org in IT,
HR and Finance with
centres of excellence
• Eliminate duplication
• Ongoing improvement in customer service
• Deliver the next wave of
benefits from our Group-
wide strategic sourcing
and procurement
capability
• Continue driving supplier
consolidation and
enhancing information
systems
• Efficient use of service
centres, especially NA and
EO
• Automate operations
processes (straight through processing) to improve
service and reduce costs
• Migrate more complex,
back-office functions to
GSSC in the Philippines

45
WE WILL BECOME A MORE COMPETITIVE BUSINESS
1. Excludes commission expense; Median excludes QBE; General operating expense as a % of Net Earned Premium; Peer benchmarks are for late st FY reporting period (typically FY15)2. Represents total cost savings targeted between 2016-2018 and equates to a ~2% reduction in expense ratio. The net level of reduction in year-on-year costs will be impacted byunderlying
inflation, business growth and reinvestment initiatives.
Source: Annual Reports, Results Presentations, Form 10-K, Capital IQ
OUR EXPENSES ARE HIGHER THAN MANY
OF OUR PEERS
ONGOING SAVINGS PROGRAM
TARGETING $300M IN SAVINGS
OPERATIONAL EFFICIENCY
$300M cost reduction2
Confirm footnote
1

46
DATA & ANALYTICS VISION AND STRATEGY
CREATE A CULTURE OF
DATA DRIVEN
ANALYTICAL DECISION
MAKING & INNOVATION
BUILD A LEADING
DATA & ANALYTICS
CAPABILITY GLOBALLY
DRIVE MEASURABLE
PERFORMANCE IMPACT
THROUGH BUSINESS
PARTNERSHIP
ENABLE BUSINESS GROWTH AND OPERATIONAL EXCELLENCE
THROUGH INSIGHT-BASED DECISIONS
DATA STRATEGY, STEWARDSHIP,
AND GOVERNANCE
ANALYTIC INSIGHTS AND DECISION
MANAGEMENT LEVERAGING
INTERNAL / EXTERNAL DATA
AUTOMATED CONSISTENT
REPORTING AND PERFORMANCE
MEASUREMENT
VIS
ION
& G
OA
LS
KE
Y
OU
TC
OM
ES
CO
RE
AR
EA
S
REGULATORY AND
COMPLIANCE
PROFITABLE
GROWTHEMPLOYEE IMPACT
OPERATIONAL
EFFICIENCY
CUSTOMER / CLIENT
IMPACT
DATA & ANALYTICS

47
EXAMPLES: DATA & ANALYTICS SOLUTIONS
OPERATIONAL EFFECTIVENESS:
INTELLIGENT CLAIMS TRIAGE
AIM:
Improve claim outcomes through model-
driven claim assignment and investigation
INSIGHTS:
Top 10% of claims have 7x higher severity
Model uses advanced text mining,
geo/distance and external predictors
(beyond traditional injury type approach)
ACTION:
Changes to triage process projected to
result in 1% claim costs reduction
UNDERWRITING EXCELLENCE:
IDENTIFYING PREMIUM LEAKAGE
AIM:
Increase premium collections through
predictive analytics
INSIGHT:
20% of policies drive 83% of leakage
Innovative data mining identified 15% of
leakage due to class code
misclassification
ACTION:
Implemented proactive auditing of at-risk
policies, reducing leakage by up to 16%
NA NA
DATA & ANALYTICS
AIM:
Identify patterns and characteristics
associated with fraudulent behaviour
INSIGHT:
Fraudulent claims more likely to
come from areas outside the
immediate point of sale
ACTION:
Closure of 1300+ points of sale1 and
close monitoring of a further 300+
DISTRIBUTION EXCELLENCE:
OPTIMISING NETWORK
EM
1. Total closed to date, including those closed as part of Data & Analytics work

48
LEVERAGING GLOBAL CLAIMS CAPABILITY
LEVERAGING GLOBAL CLAIMS CAPABILITY AND UTILISING THE BEST OF
QBE’S EXPERTISE ACROSS LINES OF BUSINESS
CLAIMS COST
REDUCTION
1
GOVERNANCE &
CONTROL
SCALABILITY CUSTOMER
EXPERIENCE
Enabling business drivers:
2 3 4
Improved NPS and
retention
Improved performance
management
Flat expense
ratio
Improved loss
ratio
CLAIMS EXCELLENCE

49
EIGHT OPPORTUNITY THEMES AND THREE ENABLERS ARE BEING ADDRESSED AS PART OF THE PROGRAMME
CLAIMS EXCELLENCE
Fraud
Recoveries
Supply chain optimisation
Litigation management
Legacy/run off management
Governance and control
Technology and information
Data and analytics
CLAIMS INDEMNITY
ENABLERS
DELIVERED ~$100M GROSS CLAIMS SAVINGS IN 2015, WITH FURTHER SAVINGS FORECAST FOR 2016
CLAIMS OPERATIONS
Improved segmentation
and work allocation
Third party administrator
(TPA) management
Claims workforce, process triaging
and performance management
6
7
8
1
2
3
4
5
A
B
C

50
WE ARE USING STATE-OF-THE-ART DATA ANALYTICS TO OPTIMISE FRAUDULENT CLAIM IDENTIFICATION
New algorithm released every 3-5 weeks
1
4
Internal/external data
sources
2
3
LOW SPEED IMPACTS
CLAIMS FARMING
STAGED INCIDENTS
Insignificant impacts unlikely to cause injury.
Existing fraud detection system used to pick up
on trigger words
Cold calling agencies encourage pursuit of injury
claims close to limitation periods. Often indicated
by incomplete data fields in forms
Claims contrived by false representation of facts.
External databases used to identify fraudulent
claimant characteristics
CLAIMS EXCELLENCE
PREDICTIVE SCORING ALGORITHM EXAMPLES

51
IMPLEMENTING ACROSS ALL REGIONS IN 2016-2018, DELIVERING >$200M P.A. CLAIMS SAVINGS
GL
OB
AL
1. Excluding Argentine Workers’ Compensation2. Claims reserves reported as per Net Discounted Central Estimate, total reserves of $14B including $2.7B of Equator Re reserve s
CLAIMS EXCELLENCE
TPA management, fraud, litigation management
Legacy / run-off management, RI recoveries
Motor, fraud, TPA management
Fraud, supplier management
RE
GIO
NA
L
2015
claims expense
$2.3B
$1.8B
$2.1B
$0.8B(1)
2015
total reserves(2)
$2.3B
$5.6B
$2.8B
$0.7B
AUSTRALIA
ANDNEW ZEALAND
NORTH
AMERICA
EUROPE
EMERGING
MARKETS
PRIORITY OPPORTUNITIES
• Global team: sharing best-practices and improving consistency
• Global centres of excellence: leveraging specialist capabilities
across regions

52
INVESTOR DAY: AGENDA
ARRIVAL AND COFFEE
EUROPE | Richard Pryce – EO CEO
AUSTRALIA AND NEW ZEALAND | Tim Plant – ANZ CEO
EMERGING MARKETS | David Fried – EM CEO
NORTH AMERICA | David Duclos – NA CEO
OPERATIONAL EFFECTIVENESS | Colin Fagen – Group COO / Dominic Clayden – Global Claims Director
INVESTOR THESIS AND FINANCIAL TARGETS | Pat Regan – Group CFO
WRAP UP AND Q&A | John Neal / Executive Team
MORNING TEA
LUNCH
GROUP STRATEGY AND OUTLOOK | John Neal – Group CEO
INVESTMENTS | Gary Brader – Group Chief Investment Officer

53
OUR INVESTMENT PORTFOLIO RELATIVE TO PEERS
1. QBE numbers as at 31 March; total direct (0.4%) and indirect (0.4%) exposure to Energy-related securities is 0.8% of the investment portfolio2. Our ‘Peers’ are made up of ACE, AIG, Allianz, Allstate, Aviva, AXA, Chubb, Generali, Hartford, Lloyds, RLI, RSA, Travelers, Zurich
Significantly
more Money Market and Cash
than peers
Significantly
less BBB exposure than
peers
Significantly
lower growth assets
1
SUPERIOR CREDIT QUALITY EXPOSUREQBE MORE WEIGHTED TOWARDS
LOWER RISK INVESTMENTS
2 2

54
INVESTMENT STRATEGY OVERVIEW
•QBE has strategic appetite
for up to 15% in Growth Assets
- Market environment and volatility
suggest merit in 10% allocation
in 2016
•Deploy more cash into credit while
remaining conservative
• Increase asset duration to 2.25
years by 2018
INVESTMENT STRATEGYDEPLOY MORE CASH AND MONEY
MARKET SECURITIES TO CREDIT

55
WE ARE TARGETING A 3% INVESTMENT RETURN BY 2018
Largely driven by portfolio
change

56
INVESTOR DAY: AGENDA
ARRIVAL AND COFFEE
EUROPE | Richard Pryce – EO CEO
AUSTRALIA AND NEW ZEALAND | Tim Plant – ANZ CEO
EMERGING MARKETS | David Fried – EM CEO
NORTH AMERICA | David Duclos – NA CEO
OPERATIONAL EFFECTIVENESS | Colin Fagen – Group COO / Dominic Clayden – Global Claims Director
INVESTOR THESIS AND FINANCIAL TARGETS | Pat Regan – Group CFO
WRAP UP AND Q&A | John Neal / Executive Team
MORNING TEA
LUNCH
GROUP STRATEGY AND OUTLOOK | John Neal – Group CEO
INVESTMENTS | Gary Brader – Group Chief Investment Officer

57
INVESTOR THESIS
PERFORMANCE
IMPROVEMENT
WELL
CAPITALISEDGROWING
DIVIDENDS
FRANCHISE
STRENGTH
• Attractive market positions
• Deep distribution and customer relationships
• Retention
• Organic growth
• S&P ‘A+’ rated or better
• Resilient to downside scenarios
• Underwriting excellence
• Operational efficiency
• Claims transformation
• Optimising reinsurance
• Data and analytics
• Investment returns
• Established cash
remittance framework
• Significant free cash flow
• Potential for strong dividend growth
EXECUTING TO CLEAR FINANCIAL TARGETS
$$

58
PERFORMANCE IMPROVEMENT OPPORTUNITY
Increase
returns to
3%
~2%
improvement
in expense
ratio
Optimise
reinsurance~3%
CAGR
GWP
growthShift mix
to more
profitable
linesContinued
soft pricing
environment
>$200M p.a.
by 2018
NPAT ($M )
ILLUSTRATIVE
TARGETING >10% PROFIT CAGR
PERFORMANCE IMPROVEMENT
Cautious
LMI claims
ratio
Note: Analysis excludes any potential impact of change in discount rates over the period

59
RATE REDUCTIONBenefit from lower pricing
available in market as we complete
our current multi year deals
CONSOLIDATIONOptimise existing covers
through reduction / elimination
of divisional covers
RISK OPTIMISATIONTactical opportunities to increase retention without material impact
on earnings volatility
REINSURANCE: TARGETING $300-400M REDUCTION IN COST
WITH ~$50-$100M IMPROVEMENT IN UNDERWRITING PROFIT
TREATYADRESSABLE
OPPORTUNITY
CAT, risk &
aggregate$770M
Crop $325M
Divisional
covers$455M
Facultative $110M
Total $1.7BN
PERFORMANCE IMPROVEMENT
$300-400M reduction in cost
REINSURANCE OPPORTUNITY KEY AREAS FOR SAVINGS

60
STRONG CAPITAL POSITION
2013 2014 2015
Borrowings
($B)4.6 3.6 3.5
Goodwill &
Intangibles
($B)
4.5 3.8 3.6
PCA
multiple1 1.59x 1.67x 1.72x
Capital
(US$B)
~$0BSurplus
above ‘A’
capital
(US$)
~$1B ~$2B
KEY INDICATORS
S&P CAPITAL2
S&P CAPITAL – DETAILED VIEW
WELL CAPITALISED
A range AA range
0% 20%
1. Benchmark range 1.6x to 1.8x
2. Dial shows surplus above ‘A’ capital

61
CAPITAL RESILIENCE (SENSITIVITIES)
SENSITIVITY 1 in 20 SCENARIONPAT
IMPACT
CAPITAL
IMPACT3
Catastrophe• Disaster equivalent to modelled
Category 5 hurricane in
Florida1
~$50M
Investment stress
• Cumulative impact of:
- Equities: -20%
- Rates: +100bps
- Credit spreads: +50bps
- Unlisted property trust: -10%
~$450M
Mortgage insurance
stress
• Unemployment rate 12%
• Housing prices down 20%~$100M p.a. for 3 years2
1
2
3
1. Industry losses of ~$40B2. Reflects losses on mortgage insurance offered by our Australian LMI business. Excludes impact of mark -to-market on investment assets3. Dial shows surplus above ‘A’ capital
WELL CAPITALISED ILLUSTRATIVE
A
range
AA
range
0% 20%
A
range
AA
range
0% 20%
Capital impact to be
updated for
catastrophe
No change

62
OUR REMITTANCE FRAMEWORK TARGETS STRONG CASH FLOWS TO THE GROUP
NPAT X 70-80% less Group Corporate CostsAUSTRALIA AND
NEW ZEALAND
NPAT X 70-80%NORTH AMERICA
NPAT X 70-80% less Europe interest costsEUROPE
NPAT X 90-100%EQUATOR
NPAT X 50%EMERGING
MARKETS
GROUP INTEREST COSTS
+
+
+
+
-
GROWING DIVIDENDS

63
POSITIVE REMITTANCE OUTLOOK
Outlook
$2.5B+
GROWING DIVIDENDS

64
DIVIDENDS: INCREASING SHAREHOLDER PAYOUT
• Dividend payout increased
to up to 65%
• Targeting dividend growth
greater than profit growth
KEY
DRIVERS
• Targeting >10% profit
CAGR
• Strong internal cash flow
• Strong capital position
GROWING DIVIDENDS
OUTLOOK
STRONG DIVIDEND GROWTH 2013-15,
WHICH WE AIM TO CONTINUEDIVIDEND OUTLOOK

65
CLEAR FINANCIAL TARGETS
WELL
CAPITALISED
FRANCHISE
STRENGTH
PERFORMANCE
IMPROVEMENT
GROWING CASH
FLOWS
• Operating expense savings of $300M
• Improvement in COR to ~93%
• Long-term return on tangible equity 13-15%1
• S&P ‘A+’ rating or better
• GWP growth of ~3% per annum across the cycle
• Cumulative cash remittance >$2.5B over 2016-18
• Payout ratio of up to 65%
1. Equates to ROE of ~10%

66
INVESTOR THESIS
PERFORMANCE
IMPROVEMENT
WELL
CAPITALISEDGROWING
DIVIDENDS
FRANCHISE
STRENGTH
• Attractive market positions
• Deep distribution and customer relationships
• Retention
• Organic growth
• S&P ‘A+’ rated or better
• Resilient to downside scenarios
• Underwriting excellence
• Operational efficiency
• Claims transformation
• Optimising reinsurance
• Data and analytics
• Investment returns
• Established cash
remittance framework
• Significant free cash flow
• Potential for strong dividend growth
EXECUTING TO CLEAR FINANCIAL TARGETS
$$

67
INVESTOR DAY: AGENDA
ARRIVAL AND COFFEE
EUROPE | Richard Pryce – EO CEO
AUSTRALIA AND NEW ZEALAND | Tim Plant – ANZ CEO
EMERGING MARKETS | David Fried – EM CEO
NORTH AMERICA | David Duclos – NA CEO
OPERATIONAL EFFECTIVENESS | Colin Fagen – Group COO / Dominic Clayden – Global Claims Director
INVESTOR THESIS AND FINANCIAL TARGETS | Pat Regan – Group CFO
WRAP UP AND Q&A | John Neal / Executive Team
MORNING TEA
LUNCH
GROUP STRATEGY AND OUTLOOK | John Neal – Group CEO
INVESTMENTS | Gary Brader – Group Chief Investment Officer

68
INVESTOR DAY: AGENDA
ARRIVAL AND COFFEE
EUROPE | Richard Pryce – EO CEO
AUSTRALIA AND NEW ZEALAND | Tim Plant – ANZ CEO
EMERGING MARKETS | David Fried – EM CEO
NORTH AMERICA | David Duclos – NA CEO
OPERATIONAL EFFECTIVENESS | Colin Fagen – Group COO / Dominic Clayden – Global Claims Director
INVESTOR THESIS AND FINANCIAL TARGETS | Pat Regan – Group CFO
WRAP UP AND Q&A | John Neal / Executive Team
MORNING TEA
LUNCH
GROUP STRATEGY AND OUTLOOK | John Neal – Group CEO
INVESTMENTS | Gary Brader – Group Chief Investment Officer

69
DISCLAIMER
This presentation should be read in conjunction with all information which QBE has lodged with the Australian Securities Exchange
(“ASX”). Copies of those lodgements are available from either the ASX website www.asx.com.au or QBE’s website www.qbe.com.
Prior to making a decision in relation to QBE’s securities, products or services, investors, potential investors and customers must
undertake their own due diligence as to the merits and risks associated with that decision, which includes obtaining independent
financial, legal and tax advice on their personal circumstances.
This presentation contains certain "forward-looking statements“ for the purposes of the U.S. Private Securities Litigation Reform Act of
1995. The words "anticipate", “believe", "expect", "project", "forecast", "estimate", "likely", "intend", "should", "could", "may", "target",
"plan" and other similar expressions are intended to identify forward-looking statements. Indications of, and guidance on, future
earnings and financial position and performance are also forward-looking statements.
Such forward-looking statements are not guarantees of future performance and involve known and unknown risks, uncertainties and
other factors, many of which are beyond the control of QBE that may cause actual results to differ materially from those either
expressed or implied in such statements. There can be no assurance that actual outcomes will not differ materially from these
statements. You are cautioned not to place undue reliance on forward-looking statements. Such forward-looking statements only
speak as of the date of this presentation and QBE assumes no obligation to update such information.
Any forward-looking statements assume large individual risk and catastrophe claims do not exceed the significant allowance in our
business plans; no overall reduction in premium rates in excess of our budgeted allowance ; no significant fall in equity markets,
investment returns and/or interest rates; no major movement in budgeted foreign exchange rates; no material change to key inflation
and economic growth forecasts; recoveries from our strong reinsurance panel; and no substantial change in regulation. Should one or
more of these assumptions prove incorrect, actual results may differ materially from the expectations described in this presentation.

70
Appendix

71
QBE LMI HAS AN EFFECTIVE LVR OF C. 55%
Risk in force
(%)Original LVR (average) Effective LVR1 (average)
2015 12.9% 84.9% 82.4%
2014 15.1% 85.8% 73.2%
2013 14.0% 84.7% 62.2%
2012 11.9% 79.9% 54.1%
2011 8.6% 79.7% 54.0%
2010 6.5% 79.0% 51.5%
Prior 2009 31.0% 70.0-84.3% 11.0-47.4%
At 31-Dec-2015 80.8% 54.6%
1. Effective LVR equal to estimated current value of properties divided by estimated current loans outstanding.

72
QBE LMI PORTFOLIO MIX (AS AT 31 DECEMBER 2015)
Original LVR (%)
Underwriting years (%)
Product (%)
RIF by state (%)
Loan amount (%)
Property class (%)
Flow71%
Bulk29%
1. Excludes A$8b inwards reinsurance post 2010

73
QBE EMERGING MARKETS: BUSINESS OVERVIEW
$1.7B
GWP
$1.7B
GWP
GWP BY COUNTRY 2015 GWP BY PRODUCT 2015