2016 guide for organizing around teaching & learning conditions
DESCRIPTION
Using TELL Data to Improve Conditions for SChoolsTRANSCRIPT

Guide for Organizing Around TEACHING & LEARNING CONDITIONS
Revised April 2016
Using TELL Data to Improve Conditions for Students

2 Guide for Organizing Around Teaching and Learning Conditions
This Guide references the results from the 2016 TELL Oregon Survey available online at www.telloregon.org. The intent of the Guide is to help OEA members and education partners develop an understanding of the TELL Oregon Survey results in their schools and school district. The Guide may also help local OEA leaders develop and implement a process for members to:
1. Reflect on the overall status of teaching conditions as identified by educators;
2. Use the TELL data to review differences within and across schools in their district;
3. Consider potential strategies and solutions to improve conditions; and
4. Collaboratively work with fellow educators, principals, district administrators and community members to support continuous improvement of teaching and learning conditions in each and every Oregon school and district.
ABOUT THE GUIDE
What is working? What is not working?
What would be ideal?
What are challenges to achieving the ideal?
Goals of the TELL Oregon Results
• Determine whether educators in schools and districts across the state have the resources and supports necessary to provide the most effective teaching and learning environment for students.
• Use the data to inform continuous improvement in schools and districts and advocate for resources and supports at the local and state policy level.
How can we work together to overcome these challenges?

OEA Center for Great Public Schools 3
Helpful Reminders in Examining the TELL Oregon DataImportance of Survey Participation
Teacher voice matters. The TELL Oregon survey has very real, immediate and relevant reasons for educator participation.
• The survey gives “voice” to educators about the supports and resources they need to help each and every student learn and achieve.
• Collective educator voices from across the state have the potential to inform administrators, parents, community members, and district and state policy makers about the ongoing supports necessary in educating students.
• Now in its second round, Oregon is one of just 12 states collecting comprehensive data from educators about all the conditions needed to create a positive environment for student learning.
• The TELL Oregon survey is a step toward helping others understand the complexity of teaching and learning and the resources necessary to prepare Oregon students for their future.
• TELL survey data has supported critical conversations around teaching and learning conditions in schools and districts, which led to positive change. See “Experiences from the Field,” page 10, for details.
What We Know about Teaching Conditions
• Teaching conditions matter for teachers. Teachers with positive perceptions of teaching conditions are much more likely to stay at their current school than are teachers with negative perceptions.
• Teaching conditions are student learning conditions – conditions matter for kids. The New Teacher Center analyzed the relationship between survey responses aggregated to school-level, and student performance as measured by student achievement. There are significant correlations between Time, Leadership, Decision Making, Facilities and Resources and higher school level achievement.
• Principals and teachers have different perceptions of their teaching conditions. Everyone sees things differently, not just administrators and teachers. Elective teachers have different perceptions than core subject teachers. Elementary teachers view conditions differently than high school teachers, and early-career teachers have an outlook on their school that differs from veteran teachers.
• Different perceptions emphasize the need to open the dialogue about issues and find common ground.
In preparation for reviewing the data for your school district, take a moment to read and discuss with other teachers, “Effectively Using the Survey Results.” This article explains how to examine district and school data successfully.
Respond to the prompts on the sheet “Take-Aways and Reflection.” What are the most important points of the article and what ideas should be kept in mind when using the results?
Background on Using Survey Results1

4 Guide for Organizing Around Teaching and Learning Conditions
Teaching conditions are critical to educator success and satisfaction. The TELL Oregon Survey provides data to
schools and districts in Oregon about whether educators have the supportive school environments necessary for them to be successful with students. This unique data represents the perceptions of those who understand these conditions best—the educators who experience them every day. But assessing teaching conditions is not like looking at other more neutral and quantifiable data points like student test scores, class size, etc. Getting honest, authentic input and dialogue, especially in schools where the basic building blocks of positive conditions—trust, time and leadership—are not in place can be challenging. Using information in a positive way toward school improvement is critical. Please consider the following factors when analyzing and using the TELL Oregon Survey.
1. Teaching conditions are an area for school improvement, not accountability.
Because teaching and learning conditions are about schools, no one individual should be held solely accountable for the status of the school culture. Rather, data gathered should be used to guide school improvement planning with schools, rather than assessed on their progress toward implementing collectively developed reforms. If individual school administrators or teachers are assessed in these areas, this survey should serve as one of multiple data artifacts. Individuals can be encouraged to create specific performance goals about their role in creating and implementing data-driven strategies to improve teacher working conditions that are part of the school improvement plan.
2. Teaching conditions are not about any one individual and it will take a community effort to improve.
The principal holds a unique and important place within the school community and can have a significant impact on the professional culture in which teachers work. However, many aspects of teaching conditions are beyond the principal’s control. Broader social trends, federal, state and district policies all impact how educators view and operate within their school and classroom. Conditions are about schools, not about individuals. So no one person should be viewed as responsible for creating or reforming school culture alone. No questions on this survey were about the principal. All questions were about school leadership, defined specifically as an individual, group of individuals or team within the school.
3. Perceptual data are real data.
While the survey results are perceptual data from educators about the presence of important teaching conditions, it does not mean it is not “valid” or as important as other data sources. Educator perceptions of the culture and context of their school have been linked in a number of studies to student learning, future employment plans, efficacy and motivation. Analyzing and using this information to improve schools is critical and needs to be a part of reform efforts at the school and district levels. Educators’ perceptions are their reality. However, other data should be used to triangulate these findings and provide a better understanding of these perceptions such as instructional expenditures, proportion of teachers working out of field, teacher/pupil ratio, etc.
4. Conversations need to be structured and safe.
Conversations about teaching and learning conditions are often the lifeblood of staff rooms. Having data-driven dialogue about the findings of the survey, the root causes of educator perceptions, and potential reforms requires structure, facilitation, ground rules and the ability to separate issues from individuals. These are not easy conversations, and they become harder if they are not tackled systematically when all can participate in a meaningful and safe way.
5. Identify and celebrate positives as well as considering areas for improvement.
Educators have tremendous pride in the work they do and all want to work in a school that allows them to do their best work. And all schools have successes to draw upon as they assess and improve their context. Ensuring that positives are acknowledged and celebrated, while issues are identified and addressed, is an important part of moving forward.
6. Create a common understanding of what defines and shapes teaching and learning conditions.
Anything and everything might be considered a part of and an influence on teaching and learning conditions. Research shows that broader social trends, media coverage, respect for the profession, local and state policies, etc. can all influence teachers’ perceptions of their conditions and ultimately their motivation and efficacy as educators. The survey provides input from educators on a host of important
TELL Oregon Survey:Effectively Using the Survey Results// The New Teacher Center

OEA Center for Great Public Schools 5
research-based teaching conditions. Other areas may be worthy of further investigation, such as teaching assignments, curricular support, assessments and accountability, parent and community support, etc. These questions and responses are a starting point, not an ending point for understanding what is important to teachers for them to do their best work.
7. Focus on what you can solve.
Many issues that shape teaching conditions within a school or district are outside of their control, such as federal and state assessment policies, funding, etc. School improvement planning should focus on areas that can be addressed by the school community. District barriers to school-based solutions should be identified and constructive conversations across schools could occur locally. Other influences such as federal and state policy, broader social and community context, are areas for the school to think about in concert with others. A plan with solutions that cannot be reached through the efforts of the school community is not likely to be successful.
8. Solutions can be complex and long term.
Teaching and learning conditions are cumulative and engrained. It took many years and faculty members to create them and it will take a similar amount of time to reform them. Some solutions may be inexpensive and simple to address, like having a more consistent means of communicating amongst the faculty, while others are resource intensive (class size reduction, integration of technology) or long range (building trust, creating authentic Professional Learning Communities). A school improvement plan must pay attention both to short and long term issues to successfully improve the school environment.
Which factors do you view as being most critical for your success? Explain how you might use the information in your context.
Were there any factors that you disagree with? What was the main source of conflict for you?
Which factor(s) do you think would be the easiest to use at your school? Why?
Which factor(s) do you think would be the most difficult to implement at your school? Why?
YOUR TURN
Effectively Using the Survey ResultsTake-Aways and Reflections
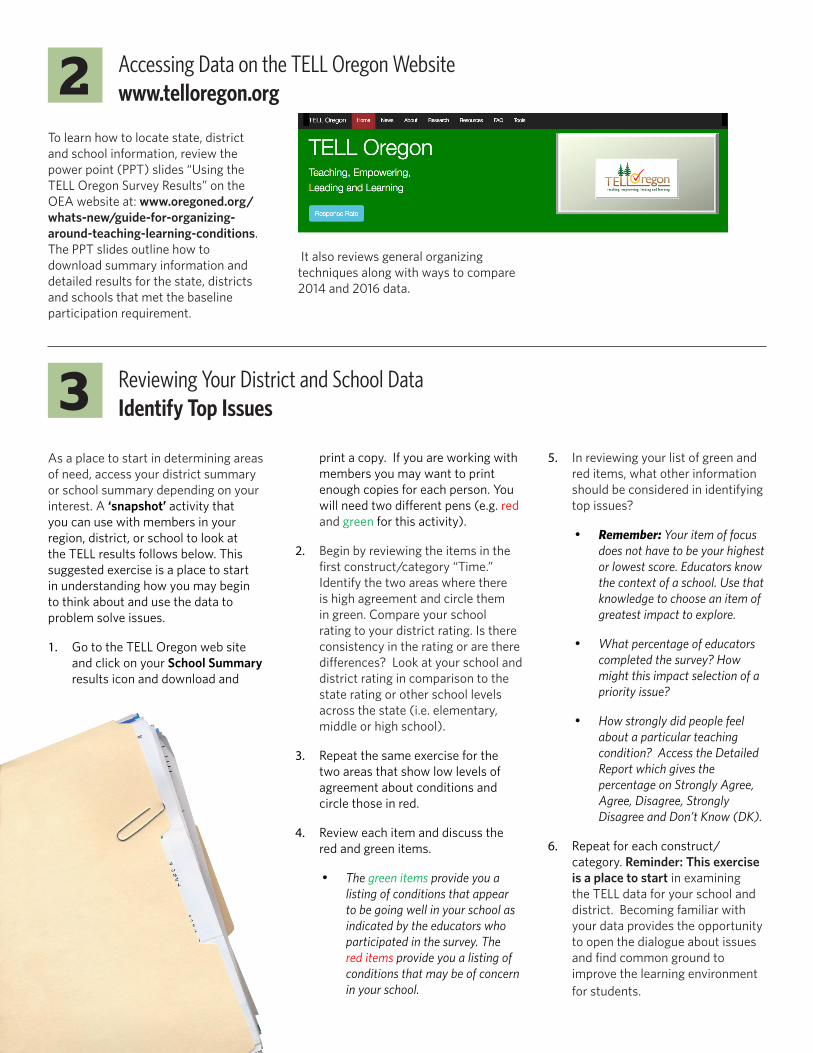
To learn how to locate state, district and school information, review the power point (PPT) slides “Using the TELL Oregon Survey Results” on the OEA website at: www.oregoned.org/whats-new/guide-for-organizing-around-teaching-learning-conditions. The PPT slides outline how to download summary information and detailed results for the state, districts and schools that met the baseline participation requirement.
As a place to start in determining areas of need, access your district summary or school summary depending on your interest. A ‘snapshot’ activity that you can use with members in your region, district, or school to look at the TELL results follows below. This suggested exercise is a place to start in understanding how you may begin to think about and use the data to problem solve issues.
1. Go to the TELL Oregon web site and click on your School Summary results icon and download and
Accessing Data on the TELL Oregon Website www.telloregon.org2
Reviewing Your District and School Data Identify Top Issues3
print a copy. If you are working with members you may want to print enough copies for each person. You will need two different pens (e.g. red and green for this activity).
2. Begin by reviewing the items in the first construct/category “Time.” Identify the two areas where there is high agreement and circle them in green. Compare your school rating to your district rating. Is there consistency in the rating or are there differences? Look at your school and district rating in comparison to the state rating or other school levels across the state (i.e. elementary, middle or high school).
3. Repeat the same exercise for the two areas that show low levels of agreement about conditions and circle those in red.
4. Review each item and discuss the red and green items.
• The green items provide you a listing of conditions that appear to be going well in your school as indicated by the educators who participated in the survey. The red items provide you a listing of conditions that may be of concern in your school.
5. In reviewing your list of green and red items, what other information should be considered in identifying top issues?
• Remember: Your item of focus does not have to be your highest or lowest score. Educators know the context of a school. Use that knowledge to choose an item of greatest impact to explore.
• What percentage of educators completed the survey? How might this impact selection of a priority issue?
• How strongly did people feel about a particular teaching condition? Access the Detailed Report which gives the percentage on Strongly Agree, Agree, Disagree, Strongly Disagree and Don’t Know (DK).
6. Repeat for each construct/category. Reminder: This exercise is a place to start in examining the TELL data for your school and district. Becoming familiar with your data provides the opportunity to open the dialogue about issues and find common ground to improve the learning environment for students.
It also reviews general organizing techniques along with ways to compare 2014 and 2016 data.

OEA Center for Great Public Schools 7
As you begin to think about and explore an issue involved in specific working conditions, it may be helpful to select a strategy for analyzing the issue and engaging others in thinking about the issues.
Two possible strategies follow. They can be used separately or together since they complement each other.
Thinking About Priority Issues41. The “Graphic Organizer”
approach (Appendix A). This is a process for discussing, “What’s working? What’s not working? What’s ideal? What are the challenges to the ideal? Use the back pages of this guidebook for examples and blank template, or use some of the questions from the template as a place to start discussions.
2. The “Individual Item Prompt” approach. On the TELL Oregon web site, go to the “Tools” drop down and access the “Individual Item Prompts.” You will find a series of prompts for nearly every question in the survey. These prompts can be used to guide reflective, collaborative conversations about specific school conditions and may provide a starting point for discussion and conversation on issues that have been identified. A sample “Item Prompt” is listed below.
Sample Prompt (edited): 2.1B: Teachers have time available to collaborate with their colleagues.Collaborative environments contribute greatly to the management of time in a school. That being said, working collaboratively can be very challenging. Faculty need time to develop trust and confidence among one another. This is especially important for faculty new to the school. Groups need assigned leadership to encourage equity of voice and topic. Teacher groups need regular guidance, support, and time in order to have a clear vision of desired goals and objectives.
The administration may be providing opportunities for Professional Learning Communities (PLCs) to meet, but not all educators experience high quality, meaningful PLCs. Additionally, if relationships are strained between colleagues, PLCs are largely ineffective. Getting together as a group does not equate to productive collaboration. There must be support and participation from the administration, teachers and instructional assistants to help facilitate and encourage the productivity of collaborative groups.
Beaverton
The Beaverton Education Association (BEA) used the TELL survey results to facilitate productive conversations between building representatives and building administrators on improving teaching and learning conditions. The BEA Executive Board members guided building representatives through an in-depth analysis of two categories on the survey, comparing their building results with district results. The BEA building representatives identified strengths and weaknesses supported by the data and developed two improvement goals for their school. A principal and a BEA representative modeled a productive conversation by sharing data and discussing goals in front of the BEA Representative Assembly. Representatives then had their conversations with principals and reported back the results to BEA leadership. This process helped strengthen the collaborative relationship between building BEA representatives and their administrators.
South Lane
South Lane Education Association used the TELL survey results to engage in a collaborative discussion with the district administration on strengthening the relationships between staff and the administration with a goal of improving morale. The Superintendent convened several meetings with staff to identify ways to improve the relationship between the administration and the staff. The TELL survey results were also used to elevate the need for improving the maintenance and physical condition of one of the schools. By collaboratively discussing the survey results and developing a plan of action, the maintenance of the school improved.
Successes from the FieldRead more highlights, pages 10-11 !

8 Guide for Organizing Around Teaching and Learning Conditions
5At this point, you may have identified a number of
issues you believe need to be addressed. At the same time, educators only have so much time
and energy in a school year. It’s important to narrow the focus of your work down to one or two issues. But which issues?
First, determine your criteria.
For example:
• Will addressing your chosen issue be of interest among educators?
• Can a difference be made in a timely fashion?
• Does the decision-making around this issue sit within district administration? State? Society?
• Does action around this issue have the potential for collaboration and educator involvement? Community involvement?
• Will it build leadership in your Association?
• Will it inspire members to get involved?
• Will it give educators a sense of their “voice” being heard?
• Can it be tied into other work of the Association? (Bargaining, grievance resolution, professional com-mittees work, etc)
ASSESSING YOUR CAPACITY TO TAKE ACTION
Another piece to consider as you narrow down your focus is your current capacity. As you think about next steps, consider the following questions:
1. What was the level of TELL Survey participation from members in your school and district?
2. How will you share out the results?
3. What do your members think about the results?
4. What do administrators think about the results?
5. Is there a committee such as site council or a school improvement committee already in place that may help in developing a strategy to address issues? How might you partner with the committee?
6. Is your community and school board aware of the survey results? How might they be involved?
7. What issues are you already working on and how can the TELL survey results provide additional data to inform the work?
8. What local association processes do you already have in place that might be used to develop an action plan?
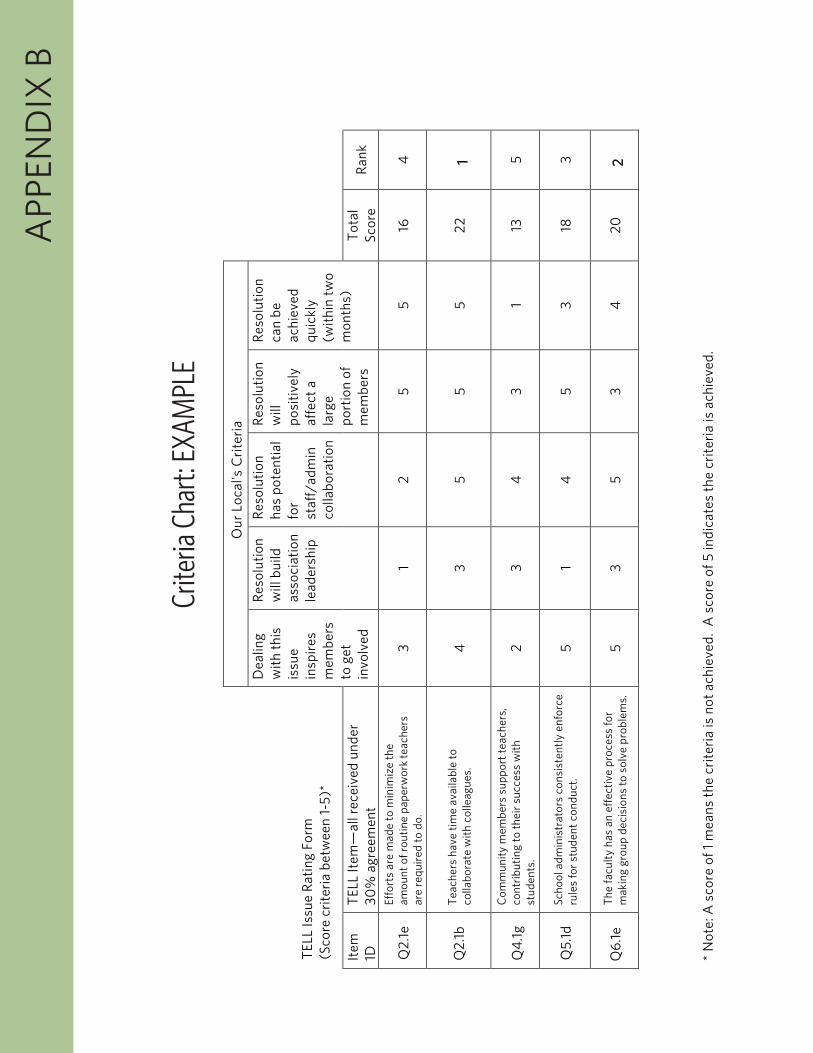
Use the Criteria Chart (page 17) to rate your identified issues against your chosen criteria. This process will allow you to rank your issues and then choose one that is “actionable.”
See Appendix B for a sample of the criteria chart.
How will you use the analysis of the data?Which priority will become a local goal?
Sharing the Results Think about how you will summarize the survey results with your educators. Your summary can be tailored for your audience. Possible pieces to include may be:
1. The level of participation in your school/district.
2. Issues you are already working on (or that are being addressed by a group such as your school improvement committee or labor/management committee).
3. Issues that stood out for their potential for celebration or as areas of concern.
4. Issues that show growth in a certain area since the baseline 2014 results.
5. Issues that might be addressed in interest-based conversations at the bargaining table.
Remember to close the loop by having a way to collect feedback about the results from your members/educators and administrators. It may give you an idea of the direction you want to take in goal setting.

OEA Center for Great Public Schools 9
After reviewing and prioritizing issues, you will be ready to consider goal setting. It will be important to choose a goal that has a clear objective and will result in real
improvement in lives of teachers and students.
GOAL SETTING
Once you have decided on the issue you wish to address, you will need to set some goals or objectives. You might consid-er using the SMART goal method (Specific, Measurable & Observable, Attainable, Result-oriented, Timely). Make sure you include what you will look for as a measure of success in addressing the issue.
As soon as your goal is crafted, it is important to identify who the decision-maker(s) are around this issue. Who will be able to implement the policy, fund the initiative, change the sched-ule, support the new structure, etc.?
Next identify who you can involve as your allies in the con-versation. Who outside of your Association might support addressing this issue? There are many stakeholders in educa-tion. Make sure you are inclusive of the educational commu-nity as you address school/district issues.
See Appendix C for a sample of a SMART goal.
ORGANIZING: PLANNING ACTION
Simply stated, organizing is people gathering together to ac-complish common goals. This may be a step by step forward-ing of a vision or changing someone’s mind. In many cases, organizing around conditions of teaching and learning will begin with critical conversations.
6 Ready to Take ActionGoal Setting
Once you determine your goal, identify your decision-mak-er(s) and allies, it is time to determine step by step how to achieve the goal.
As you brainstorm your strategies to address the issue, you may want to consider using the SMART goal “Result” indica-tors to help you focus your work. The most effective plans only use 1-2 strategies at a time. You can use a Strategies/Results table to help you narrow down your ideas. Be sure to adjust and monitor effectiveness as your plan moves forward.
Other pieces to an organizing plan include: 1. WHO will need to be involved in the action? Primary?
Secondarily?
2. HOW will you address the issue? (Keep the number of strategies low)
3. WHAT resources do you need?
4. WHEN will the steps be completed?
COMMUNICATION: How will the work be communicated to those involved secondarily? With the public?
See Page 19 (Appendix D) for a sample of a Strategy/Result-sTable and Page 20 (Appendix E) for a sample Organizing Plan.
ASSESSMENT AND EVALUATION
Using the pre-established measurement, make sure you schedule time to assess and evaluate the work being done. Another round of the TELL survey will give comparable data, as will other feedback sources. Make sure to communicate and celebrate positive steps and achievements of the team!

10 Guide for Organizing Around Teaching and Learning Conditions
Experiences from the Field Real Life Examples of Organizing Using 2014 TELL Data
After the TELL 2014 results were published, many educators throughout the state used their data as an impetus for broader conversations regarding the climate, conditions, and culture of their schools and how these factors affect student learning. Teams of community members, teachers, principals, administrators, and policymakers used the data as one point of refer-
ence in planning for and taking action toward instructional improvement.
Below are some testimonials showing how different education associations and school districts used the findings to inform school and district level decisions about scheduling, professional development offerings, opportunities to support and cultivate teacher leadership, collaboration, and investments in facilities and resources. The diverse work presented here demonstrates the flexibility of the TELL survey findings as an entry point into complex discussions about the learning conditions in Oregon schools.
DAVID DOUGLAS
The David Douglas Education Association used the TELL survey results to identify and communicate district professional learning needs. A collaborative team of administrators and teachers critically examined the data to look for trends and to identify teacher professional learning needs. The data revealed a need for professional learning in the Common Core State Standards and assess-ment literacy. Coupled with additional educator data, David Douglas launched a district-wide professional learning plan to deepen classroom assessment for student learning practices K-12. The plan was widely accepted and embraced by leadership and teachers because it explicitly referred back to the teacher data from the TELL survey, showing all members of the district the relationship between data and action.
ELGIN
When results were published, the Elgin Education Association President sat down with district administration to discuss the data. Both parties were very interested in the information provided by the survey. The President says, “We had already been discussing implementing some changes within the district and the survey really reinforced the conversation.” Specifically the group looked at class size, prep time, and use of teacher time outside the classroom. When scheduling for the 2014-2015 school year, the admin-istration created smaller class sizes. Additionally, the staff had been working on curriculum development and was paid an extra stipend for their work outside of regular hours. After the discussions, the principals were very mindful of the value of educator’s time when assigning meetings or extra duties.
MADRAS
Madras Education Association (MEA) leaders were concerned about the teaching and learning conditions and general climate of their school district. They felt like Madras students deserved better. The Madras Education Association President met with Oregon Education Association staff, the MEA school site representatives, and a local community member to discuss the TELL results and to formulate a plan to improve the situation. School Board elections were approaching and the group decided to create messaging around their educators’ vision for Madras schools. They used the survey results to create three priorities:
A. Madras needs equitable treatment of students. B. Madras educators are treated as trusted professionals. C. Everyone’s voice is heard and honored: educators, parents, community and students.
The local association used the priorities to create key questions for the school board candidate forums and a critical school board meeting. The effort resulted in a new education-friendly community member elected to the school board. The MEA intends to keep using the TELL data and continue to work on the three priorities.

OEA Center for Great Public Schools 11
NORTH CLACKAMAS
During the 2013-2014 school year, educators and administration had been having many conversations around the lack of shared leadership at several school sites. Educators suggested the morale was negatively impacted at the sites without shared leader-ship. When the 2014 TELL results were published, educators included the data in key conversations with district administration to support their concerns. These conversations resulted in district administration making changes, resulting in improved working conditions at the school sites with negative school climates.
PLEASANT HILL
The Pleasant Hill Education Association leadership used the TELL results to have a conversation about class size at the bargaining table. The discussion carried into each building as staff worked with administrators to address the issue. Additional staff has been added to the high school since then, especially to offset the larger classes like physical education (where they had been reaching 40-50 in a class). The elementary school created and met the goal to keep class sizes under 30. Educators have been thrilled with classes averaging around 25 students.
PORTLAND
The Portland Association of Teachers’ contract established the Instructional Program Council, a professional development com-mittee with educator, ad ministrative, and union representatives. This committee dedicated a standing business item in its monthly meeting to look at some of the identified teaching and learning conditions from the TELL survey. Review of TELL results specific to a particular worksite was also included as a standing agenda item for the monthly building representative/administrator meetings held at each worksite.
REDMOND
The Redmond Education Association Executive Board was very interested in using the conditions addressed in TELL questions as a basis for interest-based bargaining conversations. They had identified professional development as a topic of interest and started with the TELL results as a resource around that topic. The local Association then put together a bargaining survey, with some tar-geted questions around teaching and learning conditions. With the current data and the 2014 TELL data as a baseline, the bargain-ing team felt confident that they had accurate educator perceptions to share at the table.
SHERIDAN
At the beginning of the school year. the Sheridan Education Association President and the newly hired Superintendent extensively reviewed the TELL survey results. They reviewed each area of need and identified how during the year, they would collaboratively address the issues. Although the general membership expressed interest on some of the issues identified the TELL survey results, the Association leaders knew it would be hard to get members to voluntarily add more work to their already enormous workloads. Many of the issues identified through the survey were being addressed by the work of two district teams-their Collaboration Grant Planning Committee and the Teaching and Learning Team. In addition, the local school board is engaged in the Lighthouse Project, in cooperation with the Oregon School Boards Association (OSBA). They used these existing committees to focus on issues identi-fied in the TELL survey.
Educator participation, including early career educators, was evident with the Collaboration Grant Committee. The committee often met inside the work day but if additional time was needed, members were compensated. This demonstrated to many educa-tors that their input was not only important, but valued. The local Association leaders credit the collaborative attitude of the new superintendent as key for their progress on Sheridan’s teaching and learning conditions. Because of this collaborative model and the in-depth conversations around teaching and learning conditions early on, they finished bargaining their contract in just three sessions.

Wha
t is w
orkin
g/no
t wor
king?
EXA
MPL
E IT
EM to
EXA
MIN
E
P
OSI
TIV
E FA
CTO
RS
EFFE
CT
ON
SC
HO
OL/
MY
TEA
CH
ING
MO
VIN
G F
ORW
ARD
2.1 B
Tea
cher
s ha
ve ti
me
avai
labl
e to
co
llabo
r ate
w
ith th
ei r
colle
agu es
.
Dis
tric
t giv
es p
rote
cted
wor
k da
ys a
nd ½
day
s fo
r PLC
s.
Fron
t offi
ce is
goo
d ab
out
turn
ing
away
par
ents
who
com
e un
anno
unce
d.
Adm
inis
trat
ion
does
a g
ood
job
of
only
cal
ling
colla
bora
tive
mee
tings
, and
giv
es u
s no
tice.
Ded
icat
ed, p
rote
cted
gr
oup
plan
ning
tim
e
Keep
s m
y tim
e pr
otec
ted.
A
llow
s m
e m
ore
time
to p
lan
with
col
leag
ues
The
colla
bora
tive
mee
tings
are
m
ore
enga
ging
and
wel
com
ed.
My
time
is p
rote
cted
.
Expa
nd m
y in
tera
ctio
n to
incl
ude
folk
s fro
m
othe
r sch
ools
to g
et m
ore
inpu
t and
idea
s.
Be p
repa
red
to m
axim
ize
this
pla
nnin
g tim
e.
Sinc
erel
y th
ank
the
fron
t offi
ce s
taff
for t
heir
help
.
Than
k th
e ad
min
istr
atio
n. R
einf
orce
th
e st
eps
they
are
taki
ng. B
e co
mm
itted
to
eng
agin
g in
the
mee
tings
whe
n th
ey
are
calle
d.
Wor
k is
dire
cted
by
adm
inis
trat
ors
rath
er th
an
auth
entic
ally
dev
elop
ed w
ith
fello
w te
ache
rs.
Subs
ar
e no
t av
aila
ble
so
we
ofte
n ha
ve to
cov
er o
ther
cla
sses
du
ring
our p
lann
ing.
Kids
are
com
ing
to m
e du
ring
my
plan
ning
tim
e to
get
add
ition
al
help
.
The
wor
k fe
els
inau
then
tic.
Ham
pers
the
grou
p's
abili
ty to
be
resp
onsi
ble
to in
divi
dual
ne
eds.
Oft
en u
nexp
ecte
d an
d re
ally
hu
rts
my
plan
ning
tim
e an
d sc
hedu
ling
of im
port
ant a
ctiv
ities
w
ith c
olle
ague
s.
It is
hel
ping
the
kids
, but
hur
ting
my
plan
ning
and
pre
para
tion
with
co
lleag
ues.
Ask
adm
inis
trat
ion
to a
llow
the
grou
p to
be
self-
dire
cted
. Inv
ite a
dmin
istr
atio
n to
pa
rtic
ipat
e in
the
proc
ess.
Can
we
deve
lop
a ro
tatin
g sy
stem
with
in
the
scho
ol s
o w
e kn
ow b
ette
r whe
n w
e w
ill
be a
sked
? Is
it e
quita
ble?
Des
igna
te s
peci
fic d
ays
of th
e w
eek
as
off-l
imits
to s
tude
nts
CHA
LLEN
GIN
G F
ACT
ORS
E
FFEC
T O
N S
CH
OO
L/M
Y TE
AC
HIN
G
MO
VIN
G F
ORW
ARD
APP
END
IX A
12

Wha
t is w
orkin
g/no
t wor
king?
IT
EM T
O E
XAM
INE
POSI
TIV
E FA
CTO
RSEF
FEC
T O
N S
CH
OO
L/M
Y TE
AC
HIN
G
M
OV
ING
FO
RWA
RD
CH
ALL
ENG
ING
FA
CTO
RS
EF
FECT
ON
SC
HO
OL/
MY
TEA
CH
ING
M
OV
ING
FO
RWA
RD
APP
END
IX A
13

Wha
t is I
deal?
Wha
t are
the C
halle
nges
?
W
HA
T W
OU
LD T
HE
IDEA
L LO
OK
LIKE
?W
HA
T A
RE T
HE
CH
ALL
ENG
ES?
OV
ERC
OM
ING
CH
ALL
ENG
ES?
Teac
hers
nev
er h
ave
to c
over
oth
er te
ache
rs’
clas
ses.
Teac
hers
are
nev
er a
sked
to a
last
min
ute
m
eetin
g fo
r a c
hild
stu
dy/l
ocal
scr
eeni
ng
mee
ting.
Scho
ol
team
/gra
de
leve
l/su
bjec
t ar
ea
mee
tings
are
effi
cien
t and
per
tinen
t. Ev
eryo
ne
gets
alo
ng a
nd c
ontr
ibut
es e
qual
ly.
Not
pra
ctic
al.
Ther
e w
ill b
e tim
es te
ache
rs m
ust c
over
for
one
anot
her.
Sche
dulin
g al
l par
ties
ahea
d of
tim
e an
d ke
epin
g ev
eryo
ne u
p to
spe
ed.
Skill
of f
acili
tato
r, re
latio
nshi
ps.
Nee
ds o
f sta
ff ar
e di
ffere
nt.
Put a
rota
tion
in p
lace
for t
each
er c
over
age
so th
e am
ount
of t
imes
eac
h te
ache
r is
calle
d on
is e
quita
ble.
Com
pens
ate
teac
hers
who
do
cove
r oth
er c
lass
es.
Refle
ct o
n th
e m
eetin
g pr
oces
s an
d im
prov
e th
e ef
ficie
ncy
of th
e pr
oces
s. M
anda
te te
ache
rs a
re
notif
ied
ahea
d of
tim
e. T
each
ers
are
chos
en th
at
wor
k w
ith th
e ch
ild. T
he p
roce
ss is
equ
itabl
e fo
r te
ache
rs.
Prov
ide
an o
utlin
e fo
r eac
h ki
nd o
f mee
ting,
pe
rhap
s a
mod
el o
f wha
t the
mee
ting
shou
ld lo
ok li
ke. M
ake
som
e m
eetin
gs
optio
nal f
or s
kille
d st
aff.
Item
2.1
B: T
each
ers
have
tim
e av
aila
ble
to c
olla
bora
te w
ith th
eir c
olle
ague
s.
APP
END
IX A
14

Wha
t is I
deal?
Wha
t are
the C
halle
nges
?
HO
W D
O W
E O
VER
CO
ME
W
HA
T W
OU
LD T
HE
IDEA
L LO
OK
LIKE
?
W
HA
T A
RE T
HE
CH
ALL
ENG
ES?
T
HE
CH
ALL
ENG
ES?
Item:
APP
END
IX A
15
16
TELL
Issu
e Ra
ting
Form
(S
core
crit
eria
bet
wee
n 1-
5)*
Our
Loc
al's
Crit
eria
D
ealin
g w
ith th
is
issu
e
insp
ires
mem
bers
to
get
in
volv
ed
Reso
lutio
n w
ill b
uild
as
soci
atio
n le
ader
ship
Reso
lutio
n ha
s po
tent
ial
for
staf
f/ad
min
co
llabo
ratio
n
Reso
lutio
n w
ill
posi
tivel
y af
fect
a
larg
e po
rtio
n of
m
embe
rs
Reso
lutio
n ca
n be
ac
hiev
ed
quic
kly
(with
in tw
o m
onth
s)
Item
1D
TELL
Item
—al
l rec
eive
d un
der
30%
agr
eem
ent
Tota
l Sc
ore
Rank
Q2.
1e
Effo
rts
are
mad
e to
min
imiz
e th
e am
ount
of r
outin
e pa
perw
ork
teac
hers
ar
e re
quire
d to
do.
3
1 2
5 5
16
4
Q2.
1bTe
ache
rs h
ave
time
avai
labl
e to
co
llabo
rate
with
col
leag
ues.
4
3 5
5 5
22
1
Q4.
1g
Com
mun
ity m
embe
rs s
uppo
rt te
ache
rs,
cont
ribut
ing
to th
eir s
ucce
ss w
ith
stud
ents
. 2
3 4
3 1
13
5
Q5.
1d
Scho
ol a
dmin
istr
ator
s co
nsis
tent
ly e
nfor
ce
rule
s fo
r stu
dent
con
duct
. 5
1 4
5 3
18
3
Q6.
1e
The
facu
lty h
as a
n ef
fect
ive
proc
ess
for
mak
ing
grou
p de
cisi
ons
to s
olve
pro
blem
s.
5 3
5 3
4 20
2
* N
ote:
A s
core
of 1
mea
ns th
e cr
iteria
is n
ot a
chie
ved.
A s
core
of 5
indi
cate
s th
e cr
iteria
is a
chie
ved.
Crite
ria C
hart:
EXA
MPL
E
APP
END
IX B

17
TELL
Issu
e Ra
ting
Form
(S
core
crit
eria
bet
wee
n 1-
5)*
Our
Loc
al's
Crit
eria
Issu
e 1D
TE
LL It
em—
all r
ecei
ved
unde
r 30%
ag
reem
ent
Tota
l Sc
ore
Rank
*Not
e: A
sco
re o
f 1 m
eans
the
crite
ria is
not
ach
ieve
d. A
sco
re o
f 5 in
dica
tes
the
crite
ria is
ach
ieve
d.
Crite
ria C
hart
APP
END
IX B

18
Issu
e: O
nly
a 24
% ra
te o
f agr
eem
ent f
or
“Tea
cher
s ha
ve ti
me
avai
labl
e to
col
labo
rate
w
ith th
eir c
olle
ague
s.”
GO
AL:
Beg
inni
ng in
Sep
tem
ber 2
015,
the
dist
rict w
ill im
plem
ent s
trat
egie
s to
allo
w
teac
hers
the
time
they
nee
d to
col
labo
rate
w
ith c
olle
ague
s, (a
s ev
iden
ced
by a
n 85
% ra
te
of a
gree
men
t with
the
stat
emen
t, “T
each
ers
have
tim
e av
aila
ble
to c
olla
bora
te w
ith th
eir
colle
ague
s” o
n th
e TE
LL s
urve
y in
201
6.)
S M
ake
it Sp
ecifi
c: S
tate
exa
ctly
wha
t you
wish
to
acco
mpl
ish.
Who
: The
Dis
tric
t W
hat:
Giv
es ti
me
to c
olla
bora
te w
ith
colle
ague
s H
ow: B
y im
plem
entin
g st
rate
gies
W
hen:
In S
epte
mbe
r 201
6
M
Mak
e it
Mea
sura
ble:
How
will
you
kno
w th
e go
al is
ac
hiev
ed?
85%
of t
each
ers
agre
e w
ith th
e TE
LL it
em
A
Mak
e it
Ach
ieva
ble:
Is th
is an
issu
e yo
u ha
ve co
ntro
l ov
er?
Is th
e de
cisio
n-m
aker
at t
he sc
hool
? D
istric
t of
fice?
Sta
te?
The
dist
rict h
as th
e ca
paci
ty to
cre
ate
a st
ruct
ure
to m
eet t
his
cond
ition
.
R M
ake
it Re
leva
nt a
nd R
esul
ts-O
rient
ed:
WH
Y ar
e yo
u do
ing
this
and
how
will
you
kno
w it
ha
s be
en a
ccom
plis
hed?
Sam
ples
: •
Resu
lts in
real
impr
ovem
ent i
n th
e liv
es o
f edu
cato
rsan
d st
uden
ts•
Allo
ws
educ
ator
s to
feel
em
pow
ered
•A
llow
s fo
r col
labo
rativ
e re
latio
nshi
ps to
be
stre
ngth
ened
•Ex
cite
s pe
ople
•Bu
ilds
educ
ator
s as
lead
ers
in th
e pr
ofes
sion
and
/or
thei
r loc
al a
ssoc
iatio
n
T M
ake
it Ti
mel
y M
easu
rem
ent w
ill h
appe
n w
ith th
e Sp
ring
2016
TEL
L su
rvey
SMAR
T Go
als: E
XAM
PLE
APP
END
IX C

19
APP
END
IX D
Resu
lt in
dica
tors
Stra
tegi
es u
nder
co
nsid
erat
ion:
Resu
lts in
real
im
prov
emen
t in
the
lives
of
educ
ator
s an
d st
uden
ts
Allo
ws
part
icip
ants
to
feel
em
pow
ered
Allo
ws
for
colla
bora
tive
rela
tions
hips
to
be s
tren
gthe
ned
Exci
tes
peop
le
Build
s ed
ucat
ors
as
lead
ers
in th
e pr
ofes
sion
an
d/or
thei
r lo
cal
asso
ciat
ion
Top
Stra
tegi
es
Teac
hers
and
A
dmin
istr
atio
n w
ill
dete
rmin
e co
nten
t for
ea
ch m
eetin
g
Yes
Yes
Yes
Yes
Yes
X
Teac
hers
will
be
rele
ased
fr
om c
lass
to a
tten
d co
llabo
ratio
n tim
e.
Teac
hers
who
hav
e pr
ep
will
sub
for t
hem
and
be
com
pens
ated
.
No
No
Yes
No
No
Switc
h to
a b
lock
sc
hedu
le t
o of
fer
colla
bora
tion
time.
Ye
s N
o Ye
s N
o N
o
Teac
hers
will
cho
ose
thei
r ow
n m
eetin
g tim
e an
d se
t th
eir m
eetin
g ag
enda
. M
eetin
g su
mm
arie
s w
ill
be g
iven
to a
dmin
istr
atio
n.
Yes
Yes
Yes
Yes
Yes
X
No
stud
ents
allo
wed
in
the
build
ing
befo
re a
nd
afte
r sch
ool.
N
o N
o Ye
s Ye
s N
o
Early
rele
ase
sche
dule
im
plem
ente
d w
ith th
at
time
dedi
cate
d to
co
llabo
ratio
n.
Yes
No
Yes
Yes
Yes
Stra
tegy
/Res
ults
: EXA
MPL
E

GO
AL
Top
Stra
tegi
es
Act
ions
W
ho a
nd
Whe
n Re
sour
ces
Nee
ded
Resu
lts
Indi
cato
rs
Beginn
ing in
Septem
ber 2016,
the distric
t will
implem
ent
strategies to
allo
w
teache
rs th
e tim
e they nee
d to
collabo
rate with
colleague
s (as
eviden
ced by
an
85% agree
men
t rate on TELL
questio
n 2.1b
).
Teachers will cho
ose
their o
wn meetin
g tim
e and self-‐direct
their m
eetin
gs.
Meetin
g summaries
will be given to
administratio
n.
Determ
ine meetin
g space
and tim
e.
Inpu
t from entire
grou
p. Facilitator
reserves sp
ace by
Sept. 15.
Space suita
ble
for g
roup
meetin
gs.
Educators m
eet
consistently fo
r 2
mon
ths in a row.
Educators a
nd
administrators w
ill
understand
clear meetin
g structure and processes.
District w
ill offe
r training at Sept 1
5 staff m
eetin
g.
Training/trainer
for staff on
collabo
rative
meetin
g process
and
expectations.
Teachers feel
ownership of th
e process a
nd
accomplish the bu
lk
of th
e agenda.
Team
roles a
ssigned:
Facilitator and
recorder
Group
self-‐selects a
s soon
as g
roup
is
assigned. Edu
cators
in th
ese roles take
the training by Sept
30.
Facilitator and
recorder
trainings d
istrict-‐
wide.
Facilitators a
nd
recorders feel
confident in their
roles a
nd perform
them
con
sistently.
Teachers and
administratio
n will
collabo
rate on meetin
g content.
Weekly educator
facilitator/adm
in meetin
g to se
t agend
a based on
educator needs.
Facilitator and
Ad
ministrator
Meetin
g tim
es
calend
ared.
Log of collabo
rative
agendas
Collect edu
cator inp
ut
Staff
Email or
hardcopy inpu
t venu
e Staff p
articipation
Orga
nizin
g Pl
an: E
XAM
PLE
20
APP
END
IX E

GO
AL
Top
Stra
tegi
es
Act
ions
W
ho a
nd
Whe
n Re
sour
ces
Nee
ded
Resu
lts
Indi
cato
rs
Orga
nizin
g Pl
an
21
APP
END
IX E
QUESTIONS ABOUT THIS PUBLICATION?
OEA Center for Great Public SchoolsOregon Education Association6900 SW Atlanta St.Portland, OR 97223
?