2016 annual report farm strong - wheat · pdf file2016 annual report. ... • wheat...
TRANSCRIPT

FARM
STRO
NG2 0 1 6 A N N U A L R E P O R T
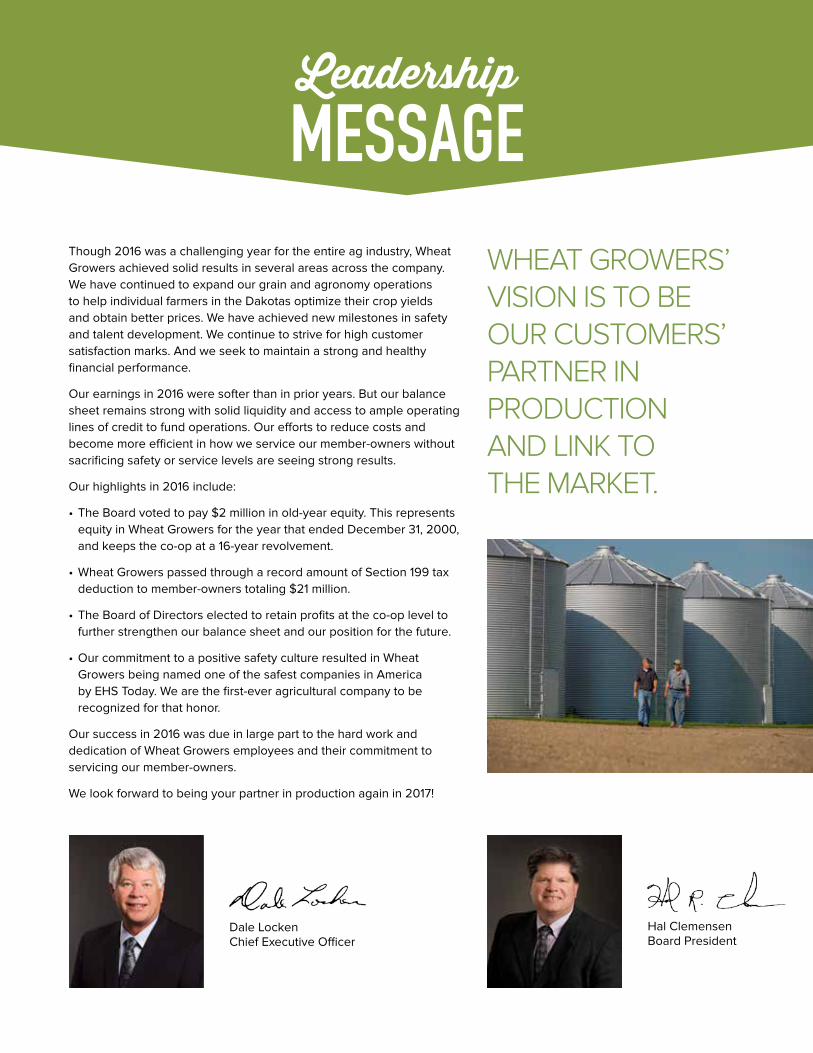
Though 2016 was a challenging year for the entire ag industry, Wheat Growers achieved solid results in several areas across the company. We have continued to expand our grain and agronomy operations to help individual farmers in the Dakotas optimize their crop yields and obtain better prices. We have achieved new milestones in safety and talent development. We continue to strive for high customer satisfaction marks. And we seek to maintain a strong and healthy financial performance.
Our earnings in 2016 were softer than in prior years. But our balance sheet remains strong with solid liquidity and access to ample operating lines of credit to fund operations. Our efforts to reduce costs and become more efficient in how we service our member-owners without sacrificing safety or service levels are seeing strong results.
Our highlights in 2016 include:
• The Board voted to pay $2 million in old-year equity. This represents equity in Wheat Growers for the year that ended December 31, 2000, and keeps the co-op at a 16-year revolvement.
• Wheat Growers passed through a record amount of Section 199 tax deduction to member-owners totaling $21 million.
• The Board of Directors elected to retain profits at the co-op level to further strengthen our balance sheet and our position for the future.
• Our commitment to a positive safety culture resulted in Wheat Growers being named one of the safest companies in America by EHS Today. We are the first-ever agricultural company to be recognized for that honor.
Our success in 2016 was due in large part to the hard work and dedication of Wheat Growers employees and their commitment to servicing our member-owners.
We look forward to being your partner in production again in 2017!
Dale LockenChief Executive Officer
Hal ClemensenBoard President
WHEAT GROWERS’ VISION IS TO BE OUR CUSTOMERS’ PARTNER IN PRODUCTION AND LINK TO THE MARKET.
LeadershipMESSAGE

During 2016, Wheat Growers was proud to receive recognition and achieve milestones. Our superior performance is the result of focusing on meeting the needs of our member-owners with professionalism and excellence.
• Roscoe received the 2016 South Dakota State Dupont Environmental Respect Award.
• Curtis Fick, Carpenter applicator, made the top four national finalists for AGCO Operator of the Year award.
Roscoe, SD
• Wheat Growers was named one of America’s Safest Companies in 2016 by EHS Today—the first in the agricultural industry to be named!
• 31 locations have exceeded 1,000 days with no lost-time accidents.
• Grain Elevator and Processing Society (GEAPS) named 28 Wheat Growers locations as world class.
• Board member Wally Knock Family named South Dakota FFA Family of the Year for 2016.
• Jeff Lakner, board member, was named South Dakota State University Distinguished Alumnus in 2016.
• Hal Clemensen, board president, named Director of the Year by the National Council of Farmers Cooperatives in February 2016.
FINISHING STRONG
SAFETY LOCATIONS
BOARD MEMBERS

2016 ACHIEVEMENTS
• Brent Wiesenburger, precision ag manager, was named one of the Top Ten People in Precision Ag for 2016 by PrecisionAg magazine
• Wheat Growers received the Aberdeen Area Chamber of Commerce ABBY Community Involvement Award for 2015
• Judy Stulken, senior vice president, human resources and organizational development, was named One of Top 25 Women in Business by Prairie Business magazine
2016 MILESTONES
• The Kennebec Agronomy Grand Opening was held in February of 2016
• The Kennebec Grain facility Grand Opening was held in June of 2016
• The Bath Innovation Center Grand Opening was held in December of 2015
• Garden City Cooperative in Kansas and Asmus Farm Supply in Iowa are now MZB Retailers
• Wheat Growers’ award-winning internship program had a record year, with 47 interns
2016 CONSTRUCTION PROJECTS
• Kennebec Dry Shed: Operational September 2015
• Kennebec Agronomy Service Center: Operational September 2015
• Bath Innovation Center: Operational November 2015
• Tulare UAN System: Operational Spring 2016
• Andover and Roscoe Screeners: Operational June 2016
• Kennebec Grain Terminal: Operational Fall 2016
2016
YEAR
IN R
EVIEW
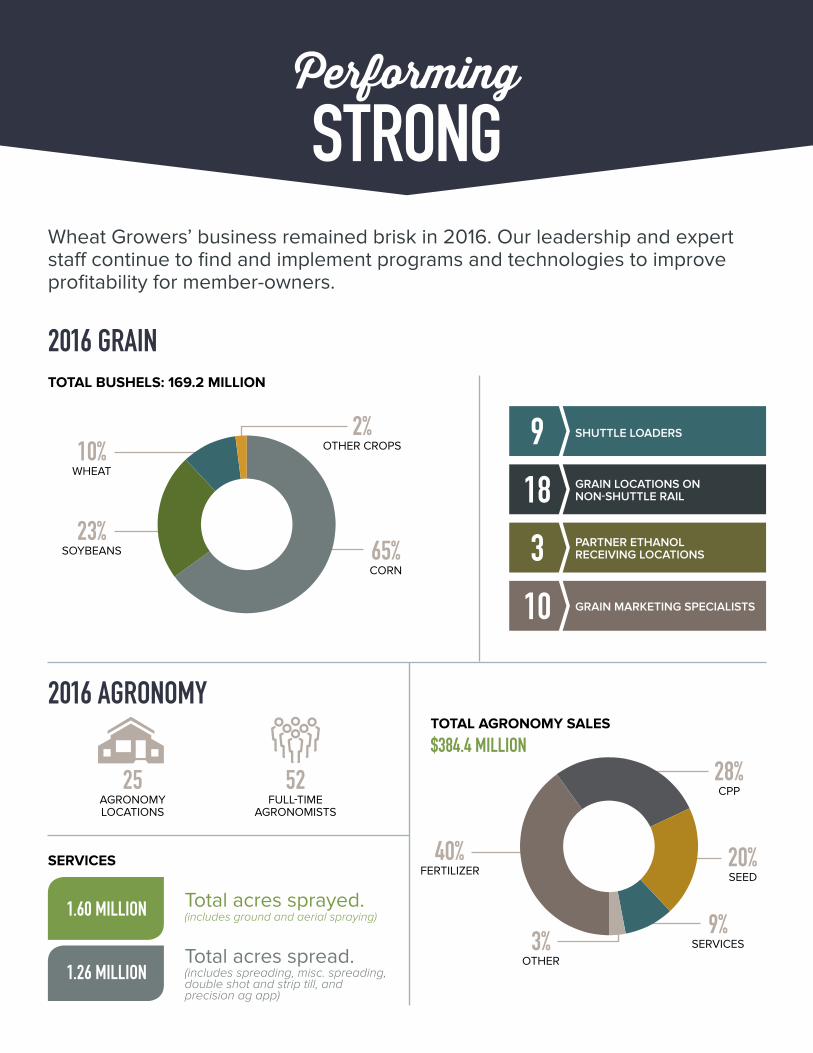
Wheat Growers’ business remained brisk in 2016. Our leadership and expert staff continue to find and implement programs and technologies to improve profitability for member-owners.
2016 GRAIN
2016 AGRONOMY
TOTAL BUSHELS: 169.2 MILLION
Total acres sprayed. (includes ground and aerial spraying)
Total acres spread. (includes spreading, misc. spreading, double shot and strip till, and precision ag app)
PerformingSTRONG
SERVICES
AGRONOMY LOCATIONS
FULL-TIME AGRONOMISTS
25 52
1.60 MILLION
1.26 MILLION
SHUTTLE LOADERS9GRAIN LOCATIONS ON NON-SHUTTLE RAIL18PARTNER ETHANOL RECEIVING LOCATIONS3GRAIN MARKETING SPECIALISTS 10
$384.4 MILLIONTOTAL AGRONOMY SALES
FERTILIZER
OTHER
CPP
SEED
SERVICES
40%
3%
28%
20%
9%
40+28+20+9+3+zOTHER CROPS
CORN
SOYBEANS
WHEAT
2%
65%23%
10%
65+23+10+2+z

2016
SAFE
TYGOVERNOR’S SAFETY AWARD FOR
THE CALENDAR YEAR 2015:
31 LOCATIONSHAVE EXCEEDED 1,000 DAYS WITH
NO LOST-TIME ACCIDENTS.
NUMBER OF SAFETY TRAINING HOURS: NUMBER OF SAFETY OBSERVATIONS:
14,737 HOURS 3,481 SAFETY OBSERVATIONS
• ADMINISTRATIVE OFFICES
• CARPENTER
• CHAMBERLAIN
• MILLER
• STICKNEY
• TULARE
• WILLOW LAKE
• WOONSOCKET

2016 COMMUNITY
MEMBER-OWNERS5,100EQUITY HOLDERS15,000EMPLOYEES684AGRONOMY LOCATIONS25GRAIN LOCATIONS25
Wheat Growers is governed by a board of 15 active producers elected to represent five districts and backed by 45 delegates who serve as the liaison with the general membership.
Alpena, SD

2016 Financials
FIVE-YEAR FINANCIAL HIGHLIGHTS IN MILLIONS OF DOLLARS
Cash patronage and Loyalty Rewards to member-owners over the last five years.
$42.6M
Amount of property taxes paid to local county treasurers over the last five years.
$7.8M
Domestic production activities tax deduction passed through to our grain patrons over the last five years.
$74.2M
Capital investments in facilities and equipment over the last five years.$220.5M
TOTAL ASSETS TOTAL MEMBERS’ EQUITY SALES WORKING
CAPITALLOCAL
SAVINGSSAVINGS
BEFORE TAXES
2012 $635 $185 $1,667 $107 $9.0 $17.6
2013 $658 $203 $1,848 $104 $14.3 $27.5
2014 $658 $218 $1,499 $124 $15.5 $24.1
2015 $658 $247 $1,284 $109 $28.2 $41.7
2016 $682 $248 $1,189 $83 $0.5 $6.1

SOUTH DAKOTA WHEAT GROWERS ASSOCIATION Aberdeen, South Dakota
Table of Contents Page PERSONNEL AND ORGANIZATIONAL DATA ............................................................. 1 INDEPENDENT AUDITOR’S REPORT ........................................................................ 2-3 CONSOLIDATED FINANCIAL STATEMENTS Balance Sheets .............................................................................................................. 4-5 Statements of Savings ...................................................................................................... 6 Statements of Comprehensive Income .............................................................................. 7 Statements of Members' Equity ........................................................................................ 8 Statements of Cash Flows............................................................................................ 9-10 Notes to Financial Statements ................................................................................... 11-33

1
SOUTH DAKOTA WHEAT GROWERS ASSOCIATION Aberdeen, South Dakota
PERSONNEL AND ORGANIZATIONAL DATA
July 31, 2016
OFFICERS AND DIRECTORS
Name Address District Term Expires Position Hal Clemensen ......... Conde, SD ......................... District 2 ............ 2018 ...................... President Glen Crawford ......... Aberdeen, SD..................... District 1 ............ 2017 ........ 1st Vice-President Matt Johnson ........... Webster, SD ....................... District 2 ............ 2019 ........ 2nd Vice-President Wallace Knock ........ Willow Lake, SD ............... District 2 ............ 2017 ...................... Secretary Jeff Lakner............... Wessington, SD ................. District 3 ............ 2017 ........................ Director Tom Morog .............. St. Lawrence, SD ............... District 4 ............ 2017 ........................ Director Ken Rau ................... Mobridge, SD .................... District 5 ............ 2017 ........................ Director Joel Erickson ........... Langford, SD ..................... District 1 ............ 2018 ........................ Director David Salmen .......... Wessington Springs, SD .... District 3 ............ 2018 ........................ Director Chris Eymer ............. Reliance, SD ...................... District 4 ............ 2018 ........................ Director Dan Malsam ............. Roscoe, SD ........................ District 5 ............ 2018 ........................ Director Lance Hanson .......... Groton, SD ......................... District 1 ............ 2019 ........................ Director Mark Bushfield ........ Hitchcock, SD .................... District 3 ............ 2019 ........................ Director Dale Swanson .......... Pukwana, SD ..................... District 4 ............ 2019 ........................ Director Steve Pfeifer ............ McLaughlin, SD ................ District 5 ............ 2019 ........................ Director
LEADERSHIP TEAM Name Position Dale Locken ............................................................................................ Chief Executive Officer Blake Bomesberger .................................................................................. Chief Financial Officer Roger Krueger ................................................................................. Senior Vice-President, Grain Judy Stulken ............... Senior Vice-President, Human Resources & Organizational Development Steve Briggs............................................................. Senior Vice-President, Corporate Marketing Chris Pearson .......................................................................................... Chief Operating Officer
ORGANIZATIONAL DATA
Articles of Incorporation ...................................................................... Amended March 19, 2015 Under the Code of ............................................................................... South Dakota, as Amended Federal Identification Number ................................................................................... 46-0191930

10555 New York Ave., Suite 200 • Des Moines, IA 50322-3793 • Phone: (515) 270-1446 • Fax: (515) 270-1811 • www.gardinercpa.com
Independent Auditor’s Report To the Board of Directors South Dakota Wheat Growers Association Aberdeen, South Dakota We have audited the accompanying consolidated financial statements of South Dakota Wheat Growers Association, Aberdeen, South Dakota, which comprise the consolidated balance sheets as of July 31, 2016 and 2015, and the related consolidated statements of savings, comprehensive income, members’ equity and cash flows for the years then ended, and the related notes to the consolidated financial statements. Management’s Responsibility for the Financial Statements
Management is responsible for the preparation and fair presentation of these consolidated financial statements in accordance with accounting principles generally accepted in the United States of America; this includes the design, implementation, and maintenance of internal control relevant to the preparation and fair presentation of consolidated financial statements that are free from material misstatement, whether due to fraud or error. Auditor’s Responsibility
Our responsibility is to express an opinion on these consolidated financial statements based on our audits. We conducted our audits in accordance with auditing standards generally accepted in the United States of America. Those standards require that we plan and perform the audit to obtain reasonable assurance about whether the consolidated financial statements are free from material misstatement. An audit involves performing procedures to obtain audit evidence about the amounts and disclosures in the consolidated financial statements. The procedures selected depend on the auditor’s judgment, including assessment of the risks of material misstatement of the consolidated financial statements, whether due to fraud or error. In making those risk assessments, the auditor considers internal control relevant to the entity’s preparation and fair presentation of the consolidated financial statements in order to design audit procedures that are appropriate in the circumstances, but not for the purpose of expressing an opinion on the effectiveness of the entity’s internal control. Accordingly, we express no such opinion. An audit also includes evaluating the appropriateness of accounting policies used and the reasonableness of significant accounting estimates made by management, as well as evaluating the overall presentation of the consolidated financial statements.

3
We believe that the audit evidence we have obtained is sufficient and appropriate to provide a basis for our audit opinion. Opinion
In our opinion, the consolidated financial statements referred to above present fairly, in all material respects, the financial position of South Dakota Wheat Growers Association, Aberdeen, South Dakota, as of July 31, 2016 and 2015, and the results of their operations and their cash flows for the years then ended in accordance with accounting principles generally accepted in the United States of America. Other Matter
We also have audited, in accordance with auditing standards generally accepted in the United States of America, the consolidated balance sheets of South Dakota Wheat Growers Association and all of its subsidiaries as of July 31, 2016 and 2015, and the related consolidated statements of savings, comprehensive income, members’ equity and cash flows for the years then ended (none of which is presented herein), and we expressed an unmodified opinion on those consolidated financial statements. Such consolidated financial statements are the general-purpose financial statements of South Dakota Wheat Growers Association and its subsidiaries, and the financial statements of parent company presented herein are not a valid substitute for those consolidated financial statements.
November 22, 2016

The accompanying notes are an integral part of the consolidated financial statements.
4
SOUTH DAKOTA WHEAT GROWERS ASSOCIATION Aberdeen, South Dakota
CONSOLIDATED BALANCE SHEETS
July 31, 2016 and 2015
ASSETS
2016 2015 CURRENT ASSETS Cash $ 299,690 $ 76,901,502 Marketable Securities 1,762,112 1,360,832 Receivables Notes and Contracts 14,995,873 15,702,632 Trade – Net of Allowance for Doubtful Accounts of $2,000,000 (2016 and 2015) 18,955,985 22,606,679 Grain in Transit 19,009,584 15,006,025 Unadvanced Loan Commitment 82,000,000 41,000,000 Other 24,339,389 22,513,884 Margin Account 11,424,660 11,485,365 Inventories Grain 103,891,974 79,925,291 Merchandise 45,714,123 49,063,290 Prepayments on Inventory 3,426,884 13,983,615 Prepaid Expenses 1,752,583 3,366,914 Deferred Income Taxes 2,033,990 1,867,654 Total Current Assets 329,606,847 354,783,683 PROPERTY, PLANT AND EQUIPMENT Land 18,621,796 17,320,809 Buildings and Equipment 481,618,643 417,256,647 500,240,439 434,577,456 Accumulated Depreciation (241,492,748) (217,318,510) Undepreciated Cost 258,747,691 217,258,946 Construction and Purchases in Process 32,529,559 22,380,338 Total Property, Plant and Equipment 291,277,250 239,639,284 OTHER ASSETS Notes and Contracts 1,753,386 1,297,827 Organizational and Finance Costs 385,514 535,208 Other Developmental Costs 1,268,774 205,000 Goodwill/Intangibles 4,604,938 4,417,013 Total Other Assets 8,012,612 6,455,048 INVESTMENTS Equity in Other Cooperatives 29,681,241 28,489,223 Investment in Other Companies 22,927,162 28,425,267 Total Investments 52,608,403 56,914,490 TOTAL ASSETS $ 681,505,112 $ 657,792,505

The accompanying notes are an integral part of the consolidated financial statements.
5
SOUTH DAKOTA WHEAT GROWERS ASSOCIATION Aberdeen, South Dakota
CONSOLIDATED BALANCE SHEETS
July 31, 2016 and 2015
LIABILITIES AND MEMBERS' EQUITY
2016 2015 CURRENT LIABILITIES Checks in Excess of Bank Balance $ 10,670,826 $ 0 Current Maturities of Long-Term Debt Notes Payable – Term 12,951,706 8,468,765 Capital Leases 904,998 862,451 Notes Payable – Seasonal 6,000,000 0 Payables Trade 9,590,700 18,745,377 Unpaid Grain 172,146,675 172,866,641 Patron Credit Balances 9,608,113 9,798,245 Other 11,016,644 11,849,173 Accrued Expenses Property Taxes 1,711,823 1,490,088 Interest 8,231,344 7,457,771 Accrued Compensated Absences 2,173,664 2,285,071 Other 1,595,789 5,165,371 Patronage Dividends Payable 0 6,400,000 Total Current Liabilities 246,602,282 245,388,953 LONG–TERM LIABILTIES Notes Payable – Term 136,712,958 105,211,373 Capital Leases 1,646,102 2,551,100 Unpaid Grain 29,638,526 38,565,377 Deferred Compensation 1,885,491 2,232,363 Total Long–Term Liabilities 169,883,077 148,560,213 DEFERRED INCOME TAXES 16,521,529 16,773,265 MEMBERS' EQUITY Patrons’ Reserve 71,438,928 77,062,091 Retired Patrons’ Reserve 3,622,573 3,262,513 Reserve Capital 173,436,723 166,745,470 Total Members' Equity 248,498,224 247,070,074 TOTAL LIABILITIES AND MEMBERS’ EQUITY $681,505,112 $657,792,505

The accompanying notes are an integral part of the consolidated financial statements.
6
SOUTH DAKOTA WHEAT GROWERS ASSOCIATION Aberdeen, South Dakota
CONSOLIDATED STATEMENTS OF SAVINGS
Years Ended July 31, 2016 and 2015
2016 2015 Sales and Service Income $1,189,027,738 $1,283,921,054 Cost of Goods Sold 1,070,152,051 1,132,600,455 Gross Savings on Sales and Service Income 118,875,687 151,320,599 Other Revenue 20,185,342 24,057,486 Total Gross Revenue 139,061,029 175,378,085 Operating Expenses, Including Interest 138,555,606 147,203,743 Operating Savings – Local 505,423 28,174,342 Gain on Sale of Investments 2,000 356,505 Income from Investments 1,448,775 5,551,410 Patronage Dividend Income 4,099,527 7,622,122 Savings Before Taxes 6,055,725 41,704,379 Income Taxes Current (185,507) 4,084,484 Deferred (418,072) (2,572,508) Net Savings $ 6,659,304 $ 40,192,403
DISTRIBUTION OF NET SAVINGS
Patronage Dividend Provision Cash – 40% $ 0 $ 6,400,000 Deferred – 60% 0 9,600,000 Non–Qualified 0 10,000,000 0 26,000,000 Capital Reserve 6,659,304 14,192,403 $ 6,659,304 $ 40,192,403

The accompanying notes are an integral part of the consolidated financial statements.
7
SOUTH DAKOTA WHEAT GROWERS ASSOCIATION Aberdeen, South Dakota
CONSOLIDATED STATEMENTS OF COMPREHENSIVE INCOME
Years Ended July 31, 2016 and 2015 2016 2015 Net Savings $6,659,304 $40,192,403 Other Comprehensive Income (Loss), Net of Tax Reclassification Adjustment of Marketable Securities 0 (217,293) Total Comprehensive Income $6,659,304 $39,975,110

The accompanying notes are an integral part of the consolidated financial statements.
8
SOUTH DAKOTA WHEAT GROWERS ASSOCIATION Aberdeen, South Dakota
CONSOLIDATED STATEMENTS OF MEMBERS' EQUITY
Years Ended July 31, 2016 and 2015
Accumulated Retired Other Patrons’ Reserve Patrons’ Comprehensive Reserve Total Qualified Non-Qualified Reserve Income Capital Balance – July 31, 2014 $218,220,241 $43,671,768 $17,528,856 $ 4,272,035 $ 217,293 $152,530,289 Net Savings 40,192,403 0 0 0 0 40,192,403 Other Comprehensive Income (217,293) 0 0 0 (217,293) 0 Redemptions and Revolvements (4,736,245) (3,698,385) (28,338) (1,009,522) 0 0 Equity Transfers and Corrections 943 0 0 0 0 943 Equity Adjustments (4,200) 0 0 0 0 (4,200) Over Accrual of Prior Year Patronage Dividends 14,225 0 (11,810) 0 0 26,035 Patronage Dividend Provision Qualified Current (6,400,000) 0 0 0 0 (6,400,000) Deferred 0 9,600,000 0 0 0 (9,600,000) Non–Qualified 0 0 10,000,000 0 0 (10,000,000) Balance – July 31, 2015 247,070,074 49,573,383 27,488,708 3,262,513 0 166,745,470 Net Savings 6,659,304 0 0 0 0 6,659,304 Redemptions and Revolvements (5,151,012) (5,069,864) (69,338) (11,810) 0 0 Equity Transfers and Corrections (85,428) (464,028) 0 371,870 0 6,730 Income Tax Adjustments (11,816) 0 0 0 0 (11,816) Over Accrual of Prior Year Patronage Dividends 17,102 (7,928) (12,005) 0 0 37,035 Balance – July 31, 2016 $248,498,224 $44,031,563 $27,407,365 $ 3,622,573 $ 0 $173,436,723

The accompanying notes are an integral part of the consolidated financial statements.
9
SOUTH DAKOTA WHEAT GROWERS ASSOCIATION Aberdeen, South Dakota
CONSOLIDATED STATEMENTS OF CASH FLOWS
Years Ended July 31, 2016 and 2015
2016 2015 CASH FLOWS FROM OPERATING ACTIVITIES Net Savings $ 6,659,304 $ 40,192,403 Adjustments to Reconcile Net Savings to Net Cash Provided by (Used in) Operating Activities Depreciation and Amortization 29,343,549 29,529,041 Bad Debt (Income) Expense (46,056) 1,190,210 Gain on Sale of Property, Plant and Equipment (170,134) (1,810,233) Patronage Dividend Income Received as Equity (2,468,733) (3,680,114) Gain on Sale of Investments (2,000) (356,505) Income from Investments (1,448,775) (5,551,410) Deferred Compensation Plan (346,872) 968,139 Deferred Income Taxes (418,072) (2,572,508) Change in Assets and Liabilities Increase in Receivables (43,132,314) (2,607,843) (Increase) Decrease in Margin Account 60,705 (2,430,399) Increase in Inventories (20,617,516) (26,117,206) (Increase) Decrease in Prepayments on Inventories 10,556,731 (8,095,619) Decrease in Prepaid Expenses 1,614,331 4,282,802 Decrease in Payables (10,897,304) (24,546,215) Increase (Decrease) in Accrued Expenses (2,685,681) 3,573,621 Net Cash Provided by (Used in) Operating Activities (33,998,837) 1,968,164 CASH FLOWS FROM INVESTING ACTIVITIES Proceeds from Sale of Property, Plant and Equipment 585,133 3,425,197 Additions to Property, Plant and Equipment (80,889,463) (55,074,470) Proceeds from Sale of Investments 0 378,519 Increase in Notes and Contracts (1,357,856) (501,217) Equity in Other Organizations Redeemed 877,435 1,648,984 Capital Distributions from Investments 7,066,882 237,710 Capital Contributions to Investments (120,002) (1,291,106) Net Cash Used in Investing Activities (73,837,871) (51,176,383) CASH FLOWS FROM FINANCING ACTIVITIES Increase in Checks in Excess of Bank Balance 10,670,826 0 Net Borrowings Under Line-of-Credit Agreements 6,000,000 0 Increase (Decrease) in Long–Term Grain Contracts (8,926,851) 622,638 Additional Long–Term Borrowings 57,000,000 0 Retirement of Long–Term Debt (21,877,925) (11,272,756) Redemption of Members’ Equity (5,151,012) (4,736,245) Equity Adjustments (97,244) (3,257) Allocated Patronage Dividends Paid in Cash (6,382,898) (1,825,775) Net Cash Provided by (Used in) Financing Activities 31,234,896 (17,215,395)

The accompanying notes are an integral part of the consolidated financial statements.
10
CONSOLIDATED STATEMENTS OF CASH FLOWS (CONTINUED)
2016 2015 Net Decrease in Cash $(76,601,812) $(66,423,614) Cash – Beginning of Year 76,901,502 143,325,116 Cash – End of Year $ 299,690 $ 76,901,502
SUPPLEMENTAL DISCLOSURES OF CASH FLOW INFORMATION
Cash Paid During the Year for: Interest $ 6,831,435 $ 8,737,109 Income Taxes 169,352 4,964,484
SUPPLEMENTAL SCHEDULE OF NON–CASH FINANCING ACTIVITIES
Allocated Patronage Dividends $ 0 $ 26,000,000

11
Notes to Consolidated Financial Statements Note 1: Organization and Nature of Business The Association is a South Dakota corporation operating as a cooperative for the mutual
benefit of its members. The Association operates a licensed public grain warehouse; provides grain marketing services; and supplies feed, fertilizer, chemicals and other types of merchandise for its members, primarily, in and around Dickey, Stutsman and LaMoure Counties in North Dakota and Aurora, Beadle, Brown, Brule, Clark, Corson, Day, Edmunds, Faulk, Hand, Hyde, Jerauld, Lyman, Marshall, Sanborn and Spink Counties in South Dakota.
Approximately 44% of the Association’s total gross revenue was generated by grain marketing and related services, 53% was generated by agronomy sales and related services, and the remaining 3% was from retail sales and services.
Note 2: Summary of Significant Accounting Policies The significant accounting practices and policies are summarized below. PRINCIPLES OF CONSOLIDATION AND BASIS OF PRESENTATION
The consolidated financial statements includes the accounts of South Dakota Wheat Growers Association and its’ wholly owned subsidiaries South Central North Dakota, LLC and MZB Technologies, LLC, but does not include the subsidiary, James Valley Grain, LLC. In consolidation all significant intercompany accounts and transactions have been eliminated from the financial statements.
USE OF ESTIMATES
The preparation of financial statements in conformity with generally accepted accounting principles requires management to make estimates and assumptions that affect the reported amounts of assets and liabilities and the disclosure of contingent assets and liabilities at the date of the financial statements and reported amounts of revenues and expenses during the reporting period. Actual results could differ from those estimates.
COMPREHENSIVE INCOME REPORTING
The Association accounts for comprehensive income in accordance with the Comprehensive Income Topic of the Financial Accounting Standards Board (FASB) Accounting Standards Codification (ASC), which requires comprehensive income and its components to be reported when a company has items of other comprehensive income. Comprehensive income includes net income plus other comprehensive income (i.e., certain revenues, expenses, gains and losses reported as separate components of members’ equity rather than in net income).

12
Notes to Consolidated Financial Statements (Continued) Note 2: Summary of Significant Accounting Policies (Continued)
MARKETABLE SECURITIES
Marketable securities include equity securities classified as available–for–sale. Marketable securities considered available–for–sale are recorded in the financial statements at fair value, in accordance with the Investments – Debt and Equity Securities Topic of the FASB ASC. Realized gains and losses on available-for-sale securities are included in current earnings and, when applicable, are reported as a reclassification adjustment in other comprehensive income. Realized gains and losses on sale of securities are based on the average cost of the securities sold.
DERIVATIVE FINANCIAL INSTRUMENTS
The Association has only limited involvement with derivative financial instruments and does not use them for trading purposes. They are used to manage well–defined commodity price risks. The Association may use futures, forward, option and swap contracts to reduce the volatility of grain. These contracts permit final settlement by delivery of the specified commodity. These contracts are not designated as hedges as defined by the Derivative and Hedging Topic of the FASB ASC. These contracts are marked to market each month and the unrealized gains or losses are recognized in earnings.
ALLOWANCE FOR DOUBTFUL ACCOUNTS
Bad debts are provided for on the reserve method based on historical experience and management’s evaluation of outstanding receivables at the end of the year.
GRAIN IN TRANSIT
In accordance with industry practice, expected proceeds on grain sales, which are subject to final grade and weight determination at the destination point, are consistently estimated and recorded at the time grain is shipped.
HEDGING
The Association generally follows a policy of hedging its grain transactions to protect gains and minimize losses due to market fluctuations. Gains and losses from these hedge transactions are reflected in the sales of the respective commodity.
INVENTORY VALUATIONS
Grain inventories are valued on the basis of current local market prices with appropriate adjustment for freight, test weights, discounts and other differentials.
Merchandise inventories are valued at the lower of cost (first–in, first–out method) or
market price.

13
Notes to Consolidated Financial Statements (Continued) Note 2: Summary of Significant Accounting Policies (Continued) REVENUE RECOGNITION
The Association provides a wide variety of products and services, from production of agricultural inputs such as crop nutrients and other farm supplies, to grain marketing, storage and drying services, agronomy spreading and spraying, transportation, and other agricultural related services. Sales are recorded upon transfer of title, which could occur at the time commodities are shipped or upon receipt by the customer, depending on the terms of the transaction. Service revenues are recorded once such services have been rendered.
FAIR VALUE OF FINANCIAL INSTRUMENTS
The Fair Value Measurements and Disclosures Topic of the FASB ASC defines fair value as the price that would be received to sell an asset or paid to transfer a liability between market participants in the principal market or in the most advantageous market when no principal market exists. Market participants are assumed to be independent, knowledgeable, able and willing to transact an exchange and not under duress. Nonperformance or credit risk is considered when determining the fair value of liabilities. Considerable judgment may be required in interpreting market data used to develop the estimates of fair value. Accordingly, estimates of fair value presented herein are not necessarily indicative of the amounts that could be realized in a current or future market exchange.
LONG–LIVED ASSETS
Long–lived assets to be held and used are reviewed for impairment whenever events or changes in circumstances indicate that the related carrying amount may not be recoverable. When required, impairment losses on assets to be held or used are recognized based on the fair value of the asset and long–lived assets to be disposed of are reported at the lower of their carrying amount or their fair value less selling costs. There were no impairment losses recorded during the years ended July 31, 2016 and 2015.
GOODWILL AND OTHER INTANGIBLE ASSETS
Goodwill represents the excess of purchase price over the fair value of net assets acquired. Goodwill is not amortized, rather it is evaluated for impairment annually or whenever events or changes in circumstances indicate that the value of the asset may be impaired. Goodwill is evaluated for impairment by determining the fair value on a discounted cash flow method or relative market-based approach.
PROPERTY, PLANT AND EQUIPMENT
Land, buildings and equipment are stated at cost. Depreciation methods and estimated useful lives of assets are discussed in Note 6.

14
Notes to Consolidated Financial Statements (Continued) Note 2: Summary of Significant Accounting Policies (Continued) PROPERTY, PLANT AND EQUIPMENT (CONTINUED)
Maintenance and repairs are expensed as incurred. Expenditures for new facilities and those which increase the useful lives of the buildings and equipment are capitalized. When assets are sold or otherwise disposed of, the related cost and accumulated depreciation are removed from the accounts and gains or losses on the dispositions are recognized in earnings.
SALES TAX
Various entities impose a sales tax on specific categories of the Association’s sales. The Association collects the sales tax from patrons and remits the entire amount to the respective taxing authorities. The Association excludes the tax collected and remitted from sales and the cost of sales, respectively.
ADVERTISING
The Association expenses advertising costs as they are incurred, which amounted to $1,117,567 and $1,918,699 for the years ended July 31, 2016 and 2015, respectively.
PATRONAGE DIVIDEND INCOME
Patronage dividend income from other cooperatives is recognized as income in the year the Association receives formal notification from the distributing cooperative.
INCOME TAXES
The Association, as a non-exempt cooperative, is taxed on non-patronage earnings and any patronage earnings not paid or allocated to patrons.
The Association evaluates uncertain tax benefits arising from tax positions taken or
expected to be taken based upon the likelihood of being sustained upon examination by applicable tax authorities. If the Association determines that a tax position is more likely than not of being sustained, it recognizes the largest amount of the arising benefit that is greater than 50% likely of being realized upon settlement in the financial statements. Any tax positions taken or expected to be taken that do not pass the more likely than not test, the Association establishes reserves offsetting the benefits related to such positions. Interest and penalties, if any, are included in the current period provision for income taxes in the Association’s statement of savings and are included as a current liability in the balance sheet.

15
Notes to Consolidated Financial Statements (Continued) Note 2: Summary of Significant Accounting Policies (Continued) DEFERRED INCOME TAXES
Deferred income taxes reflect the net tax effects of temporary differences between the carrying amounts of assets and liabilities for financial reporting purposes and the amounts used for income tax purposes. The principal temporary differences are due to the use of different financial reporting and income tax methods for depreciation, bad debts, inventory capitalization, grain quality and compensated absences. Deferred tax assets and liabilities may be reduced by a valuation allowance when, in the opinion of management, it is more likely than not that some portion of the deferred tax assets or liabilities will not be realized.
DISTRIBUTION OF NET SAVINGS
In accordance with the Association’s articles and bylaws, the Association may allocate net savings, after provisions for reasonable and adequate reserves, to patrons on a patronage basis, based on taxable income. Such allocations are at the discretion of the Association’s Board of Directors and may be made in the form of cash and allocated equities in such proportion as determined by the Board of Directors.
Note 3: Significant Concentrations of Risk CREDIT RISK – FINANCIAL INSTITUTIONS
The Association maintains cash balances with local and national financial institutions, which may at times exceed the coverage of U.S. Federal Deposit Insurance Company (FDIC). The coverage is up to $250,000 for accounts at these financial institutions. At July 31, 2016 and 2015, the Association had $2,710,441 and $92,574,000 on deposit in excess of insured limits, respectively.
CREDIT RISK – RECEIVABLES
The Association issues credit to local patrons in and around various communities located in South and North Dakota, under industry standard terms without collateral in most cases. As these receivables are concentrated in an agricultural area and industry, collection on these receivables may be dependent upon economic returns from farm crop and livestock production.
CREDIT RISK – SUPPLIERS
The Association historically prepays for or makes deposits on undelivered inventories. Concentration of credit risk with respect to inventory advances, are primarily with a few major suppliers of petroleum products and agricultural inputs.

16
Notes to Consolidated Financial Statements (Continued) Note 3: Significant Concentrations of Risk (Continued) OFF–BALANCE SHEET RISK – COMMODITY CONTRACTS
Realized and unrealized gains and losses from future sales and purchase contracts and commitments (grain and farm supply commodities) are included in gross savings. There is a possibility that future changes in market prices may make these contracts and commitments more or less valuable, thereby subjecting them to market risk. Risk arises from changes in the value of these contracts and commitments and the potential inability of counterparties to perform under the terms and the contracts. There are numerous factors which may significantly influence the value of these contracts and commitments including market volatility.
Note 4: Related Party Transactions The Association, organized on a cooperative basis, conducts a substantial portion of their
operations with the members (owners) of the Association and has ownership interest in various regional cooperatives from whom they purchase products for resale.
The Association sells products and provides services to the board of directors and certain
employees. The aggregate of these transactions is not significant to the financial statements.
For the convenience of its customers, the Association provides credit to qualified patrons.
Directors and employees may qualify to use the Association’s credit programs, however, they are subject to the same credit and repayment terms as all other patrons.
The Association sells products and services to, purchases products and services from, has
receivables due from, and payables due to the companies that the Association has investments in. The related party transactions between the companies and the Association are summarized below.
2016 Purchases Receivables Payables Company Sales To From Due From Due To Advanced Bioenergy, LLC $104,486,236 $ 1,650 $ 32,551 $ 0 Dakotaland Feeds, LLC 324,306 25,967 9,934 444 James Valley Grain, LLC 7,600 168,400 42,110 0 $104,818,142 $196,017 $ 84,595 $444
2015 Purchases Receivables Payables Company Sales To From Due From Due To Advanced Bioenergy, LLC $100,673,124 $ 2,578 $108,071 $ 0 Dakotaland Feeds, LLC 196,203 36,117 6,318 391 James Valley Grain, LLC 6,731 7,054 608 0 $100,876,058 $ 45,749 $114,997 $391

17
Notes to Consolidated Financial Statements (Continued) Note 5: Marketable Securities Following are the market value, original cost and unrealized gains and losses on
marketable securities classified as available–for–sale as of July 31, 2016 and 2015:
Number Unrealized Fair 2016 of Shares Cost Gain Value CHS, Inc. Class B Preferred Stock 60,023 $1,762,112 $64,388 $1,826,500
Number Unrealized Fair 2015 of Shares Cost Gain Value CHS, Inc. Class B Preferred Stock 45,943 $1,360,832 $0 $1,360,832
Realized gains on the sale of marketable securities are based on original cost and are
included in earnings. The Association had realized gains on the sale of marketable securities of $356,505 for the year ended July 31, 2015.
During the year ended July 31, 2016, CHS, Inc. converted $401,280 of deferred
patronage into 14,080 shares of Class B Series 1 Preferred Stock. The Association has elected to show these securities at cost. The unrecognized market gain or loss on these securities at July 31, 2016 was not significant to the financial statements.
Note 6: Property, Plant and Equipment Depreciation is computed using the straight–line method over the estimated useful lives
of the individual assets. The cost and estimated useful lives of depreciable assets is as follows:
Life in Years 2016 2015
Buildings and Equipment 10-39 $257,481,023 $214,220,475 Machinery and Equipment 5-10 195,300,584 176,887,671 Transportation Equipment 3-5 28,837,036 26,148,501 $481,618,643 $417,256,647
Depreciation expense for the years ended July 31, 2016 and 2015 amounted to
$28,836,498 and $26,944,815, respectively.

18
Notes to Consolidated Financial Statements (Continued) Note 6: Property, Plant and Equipment (Continued) Construction in process at July 31, 2016 consisted of the following:
Costs Approved Projects To Date Expenditure Grain Shuttle – Kennebec $31,738,710 $30,500,000 Liquid Fertilizer – Dike and Pad – Tulare 302,758 328,000 Liquid Fertilizer Automation System – Bath 112,211 250,000 Other 375,880 461,000 $32,529,559 $31,539,000
Construction in process at July 31, 2015 consisted of the following:
Costs Approved Projects To Date Expenditure Agronomy Service Center – Kennebec $ 1,854,265 $ 7,500,000 Fertilizer Shed – Kennebec 6,123,489 9,600,000 Grain Shuttle – Kennebec 9,303,253 30,500,000 Grain Expansion – McLaughlin 3,555,778 8,900,000 Grain Dryer – Roscoe 80,000 855,000 Scale – Highmore 495,428 550,000 NH3 Plant – Roscoe 305,302 300,000 Other 662,823 1,584,500 $22,380,338 $59,789,500
Note 7: Goodwill The Association accounts for its goodwill and other intangible assets in accordance with
FASB ASC Topic 350, Intangibles – Goodwill and Other. Under this standard, goodwill and intangible assets deemed to have indefinite lives are not amortized but are subject to annual impairment tests.
The Association recorded goodwill of $2,073,214 from the acquisition of Dakota Ag
Coop on September 1, 2009. There were goodwill impairment charges recorded during 2016 and 2015 of $207,321 for each year.
The Association recorded goodwill of $3,380,406 from the acquisition of MZB
Technologies, LLC on August 1, 2011. There were no goodwill impairment charges recorded during 2016 and 2015.

19
Notes to Consolidated Financial Statements (Continued) Note 7: Goodwill (Continued)
The Association recorded goodwill of $395,246 from the acquisition of Dakota Lakes, LLC from Land O’Lakes, Inc. on July 27, 2016. The Company adopted the accounting alternative for the subsequent measurement of goodwill provided in FASB ASC 350-20. Under this accounting alternative, the Company will amortize goodwill on a straight-line basis over a ten year useful life and only evaluates goodwill for impairment at the entity level when a triggering event occurs. The Association does not believe that any triggering events occurred requiring impairment testing and thus, no impairment loss was recognized.
Note 8: Equity in Other Cooperatives Equities in other cooperatives are recorded at cost, plus unredeemed patronage dividends
received in the form of capital stock and other equities, less any loss allocation or impairments recognized. Most cooperative stocks are not transferable, thereby precluding any market value, but they may be used as collateral in securing loans. Any impairment of equities normally is not recognized by the Association until formal notification is received or can be reasonably estimated. Redemption of these equities is at the discretion of the various organizations. A substantial portion of the business of these cooperatives is dependent upon the agribusiness economic sector.
At July 31, 2016 and 2015, the Association had equity in other cooperatives as follows:
2016 2015 CHS, Inc. $10,608,324 $ 9,645,477 CoBank, ACB 5,810,871 5,653,978 Land O’ Lakes, Inc. 10,310,422 10,849,552 Ag Processing, Inc. 1,532,120 1,249,363 United Suppliers, Inc. 431,763 431,763 All Others – Net of Acquisition Discount 987,741 659,090 $29,681,241 $28,489,223
Note 9: Investment in Other Companies
Investments in other companies are reported using the equity method, which is the Association’s original cost plus the proportionate share of undistributed earnings or losses. At July 31, 2016 and 2015, the Association had investments in other companies, as follows:

20
Notes to Consolidated Financial Statements (Continued)
Note 9: Investment in Other Companies (Continued)
Investment Ownership Contribution/ Ending
Company Percentage (Redemption) Income Balance 2016 Advanced Bioenergy, LLC 0.000% $ 0 $ 0 $ 452,347 James Valley Grain, LLC 64.055% 0 366,885 19,146,058 Dakotaland Feeds, LLC 33.000% (660,000) 563,821 2,215,791 Redfield Energy, LLC 1.223% (48,000) 10,348 702,958 Dakota Lakes, LLC 0.000% (6,355,171) 501,702 0 Northern Plains Nitrogen, LLC 3.279% 0 0 210,576 South Dakota Soybean Processors, LLC 0.024% (3,711) 5,659 14,023 ACES 0.000% 0 0 5,000 Kennebec, LLC – Condo Storage 0.000% 0 0 59,847 St. Lawrence Grain Storage Condo 0.000% 0 0 100 Dakota Ag Grain Storage LP 0.000% 0 0 100 Consolidated Ag Solutions 33.333% 50,000 0 50,000 Glacial Lakes Energy Export Holdings, LLC 0.048% 1 360 361 Winsure Captive Insurance Co. 0.000% 70,001 0 70,001 $(6,946,880) $1,448,775 $22,927,162
Investment Ownership Contribution/ Income/ Ending
Company Percentage (Redemption) (Loss) Balance 2015 Advanced Bioenergy, LLC 0.000% $ 0 $ 0 $ 452,347 James Valley Grain, LLC 64.055% 1,281,106 4,147,280 18,779,173 Dakotaland Feeds, LLC 33.000% 0 462,876 2,311,970 Redfield Energy, LLC 1.219% (234,000) 469,018 740,610 Dakota Lakes, LLC 50.000% 0 466,712 5,853,469 Northern Plains Nitrogen, LLC 14.652% 10,000 576 210,576 South Dakota Soybean Processors, LLC 0.025% (3,710) 4,952 12,075 ACES 0.000% 0 0 5,000 South Dakota Oilseed Processors, LLC 0.000% 0 (4) 0 Kennebec, LLC – Condo Storage 0.000% 0 0 59,847 St. Lawrence Grain Storage Condo 0.000% 0 0 100 Dakota Ag Grain Storage LP 0.000% 0 0 100 $1,053,396 $5,551,410 $28,425,267

21
Notes to Consolidated Financial Statements (Continued)
Note 9: Investment in Other Companies (Continued) The condensed financial information for the material investment in other companies as of July 31, 2016 and 2015 is as follows:
James Valley Grain, LLC
Period Ended 07-31-16 07-31-15 Sales and Service Income $135,641,949 $173,216,567 Cost of Sales 131,239,765 161,339,594 Gross Income 4,402,184 11,876,973 Other Income 1,332,226 458,450 Expenses (5,349,085) (5,960,729) Patronage Dividend Income 187,439 99,823 Net Income $ 572,764 $ 6,474,517
Balance Sheets Assets
Current Assets $ 24,775,160 $ 38,209,976 Property, Plant and Equipment, Net 41,579,413 26,578,241 Other Assets 503,453 391,216 $ 66,858,026 $ 65,179,403 Liabilities and Partners’ Capital
Current Liabilities $ 31,556,207 $ 31,761,125 Long–Term Liabilities 5,488,320 4,177,543 Partners’ Capital 29,813,499 29,240,735 $ 66,858,026 $ 65,179,403
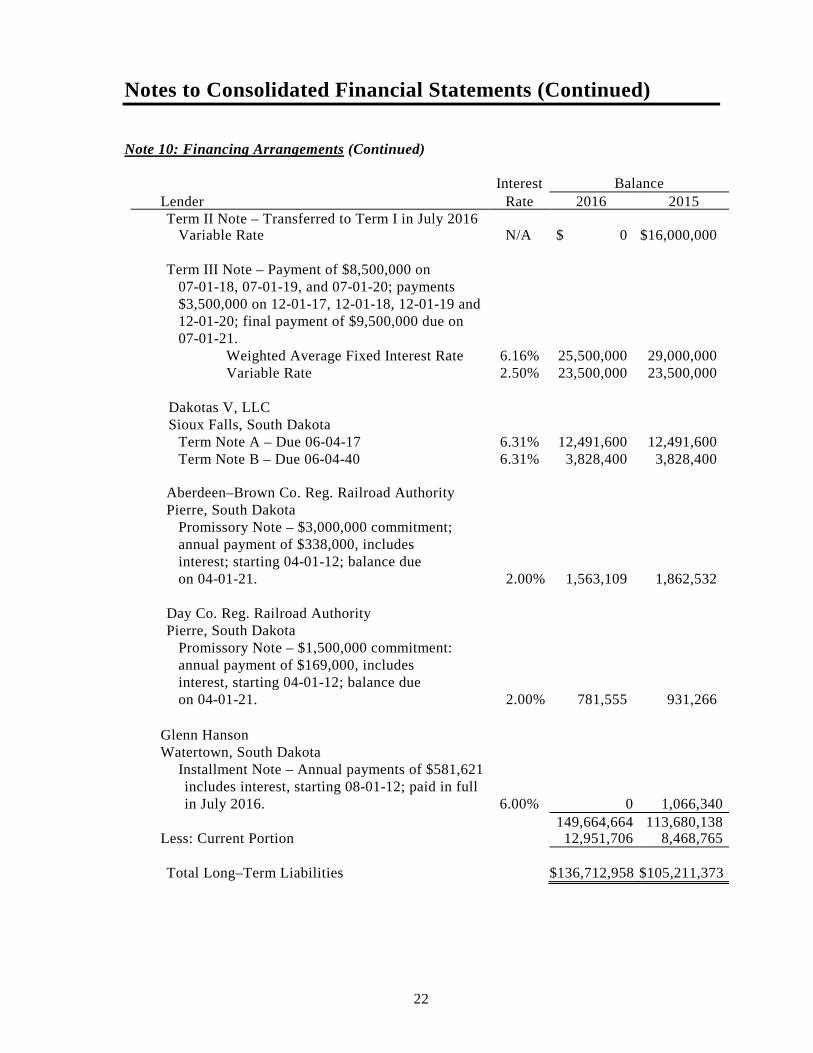
Note 10: Financing Arrangements Long–term financing arrangements at July 31, 2016 and 2015, are as follows:
Interest Balance Lender Rate 2016 2015 Notes Payable CoBank, ACB Omaha, Nebraska Revolving Term I Note – Annual commitment reduction of $10,000,000 on 12-01-17, 12-01-18, 12-01-19 and 12-01-20; with balance due on excess; commitment reductions of $21,000,000 on 12-01-21 and 12-01-22 with balance due on excess. Variable Rate 2.50%* $82,000,000 $25,000,000
22
Notes to Consolidated Financial Statements (Continued) Note 10: Financing Arrangements (Continued)
Interest Balance Lender Rate 2016 2015 Term II Note – Transferred to Term I in July 2016 Variable Rate N/A $ 0 $16,000,000 Term III Note – Payment of $8,500,000 on 07-01-18, 07-01-19, and 07-01-20; payments $3,500,000 on 12-01-17, 12-01-18, 12-01-19 and 12-01-20; final payment of $9,500,000 due on 07-01-21. Weighted Average Fixed Interest Rate 6.16% 25,500,000 29,000,000 Variable Rate 2.50% 23,500,000 23,500,000 Dakotas V, LLC Sioux Falls, South Dakota Term Note A – Due 06-04-17 6.31% 12,491,600 12,491,600 Term Note B – Due 06-04-40 6.31% 3,828,400 3,828,400 Aberdeen–Brown Co. Reg. Railroad Authority Pierre, South Dakota Promissory Note – $3,000,000 commitment; annual payment of $338,000, includes interest; starting 04-01-12; balance due on 04-01-21. 2.00% 1,563,109 1,862,532 Day Co. Reg. Railroad Authority Pierre, South Dakota Promissory Note – $1,500,000 commitment: annual payment of $169,000, includes interest, starting 04-01-12; balance due on 04-01-21. 2.00% 781,555 931,266
Glenn Hanson Watertown, South Dakota
Installment Note – Annual payments of $581,621 includes interest, starting 08-01-12; paid in full in July 2016. 6.00% 0 1,066,340
149,664,664 113,680,138 Less: Current Portion 12,951,706 8,468,765 Total Long–Term Liabilities $136,712,958 $105,211,373

23
Notes to Consolidated Financial Statements (Continued) Note 10: Financing Arrangements (Continued)
In addition, the Association had a Revolving Credit Facility and seasonal line of credit
available at July 31, 2016 and 2015, as follows:
Interest Balance Lender Expires Rate 2016 2015 CoBank, ACB Omaha, Nebraska Revolving Credit Facility 03-15-2019 2.25%* $6,000,000 $0
* - Denotes Continuously Variable Interest Rate.
Loan commitments in effect at July 31, 2016 and 2015 were as follows:
2016 2015 CoBank, ACB Revolving Term I Note $ 82,000,000 $ 25,000,000 Term II Note 0 16,000,000 Term III Note 49,000,000 52,500,000 Revolving Credit Facility 249,675,000 249,675,000 The Association has a letter of credit issued to Nationwide Agribusiness Insurance Company in the amount of $325,000. The letter of credit expires on March 15, 2017. The Revolving Credit Facility was obtained from CoBank, ACB through a loan syndication involving CoBank, ACB and other financial institutions. Each of the financial institutions has committed to provide a determined amount of revolving credit facility. The loan commitment is for a three year period with a maturity of March 15, 2019.
Seasonal and term notes with CoBank, ACB are secured by a first mortgage lien covering certain specified real property owned by the Association, together with a security agreement under the Uniform Commercial Code covering substantially all personal property owned by the Association, including receivables, inventories, and equipment. The Association also has $5,810,871 of equity in the bank at July 31, 2016, which is held as additional collateral.
Restrictive covenants on the loan agreements with CoBank, ACB provide, among other
things, (1) restrictions on incurring additional indebtedness, (2) restrictions on assumption or guarantee of indebtedness of patrons, (3) a required minimum working capital balance of $60,000,000 at fiscal year end, and (4) restrictions on loan commitments to and investments in other companies.
Term notes with Dakotas V, LLC are secured by a first mortgage lien covering certain
specified real property owned by South Central North Dakota, LLC, together with a security agreement under the Uniform Commercial Code covering substantially all personal property owned by South Central North Dakota, LLC, including receivables, inventories and equipment.

24
Notes to Consolidated Financial Statements (Continued) Note 10: Financing Arrangements (Continued) The promissory note with Aberdeen–Brown County Regional Railroad Authority and the
State of South Dakota is secured by the railroad track that is located in Roscoe, South Dakota.
The promissory note with Day County Regional Railroad Authority and the State of
South Dakota is secured by the railroad track that is located in Andover, South Dakota. Aggregate annual maturities of the long–term debt outstanding at July 31, 2016, are as
follows:
Maturity Date – Year Ending July 31, 2017 $ 12,951,706 2018 22,469,309 2019 22,478,695 2020 22,488,269 20201 23,448,284 Thereafter 45,828,401 $149,664,664
Total interest expense charged to operations amounted to $7,605,008 and $8,956,271 for
the years ended July 31, 2016 and 2015, respectively. Note 11: Capital Leases
The Association has leased (7) grain dryers from Farm Credit Leasing under capital (financing) lease agreements. Capital lease obligations in effect at July 31, 2016 and 2015 were as follows:
Interest Balance Lender Rate 2016 2015 Farm Credit Leasing Minneapolis, Minnesota (5) 10,000 Bu. Grain Dryers – Monthly payment of $60,318, includes interest, starting 10-01-10; balance due on 10-01-17. 4.95% $1,705,948 $2,328,500 (2) 10,000 Bu. Grain Dryers – Monthly payment of $23,652, includes interest, starting 06-01-11; balance due on 06-01-18. 4.50% 845,152 1,085,051 2,551,100 3,413,551 Less: Current Portion 904,998 862,451 Long–Term Capital Leases $1,646,102 $2,551,100

25
Notes to Consolidated Financial Statements (Continued)
Note 11: Capital Leases (Continued)
Aggregate maturities of capital lease obligations are as follows:
Maturity Date – Year Ending July 31, 2017 $1,007,633 2018 1,673,182 Total Future Minimum Lease Payments 2,680,815 Less: Amount Representing Interest 129,715 Present Value of Future Minimum Lease Payments $2,551,100
The following is an analysis of leased assets included in property, plant and equipment as of July 31, 2016 and 2015:
2016 2015 Buildings and Equipment $6,010,053 $6,156,012 Less: Accumulated Depreciation 2,666,690 2,462,405 $3,343,363 $3,693,607
Depreciation expense related to the leased equipment for the year ended July 31, 2016 and 2015 was $567,172 and $615,601, respectively.
Note 12: Grain Payables Unpaid grain at July 31, 2016 and 2015 consisted of deferred payment contracts, delayed
pricing contracts and priced not paid contracts. Deferred payment contracts and priced not paid contracts represent grain whose title has passed to the Association where the final price has been established with payment to be made at a specified or later date. Delayed pricing contracts represent grain on which title has passed to the Association with a price to be fixed at a later date. The Association includes these bushels as purchases and reflects the corresponding liability based on the local bid price at July 31. The contracts are summarized as follows:
2016 2015 Deferred Payment Contracts $165,492,380 $166,340,419 Classified as Long–Term Liabilities (29,638,526) (38,565,377) Advances (4,210,135) (3,149,967) 131,643,719 124,625,075 Delayed Pricing Contracts 27,583,400 33,906,976 Priced Not Paid Contracts 14,240,490 14,464,229 Advances (1,320,934) (129,639) 12,919,556 14,334,590 $172,146,675 $172,866,641

26
Notes to Consolidated Financial Statements (Continued) Note 12: Grain Payables (Continued) The unpaid grain liabilities classified as long–term represent deferred payment contracts
where the producer has elected to defer payment until a specified date. The Association has setup a program which allows producers to elect to defer payment and receive a fixed interest rate. The amounts classified as long–term have due dates of over one year out. The aggregate annual maturities of the long–term unpaid grain liabilities at July 31, 2016, are as follows:
Maturity Date – Year Ending July 31, 2018 $19,732,378 2019 4,667,858 2020 984,606 2021 837,489 2022 472,138 Thereafter 2,944,057 $29,638,526
Note 13: Condo Storage The Association has entered into 5, 10, 18, or 20 year condo storage contracts with
patrons. These contracts lease storage space to patrons for an annual fee of 6¢ per bushel and a total fee of $0.30 to $1.60 per bushel, depending on the contract year and length of contract. This storage space currently can only be used for corn, soybeans or wheat. Additional storage charges of ½¢ per month are charged over the actual time the grain is in storage.
Condo Storage Contracts 2016 2015 Total Storage Space Leased – Bushels 6,835,000 6,820,500 Total Income Recorded from Contracts $808,189 $1,155,464 Total Receivables 348,680 404,620
Note 14: Members’ Equity The Association is organized on a membership basis and with membership control. A
membership in this Association may only be issued to or held by a (i) bona-fide producer, (ii) who resides in the territory of this Association, (iii) who patronizes this Association by doing not less than $5,000.00 in annual business during each previous fiscal year and (iv) who has been approved by the Board of Directors. Voting rights are limited to a one-vote premise. The balance of patrons’ and retired patrons’ reserve represents accumulated patronage dividends allocated to patrons but not paid in cash.
The Association has a program to pay to its retired patrons their accumulated qualified
patronage over a 10-year period after the patrons reach their 70th birthday. It is anticipated that this program, based on present applications, will require estimated annual payments for the next five years as listed below.

27
Notes to Consolidated Financial Statements (Continued) Note 14: Members’ Equity (Continued) The Association has a program to pay its patrons their accumulated qualified patronage in full after they attain age 80. It is anticipated that this program will require estimated annual payments for the next five years as listed below.
Age 70 Age 80 2017 $367,464 $193,205 2018 535,684 16,473 2019 481,490 2,152 2020 397,113 8,914 2021 296,971 12,911
Note 15: Income Taxes Income taxes are provided for the tax effects of transactions reported in the financial
statements and consist of estimated taxes currently due. Deferred taxes generally are recognized for the differences between the basis of assets and liabilities for financial statement and income tax purposes. These differences relate primarily to depreciable assets (use of different lives for financial statement and income tax purposes), allowance for doubtful accounts, accrued compensated absences, accrued property taxes, gains and losses on investments, and inventory capitalization (not deductible or includable for income tax purposes).
Components of the provision for income tax expense for the years ended July 31, 2016
and 2015, were as follows:
2016 2015 Federal Tax Expense (Benefit) $(185,507) $ 4,084,484 Deferred Income Tax Benefit (418,072) (2,572,508) $(603,579) $ 1,511,976
Total income tax expense (benefit) for the years July 31, 2016 and 2015, was less than
the normal amount computed by applying the U.S. federal income tax rate to savings before income taxes primarily because of allocated patronage dividends, the surtax exemption, domestic production activities deduction, permanent timing differences, and temporary timing differences creating deferred income taxes.
The Association excluded allocated patronage dividends from its taxable income as
provided under Section 1382 of the Internal Revenue Code for the tax year ended July 31, 2015. In order to utilize this exclusion, at least 20% of the patronage dividends, amounting to $3,200,000 was to be paid in cash by April 15, 2016. The Association elected to pay 40% of the allocation in cash, amounting to $6,400,000 for the year ended July 31, 2015. The Association elected to allocate non–qualified patronage dividends of $10,000,000 for the year ended July 31, 2015.

28
Notes to Consolidated Financial Statements (Continued) Note 15: Income Taxes (Continued) Deferred tax assets and liabilities consisted of the following:
2016 2015 Current Asset (Liability) Allowance for Doubtful Accounts $ 476,000 $ 476,000 Accrued Compensated Absences 517,332 543,847 Accrued Bonus Retention 448,747 531,302 Self–Funded Insurance Reserve 36,225 34,698 263(a) Inventory Capitalization 555,686 281,807 $ 2,033,990 $ 1,867,654
2016 2015 Non–Current Asset (Liabilities) Property, Plant and Equipment (Net) $(26,340,585) $(26,689,006) Investments in Other Companies (23,624) (160,855) Condo Storage (82,986) (96,300) Goodwill 0 660 Non–Qualified Allocation 9,318,504 9,359,811 Capital Leases 607,162 812,425 $(16,521,529) $(16,773,265)
The Company recognizes any uncertain tax benefits if such benefits are a result of a tax
position that is more likely than not sustainable upon examination by Federal or State tax authorities. When an uncertain benefit is determined to be more likely than not sustained, the Company values the position, for financial statement purposes, of the largest amount of the tax benefit that is more than 50% likely of being realized upon resolution of the benefit. For any tax positions taken that do not meet the more likely than not criteria, the Company establishes a tax reserve for 100% of the position taken.
As of July 31, 2016, no significant amounts of unrecognized tax benefits existed nor does
the Company anticipate any significant changes in unrecognized tax benefits to occur within the next year, other than tax settlements.
The Association files tax returns with the Internal Revenue Service, the State of North
Dakota and the State of Iowa. As of July 31, 2016, the Association is no longer subject to examinations by relevant tax authorities for the fiscal years prior to July 31, 2013.
Note 16: Pension Plans The Association participates in a defined contribution thrift 401(k) plan. Under the terms
of the plan, qualifying employees may elect to contribute to the plan a percentage of their compensation, such contributed compensation may be partially matched by the Association, up to a maximum of 3%. The Association contributed $765,397 and $791,881 to the thrift plan for the years ended July 31, 2016 and 2015, respectively.

29
Notes to Consolidated Financial Statements (Continued) Note 16: Pension Plans (Continued) Substantially all of the Association’s employees participate in the Coop Retirement Plan,
which is a multiple employer defined benefit plan that is funded by contributions from employer and employees and provides for monthly income for life upon retirement or upon total and permanent disability. The amount of benefits is based upon length of service compensation. The plan is administered by United Benefits Group.
The Association intends to continue to participate in the plan indefinitely; however, it
may voluntarily discontinue the plan at any time. The Association’s annual contributions are consistently charged to expenses as they are due. The plan, which has no funding deficiencies, uses the aggregate cost method of valuations. Under this method, the normal cost is adjusted each year to reflect the experience under the plan, automatically spreading gains or losses over future years. The relative position of each employer associated with the plan, with respect to the actuarial present value of the accumulated benefits, is not determinable.
The Association is one of approximately 400 employers that contributes to the Co-op
retirement Plan (the “Plan”), which is defined benefit plan constituting a “multiple employer plan” under the Internal Revenue Code of 1986, as amended, and a “multiemployer plan” under the FASB Accounting Standards Master Glossary. The risks of participating in these multiemployer plans are different from single-employer plans in the following aspects:
a. Assets contributed to the multiemployer plan by one employer may be used to
provide benefits to employees of other participating employers; b. If a participating employer stops contributing to the plan, the unfunded obligations of
the plan may be borne by the remaining participating employers; and c. If the Association chooses to stop participating in the multiemployer plan, the
Association may be required to pay the plan an amount based on the underfunded status of plan, referred to as a withdrawal liability.
The Association’s participation in the Plan, including administration costs, for the years ended July 31, 2016 and 2015.
Contributions Plan Name EIN Plan Number 2016 2015 Co-op Retirement Plan 01-0689331 001 $3,521,835 $3,437,954
The Association’s contributions for the years stated above constitute its total
contributions made to all multiemployer plans and did not represent more than 5% of total contributions to the Plan as indicated in the Plan’s most recently available annual report (Form 5500). There have been no significant changes that affect the comparability of 2016 and 2015 contributions. Plan–level information is included in Form 5500 and therefore is available in the public domain.

30
Notes to Consolidated Financial Statements (Continued) Note 17: Operating Leases The Association has certain cancelable and non–cancelable operating leases and rental
agreements on property and equipment. The rental expense was $8,557,035 and $8,414,065 for the years ended July 31, 2016 and 2015, respectively.
The future required minimum annual lease payments are as follows:
2017 $ 968,279 2018 928,624 2019 766,804 2020 766,804 2021 631,120 Thereafter 631,120 $4,692,751
Note 18: Fair Value Measurements The Association determines the fair value of certain inventories of agricultural
commodities, derivative contracts, and marketable securities based on the fair value definition and hierarchy levels as established below:
Level 1 Values are based on unadjusted quoted prices in active markets
for identical assets or liabilities. These assets or liabilities include commodity derivative contracts on the Chicago Board of Trade.
Level 2 Values are based on quoted prices for similar assets or liabilities
in active markets, quoted prices for identical assets or liabilities exchanged in inactive markets.
Level 3 Values are based on unobservable inputs reflecting management’s
own assumptions and best estimates that market participants would use in pricing the asset or liability.
The asset’s or liability’s fair value measurement level within the fair value hierarchy is
based on the lowest level of any input that is significant to the fair value measurement. Valuation techniques used need to maximize the use of observable inputs and minimize the use of unobservable inputs.
The carrying value of the Association’s other instruments, consisting principally of cash,
trading receivables, accounts payable, lines of credit and other obligations, approximates fair value due to the short–term maturity of these instruments. The carrying value of long–term borrowings approximates fair value as the interest the Association could obtain on similar debt instruments approximate the interest rates of current debt obligations. The Association’s investments in other cooperatives are stated at cost. There is no established market for these investments, and it is not otherwise practical to determine the fair value of investments in cooperatives.

31
Notes to Consolidated Financial Statements (Continued) Note 18: Fair Value Measurements (Continued) The following table sets forth the level, within the fair value hierarchy, of the
Association’s assets and liabilities at fair value as of July 31, 2016 and 2015:
Assets at Fair Values as of July 31, 2016 Level 1 Level 2 Level 3 Total Assets Grain Inventories $ 0 $103,891,974 $0 $103,891,974 Futures Grain Contracts 13,147,913 0 0 13,147,913 $13,147,913 $103,891,974 $0 $117,039,887 Liabilities Forward Grain Contracts $ 0 $ 11,016,644 $0 $ 11,016,644
Assets at Fair Values as of July 31, 2015 Level 1 Level 2 Level 3 Total Assets Grain Inventories $ 0 $79,925,291 $0 $79,925,291 Futures Grain Contracts 15,982,043 0 0 15,982,043 $15,982,043 $79,925,291 $0 $95,907,334 Liabilities Forward Grain Contracts $ 0 $11,849,073 $0 $11,849,073
Corporate stock and mutual funds are measured at fair value based on quoted prices on
active exchanges and as such are categorized as Level 1. Grain inventories are measured at fair value based on exchange quoted prices adjusted for differences in local markets, and as such are categorized as Level 2. Commodity derivative futures contracts are measured at fair value based on quoted prices on active exchanges and as such are categorized as Level 1. Commodity derivative forward contracts are measured at fair value based on exchange quoted prices and/or recent market bids, adjusted for location specific inputs and as such are categorized as Level 2. The Company had no Level 3 measurements as of July 31, 2016 and 2015.
Note 19: Derivative Instruments The Association’s purpose for entering into derivatives and its overall risk management
strategies are discussed in Note 2.

32
Notes to Consolidated Financial Statements (Continued) Note 19: Derivative Instruments (Continued) The fair value of derivatives is located in Margin Account on the balance sheets. The
fair value of commodity derivatives (future contracts and options) is as follows at July 31:
2016 2015 Derivative Assets Commodity Futures Contracts $16,816,138 $15,982,043 Derivative Liabilities Commodity Futures Contracts $ 3,668,225 $ 86,138
Gains and losses on commodity derivatives are located in Gross Savings on Sales on the
Statement of Savings. Net gains on futures contracts for the years ended July 31, 2016 and 2015, were $39,258,325 and $30,985,076, respectively.
Note 20: Contingencies and Commitments
a. The Association is contingently liable for any weight or grade deficiencies that may occur at time of delivery on the following grain in storage under warehouse receipts or awaiting disposition at July 31, 2016.
Storage Market Commodity Obligation Value Spring Wheat – Bushels 1,101,040 $ 4,635,817 Winter Wheat – Bushels 1,840,892 6,379,940 Corn – Bushels 1,480,120 4,514,976 Soybeans – Bushels 249,409 2,346,614 Milo – Bushels 54,386 135,422 $18,012,769
b. The Association will be required to comply with various governmental laws and
regulations incident to its normal business operations. In order to meet its compliance requirements, remediation of identified issues would be included as an expense. Cost for matters which may be identified in the future cannot be determined at present; while the resolution of any such matters may have an impact on the Association’s financial results for a particular reporting period, management believes any such matters will not have a material effect on the financial position of the Association due to the contingency reverse fund as established by the board of directors.

33
Notes to Consolidated Financial Statements (Continued) Note 20: Contingencies and Commitments (Continued)
c. The Association has entered into “Natural Gas Delivery Distribution & Facilities Construction Agreements” with NorthWestern Energy for the construction and supply of natural gas service to the Association’s grain drying facilities in Aberdeen, South Dakota; Andover, South Dakota; Willow Lake, South Dakota; and Yale, South Dakota. The agreements require the Association to meet minimum usage obligations on an annual basis and total obligations for the contract term. The agreements have a contract term of 10 years, starting October 1, 2010. The Association is required to obtain and hold a surety bond for each of the projects for an amount equal to the construction costs as estimated by NorthWestern Energy for the term of the agreements. The surety bond amounts required may decline annually, if the minimum usage requirements are met, based on an amortization of the initial construction costs over the term of the agreements. The Association has obtained surety bonds for each of the projects for an initial term of 3 years, with an annual renewal option at the end of the 3 year term. The Association may be liable up to the value of the surety bonds, which is $1,464,519 as of July 31, 2016, for any breach of contract.
d. The Association has entered into “Firm Gas Service Extension Policy Rate 120” with
Montana-Dakota Utilities Co. for the construction and supply of natural gas service to the Association’s grain drying facility in Roscoe, South Dakota. The agreement requires the Association to meet minimum usage obligations on an annual basis. The agreement has a contract term of 62 months, starting July 12, 2010. The Association is required to obtain and hold a surety bond guaranteeing the performance of the above contract for the term of the agreement. The surety bond amount required may decline annually, if the minimum usage requirements are met, based on an amortization of the initial construction costs over the term of the agreements. The Association has obtained surety bonds for the project for an initial term of 3 years, with an annual renewal option at the end of the 3 year term. The Association may be liable up to the value of the surety bond, which is $152,000 as of July 31, 2016, for any breach of contract.
Note 21: Subsequent Events
The Association has considered the effect, if any, that events occurring after the balance sheet date and up to November 22, 2016 have on the consolidated financial statements as presented. This date coincides with the date the consolidated financial statements were available to be issued.

wheatgrowers.com | 888-429-4902908 Lamont Street South, Aberdeen, SD 57401