2015‐16 annual accountability report florida...
TRANSCRIPT

2015‐16 Annual Accountability Report
STATE UNIVERSITY SYSTEM of FLORIDA Board of Governors
FLORIDA STATE UNIVERSITY
DRAFT 02/15/2017
1
Annual Accountability Report 2015-2016
FLORIDA STATE UNIVERSITY DRAFT
02/15/2017
TABLE OF CONTENTS EXECUTIVE SUMMARY DASHBOARD p. 2 PERFORMANCE FUNDING METRICS p. 5 KEY ACHIEVEMENTS p. 6 NARRATIVE p. 7
DATA TABLES SECTION 1. FINANCIAL RESOURCES p. 17 SECTION 2. PERSONNEL p. 21 SECTION 3. ENROLLMENT p. 22 SECTION 4. UNDERGRADUATE EDUCATION p. 26 SECTION 5. GRADUATE EDUCATION p. 35 SECTION 6. RESEARCH & ECONOMIC DEVELOPMENT p. 38
2
Annual Accountability Report 2015-2016
FLORIDA STATE UNIVERSITY DRAFT
02/15/2017
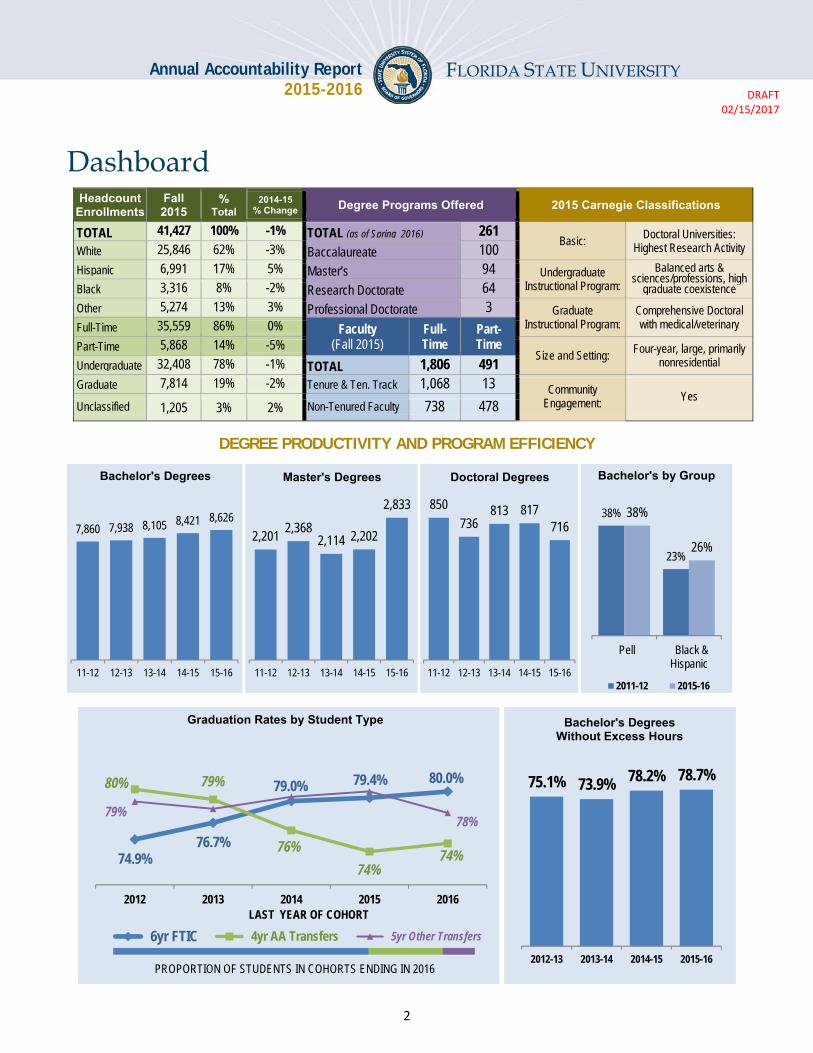
Dashboard
Headcount Enrollments
Fall 2015
% Total
2014-15 % Change Degree Programs Offered 2015 Carnegie Classifications
TOTAL 41,427 100% -1% TOTAL (as of Spring 2016) 261 Basic:
Doctoral Universities: Highest Research Activity White 25,846 62% -3% Baccalaureate 100
Hispanic 6,991 17% 5% Master’s 94 Undergraduate Instructional Program:
Balanced arts & sciences/professions, high
graduate coexistence Black 3,316 8% -2% Research Doctorate 64 Other 5,274 13% 3% Professional Doctorate 3 Graduate
Instructional Program: Comprehensive Doctoral with medical/veterinary Full-Time 35,559 86% 0% Faculty
(Fall 2015) Full- Time
Part- Time Part-Time 5,868 14% -5%
Size and Setting: Four-year, large, primarily
nonresidential Undergraduate 32,408 78% -1% TOTAL 1,806 491 Graduate 7,814 19% -2% Tenure & Ten. Track 1,068 13 Community
Engagement: Yes
Unclassified 1,205 3% 2% Non-Tenured Faculty 738 478
DEGREE PRODUCTIVITY AND PROGRAM EFFICIENCY
7,860 7,938 8,105 8,421 8,626
11-12 12-13 13-14 14-15 15-16
Bachelor's Degrees
2,2012,368
2,114 2,202
2,833
11-12 12-13 13-14 14-15 15-16
Master's Degrees
850736
813 817716
11-12 12-13 13-14 14-15 15-16
Doctoral Degrees
38%
23%
38%
26%
Pell Black &Hispanic
2011-12 2015-16
Bachelor's by Group
74.9%76.7%
79.0% 79.4% 80.0%80% 79%
76%
74%74%
79%78%
2012 2013 2014 2015 2016
6yr FTIC 4yr AA Transfers 5yr Other Transfers
Graduation Rates by Student Type
LAST YEAR OF COHORT
PROPORTION OF STUDENTS IN COHORTS ENDING IN 2016
75.1% 73.9% 78.2% 78.7%
2012-13 2013-14 2014-15 2015-16
Bachelor's Degrees Without Excess Hours

3
Annual Accountability Report 2015-2016
FLORIDA STATE UNIVERSITY DRAFT
02/15/2017
Dashboard DEGREES AWARDED IN PROGRAMS OF STRATEGIC EMPHASIS
RESEARCH AND COMMERCIALIZATION ACTIVITY
RESOURCES
36.7% 38.3% 37.5% 39.1% 42.9%
2011-12 2012-13 2013-14 2014-15 2015-16
PSE Bachelor's Degrees
38.0% 38.1% 38.5% 42.0% 46.0%
2011-12 2012-13 2013-14 2014-15 2015-16
PSE Graduate Degrees
64% 66% 64% 66% 60%
$230.4 $225.4 $250.9 $252.5 $256.4
2010-11 2011-12 2012-13 2013-14 2014-15
EXTERNAL
Total R&D Expenditures ($ Millions)with Percent Funded Externally
10 13 15 25 16
$1.5$1.3
$1.0
$0.6$0.5
$0.0
$0.5
$1.0
$1.5
$2.0
0
5
10
15
20
25
30
2010-11 2011-12 2012-13 2013-14 2014-15
Lice
nses
Lice
nsin
g R
even
ue (
$M)
Licenses Executed Licensing Revenue ($M)
Licenses and Licensing Revenue
$6,620 $5,020
$8,064 $8,875 $9,491
$1,322$1,319
$1,304$1,208 $1,122$3,407
$3,924
$4,090$4,227 $4,299$11,350
$10,262
$13,457 $14,311 $14,911
2011-12 2012-13 2013-14 2014-15 2015-16
ACTUAL FUNDING PER FTENote: Tuition and Fee revenues include tuition, tuition differential fee and E&G fees (i.e., application, late registration, and library fees/fines) based on the actual amount collected (not budget authority) by universities as reported in their Operating Budget 625 reports. Other local fees that do not support E&G activities are not included here. Please note that a portion of the Tuition & Fees is supported by federal SFA programs (ie, Pell grants). State-funded Student Financial Aid amounts include the 11 SFA programs that OSFA reports annually. State Appropriations includes General Revenues, Lottery and Other Trust funds (i.e., Federal Stimulus for 2009-10 and 2010-11 only) that are directly appropriated to the university as reported in Final Amendment Package. Student FTE are actual and based on the standard IPEDS definition of FTE (equal to 30 credit hours for undergraduates and 24 for graduates). This data does not include funds or FTE from special units (i.e., IFAS, Health-Science Centers or Medical Schools). Not adjusted for inflation.

4
Annual Accountability Report 2015-2016
FLORIDA STATE UNIVERSITY DRAFT
02/15/2017
Dashboard POST-GRADUATION METRICS
60.3% 60.8% 63.7%
2012-13GRADUATES
2013-14GRADUATES
2014-15GRADUATES
Percent of Bachelor's Graduates Employed ($25,000+) or Enrolled
One Year After Graduation
$17,000 $17,300 $17,900 $18,200 $18,700
$22,700 $23,200 $24,200 $25,400 $26,600$30,100 $30,300 $31,600 $34,200 $35,700$39,100 $38,800 $41,200
$45,200 $47,800
$56,000 $54,500$59,800
$63,500$68,900
2010-11GRADUATES
2011-12GRADUATES
2012-13GRADUATES
2013-14GRADUATES
2014-15GRADUATES
Wages of Full-time Employed in FloridaBaccalaureates One Year After Graduation
5th, 25th, 50th, 75th and 95th Percentiles
Notes: Percentages are based on the number of recent baccalaureate graduates who are either employed full-time or continuing their education in the U.S. (based on the National Student Clearinghouse data). Full-time employment is based on those who earned more than a full-time (40hrs a week) worker making minimum wage. Due to limitations in the data, the continuing enrollment data includes any enrollment the following year regardless of whether the enrollment was post-baccalaureate or not. Board of Governors staff found 92% of the total 2014-15 graduating class.
See Table 4O within this report for additional information about this metric.
Notes: Wage data is based on annualized Unemployment Insurance (UI) wage data for those graduates who earned more than a full-time employee making minimum wage in the fiscal quarter a full year after graduation. This UI wage data does not include individuals who are self-employed, employed by the military or federal government, or those without a valid social security number. In 2014-15, these data accounted for 50% of the total graduating class. This wage data includes graduates who were employed full-time (regardless of their continuing enrollment). Wages are provided for 5th, 25th, 50th, 75th and 95th percentiles. Median wages are identified by bolded values. The interquartile range (shown in italics) represents 50% of the wage data. Wages rounded to nearest hundreds.

5
Annual Accountability Report 2015-2016
FLORIDA STATE UNIVERSITY DRAFT
02/15/2017
Performance Based Funding Metrics
2013-14 2014-15 CHANGE
1 Percent Employed ($25,000+) or Enrolled One Year After Graduation 60.8% 63.7% 2.9%pts
2013-14 2014-15 CHANGE
2 Median Wages of Bachelor’s Graduates Employed Full-time One Year After Graduation $34,200 $35,700 4.4%
2011-15 2012-16 CHANGE
3 Cost to the Student: Net Tuition & Fees per 120 Credit Hours $14,980 $14,930 -0.3%
2009-15 2010-16 CHANGE
4 Six-Year Graduation Rate for First-time-in-College (FTIC) Students 79.4% 80.0% 0.7%pts
2014-15 2015-16 CHANGE
5 Academic Progress Rate 91.0% 90.4% -0.6%pts
2014-15 2015-16 CHANGE
6 Bachelor’s Degrees Awarded within Programs of Strategic Emphasis 39.1% 42.8% 3.8%pts
FALL 2014 FALL 2015 CHANGE
7 University Access Rate 28.4% 27.7% -0.7%pts
2014-15 2015-16 CHANGE
8 Graduate Degrees Awarded within Programs of Strategic Emphasis 42.0% 46.0% 4.0%pts
2013 2014 CHANGE
9 Board of Governors Choice Metric: Number of Faculty Awards 2 7 5
2016 2017 CHANGE
10 Board of Trustees Choice Metric: National rank higher than predicted by the Financial Resources ranking
114 120 5.3%
Note: The annual data shown above is rounded to one decimal. The one-year change data is based on the non-rounded annual data and may not appear to sum due to rounding.
6
Annual Accountability Report 2015-2016
FLORIDA STATE UNIVERSITY DRAFT
02/15/2017
Key Achievements (2015 –2016)
STUDENT AWARDS/ACHIEVEMENTS 1. Alexandra Harper received the John A. Knauss Marine Policy Fellowship from the National Oceanic
and Atmospheric Administration’s (NOAA) National Sea Grant College Program. 2. Twenty-one Florida State athletes, representing 12 countries, competed at the Olympic Games in
Rio de Janeiro, Brazil. There has been at least one Seminole competing in the summer Games since 1972.
3. Matthew Hebron has received the prestigious Boren Scholarship, a program of the National Security Education Program.
FACULTY AWARDS/ACHIEVEMENTS 1. The National Academy of Inventors named Jianping “Jim” Zheng a fellow, an honor that has only
ever been bestowed on 581 other people worldwide. 2. Three faculty received five-year NSF CAREER awards: Eugene DePrince (Chemistry &
Biochemistry), Emily DuVal (Biological Science), and Zhi Wang (Computer Science). 3. English Professor, author, and poet David Kirby has been honored by the Florida Humanities
Council with the 2016 Florida Lifetime Achievement Award for Writing.
PROGRAM AWARDS/ACHIEVEMENTS 1. FSU’s online programs are among the best in the nation — including five graduate programs
ranked in the Top 20 and three in the Top 10 — according to U.S. News & World Report’s 2017. 2. Two of our professional programs are among the best for minority students. Our highly selective
College of Medicine has become a top producer of Hispanic and African-American physicians, including many much-needed family physicians. The College of Law was named the nation’s #2 law school for Hispanic students.
3. The faculty of Florida State University’s College of Criminology & Criminal Justice leads the nation in producing articles published in top journals, according to a recent study by the Journal of Criminal Justice Education.
RESEARCH AWARDS/ACHIEVEMENTS 1. Hengli Tang and other FSU researchers made a major breakthrough in the quest to learn whether
the Zika virus is linked to birth defects with the discovery that the virus is directly targeting brain development cells and stunting their growth.
2. James Olcese, who invented a sleep mask that will help pregnant women stave off preterm labor, has won the Cade Museum Prize for innovation. He founded a company named KynderMed to promote and market this new technology.
3. The Council on Undergraduate Research, selected FSU as one of six research-university finalists for the inaugural Award for Undergraduate Research Accomplishments (AURA).
INSTITUTIONAL AWARDS/ACHIEVEMENTS 1. US News and World Report Best Colleges Rankings - FSU moved from 43 to 38th in the overall
ranking, the largest jump of any public university in the top 100. 2. FSU has been recognized by INSIGHT Into Diversity magazine as one of seven Diversity
Champion institutions among the “Higher Education Excellence in Diversity” recipients. 4. Military Times ranked Florida State No. 8 in the latest “Best Colleges for Vets” rankings (2015),
which are published annually by the magazine.

7
Annual Accountability Report 2015-2016
FLORIDA STATE UNIVERSITY DRAFT
02/15/2017
Narrative
Teaching and Learning STRENGTHEN QUALITY AND REPUTATION OF ACADEMIC PROGRAMS AND UNIVERSITIES
Florida State University is recognized as one of the State’s two preeminent universities and met all 12 of the preeminent metrics. The university has utilized the resources provided through preeminence not only to meet these metrics but also to advance in the university’s Top 25 Program. Florida State University moved up five places in the U.S. News & World Report rankings to No. 38 among all public national universities. FSU saw improvements in reputational ratings by university peers and high school guidance counselors, as well as faculty resources. These factors contributed to FSU’s ascension in the rankings, as they reflect the academic rigor and culture of student success that has long distinguished Florida State University as one of the best research institutions in the country. The Florida State University Board of Trustees approved the university’s new strategic plan http://strategicplan.fsu.edu/. While FSU is preeminent, the plan gives the vision to be even stronger five years from now, being among the nation’s most entrepreneurial and innovative universities, transforming the lives of our students, and shaping the future of our state and society through exceptional teaching, research, creative activity, and service. Per FSU’s strategic plan, our goal to “Amplifying Excellence Across our Academic and Research Programs” will be accomplished as we:
Define and develop an FSU “faculty for the future” Enhance the quality of graduate education to achieve preeminence in strategically important
areas of study and research Strengthen the excellence and reputation of the University’s professional schools Encourage and incentivize high-impact, interdisciplinary, and inter-college initiatives that address
pressing societal issues Expand innovative teaching strategies Enhance FSU’s strategy for expanding its global footprint and fostering a culturally rich learning
environment on campus
FSU continues its efforts to attract, recruit, and retain the best faculty. Building on our national strengths in Criminology, the Arts and Humanities, and Public Policy, FSU is enhancing its position as a national leader in STEM and continues to add additional faculty in Biomedical Sciences, Genetics, Neuroscience, Anatomy, Physiology, Clinical Psychology, Chemistry, Engineering, Communication Disorders, Health Sciences, Nutrition, and Biological Science. With the newly formed Interdisciplinary Medical Studies program, FSU will help meet the healthcare workforce needs by preparing students with a solid background in the sciences fundamental to medicine and healthcare and explore the total biopsychosocial knowledge base necessary for all who enter a healthcare profession. Students can obtain certificates to further enhance and develop the skills necessary to enter the workforce upon graduation. Students will also be prepared to enter professional

8
Annual Accountability Report 2015-2016
FLORIDA STATE UNIVERSITY DRAFT
02/15/2017
and graduate training for positions such as Physicians, Physician’s Assistants, Occupational or Physical Therapists, Pharmacists, or Dentists. Students may also choose a healthcare policy and analytics track. FSU has greatly increased the number of our undergraduate students who conduct research directly with a faculty member. Undergraduate students completing a full semester of research activity has increased to 28% through the Undergraduate Research Opportunity Program. Our CARE program, nationally recognized for its work with first generation, homeless and foster care students, continues to perform remarkably, with CARE students graduating at an 81% six-year rate, higher than our general population rate of 79.4%. FSU is developing a new Center for Teaching Excellence to continue to elevate the quality of teaching throughout the university. The Center will work with faculty and other instructors to improve student learning in and out of the classroom, and thereby contribute to FSU’s retention and graduation efforts. Our efforts are showing the results as FSU’s 6-year graduation rate for Pell eligible students has increased to 77%. One of the highest in the nation, FSU ranks, in the Top 15 of all public universities.
INCREASE DEGREE PRODUCTIVITY AND PROGRAM EFFICIENCY
The best way to increase degree production and efficiency is to retain our students and graduate them in a timely manner. This year’s retention rate remains 93% and for the past seven years we’ve maintain retention rates above 90%. Florida State’s excellent graduation and student retention rates are also key to FSU’s ranking among the nation’s best public universities. The university continues to invest in new ways to make improvements in the retention and graduation of our students. To do this, Florida State has continued its strategy of broad-based and targeted interventions to support student completion. Following this strategy, we continue to identify and eliminate barriers to graduation by improving processes and optimizing academic pathways, such as strengthening students’ academic maps and expanding student advising. A recent example is the expanded use of our new course scheduling interface application that allows students to view multiple schedules side-by-side and compare options in real-time. This initiative complements our Take 15 campaign that encourages students to enroll in 15 credit hours per term. The goal is to promote on-time graduation and to change the norm and culture so that “full-time” means 15 credits per term rather than 12. In fact, our data suggest that students who take 15 credit hours per semester generally perform better academically and that there are real cost savings and other benefits to students, including:
increasing the likelihood of graduation less opportunity cost (get a job, earn income sooner) lower cost for students (pay less tuition overall for a college degree) lower cost for FSU in support services lower cost to the state and taxpayers increase access for other students
We also continued to invest in our targeted interventions for unique and at-risk populations by enhancing programs and efforts to address their particular interests and challenges. In particular, FSU is committed
9
Annual Accountability Report 2015-2016
FLORIDA STATE UNIVERSITY DRAFT
02/15/2017
to making college affordable for all students, particularly but not limited to low-income, first-generation students. We have made several changes in recent years to cover tuition and fees for undergraduate students with need. Our Board of Trustees is equally concerned about this issue and has been working with the President and his staff to make college more affordable. FSU has implemented or continues to implement the following initiatives to make progress towards this goal:
Financial Aid Disbursement Policy - Federal law requires that Pell eligible students (low income, neediest) are disbursed financial aid within seven days of the start of class. FSU continued a new policy that exceeds this requirement by disbursing financial aid to all eligible students 10 days before the start of classes.
FSU CARE summer program - Eligible first generation, low income and socioeconomically disadvantaged students are admitted to the university each summer semester. To remove financial barriers for this group, 100% of the program's cost is covered with grants and scholarships
First Generation Students - FSU made a financial commitment to first generation, low income and socioeconomically disadvantaged students for the award year 2015-2016. Seventy-five percent of the cost of attendance was met with grants and scholarships.
FSU High School Partners Program - FSU continued an initiative partnering with high schools with a high number of low-income, first-generation students. One of our goals is to assist students with the admission and financial aid processes.
FSU financial literacy program - The Office of Financial Assistance is continuing a comprehensive financial literacy program for students. The focus is primarily on first generation, low income and socioeconomically disadvantaged students. Financial aid counseling sessions focus on financial literacy, debt management, and the financial aid application process.
Freshman Interest Groups (FIGS) – FSU continues our practice of clustering groups of three high-demand freshman courses into FIGS that have been linked by a theme or academic program. They are available in the fall and have played an important role in FSU’s overall retention strategy for students across the academic spectrum. First-year students find them a great way to simplify registration, explore what interests them, and form a community of students with similar interests. About 1000 FTICs enroll in FIGS each fall and retention is typically 2-3% higher than students who do not participate in this program.
INCREASE THE NUMBER OF DEGREES AWARDED IN S.T.E.M. AND OTHER PROGRAMS OF STRATEGIC EMPHASIS
The number of graduate and undergraduate degrees awarded across all programs of strategic emphasis has increased over the past 5 years. Graduate degrees across all strategic areas increased by 12.3% over the last 5 years with the greatest gains made in the number of degrees awarded in the areas of GAP Analysis (71% increase) and STEM (27% increase). We attribute these increases to the university’s focus on increasing faculty in STEM and Health fields.
The number of baccalaureate degrees awarded in STEM fields increased by 61% over the past 5 years. The university’s investment in faculty hires in STEM fields is critical to ensuring that we are able to offer the courses and research experiences to retain and graduate STEM students. We continue our efforts to
10
Annual Accountability Report 2015-2016
FLORIDA STATE UNIVERSITY DRAFT
02/15/2017
recruit top students interested in STEM majors. These efforts include identifying high school students with high achievement in math and science, and generating awareness that FSU is an ideal place for them to pursue their studies.
We continue to focus on new degree programs in areas of strategic emphasis. The Master of Science in Nurse Anesthesia graduated the first cohort with 24 students completing their degree in Fall 2016. The Master’s in Physician Assistant Studies will begin in 2017-18 admitting 40 students with an expected graduation of Fall 2019. The Interdisciplinary Medical Sciences baccalaureate degree program launched Fall 2016 and has accepted over 100 students in the major schedule who will graduate in the upcoming years. The Master’s in Statistics, which historically has only been offered on-campus, will also soon be delivered through distance education. Students will be able to complete 100% of the program requirements online.
FSU was awarded and implemented a federally-funded program Student Support Services-STEM (SSS-STEM). FSU’s program is one of the eight federally-funded TRIO programs designed to improve retention, graduation, financial literacy, and overall academic success rates for students majoring in Science, Technology, Engineering, or Math fields. FSU SSS-STEM helps meet these goals by providing academic and engagement activities for qualified students throughout their enrollment at FSU. SSS-STEM is fully funded by the U.S. Department of Education.
Narrative Scholarship, Research and Innovation STRENGTHEN QUALITY AND REPUTATION OF SCHOLARSHIP, RESEARCH AND INNOVATION
To achieve Top 25 university status as well as continue to grow research and educational capabilities in the STEM and health sciences disciplines, the University continues to invest in new faculty and the infrastructure needed to support their research.
Dr. Laura Greene, a condensed matter physicist and member of the National Academy of Sciences, joined the University during the 2015-16 academic year. She serves as the Chief Scientist of the National High Magnetic Field Laboratory (Mag Lab) and as such provides strategic leadership for this unique facility. Greene’s more than 400 invited talks and nearly 200 publications have earned her Fellowships in the American Academy of Arts and Sciences and the American Physical Society. She is the winner of the E. O. Lawrence Award for Materials Research from the Department of Energy. Dr. Greene currently serves as President of the American Physical Society, an organization with 53,000 members, including physicists in academia, national laboratories, and industry in the United States and throughout the world.
An aggressive effort was initiated to hire scientists and engineers to support the missions of some of our interdisciplinary centers and institutes including the NHMFL, Applied Superconductivity Center, High

11
Annual Accountability Report 2015-2016
FLORIDA STATE UNIVERSITY DRAFT
02/15/2017
Performance Materials Institute, Center for Advanced Power Systems, and Florida Center for Advanced Aero-Propulsion. The intent here is to identify expertise gaps in these centers/institutes and recruit established faculty to fill in the gaps and/or bridge programs of current faculty. By “established” we mean individuals who have distinguished records of scholarship, external contract and grant funding, and student/postdoctoral fellow mentorship. Recruiting established faculty is a delicate and deliberate process. Thus far, a mid-level hire in Mechanical Engineering (Dr. Seungyong Hahn) joined the Applied Superconductivity Center. Dr. Hahn specializes in the design and construction of specialized, all-superconducting magnets. Current searches are close to completion and several others are underway.
Three faculty cluster-hiring efforts reached full fruition – Energy & Materials (six academic departments in two colleges), Brain Health & Disease (three academic departments in two colleges) and Coastal & Marine Research (three academic departments in two colleges). These hiring efforts focus on building inter- and multi-disciplinary groups of faculty who can leverage different tools and approaches to solve complex, real-world problems. A total of 24 faculty members, most at the Assistant professor level, were hired. During the reporting year, the synergisms of these strategic cluster hires manifested as many joint publications and multi-investigator contract and grant proposals. Several of the junior hires have already received Federal Young Investigator Awards.
It is our intention to identify several other thematic areas for strategic cluster-hiring efforts to be complemented by recruiting efforts based on the imperatives of our constituent colleges. As stated within our strategic plan, to support this endeavor we aim to “Expand and enrich FSU’s research enterprise by strengthening the research infrastructure – IT, space, support staff, equipment, and library – required to support a substantial increase in interdisciplinary research.”
INCREASE RESEARCH AND COMMERCIALIZATION ACTIVITY
During the reporting period, space in the College of Medicine was renovated to create infrastructure for the FSU Magnetic Resonance Imaging Facility (FSU MRIF). In June of 2016, a Siemens Prisma 3 T MRI system was installed and made operational. FSU’s Siemens Prisma is the only instrument of its kind and the most advanced MRI system in the state of Florida. The MRIF is a University facility jointly managed by the Colleges of Medicine and Arts & Sciences and the Divisions of Academic Affairs and Research. The facility will support a broad range of research including functional magnetic resonance imaging. Major users of the MRIF will be neuroscientists, psychologists, and related researchers. Three of the major users will be faculty hires in the Brain Health & Disease cluster-hire effort. The FSU MRIF affords unique infrastructure for supporting world-class research in areas targeted for contract and grant investments such as the interagency BRAIN Initiative.
During the 2015-2016 reporting period the University had a record high in proposals submitted for external contract & grant funding (1,301) which was 39 proposals higher than the previous year.
The University continues to invest in the infrastructure for commercialization and marketing of our IP. This includes growth in the staffing of the Office of Commercialization under the VP for Research. Examples of successfully moving two diverse types of FSU-based technology into the marketplace:
12
Annual Accountability Report 2015-2016
FLORIDA STATE UNIVERSITY DRAFT
02/15/2017
Thrivant, LLC Exclusive commercial license regarding technology developed by Branko
Stefanovic, researcher at the Florida State University School of Medicine, to a startup company located in Tallahassee, Florida. We licensed a patent for a drug specifically inhibiting the production of type I collagen. High production/expression of type I collagen is the primary cause of fibrosis in the liver and other organs. This is the first drug specifically inhibiting the production of type I collagen and the first fibrosis drug that has specific, targeted, effects and not general effects. Thrivant has sufficient funding for preclinical development of the drug and potential funding for phase I clinical trials.
License with MySTEMKits.com MySTEMKits is a startup company based on our vetted curriculum and 3-D models developed by the company founders (Georgia company) Exclusive copyright license for K-12 curriculum developed at the Learning Systems Institute. Each lesson is designed for specific 3-D printed models designed by MySTEMKits.com. MySTEMKits.com provides 3D-printable manipulatives and our vetted curriculum to K-12 schools as an alternative to expensive classroom models and educational kits. MySTEMKits.com has entered into a distribution deal with Dremel (A Bosch company), a major manufacturer of 3-D printers, to include a bundle of our lessons and their models with the Dremel 3-D printers.
The University had 28 issued patents, 6 license agreements, and 3 option agreements during the 2015-16 reporting period.
INCREASE COLLABORATION AND EXTERNAL SUPPORT FOR RESEARCH ACTIVITY
The University cluster-hiring efforts as well as the strategic hiring of faculty in some of the interdisciplinary centers/institutes are intended to seed collaborations across academic disciplines.
To foster cross-disciplinary research and student/postdoctoral fellow mentorship, infrastructure must be in place to support these activities. During the reporting period, the final stages of design of two major buildings at FSU were underway. The Earth, Ocean and Atmospheric Science (EOAS) Building will be a 135,500 sf building constructed on the main campus. It will house the EOAS Department and contain teaching facilities, offices as well as general and specialized research labs. The EAOS Building will allow faculty in this department, who heretofore have been housed in four separate buildings, to be co-localized thereby facilitating collaborative efforts.
A second building, the Interdisciplinary Research and Commercialization Building (IRCB), is being planned for the southwest campus, leveraging the agencies of such entities as the Mag Lab, High Performance Materials Institute, and the College of Engineering. This state-of-the art research building will support research and student/postdoctoral fellow training in the physical sciences and engineering. The design is highly flexible to accommodate changes in research directions and to exploit new opportunities over the lifetime of the structure. The IRCB will house up to 26 faculty research groups from as many as seven different departments.

13
Annual Accountability Report 2015-2016
FLORIDA STATE UNIVERSITY DRAFT
02/15/2017
Narrative Community and Business Engagement STRENGTHEN QUALITY AND REPUTATION OF COMMITMENT TO COMMUNITY AND BUSINESS ENGAGEMENT
FSU is creating a truly entrepreneurial university by hiring a growing cadre of several dozen entrepreneurs-in-residence who help students and faculty colleagues bring ideas to market, and as a partial result, we have received the largest private donation in our history, $100 million, to help create the largest interdisciplinary School of Entrepreneurship in the country. The Jim Moran School of Entrepreneurship and the Jim Moran Institute, will become the focal point for collegiate entrepreneurial education and the lifeline for training and assistance to entrepreneurs, small businesses, and nonprofits. The continuation of Jim Moran’s generosity is an investment in our students, our businesses, and our state.
The new School of Entrepreneurship will engage our students in the heart of Tallahassee’s business center, through a private gift of property in one of downtown Tallahassee’s prime locations. The culmination of these two gifts will give rise to the Jim Moran School of Entrepreneurship, the first interdisciplinary entrepreneurship school of its kind in the nation, allowing us to give our students a world-class education in entrepreneurship and innovation.
A significant portion of the gift will continue to fund the Jim Moran Institute for Global Entrepreneurship, which has a 20-year history of serving entrepreneurs and small businesses throughout Florida. The Jim Moran Institute will continue its extensive outreach mission to help bridge real-world entrepreneurship practice with entrepreneurship education provided through the new school.
Furthermore, integrated into FSU’s new strategic plan is a goal for “Deepening our Distinctive Commitment to Continuous Innovation.” This will be accomplished, in part, by our efforts to “Translate FSU research, scholarship, and creative production into applications that enhance economic development and quality of life.” Specifically, we strive to:
Identify potential partners in the private, public, and nonprofit sector that can work with FSU faculty to accelerate the translation and commercialization of ideas. We’ll also connect entrepreneurs across the state with resources and expertise at FSU that can help them further develop their businesses.
Develop a focused strategy for elevating the visibility of FSU’s research, scholarship, and creative activity enterprise to business and industry.
Improve the University’s infrastructure and policies to better support entrepreneurial knowledge translation.
Include undergraduate and graduate students as meaningful participants in FSU knowledge translation activities.
We have invested in new means of career preparation, expanded internships, greatly enhanced job placement and critical thinking initiatives.

14
Annual Accountability Report 2015-2016
FLORIDA STATE UNIVERSITY DRAFT
02/15/2017
INCREASE LEVELS OF COMMUNITY AND BUSINESS ENGAGEMENT
Another component of our goal for “Deepening our Distinctive Commitment to Continuous Innovation” is to “Increase the University’s role as an engine for Florida’s economic development.” FSU will actively support an innovative future for Florida that enhances economic development and quality of life across the State, while providing FSU students and faculty with greater opportunities for training and work experiences to enhance their education. This effort seeks to:
Address Florida’s new and evolving workforce needs for entrepreneurially minded employees with strong critical-thinking skills.
Expand and deepen relationships between Florida’s extensive creative-industries sector and the University’s historically strong arts and humanities programs.
Bring together the University’s strong arts, design, and STEM capabilities in academic, experiential, and service initiatives that focus on ensuring environmental sustainability at a time of significant population growth.
Expand FSU’s capacity for social entrepreneurship and bring it to bear on important social and community challenges locally and statewide.
Build on FSU’s existing strengths in public policy and its location in the state capital.
FSU continues to partner with Domi Station to help FSU entrepreneurs with an idea or early stage product get the tools and guidance needed to get off the ground, interact with the community, and engage with successful business leaders. Since its grand opening, Domi Station has co-sponsored student events, which brings together software and hardware engineers, designers, and students to create team projects from scratch. Domi also hosts the weekly 1 Million Cups meeting of Tallahassee entrepreneurs, which welcomes FSU student pitches, and maintains work space in their headquarters specifically for FSU students.
FSU is diligently working to align college degrees with the state’s workforce needs. Departments regularly survey students and their employers to ensure our graduates are competitive and have the skills required to meet their employment needs.
FSU established the Seminole 100, which will recognize the top 100 fastest-growing businesses in America owned by Florida State University alumni. Important work is being done on FSU’s campus and throughout the state to educate students on how to become leading entrepreneurs. Seminole 100 will allow us to see the results of that rigorous academic environment, and it will stand as a lasting tribute to the entrepreneurial legacy of FSU.
FSU continues to expand outreach activity through the Small Business Executive Program (SBEP). The SBEP is designed with for-profit businesses in mind and created to be a world-class learning experience that accommodates the busy schedule of small business owners. Business owners using the Business Model Canvas, a global standard used by millions of people in companies of all sizes, emerge as stronger leaders, ready to capitalize on business opportunities. Participants learn to assess their
15
Annual Accountability Report 2015-2016
FLORIDA STATE UNIVERSITY DRAFT
02/15/2017
company's position, develop long-term strategies, and connect with fellow business owners. Programs are now offered in Jacksonville, and also in Broward and Palm Beach Counties.
INCREASE COMMUNITY AND BUSINESS WORKFORCE
As part of the FSU strategic plan, FSU has set a goal for “Preparing our Graduates for 21st Century Careers.” To accomplish this, FSU seeks to:
Expand experiential, cross-cultural, and collaborative learning Provide students strong career advising and mentoring Engage graduate students in programs and services that prepare them for employment
opportunities within and outside of the academy Leverage technology and relationships with employers and workforce development agencies
throughout Florida for the benefit of students and alumni
An example of a new program, and one that we are especially excited about, is our new FSUshadow program. The FSUshadow program gives students the opportunity to spend a day shadowing employers, community partners, alumni, and friends of the university to gain insight into a wide variety of career fields and industries. The program seems to be working; in the words of FSU senior Desiree' Williams: "I'm grateful to the FSU Career Center for providing the FSUshadow opportunity which led me to find employment while still in college." The efforts of the FSU Career Center connect our students with businesses and employers throughout the state and nation. Significant outcomes of these efforts include:
Serving a record number of students, with over 20,000 career advising sessions in 2016, in which trained specialists help students navigate professional development and secure internships and employment
Facilitating 19 career fairs in 2016, involving 1,579 employers seeking to hire students and 10,529 students attending
Employers are increasingly coming to campus to recruit our students, with a total of 4,403 hiring interviews occurring in 2016
53.9% of FSU graduates completed an internship More than two-thirds of FSU graduates seeking employment have at least one job offer by
graduation and are employed in a wide variety of industries

16
Annual Accountability Report 2015-2016
FLORIDA STATE UNIVERSITY DRAFT
02/15/2017
Data Tables
FINANCIAL RESOURCES Table 1A. Education and General Revenues Table 1B. Education and General Expenditures
Table 1C. Funding per Student FTE
Table 1D. Cost per Degree [PBF]
Table 1E. Other Budget Entities
Table 1F. Voluntary Support of Higher Education
PERSONNEL Table 2A. Personnel Headcount
ENROLLMENT Table 3A. Headcount Enrollment by Student Type Table 3B. Full-time Equivalent (FTE) Enrollment Table 3C. Enrollment by Instructional Method
Table 3D. Headcount Enrollment by Military Status and Student Level
Table 3E. University Access Rate: Undergraduate Enrollment with Pell Grant [PBF]
UNDERGRADUATE EDUCATION Table 4A. Baccalaureate Degree Program Changes in AY 2015-2016 Table 4B. Retention Rates [PBF]
Table 4C. First-Time-in-College (FTIC) Six-Year Graduation Rates
Table 4D. FTIC Graduation Rates [PBF]
Table 4E. AA Transfers Graduation Rates
Table 4F. Other Transfers Graduation Rates
Table 4G. Baccalaureate Degrees Awarded
Table 4H. Baccalaureate Degrees Awarded in Areas of Strategic Emphasis [PBF]
Table 4I. Baccalaureate Degrees Awarded to Underrepresented Groups
Table 4J. Baccalaureate Degrees Without Excess Credit Hours [PBF]
Table 4K. Undergraduate Course Offerings
Table 4L. Faculty Teaching Undergraduates
Table 4M. Student/Faculty Ratio
Table 4N. Licensure/Certification Exam: Nursing
Table 4O. Post-Graduation Metrics [PBF]
GRADUATE EDUCATION Table 5A. Graduate Degree Program Changes in AY 2015-2016 Table 5B. Graduate Degrees Awarded
Table 5C. Graduate Degrees Awarded in Areas of Strategic Emphasis [PBF]
Table 5D. Licensure/Certification Exams: Graduate Programs
RESEARCH & ECONOMIC DEVELOPMENT Table 6A. Research and Development Expenditures Table 6B. Centers of Excellence
17
Annual Accountability Report 2015-2016
FLORIDA STATE UNIVERSITY DRAFT
02/15/2017
Section 1 – Financial Resources
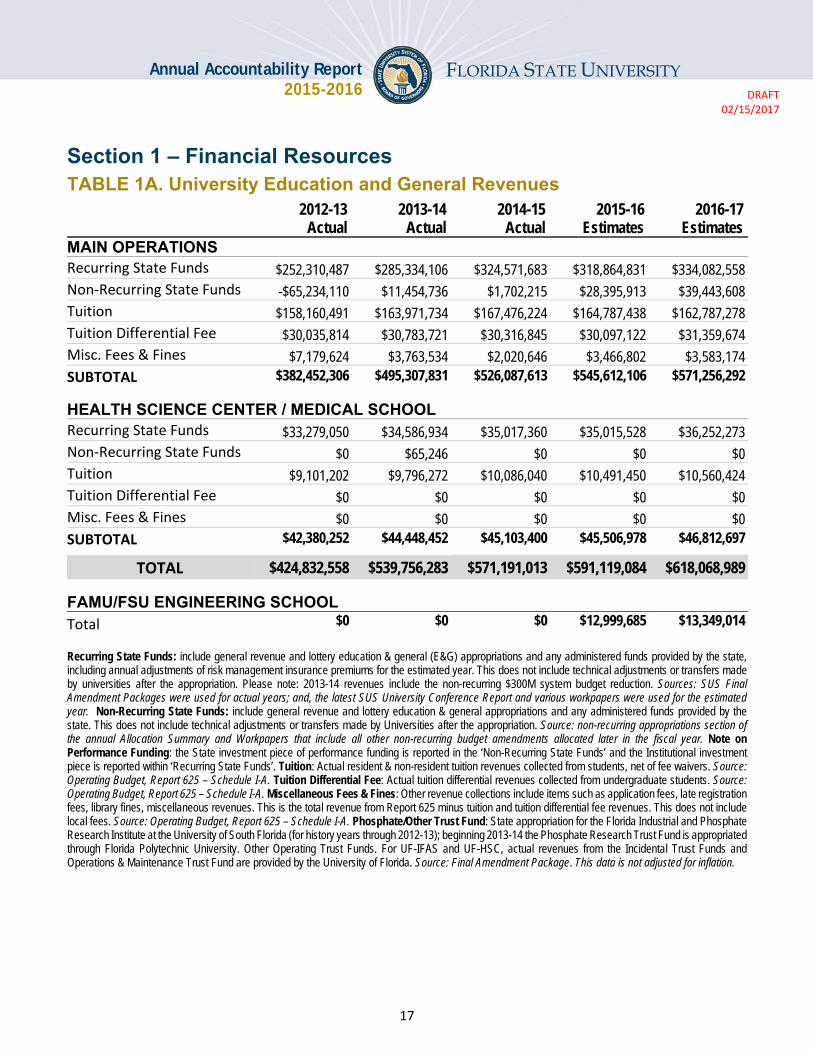
TABLE 1A. University Education and General Revenues
2012-13 Actual
2013-14 Actual
2014-15 Actual
2015-16 Estimates
2016-17 Estimates
MAIN OPERATIONS Recurring State Funds $252,310,487 $285,334,106 $324,571,683 $318,864,831 $334,082,558 Non‐Recurring State Funds -$65,234,110 $11,454,736 $1,702,215 $28,395,913 $39,443,608 Tuition $158,160,491 $163,971,734 $167,476,224 $164,787,438 $162,787,278 Tuition Differential Fee $30,035,814 $30,783,721 $30,316,845 $30,097,122 $31,359,674 Misc. Fees & Fines $7,179,624 $3,763,534 $2,020,646 $3,466,802 $3,583,174 SUBTOTAL $382,452,306 $495,307,831 $526,087,613 $545,612,106 $571,256,292
HEALTH SCIENCE CENTER / MEDICAL SCHOOL Recurring State Funds $33,279,050 $34,586,934 $35,017,360 $35,015,528 $36,252,273 Non‐Recurring State Funds $0 $65,246 $0 $0 $0 Tuition $9,101,202 $9,796,272 $10,086,040 $10,491,450 $10,560,424 Tuition Differential Fee $0 $0 $0 $0 $0 Misc. Fees & Fines $0 $0 $0 $0 $0 SUBTOTAL $42,380,252 $44,448,452 $45,103,400 $45,506,978 $46,812,697
TOTAL $424,832,558 $539,756,283 $571,191,013 $591,119,084 $618,068,989
FAMU/FSU ENGINEERING SCHOOL Total $0 $0 $0 $12,999,685 $13,349,014
Recurring State Funds: include general revenue and lottery education & general (E&G) appropriations and any administered funds provided by the state, including annual adjustments of risk management insurance premiums for the estimated year. This does not include technical adjustments or transfers made by universities after the appropriation. Please note: 2013-14 revenues include the non-recurring $300M system budget reduction. Sources: SUS Final Amendment Packages were used for actual years; and, the latest SUS University Conference Report and various workpapers were used for the estimated year. Non-Recurring State Funds: include general revenue and lottery education & general appropriations and any administered funds provided by the state. This does not include technical adjustments or transfers made by Universities after the appropriation. Source: non-recurring appropriations section of the annual Allocation Summary and Workpapers that include all other non-recurring budget amendments allocated later in the fiscal year. Note on Performance Funding: the State investment piece of performance funding is reported in the ‘Non-Recurring State Funds’ and the Institutional investment piece is reported within ‘Recurring State Funds’. Tuition: Actual resident & non-resident tuition revenues collected from students, net of fee waivers. Source: Operating Budget, Report 625 – Schedule I-A. Tuition Differential Fee: Actual tuition differential revenues collected from undergraduate students. Source: Operating Budget, Report 625 – Schedule I-A. Miscellaneous Fees & Fines: Other revenue collections include items such as application fees, late registration fees, library fines, miscellaneous revenues. This is the total revenue from Report 625 minus tuition and tuition differential fee revenues. This does not include local fees. Source: Operating Budget, Report 625 – Schedule I-A. Phosphate/Other Trust Fund: State appropriation for the Florida Industrial and Phosphate Research Institute at the University of South Florida (for history years through 2012-13); beginning 2013-14 the Phosphate Research Trust Fund is appropriated through Florida Polytechnic University. Other Operating Trust Funds. For UF-IFAS and UF-HSC, actual revenues from the Incidental Trust Funds and Operations & Maintenance Trust Fund are provided by the University of Florida. Source: Final Amendment Package. This data is not adjusted for inflation.

18
Annual Accountability Report 2015-2016
FLORIDA STATE UNIVERSITY DRAFT
02/15/2017
Section 1 – Financial Resources (continued)
TABLE 1B. University Education and General Expenditures (Dollars in Millions)
2011-12* 2012-13 2013-14 2014-15 2015-16 MAIN OPERATIONS Instruction/Research $237,616,044 $285,127,925 $298,633,272 $317,409,670 $322,781,561 Administration and Support $31,354,315 $35,282,352 $34,900,125 $50,594,317 $55,694,112 PO&M $54,384,805 $56,201,439 $60,096,612 $60,395,785 $64,018,123 Student Services $15,712,650 $34,038,160 $36,396,194 $37,217,299 $37,850,302 Library/Audio Visual $15,094,791 $15,547,168 $15,605,514 $27,533,450 $13,999,590 Other $4,619,559 $4,919,406 $5,547,710 $6,157,810 $6,901,489 SUBTOTAL $358,782,164 $431,116,450 $451,179,427 $499,308,331 $501,245,177
HEALTH SCIENCE CENTER / MEDICAL SCHOOL Instruction/Research $39,841,149 $48,506,228 $46,457,207 $46,700,543 $49,129,512 Administration and Support $57,093 $60,964 $83,282 $91,260 $2,833,079 PO&M $0 $0 $0 $0 $0 Library/Audio Visual $574,721 $769,739 $1,649,927 $1,735,327 $1,915,518 Teaching Hospital & Clinics $0 $0 $0 $0 $0 Student Services, and Other $0 $0 $0 $0 $0 SUBTOTAL $40,472,963 $49,336,931 $48,190,416 $48,527,130 $53,878,109
TOTAL $399,255,127 $480,453,381 $499,369,843 $547,835,461 $555,123,286
The table reports actual expenditures from revenues appropriated by the legislature for each fiscal year. The expenditures are classified by Program Component (e.g., Instruction/Research, PO&M, Administration, etc...) for activities directly related to instruction, research and public service. The table does not include expenditures classified as non-operating expenditures (e.g., to service asset-related debts), and therefore excludes a small portion of the amount appropriated each year by the legislature. Note*: FY 2012-2013 reflects a change in reporting expenditures from prior years due to the new carry-forward reporting requirement as reflected in the 2013-2014 SUS Operating Budget Reports. Since these expenditures will now include carry-forward expenditures, these data are no longer comparable to the current-year revenues reported in table 1A, or prior year expenditures in table 1B. This data is not adjusted for inflation. Instruction & Research: Includes expenditures for state services related to the instructional delivery system for advanced and professional education. Includes functions such as; all activities related to credit instruction that may be applied toward a postsecondary degree or certificate; non-project research and service performed to maintain professional effectives; individual or project research; academic computing support; academic source or curriculum development. Source: Operating Budget Summary - Expenditures by Program Activity (or Report 645). Administration & Support Services: Expenditures related to the executive direction and leadership for university operations and those internal management services which assist and support the delivery of academic programs. Source: Operating Budget Summary - Expenditures by Program Activity (or Report 645). PO&M: Plant Operations & Maintenance expenditures related to the cleaning and maintenance of existing grounds, the providing of utility services, and the planning and design of future plant expansion and modification. Student Services: Includes resources related to physical, psychological, and social well-being of the student. Includes student service administration, social and cultural development, counseling and career guidance, financial aid, and student admissions and records. Other: includes Institutes and Research Centers, Radio/TV, Museums and Galleries, Intercollegiate Athletics, Academic Infrastructure Support Organizations. Source: Operating Budget Summary - Expenditures by Program Activity (or Report 645).
19
Annual Accountability Report 2015-2016
FLORIDA STATE UNIVERSITY DRAFT
02/15/2017
Section 1 – Financial Resources (continued)
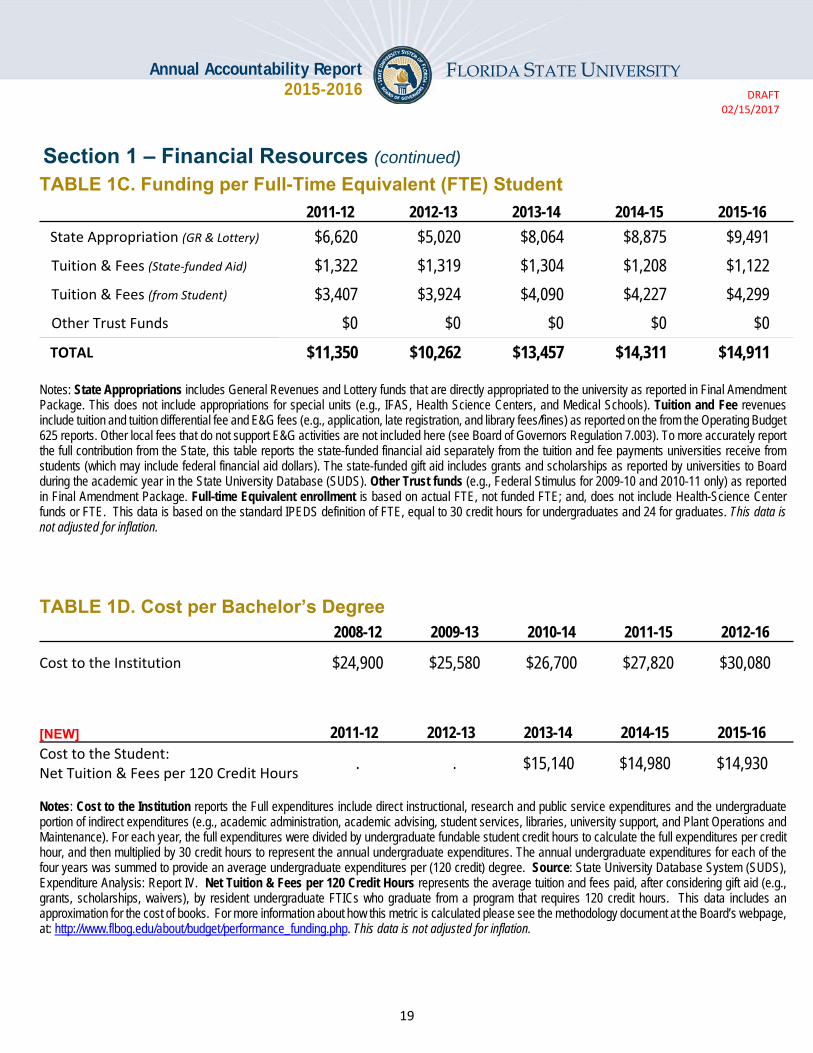
TABLE 1C. Funding per Full-Time Equivalent (FTE) Student
2011-12 2012-13 2013-14 2014-15 2015-16
State Appropriation (GR & Lottery) $6,620 $5,020 $8,064 $8,875 $9,491
Tuition & Fees (State‐funded Aid) $1,322 $1,319 $1,304 $1,208 $1,122
Tuition & Fees (from Student) $3,407 $3,924 $4,090 $4,227 $4,299
Other Trust Funds $0 $0 $0 $0 $0
TOTAL $11,350 $10,262 $13,457 $14,311 $14,911 Notes: State Appropriations includes General Revenues and Lottery funds that are directly appropriated to the university as reported in Final Amendment Package. This does not include appropriations for special units (e.g., IFAS, Health Science Centers, and Medical Schools). Tuition and Fee revenues include tuition and tuition differential fee and E&G fees (e.g., application, late registration, and library fees/fines) as reported on the from the Operating Budget 625 reports. Other local fees that do not support E&G activities are not included here (see Board of Governors Regulation 7.003). To more accurately report the full contribution from the State, this table reports the state-funded financial aid separately from the tuition and fee payments universities receive from students (which may include federal financial aid dollars). The state-funded gift aid includes grants and scholarships as reported by universities to Board during the academic year in the State University Database (SUDS). Other Trust funds (e.g., Federal Stimulus for 2009-10 and 2010-11 only) as reported in Final Amendment Package. Full-time Equivalent enrollment is based on actual FTE, not funded FTE; and, does not include Health-Science Center funds or FTE. This data is based on the standard IPEDS definition of FTE, equal to 30 credit hours for undergraduates and 24 for graduates. This data is not adjusted for inflation.
TABLE 1D. Cost per Bachelor’s Degree
2008-12 2009-13 2010-14 2011-15 2012-16
Cost to the Institution $24,900 $25,580 $26,700 $27,820 $30,080
[NEW] 2011-12 2012-13 2013-14 2014-15 2015-16 Cost to the Student: Net Tuition & Fees per 120 Credit Hours
. . $15,140 $14,980 $14,930
Notes: Cost to the Institution reports the Full expenditures include direct instructional, research and public service expenditures and the undergraduate portion of indirect expenditures (e.g., academic administration, academic advising, student services, libraries, university support, and Plant Operations and Maintenance). For each year, the full expenditures were divided by undergraduate fundable student credit hours to calculate the full expenditures per credit hour, and then multiplied by 30 credit hours to represent the annual undergraduate expenditures. The annual undergraduate expenditures for each of the four years was summed to provide an average undergraduate expenditures per (120 credit) degree. Source: State University Database System (SUDS), Expenditure Analysis: Report IV. Net Tuition & Fees per 120 Credit Hours represents the average tuition and fees paid, after considering gift aid (e.g., grants, scholarships, waivers), by resident undergraduate FTICs who graduate from a program that requires 120 credit hours. This data includes an approximation for the cost of books. For more information about how this metric is calculated please see the methodology document at the Board’s webpage, at: http://www.flbog.edu/about/budget/performance_funding.php. This data is not adjusted for inflation.

20
Annual Accountability Report 2015-2016
FLORIDA STATE UNIVERSITY DRAFT
02/15/2017
Section 1 – Financial Resources (continued)
TABLE 1E. University Other Budget Entities (Dollars in Millions) 2011-12 2012-13 2013-14 2014-15 2015-16 Auxiliary Enterprises Revenues $206,079,051 $235,018,302 $233,140,596 $254,030,999 $243,387,925 Expenditures $186,556,714 $200,517,708 $223,843,585 $229,449,828 $216,201,663 Contracts & Grants Revenues $208,789,835 $221,442,160 $220,266,986 $219,075,763 $195,088,260 Expenditures $188,083,314 $203,704,258 $218,985,033 $208,289,152 $190,657,096 Local Funds Revenues $229,060,800 $208,220,360 $219,368,902 $218,273,734 $253,479,193 Expenditures $208,904,815 $212,306,365 $222,065,185 $217,818,213 $235,823,408 Faculty Practice Plans Revenues $6,680,295 $9,137,413 $9,794,451 $8,755,338 $7,219,231 Expenditures $6,686,903 $9,115,388 $9,705,201 $8,755,569 $6,456,050 Notes: Revenues do not include transfers. Expenditures do not include non-operating expenditures. Auxiliary Enterprises are self-supported through fees, payments and charges. Examples include housing, food services, bookstores, parking services, health centers. Contract & Grants resources are received from federal, state or private sources for the purposes of conducting research and public service activities. Local Funds are associated with student activity (supported by the student activity fee), student financial aid, concessions, intercollegiate athletics, technology fee, green fee, and student life & services fee. Faculty Practice Plan revenues/receipts are funds generated from faculty practice plan activities. Faculty Practice Plan expenditures include all expenditures relating to the faculty practice plans, including transfers between other funds and/or entities. This may result in double counting in information presented within the annual report. Source: Operating Budget, Report 615. This data is not adjusted for inflation.
TABLE 1F. Voluntary Support of Higher Education
2011-12 2012-13 2013-14 2014-15 2015-16
Endowment Value ($1000s)
$497,708 $548,095 $624,557 $605,275 $584,529
Gifts Received ($1000s)
$55,929 $61,270 $55,725 $68,634 $75,413
Percentage of Alumni Donors
16% 18% 17% 17% 17%
Notes: Endowment value at the end of the fiscal year, as reported in the annual NACUBO Endowment Study. Gifts Received as reported in the Council for Aid to Education’s Voluntary Support of Education (VSE) survey in the section entitled “Gift Income Summary,” this is the sum of the present value of all gifts (including outright and deferred gifts) received for any purpose and from all sources during the fiscal year, excluding pledges and bequests. (There’s a deferred gift calculator at www.cae.org/vse.) The present value of non-cash gifts is defined as the tax deduction to the donor as allowed by the IRS. Percentage of Alumni Donors as reported in the Council for Aid to Education’s Voluntary Support of Education (VSE) survey in the section entitled “Additional Details,” this is the number of alumni donors divided by the total number of alumni, as of the end of the fiscal year. “Alumni,” as defined in this survey, include those holding a degree from the institution as well as those who attended the institution but did not earn a degree. This data is not adjusted for inflation.

21
Annual Accountability Report 2015-2016
FLORIDA STATE UNIVERSITY DRAFT
02/15/2017
Section 2 – Personnel
TABLE 2A. Personnel Headcount (in Fall term only)
2011 2012 2013 2014 2015 Full-time Employees
Tenured Faculty 769 783 770 770 778
Tenure‐track Faculty 214 238 256 286 290
Non‐Tenure Track Faculty 667 695 726 755 738
Instructors Without Faculty Status 0 0 0 0 0
Graduate Assistants/Associates 0 0 0 0 0
Non‐Instructional Employees 4,163 4,234 4,366 4,347 4,374
FULL‐TIME SUBTOTAL 5,813 5,950 6,118 6,158 6,180
Part-time Employees
Tenured Faculty 3 3 10 8 9
Tenure‐track Faculty 3 3 3 3 4
Non‐Tenure Track Faculty 445 487 505 461 478
Instructors Without Faculty Status 199 175 169 153 156
Graduate Assistants/Associates 3,033 2,982 2,994 3,011 3,027
Non‐Instructional Employees 84 107 84 86 91
PART‐TIME SUBTOTAL 3,767 3,757 3,765 3,722 3,765
TOTAL 9,580 9,707 9,883 9,880 9,945 Note: This table is based on the annual IPEDS Human Resources Survey, and provides full- and part-time medical and non-medical staff by faculty status and primary function/occupational activity. Tenured and Tenure-Track Faculty include those categorized within instruction, research, or public service. Non-Tenure Track Faculty includes adjunct faculty (on annual and less than annual contracts) and faculty on multi-year contracts categorized within instruction, research, or public service. Instructors Without Faculty Status includes postdoctoral research associates, and individuals hired as a staff member primarily to do research on a 3-year contract without tenure eligibility categorized within instruction, research, or public service. Non-Instructional Employees includes all executive, administrative and managerial positions regardless of faculty status; as well as, other support and service positions regardless of faculty status. Note: The universities vary on how they classify adjuncts (some include them as non-tenure track faculty while others do not consider them faculty and report them as instructors without faculty status) and part-time non-instructional employees.

22
Annual Accountability Report 2015-2016
FLORIDA STATE UNIVERSITY DRAFT
02/15/2017
Section 3 – Enrollment TABLE 3A. Headcount Enrollment by Student Type and Level
Fall 2011 Fall 2012 Fall 2013 Fall 2014 Fall 2015
TOTAL 41,557 41,226 41,311 41,737 41,427
UNDERGRADUATE
FTIC (Regular Admit) 22,692 22,795 23,070 23,396 23,361 FTIC (Profile Admit) 90 64 71 75 77 FCS AA Transfers 6,016 5,792 5,725 5,713 5,476 Other AA Transfers 381 388 421 395 391 Post-Baccalaureates 0 0 0 50 243 Other Undergraduates 2,571 2,857 2,850 2,954 2,860 Subtotal 31,750 31,896 32,137 32,583 32,408
GRADUATE
Master's 4,523 4,310 4,155 4,117 4,012 Research Doctoral 2,658 2,594 2,626 2,660 2,648 Professional Doctoral 1,269 1,235 1,254 1,190 1,154
Dentistry 0 0 0 0 0
Law 724 692 709 645 596 Medicine 476 476 481 482 483 Nursing Practice 69 67 64 63 75 Pharmacy 0 0 0 0 0
Physical Therapist 0 0 0 0 0
Veterinary Medicine 0 0 0 0 0
Other 0 0 0 0 0
Subtotal 8,450 8,139 8,035 7,967 7,814
UNCLASSIFIED
HS Dual Enrolled 20 39 23 53 36 Other 1,337 1,152 1,116 1,134 1,169 Subtotal 1,357 1,191 1,139 1,187 1,205
Note: This table reports the number of students enrolled at the university by student type categories. The student type for undergraduates is based on the Type of Student at Time of Most Recent Admission. The student type for graduates is based on the degree that is sought and the student CIP code. Unclassified refers to a student who has not yet been formally admitted into a degree program but is enrolled. The methodology for this table was revised at the June 2017 Data Administrator Workshop. The change improves how post-baccalaureate undergraduate students are counted.

23
Annual Accountability Report 2015-2016
FLORIDA STATE UNIVERSITY DRAFT
02/15/2017
Section 3 – Enrollment (continued) TABLE 3B. Full-Time Equivalent (FTE) Enrollment 2011‐12 2012‐13 2013‐14 2014‐15 2015‐16
RESIDENT FUNDABLE
LOWER 13,590 13,217 12,641 12,501 12,618 UPPER 15,543 15,561 15,542 15,513 14,960 MASTERS (GRAD I) 3,091 2,905 2,669 2,619 2,610 DOCTORAL (GRAD II) 2,687 2,586 2,637 2,585 2,577 TOTAL 34,912 34,269 33,489 33,217 32,764
NON‐RESIDENT FUNDABLE
LOWER 682 679 766 1,024 1,164 UPPER 625 657 830 790 922 MASTERS (GRAD I) 683 693 747 742 745 DOCTORAL (GRAD II) 952 973 975 990 997 TOTAL 2,942 3,002 3,318 3,546 3,829
TOTAL FUNDABLE
LOWER 14,272 13,896 13,408 13,526 13,782 UPPER 16,169 16,218 16,371 16,303 15,881 MASTERS (GRAD I) 3,774 3,599 3,416 3,360 3,355 DOCTORAL (GRAD II) 3,639 3,559 3,612 3,575 3,575 TOTAL 37,854 37,271 36,808 36,763 36,593
TOTAL NON‐FUNDABLE
LOWER 642 747 758 828 993 UPPER 732 765 909 902 957 MASTERS (GRAD I) 342 376 397 382 374 DOCTORAL (GRAD II) 18 21 28 21 13 TOTAL 1,734 1,908 2,092 2,133 2,338
TOTAL
LOWER 14,914 14,643 14,166 14,353 14,775 UPPER 16,900 16,982 17,280 17,205 16,839 MASTERS (GRAD I) 4,116 3,974 3,813 3,742 3,729 DOCTORAL (GRAD II) 3,657 3,580 3,641 3,596 3,588 TOTAL 39,587 39,179 38,900 38,897 38,931
Notes: Full-time Equivalent (FTE) student is a measure of instructional activity that is based on the number of credit hours that students enroll by course level. Note about Revision: This table now reports FTE based on the US definition, which divides undergraduate credit hours by 30 and graduate credit hours by 24. Courses are reported by Universities to the Board of Governors in the Student Instruction File (SIF) as either fundable or non-fundable. In general, student credit hours are considered ‘fundable’ if they can be applied to a degree, and the associated faculty was paid from State appropriations. Totals are actual and may not equal the sum of reported student levels due to rounding of student level FTE.
24
Annual Accountability Report 2015-2016
FLORIDA STATE UNIVERSITY DRAFT
02/15/2017
Section 3 – Enrollment (continued)
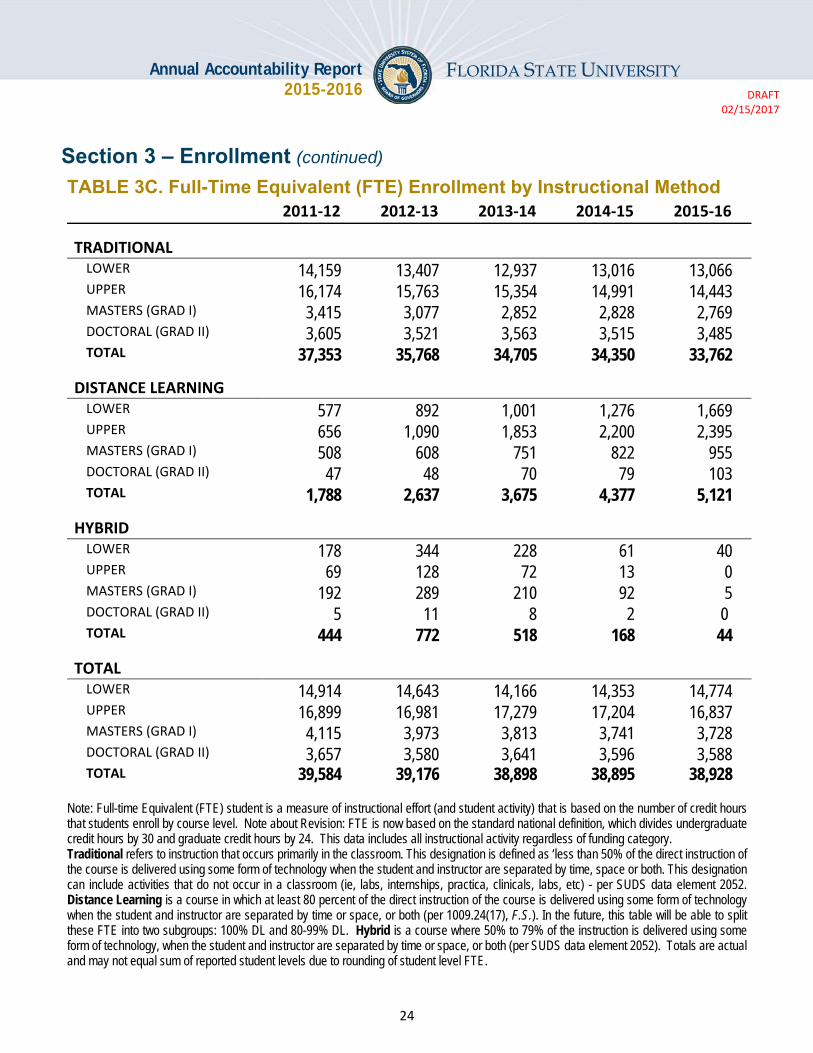
TABLE 3C. Full-Time Equivalent (FTE) Enrollment by Instructional Method 2011‐12 2012‐13 2013‐14 2014‐15 2015‐16
TRADITIONAL
LOWER 14,159 13,407 12,937 13,016 13,066 UPPER 16,174 15,763 15,354 14,991 14,443 MASTERS (GRAD I) 3,415 3,077 2,852 2,828 2,769 DOCTORAL (GRAD II) 3,605 3,521 3,563 3,515 3,485 TOTAL 37,353 35,768 34,705 34,350 33,762
DISTANCE LEARNING LOWER 577 892 1,001 1,276 1,669 UPPER 656 1,090 1,853 2,200 2,395 MASTERS (GRAD I) 508 608 751 822 955 DOCTORAL (GRAD II) 47 48 70 79 103 TOTAL 1,788 2,637 3,675 4,377 5,121
HYBRID
LOWER 178 344 228 61 40 UPPER 69 128 72 13 0 MASTERS (GRAD I) 192 289 210 92 5 DOCTORAL (GRAD II) 5 11 8 2 0 TOTAL 444 772 518 168 44
TOTAL LOWER 14,914 14,643 14,166 14,353 14,774 UPPER 16,899 16,981 17,279 17,204 16,837 MASTERS (GRAD I) 4,115 3,973 3,813 3,741 3,728 DOCTORAL (GRAD II) 3,657 3,580 3,641 3,596 3,588 TOTAL 39,584 39,176 38,898 38,895 38,928
Note: Full-time Equivalent (FTE) student is a measure of instructional effort (and student activity) that is based on the number of credit hours that students enroll by course level. Note about Revision: FTE is now based on the standard national definition, which divides undergraduate credit hours by 30 and graduate credit hours by 24. This data includes all instructional activity regardless of funding category. Traditional refers to instruction that occurs primarily in the classroom. This designation is defined as ‘less than 50% of the direct instruction of the course is delivered using some form of technology when the student and instructor are separated by time, space or both. This designation can include activities that do not occur in a classroom (ie, labs, internships, practica, clinicals, labs, etc) - per SUDS data element 2052. Distance Learning is a course in which at least 80 percent of the direct instruction of the course is delivered using some form of technology when the student and instructor are separated by time or space, or both (per 1009.24(17), F.S.). In the future, this table will be able to split these FTE into two subgroups: 100% DL and 80-99% DL. Hybrid is a course where 50% to 79% of the instruction is delivered using some form of technology, when the student and instructor are separated by time or space, or both (per SUDS data element 2052). Totals are actual and may not equal sum of reported student levels due to rounding of student level FTE.

25
Annual Accountability Report 2015-2016
FLORIDA STATE UNIVERSITY DRAFT
02/15/2017
Section 3 – Enrollment (continued)
TABLE 3D. Headcount Enrollment by Military Status and Student Level
Fall 2011 Fall 2012 Fall 2013 Fall 2014 Fall 2015
MILITARY Unclassified 31 25 16 19 12 Undergraduate 681 678 204 261 247 Master’s (GRAD 1) 151 163 99 116 113 Doctoral (GRAD 2) 27 28 10 27 24 Subtotal 890 894 329 423 396
DEPENDENTS Unclassified . . 14 11 13 Undergraduate . . 520 528 572 Master’s (GRAD 1) . . 68 68 66 Doctoral (GRAD 2) . . 11 13 11 Subtotal . . 613 620 662
NON-MILITARY Unclassified 1,326 1,166 1,101 1,157 1,180 Undergraduate 31,069 31,218 31,421 31,794 31,589 Master’s (GRAD 1) 5,853 5,589 5,536 4,957 4,789 Doctoral (GRAD 2) 2,419 2,359 2,311 2,786 2,811 Subtotal 40,667 40,332 40,369 40,694 40,369 TOTAL 41,557 41,226 41,311 41,737 41,427
Note: This table provides trend data on the number of students enrolled based on their military status. Military includes students who were classified as Active Duty, Veterans, National Guard, or Reservist. Eligible Dependents includes students who were classified as eligible dependents (dependents who received veteran’s benefits). Non-Military includes all other students.
TABLE 3E. University Access Rate: Undergraduate Enrollment with Pell Grant
Fall 2011 Fall 2012 Fall 2013 Fall 2014 Fall 2015
Pell Grant Recipients 9,441 9,674 9,525 9,133 8,793
Percent with Pell Grant 30.0% 30.7% 30.0% 28.4% 27.7%
Note: This table reports the University’s Access Rate, which is a measure of the percentage of undergraduate students who have received a federal Pell grant award during a given Fall term. The top row reports the number of students who received a Pell Grant award. The bottom row provides the percentage of eligible students that received a Pell Grant award. This metric is included in the Board of Governors Performance Based Funding Model – for more information see: http://www.flbog.edu/about/budget/performance_funding.php.
26
Annual Accountability Report 2015-2016
FLORIDA STATE UNIVERSITY DRAFT
02/15/2017
Section 4 – Undergraduate Education
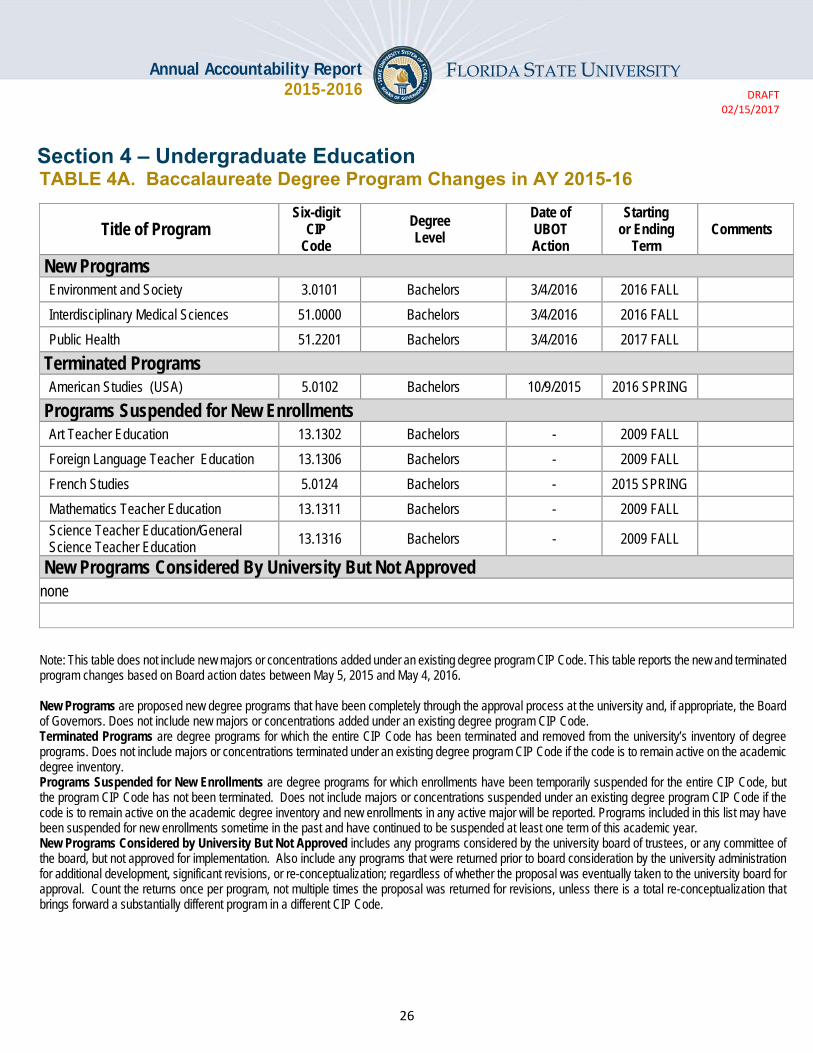
TABLE 4A. Baccalaureate Degree Program Changes in AY 2015-16
Title of Program
Six-digit
CIP
Code
Degree
Level
Date of
UBOT
Action
Starting
or Ending
Term
Comments
New Programs
Environment and Society 3.0101 Bachelors 3/4/2016 2016 FALL
Interdisciplinary Medical Sciences 51.0000 Bachelors 3/4/2016 2016 FALL
Public Health 51.2201 Bachelors 3/4/2016 2017 FALL
Terminated Programs
American Studies (USA) 5.0102 Bachelors 10/9/2015 2016 SPRING
Programs Suspended for New Enrollments
Art Teacher Education 13.1302 Bachelors - 2009 FALL
Foreign Language Teacher Education 13.1306 Bachelors - 2009 FALL
French Studies 5.0124 Bachelors - 2015 SPRING
Mathematics Teacher Education 13.1311 Bachelors - 2009 FALL
Science Teacher Education/General Science Teacher Education
13.1316 Bachelors - 2009 FALL
New Programs Considered By University But Not Approved
none
Note: This table does not include new majors or concentrations added under an existing degree program CIP Code. This table reports the new and terminated program changes based on Board action dates between May 5, 2015 and May 4, 2016. New Programs are proposed new degree programs that have been completely through the approval process at the university and, if appropriate, the Board of Governors. Does not include new majors or concentrations added under an existing degree program CIP Code. Terminated Programs are degree programs for which the entire CIP Code has been terminated and removed from the university’s inventory of degree programs. Does not include majors or concentrations terminated under an existing degree program CIP Code if the code is to remain active on the academic degree inventory. Programs Suspended for New Enrollments are degree programs for which enrollments have been temporarily suspended for the entire CIP Code, but the program CIP Code has not been terminated. Does not include majors or concentrations suspended under an existing degree program CIP Code if the code is to remain active on the academic degree inventory and new enrollments in any active major will be reported. Programs included in this list may have been suspended for new enrollments sometime in the past and have continued to be suspended at least one term of this academic year. New Programs Considered by University But Not Approved includes any programs considered by the university board of trustees, or any committee of the board, but not approved for implementation. Also include any programs that were returned prior to board consideration by the university administration for additional development, significant revisions, or re-conceptualization; regardless of whether the proposal was eventually taken to the university board for approval. Count the returns once per program, not multiple times the proposal was returned for revisions, unless there is a total re-conceptualization that brings forward a substantially different program in a different CIP Code.

27
Annual Accountability Report 2015-2016
FLORIDA STATE UNIVERSITY DRAFT
02/15/2017
Section 4 – Undergraduate Education (continued)
TABLE 4B. Full-time, First-Time-in-College (FTIC) Retention Rates Retained in the Second Fall Term at Same University
2011-12 2012-13 2013-14 2014-15 2015-16 Cohort Size 6,149 5,749 6,096 6,068 6,036
% Retained with Any GPA
91% 91% 92% 93% 93%
% Retained with GPA 2.0 or higher
88.8% 89.4% 90.5% 91.0% 90.4%
Notes: Cohorts are based on undergraduate students who enter the institution in the Fall term (or Summer term and continue into the Fall term). Percent Retained with Any GPA is based on student enrollment in the Fall term following their first year. Percent Retained with GPA Above 2.0 is based on student enrollment in the Fall term following their first years for those students with a GPA of 2.0 or higher at the end of their first year (Fall, Spring, Summer). The most recent year of Retention data is based on preliminary data (SIFP file) that is comparable to the final data (SIF file) but may be revised in the following years based on changes in student cohorts. The ‘Percent Retained with GPA Above 2.0’ is also known as the ‘Academic Progress Rate’ and is included in the Board of Governors Performance Based Funding Model – for more information see: http://www.flbog.edu/about/budget/performance_funding.php.
TABLE 4C. Full-time, First-Time-in-College (FTIC) Six-Year Graduation Rates
Term of Entry 2006-12 2007-13 2008-14 2009-15 2010-16
Cohort Size 6,191 6,104 4,993 5,925 5,957
% Graduated 75% 77% 79% 79% 80%
% Still Enrolled 2% 2% 2% 2% 1%
% Success Rate 77% 79% 81% 81% 81% Notes: Cohorts are based on FTIC undergraduate students who enter the institution in the Fall term (or Summer term and continue into the Fall term). Percent Graduated reports the percent of FTICs who graduated from the same institution within six years. This metric does not include students who enrolled as part-time students (in their first year), or who transfer into the institution. This metric complies with the requirements of the federal Student Right to Know Act that requires institutions to report the completion status at 150% of normal time (or six years). Success Rate measures the percentage of an initial cohort of students who have either graduated or are still enrolled at the same university. This data should match the IPEDS Graduation Rate Survey data that is due in late February.

28
Annual Accountability Report 2015-2016
FLORIDA STATE UNIVERSITY DRAFT
02/15/2017
Section 4 – Undergraduate Education (continued) TABLE 4D. Graduation Rates for First-Time-in-College (FTIC) Students (includes Full- and Part-time students)
4 – Year Rates (Full-time only) 2008-12 2009-13 2010-14 2011-15 2012-16 Cohort Size 4,993 5,925 5,957 6,149 5,749
Same University 61% 62% 61% 62% 65%
Other University in SUS 2% 2% 2% 2% 2%
Total from System 64% 63% 63% 64% 67%
6 – Year Rates (Full- & Part-time) 2006-12 2007-13 2008-14 2009-15 2010-16 Cohort Size 6,232 6,162 5,023 5,936 5,970
Same University 74.9% 76.7% 79.0% 79.3% 80.0%
Other University in SUS 5% 5% 5% 4% 4%
Total from System 80% 82% 84% 84% 84%
Notes: Cohorts are based on undergraduate students who enter the institution in the Fall term (or Summer term and continue into the Fall term). First-time-in-college (FTIC) cohort is defined as undergraduates entering in fall term (or summer continuing to fall) with fewer than 12 hours earned after high school graduation. Full-time (FT) and Part-time (PT) status refers to the credit load during the student’s first Fall semester freshmen year. The initial cohorts can be revised to remove students, who have allowable exclusions as defined by IPEDS, from the cohort. FTIC students who are enrolled in advanced graduate degree programs that do not award a Bachelor’s degree are removed from the cohorts. Graduates are students in the cohort who have graduated by the summer term in their fourth or sixth year. Degree data often includes 'late degrees' which are degrees that were awarded in a previous term, but reported to SUDS later; so, the most recent year of data in this table only provides a snapshot of graduation rate data that may change with the addition of “late degrees”. Late degrees reported in conjunction with the IPEDS Graduation Rate Survey due in mid-February will be reflected in the following year. Same University provides graduation rates for students in the cohort who graduated from the same institution. Other University in SUS provides graduation rates for students in the cohort who graduated from a different State University System of Florida institution. These data do not report students in the cohort who did not graduate from the SUS, but did graduate from another institution outside the State University System of Florida. The six-year graduation rate from the same university is included in the Board of Governors Performance Based Funding Model – for more information see: http://www.flbog.edu/about/budget/performance_funding.php.

29
Annual Accountability Report 2015-2016
FLORIDA STATE UNIVERSITY DRAFT
02/15/2017
Section 4 – Undergraduate Education (continued)
TABLE 4E. Graduation Rates for AA Transfer Students from Florida College System
Two – Year Rates 2010-12 2011-13 2012-14 2013-15 2014-16 Cohort Size 1,894 1,892 1,739 1,787 1,748
Same University 41% 39% 39% 40% 42%
Four – Year Rates 2008-12 2009-13 2010-14 2011-15 2012-16 Cohort Size 1,542 1,956 1,894 1,892 1,739
Same University 80% 79% 76% 74% 74% Notes: AA Transfer cohort is defined as undergraduates entering in the fall term (or summer continuing to fall) and having earned an AA degree from an institution in the Florida College System. For comparability with FTIC cohorts, AA Transfer cohorts are based on undergraduate students who enter the institution in the Fall term (or Summer term and continue into the Fall term) and graduate from the same institution within two or four years.
TABLE 4F. Graduation Rates for Other Transfer Students
5 – Year Rates 2007-12 2008-13 2009-14 2010-15 2011-16 Cohort Size 756 330 687 657 737
Same University 79% 78% 79% 80% 78%
Notes: Other Transfer Students includes undergraduate students that transfer into a university who are not FTICs or AA Transfers. Cohorts are based on undergraduate students who enter the institution in the Fall term (or Summer term and continue into the Fall term) and graduate from the same institution within five years.

30
Annual Accountability Report 2015-2016
FLORIDA STATE UNIVERSITY DRAFT
02/15/2017
Section 4 – Undergraduate Education (continued)
TABLE 4G. Baccalaureate Degrees Awarded
2011-12 2012-13 2013-14 2014-15 2015-16 First Majors 7,860 7,938 8,105 8,421 8,626
Second Majors 1,187 1,142 1,315 1,186 1,174
TOTAL 9,047 9,080 9,420 9,607 9,800
Note: This table reports the number of degrees awarded by academic year. First Majors include the most common scenario of one student earning one degree in one Classification of Instructional Programs (CIP) code. In those cases where a student earns a baccalaureate degree under two different degree CIPs, a distinction is made between “dual degrees” and “dual majors.” Also included in first majors are “dual degrees” which are counted as separate degrees (e.g., counted twice). In these cases, both degree CIPs receive a “degree fraction” of 1.0. Second Majors include all dual/second majors (e.g., degree CIP receive a degree fraction that is less than 1). The calculation of degree fractions is made according to each institution’s criteria. The calculation for the number of second majors rounds each degree CIP’s fraction of a degree up to 1 and then sums the total. Second Majors are typically used when providing degree information by discipline/CIP, to better conveys the number of graduates who have specific skill sets associated with each discipline.
TABLE 4H. Baccalaureate Degrees in Programs of Strategic Emphasis (PSE) [Includes Second Majors]
2011-12 2012-13 2013-14 2014-15 2015-16
STEM 1,303 1,473 1,574 1,784 2,095
HEALTH 305 320 260 309 275
GLOBALIZATION 587 576 558 533 532
EDUCATION 290 271 267 252 266
GAP ANALYSIS 832 840 876 875 1,031
SUBTOTAL 3,317 3,480 3,535 3,753 4,199
PSE PERCENT OF TOTAL 36.7% 38.3% 37.5% 39.1% 42.8% Notes: This is a count of baccalaureate majors for specific Programs of Strategic Emphasis, as determined by the Board of Governors staff with consultation with business and industry groups and input from universities. This is a count of baccalaureate degrees awarded within specific Programs of Strategic Emphasis, as determined by the Board of Governors staff with consultation with business and industry groups and input from universities – for more information see: http://www.flbog.edu/pressroom/strategic_emphasis/. The Board of Governors revised the list of Programs of Strategic Emphasis in November 2013, and the new categories were applied to the historical degrees. A student who has multiple majors in the subset of targeted Classification of Instruction Program codes will be counted twice (i.e., double-majors are included).

31
Annual Accountability Report 2015-2016
FLORIDA STATE UNIVERSITY DRAFT
02/15/2017
Section 4 – Undergraduate Education (continued)
TABLE 4I. Baccalaureate Degrees Awarded to Underrepresented Groups
2011-12 2012-13 2013-14 2014-15 2015-16
Non-Hispanic Black
Number of Degrees 788 735 756 733 672
Percentage of Degrees 10% 10% 10% 9% 8%
Hispanic
Number of Degrees 1,020 1,155 1,240 1,355 1,541
Percentage of Degrees 13% 15% 16% 17% 18%
Pell-Grant Recipients
Number of Degrees 2,894 3,147 3,291 3,356 3,225
Percentage of Degrees 37% 40% 41% 40% 38% Note: Non-Hispanic Black and Hispanic do not include students classified as Non-Resident Alien or students with a missing race code. Students who earn two distinct degrees in the same term are counted twice – whether their degrees are from the same six-digit CIP code or different CIP codes. Students who earn only one degree are counted once – even if they completed multiple majors or tracks. Percentage of Degrees is based on the number of baccalaureate degrees awarded to non-Hispanic Black and Hispanic students divided by the total degrees awarded - excluding those awarded to non-resident aliens and unreported. Pell-Grant recipients are defined as those students who have received a Pell grant from any SUS Institution within six years of graduation - excluding those awarded to non-resident aliens, who are only eligible for Pell grants in special circumstances. Percentage of Degrees is based on the number of baccalaureate degrees awarded to Pell recipients, as shown above, divided by the total degrees awarded - excluding those awarded to non-resident aliens. Notes on Trends: In 2007, the US Department of Education re-classified the taxonomy for self-reported race/ethnicity categories and allowed universities a two-year phase-in process before all institutions were required to report based on the new categories for the 2011-12 academic year. This reclassification will impact trends.

32
Annual Accountability Report 2015-2016
FLORIDA STATE UNIVERSITY DRAFT
02/15/2017
Section 4 – Undergraduate Education (continued) TABLE 4J. Baccalaureate Degrees Without Excess Credit Hours
2011-12* 2012-13 2013-14 2014-15 2015-16 FTIC 76% 75% 68% 79% 80%
AA Transfers 79% 72% 66% 76% 77%
Other Transfers 82% 81% 77% 80% 78%
TOTAL 77.8% 75.1% 73.9% 78.2% 78.7% Notes: This table is based on statute 1009.286 (see link), and excludes certain types of student credits (e.g., accelerated mechanisms, remedial coursework, non-native credit hours that are not used toward the degree, non-native credit hours from failed, incomplete, withdrawn, or repeated courses, credit hours from internship programs, credit hours up to 10 foreign language credit hours for transfer students in Florida, and credit hours earned in military science courses that are part of the Reserve Officers’ Training Corps (ROTC) program). This metric is not the same as the Excess Hours Surcharge, which has multiple cohorts with varying fee rates. This table reports the percentage of baccalaureate degrees awarded within 110% of the catalog hours required for a degree based on the Board of Governors Academic Program Inventory. This calculation is based on Hours To Degree data submitted by universities to the Board of Governors which excludes those who previously earned a baccalaureate degree. Note*: Improvements were made to data collection process beginning with 2012-13 data to better account for high school dual enrolled credits that are exempt from the excess hour calculation. Also, 2012-13 data marked a slight methodological change in how the data is calculated. Each CIP code’s required number of ‘catalog hours’ was switched to the officially approved hours as reported within the Board of Governors’ Academic Program Inventory – instead of the catalog hours reported by the university on the HTD files.
TABLE 4K. Undergraduate Course Offerings
Fall 2011 Fall 2012 Fall 2013 Fall 2014 Fall 2015
Number of Course Sections
3,764 3,836 3,318 3,217 3,421
Percentage of Undergraduate Course Sections by Class Size Fewer than 30 Students 64% 65% 62% 63% 63%
30 to 49 Students 21% 21% 23% 21% 19%
50 to 99 Students 10% 8% 9% 9% 11%
100 or More Students 6% 6% 6% 7% 7%
Notes: This data is based on Common Data Set (CDS) definitions. According to CDS, a “class section is an organized course offered for credit, identified by discipline and number, meeting at a stated time or times in a classroom or similar setting, and not a subsection such as a laboratory or discussion session. Undergraduate class sections are defined as any sections in which at least one degree-seeking undergraduate student is enrolled for credit. Exclude distance learning classes and noncredit classes and individual instruction such as dissertation or thesis research, music instruction, or one-to-one readings. Exclude students in independent study, co-operative programs, internships, foreign language taped tutor sessions, practicums, and all students in one-on-one classes.

33
Annual Accountability Report 2015-2016
FLORIDA STATE UNIVERSITY DRAFT
02/15/2017
Section 4 – Undergraduate Education (continued)
TABLE 4L. Percentage of Undergraduate Credit Hours Taught by Instructor Type
2011-12 2012-13 2013-14 2014-15 2015-16 Faculty 58% 60% 61% 63% 63% Adjunct Faculty 12% 11% 12% 10% 10% Graduate Students 28% 28% 26% 25% 25% Other Instructors 2% 2% 2% 2% 2% Note: The total number of undergraduate state fundable credit hours taught will be divided by the undergraduate credit hours taught by each instructor type to create a distribution of the percentage taught by each instructor type. Four instructor types are defined as faculty (pay plans 01, 02, and 22), OPS faculty (pay plan 06), graduate student instructors (pay plan 05), and others (all other pay plans). If a course has more than one instructor, then the university’s reported allocation of section effort will determine the allocation of the course’s total credit hours to each instructor. The definition of faculty varies for Tables 4L, 4M and 4N. For Faculty Teaching Undergraduates, the definition of faculty is based on pay plans 01, 02, and 22.
TABLE 4M. Student/Faculty Ratio
Fall 2011 Fall 2012 Fall 2013 Fall 2014 Fall 2015
Ratio 27 26 26 26 25
Note: This data is based on Common Data Set (CDS) definitions. This is the Fall ratio of full-time equivalent students (full-time plus 1/3 part time) to full-time equivalent instructional faculty (full time plus 1/3 part time). The ratio calculations exclude both faculty and students in stand-alone graduate or professional programs such as medicine, law, veterinary, dentistry, social work, business, or public health in which faculty teach virtually only graduate-level students. Undergraduate or graduate student teaching assistants are not counted as faculty.
TABLE 4N. Professional Licensure/Certification Exams for Undergraduates
Nursing: National Council Licensure Examination for Registered Nurses
2011 2012 2013 2014 2015 Examinees 108 110 121 110 107
First‐time Pass Rate 95% 96% 88% 80% 95% National Benchmark 89% 92% 85% 85% 87%
Note: Pass rate for first-time examinees for the National Council Licensure Examination for Registered Nurses (NCLEX-RN) are based on the performance of graduates of baccalaureate nursing programs. National benchmark data is based on Jan-Dec NCLEX-RN results for first-time examinees from students in US-educated baccalaureate degree programs as published by the National Council of State Boards of Nursing.

34
Annual Accountability Report 2015-2016
FLORIDA STATE UNIVERSITY DRAFT
02/15/2017
Section 4 – Undergraduate Education (continued)
TABLE 4O. Post-Graduation Metrics
Percent of Bachelor’s Graduates Employed or Continuing their Education, One Year After Graduation
2010-11 2011-12 2012-13 2013-14 2014-15 Employed ($25,000+) or Enrolled n/a n/a 60.3% 60.8% 63.7%
Employed (Full‐time) or Enrolled 63% 63% 70% 70% 72% Percent Found 88% 86% 90% 91% 92% Number of States/Districts Searched 1 36 38 39 41
Notes: Enrolled or Employed (Earning $25,000+) is based on the number of recent baccalaureate graduates who are either employed, and earning at least $25,000, or continuing their education within one year after graduation. Enrolled or Employed Full-Time is based on the number of recent baccalaureate graduates who are either employed full-time or continuing their education within one year after graduation. Full-time employment is based on those who earned at least as much as a full-time (40hrs a week) worker making minimum wage in Florida. The employed data includes non-Florida data that is available from the Wage Record Interchange System 2 (known as “WRIS 2”) and Federal employee data that is available from the Federal Employment Data Exchange System (FEDES) initiative. Military employment data was collected by the Board of Governors staff from university staff. Due to limitations in the data, the continuing enrollment data includes any enrollment the following year regardless of whether the enrollment was post-baccalaureate or not. Percent Found refers to the percentage of graduates found in the dataset – including those that did not earn wages above the full-time threshold and those who were found outside of the one-year window. For more information about the methodology see: http://www.flbog.edu/about/budget/performance_funding.php. For more information about WRIS2 see: http://www.doleta.gov/performance/wris_2.cfm. For more information about FEDES see: http://www.ubalt.edu/jfi/fedes/.
Median Wages of Bachelor’s Graduates Employed Full-time, One Year After Graduation
2010-11 2011-12 2012-13 2013-14* 2014-15* 5th PERCENTILE WAGE $17,000 $17,300 $17,900 $18,200 $18,700
25th PERCENTILE WAGE $22,700 $23,200 $24,200 $25,400 $26,600
MEDIAN WAGE $30,100 $30,300 $31,600 $34,200 $35,700
75th PERCENTILE WAGE $39,100 $38,800 $41,200 $45,200 $47,800
95th PERCENTILE WAGE $56,000 $54,500 $59,800 $63,500 $68,900 Percent Found 39% 37% 40% 49% 50% Number of States/Districts Searched 1 1 1 39 41
Notes: Median Wage data is based on annualized Unemployment Insurance (UI) wage data for those graduates who earned at least as much as a full-time employee making minimum wage in the fiscal quarter a full year after graduation. This UI wage data does not include individuals who are self-employed, employed out of state, employed by the military or federal government, or those without a valid social security number. This wage data includes graduates who were both employed and enrolled. Wages rounded to nearest hundreds. Percent Found refers to the percentage of graduates found in the dataset – including those that did not earn wages above the full-time threshold and those who were found outside of the one-year window. Note*: The Board approved a change to this metric that uses wage data from all states that participate in the Wage Record Interchange System 2 (known as “WRIS 2”). This methodology change applies only to the wages for 2013-14 and 2014-15 baccalaureate recipients.

35
Annual Accountability Report 2015-2016
FLORIDA STATE UNIVERSITY DRAFT
02/15/2017
Section 5 – Graduate Education TABLE 5A. Graduate Degree Program Changes in AY 2015-16
Title of Program
Six-digit
CIP
Code
Degree
Level
Date of
UBOT
Action
Starting
or Ending
Term
Date of
Board of
Governors Action
New Programs
Business Law 22.0205 Masters 3/4/2016 2016 FALL
Physician Assistant Practice 51.0912 Masters 6/26/2015 2017 FALL
Terminated Programs
American Studies (USA) 05.0102 Masters 10/9/2015 2016 SPRING
Chemical Physics 40.0508 Masters 10/9/2015 2016 SPRING
Chemical Physics 40.0508 Research Doctorate 1/21/2016 2016 SPRING 1/21/2016
Research & Evaluation Methods 13.0601 Masters 10/9/2015 2016 SPRING
Research & Evaluation Methods 13.0601 Research Doctorate 1/21/2016 2016 SPRING 1/21/2016
Kinesiology and Exercise Science 31.0505 Specialist 6/26/2015 2015 FALL
Speech Pathology and Audiology 51.0204 Advanced Masters 10/9/2015 2016 SPRING
Programs Suspended for New Enrollments
Anthropology 45.0201 Research Doctorate - 2009 FALL
Apparel and Textiles, General 19.0901 Masters - 2010 FALL
Counselor Education/School Counseling and Guidance Services
13.1101 Masters - 2009 FALL
Educational/Instructional Technology 13.0501 Specialist - 2008 SPRING
Social Sciences, General 45.0101 Masters - 2007 SPRING
Vocational Rehabilitation Counseling/Counselor
51.2310 Research Doctorate - 2009 FALL
Vocational Rehabilitation Counseling/Counselor
51.2310 Specialist - 2011 FALL
Note: This table does not include new majors or concentrations added under an existing degree program CIP Code. This table reports the new and terminated program changes based on Board action dates between May 5, 2015 and May 4, 2016. New Programs are proposed new degree programs that have been completely through the approval process at the university and, if appropriate, the Board of Governors. Does not include new majors or concentrations added under an existing degree program CIP Code. Terminated Programs are degree programs for which the entire CIP Code has been terminated and removed from the university’s inventory of degree programs. Does not include majors or concentrations terminated under an existing degree program CIP Code if the code is to remain active on the academic degree inventory. Programs Suspended for New Enrollments are degree programs for which enrollments have been temporarily suspended for the entire CIP Code, but the program CIP Code has not been terminated. Does not include majors or concentrations suspended under an existing degree program CIP Code if the code is to remain active on the academic degree inventory and new enrollments in any active major will be reported. Programs included in this list may have been suspended for new enrollments sometime in the past and have continued to be suspended at least one term of this academic year.

36
Annual Accountability Report 2015-2016
FLORIDA STATE UNIVERSITY DRAFT
02/15/2017
Section 5 – Graduate Education (continued) TABLE 5B. Graduate Degrees Awarded
2011-12 2012-13 2013-14 2014-15 2015-16
First Majors 3,051 3,104 2,927 3,019 2,833 Second majors 0 0 0 0 0
TOTAL 3,051 3,104 2,927 3,019 2,833 Masters and Specialist (1st majors) 2,201 2,368 2,114 2,202 2,117 Research Doctoral (1st majors) 428 370 410 424 386 Professional Doctoral (1st majors) 422 366 403 393 330
Dentistry 0 0 0 0 0 Law 288 239 262 259 190 Medicine 118 112 115 114 120 Nursing Practice 16 15 26 20 20 Pharmacy 0 0 0 0 0 Physical Therapist 0 0 0 0 0 Veterinary Medicine 0 0 0 0 0 Other Professional Doctorate 0 0 0 0 0
Note: This table reports the total number of graduate level degrees that were awarded by academic year as well as the number by level. The table provides a breakout for some of the Professional Doctoral degrees.
TABLE 5C. Graduate Degrees Awarded in Areas of Strategic Emphasis [Includes Second Majors]
2011-12 2012-13 2013-14 2014-15 2015-16
STEM 447 475 440 536 568
HEALTH 269 279 291 258 263
GLOBALIZATION 95 89 61 78 54
EDUCATION 256 251 254 243 259
GAP ANALYSIS 93 88 81 152 159
SUBTOTAL 1,160 1,182 1,127 1,267 1,303
PSE PERCENT OF TOTAL 38.0% 38.1% 38.5% 42.0% 46.0% Notes: This is a count of graduate degrees awarded within specific Areas of Strategic Emphasis, as determined by the Board of Governors staff with consultation with business and industry groups and input from universities. This is a count of graduate degrees awarded within specific Programs of Strategic Emphasis, as determined by the Board of Governors staff with consultation with business and industry groups and input from universities – for more information see: http://www.flbog.edu/pressroom/strategic_emphasis/. The Board of Governors revised the list of Programs of Strategic Emphasis in November 2013, and the new categories were applied to the historical degrees. A student who has multiple majors in the subset of targeted Classification of Instruction Program codes will be counted twice (i.e., double-majors are included). Note: The denominator used in the percentage includes second majors.

37
Annual Accountability Report 2015-2016
FLORIDA STATE UNIVERSITY DRAFT
02/15/2017
Section 5 – Graduate Education (continued) TABLE 5D. Professional Licensure Exams for Graduate Programs
Law: Florida Bar Exam
2012 2013 2014 2015 2016
Examinees 245 213 227 210 172 First‐time Pass Rate 88% 88% 82% 80% 78% State Benchmark 81% 80% 74% 69% 66%
Medicine: US Medical Licensing Exam - Step 1 (for 2nd year MD students)
2012 2013 2014 2015 2016
Preliminary Examinees 118 115 118 120 114 First‐time Pass Rate 92% 96% 95% 92% 97% National Benchmark 96% 97% 96% 96% 96%
Medicine: US Medical Licensing Exam - Step 2 Clinical Knowledge (for 4th year MD students)
2011-12 2012-13 2013-14 2014-15
2015-16 Preliminary
Examinees 117 114 115 116 120 First‐time Pass Rate 100% 99% 100% 97% 94% National Benchmark 98% 98% 97% 95% 96%
Medicine: US Medical Licensing Exam - Step 2 Clinical Skills (for 4th year MD students)
2011-12 2012-13 2013-14 2014-15
2015-16 Preliminary
Examinees 117 114 115 116 120 First‐time Pass Rate 100% 99% 95% 92% 99% National Benchmark 97% 98% 96% 96% 97% Note on State & National Benchmarks: Florida Bar exam pass rates are reported online by the Florida Board of Bar Examiners. Law exam data is based on Feb. and July administrations every calendar year. The State benchmark excludes non-Florida institutions. The USMLE national exam pass rates, for the MD degree from US institutions, is reported online by the National Board of Medical Examiners (NBME). The NAVLE national exam pass rate is reported online by the National Board of Veterinary Medical Examiners (NBVME).
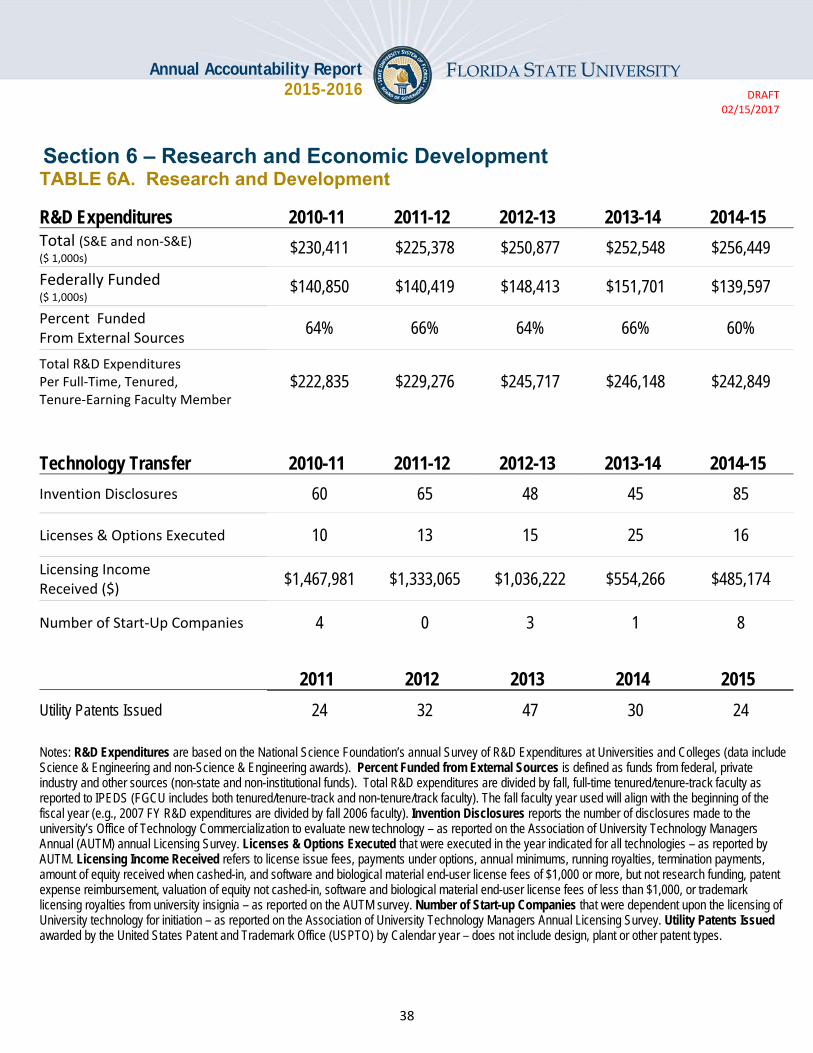
38
Annual Accountability Report 2015-2016
FLORIDA STATE UNIVERSITY DRAFT
02/15/2017
Section 6 – Research and Economic Development
TABLE 6A. Research and Development
R&D Expenditures 2010-11 2011-12 2012-13 2013-14 2014-15
Total (S&E and non‐S&E) ($ 1,000s)
$230,411 $225,378 $250,877 $252,548 $256,449
Federally Funded ($ 1,000s)
$140,850 $140,419 $148,413 $151,701 $139,597
Percent Funded From External Sources
64% 66% 64% 66% 60%
Total R&D Expenditures Per Full‐Time, Tenured, Tenure‐Earning Faculty Member
$222,835
$229,276
$245,717
$246,148
$242,849
Technology Transfer 2010-11 2011-12 2012-13 2013-14 2014-15
Invention Disclosures 60 65 48 45 85
Licenses & Options Executed 10 13 15 25 16
Licensing Income Received ($)
$1,467,981 $1,333,065 $1,036,222 $554,266 $485,174
Number of Start‐Up Companies 4 0 3 1 8
2011 2012 2013 2014 2015
Utility Patents Issued 24 32 47 30 24
Notes: R&D Expenditures are based on the National Science Foundation’s annual Survey of R&D Expenditures at Universities and Colleges (data include Science & Engineering and non-Science & Engineering awards). Percent Funded from External Sources is defined as funds from federal, private industry and other sources (non-state and non-institutional funds). Total R&D expenditures are divided by fall, full-time tenured/tenure-track faculty as reported to IPEDS (FGCU includes both tenured/tenure-track and non-tenure/track faculty). The fall faculty year used will align with the beginning of the fiscal year (e.g., 2007 FY R&D expenditures are divided by fall 2006 faculty). Invention Disclosures reports the number of disclosures made to the university’s Office of Technology Commercialization to evaluate new technology – as reported on the Association of University Technology Managers Annual (AUTM) annual Licensing Survey. Licenses & Options Executed that were executed in the year indicated for all technologies – as reported by AUTM. Licensing Income Received refers to license issue fees, payments under options, annual minimums, running royalties, termination payments, amount of equity received when cashed-in, and software and biological material end-user license fees of $1,000 or more, but not research funding, patent expense reimbursement, valuation of equity not cashed-in, software and biological material end-user license fees of less than $1,000, or trademark licensing royalties from university insignia – as reported on the AUTM survey. Number of Start-up Companies that were dependent upon the licensing of University technology for initiation – as reported on the Association of University Technology Managers Annual Licensing Survey. Utility Patents Issued awarded by the United States Patent and Trademark Office (USPTO) by Calendar year – does not include design, plant or other patent types.

39
Annual Accountability Report 2015-2016
FLORIDA STATE UNIVERSITY DRAFT
02/15/2017
Section 6 – Research and Economic Development (continued) TABLE 6B. Centers of Excellence
Name of Center: Center of Excellence in Advanced Materials Cumulative
(since inception
to June 2016)
Fiscal Year
2015-16 Year Created: 2007
Research Effectiveness
Only includes data for activities directly associated with the Center. Does not include the non-Center activities for faculty who are associated with the Center.
Number of Competitive Grants Applied For 244 13
Value of Competitive Grants Applied For ($) $208,721,922 $5,116,883
Number of Competitive Grants Received 221 8
Value of Competitive Grants Received ($) $29,937,101 $1,784,452
Total Research Expenditures ($) $29,591,832 $2,324,272
Number of Publications in Refereed Journals From Center Research
251 39
Number of Invention Disclosures 36 3
Number of Licenses/Options Executed 3 0
Licensing Income Received ($) $34,500 $7,500
Collaboration Effectiveness
Only reports on relationships that include financial or in-kind support.
Collaborations with Other Postsecondary Institutions 31 2
Collaborations with Private Industry 60 0
Collaborations with K-12 Education Systems/Schools 72 0
Undergraduate and Graduate Students Supported with Center Funds
482 87
Economic Development Effectiveness
Number of Start-Up companies with a physical presence, or employees, in Florida
6 1
Jobs Created By Start-Up Companies
Associated with the Center 33 8
Specialized Industry Training and Education 16 0 Private-sector Resources Used to Support the Center's Operations
$0 $0
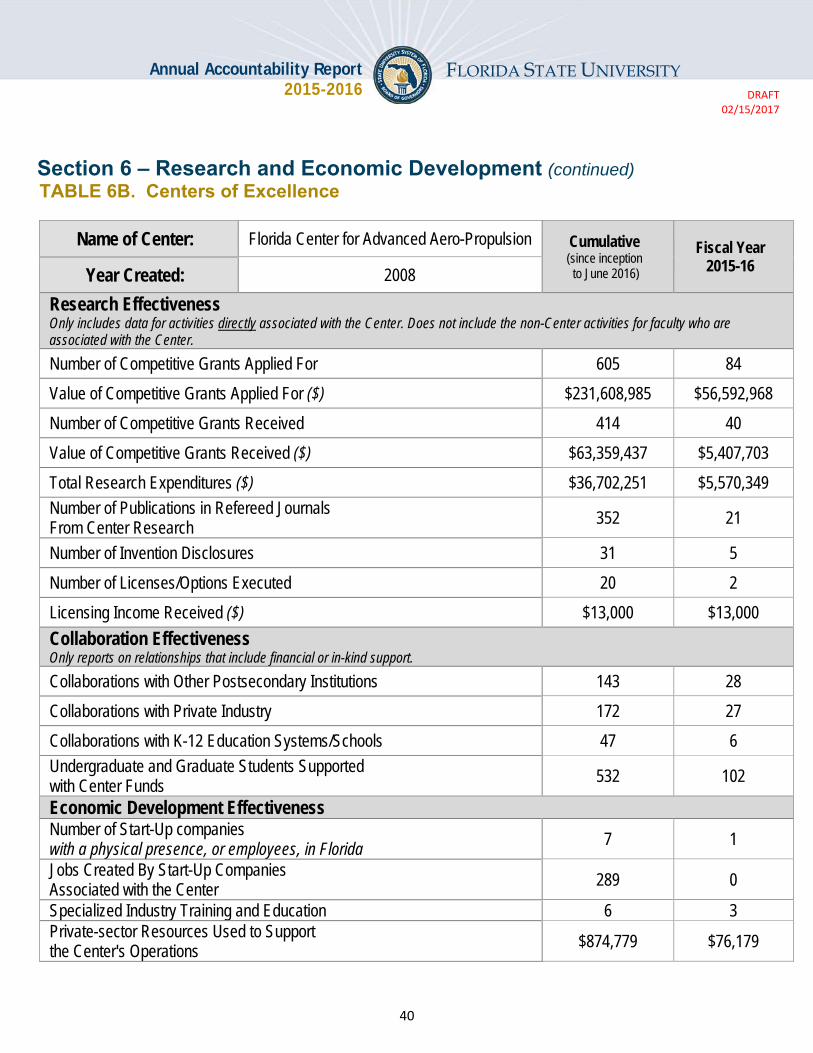
40
Annual Accountability Report 2015-2016
FLORIDA STATE UNIVERSITY DRAFT
02/15/2017
Section 6 – Research and Economic Development (continued) TABLE 6B. Centers of Excellence
Name of Center: Florida Center for Advanced Aero-Propulsion Cumulative
(since inception
to June 2016)
Fiscal Year
2015-16 Year Created: 2008
Research Effectiveness
Only includes data for activities directly associated with the Center. Does not include the non-Center activities for faculty who are associated with the Center.
Number of Competitive Grants Applied For 605 84
Value of Competitive Grants Applied For ($) $231,608,985 $56,592,968
Number of Competitive Grants Received 414 40
Value of Competitive Grants Received ($) $63,359,437 $5,407,703
Total Research Expenditures ($) $36,702,251 $5,570,349
Number of Publications in Refereed Journals From Center Research
352 21
Number of Invention Disclosures 31 5
Number of Licenses/Options Executed 20 2
Licensing Income Received ($) $13,000 $13,000
Collaboration Effectiveness
Only reports on relationships that include financial or in-kind support.
Collaborations with Other Postsecondary Institutions 143 28
Collaborations with Private Industry 172 27
Collaborations with K-12 Education Systems/Schools 47 6
Undergraduate and Graduate Students Supported with Center Funds
532 102
Economic Development Effectiveness
Number of Start-Up companies with a physical presence, or employees, in Florida
7 1
Jobs Created By Start-Up Companies
Associated with the Center 289 0
Specialized Industry Training and Education 6 3 Private-sector Resources Used to Support the Center's Operations
$874,779 $76,179