2015 minerals yearbook · by michele e. mcrae domestic survey data and tables were prepared by...
TRANSCRIPT

2015 Minerals Yearbook
U.S. Department of the Interior U.S. Geological Survey
NICKEL [ADVANCE RELEASE]
June 2018

nickel—2015 [ADVAnce ReleASe] 51.1
NickelBy Michele e. McRae
Domestic survey data and tables were prepared by Kristi J. Simmons, statistical assistant. The world production tables were prepared by Glenn J. Wallace, international data coordinator.
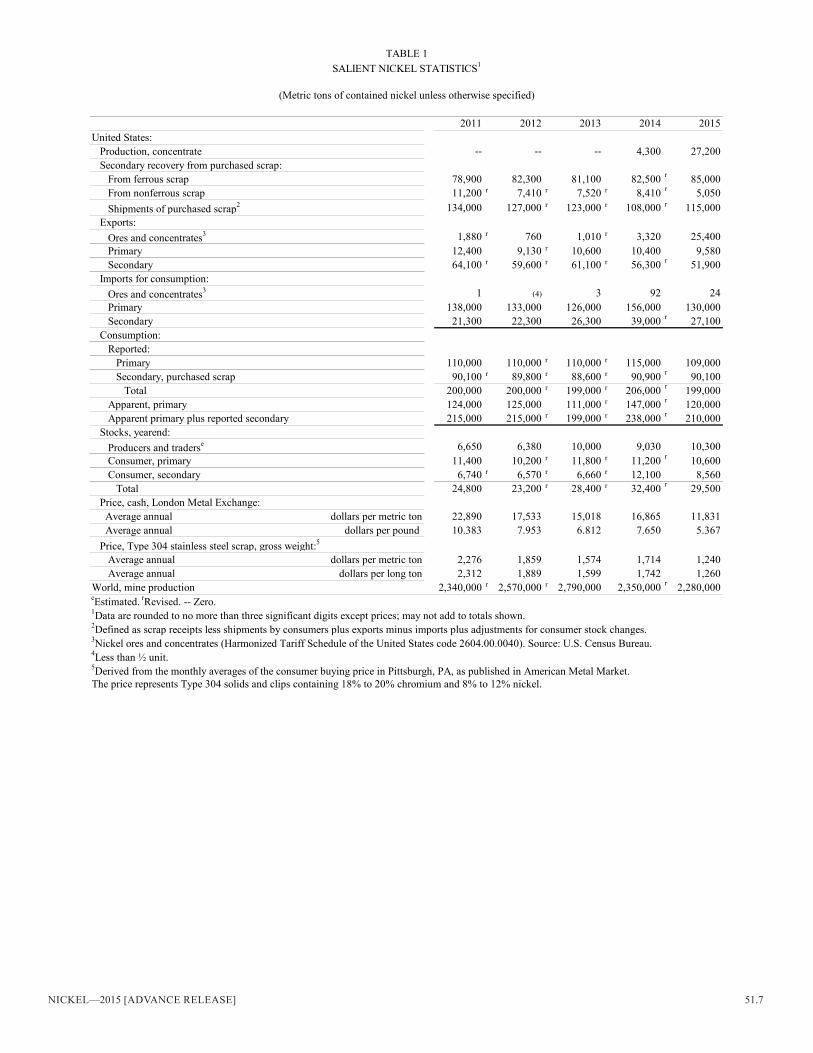
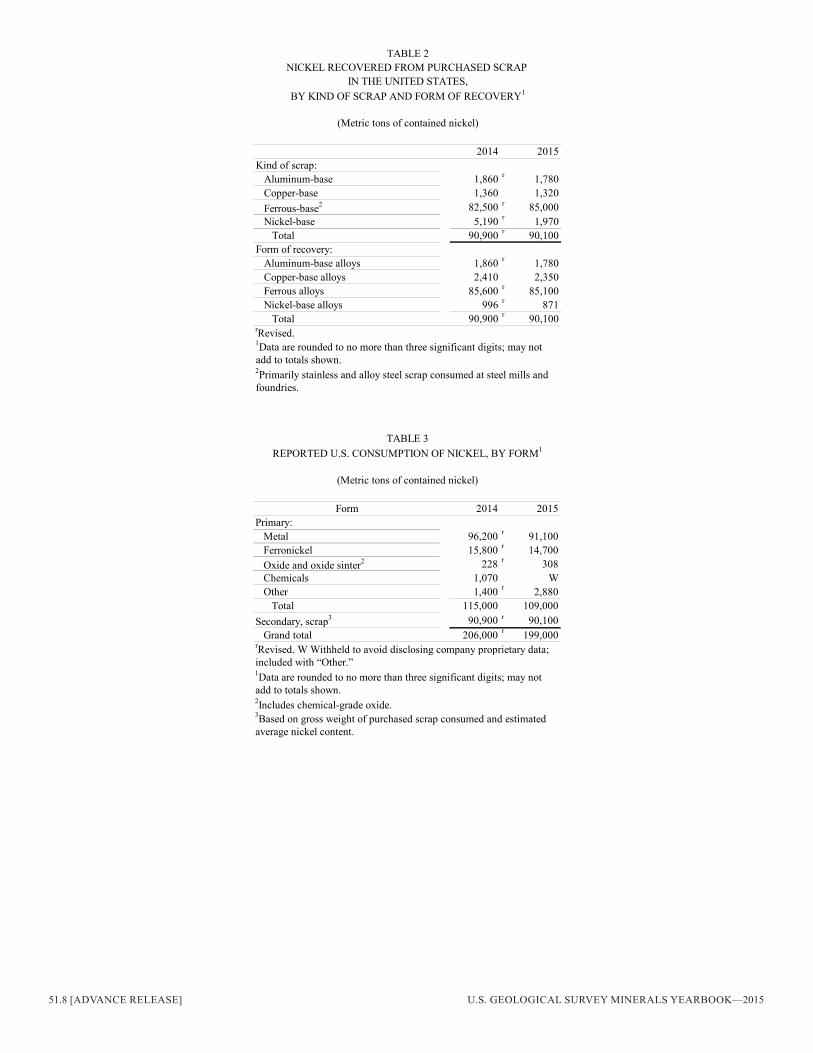
Reported nickel consumption (primary plus secondary) in the United States in 2015 decreased slightly to 199,000 metric tons (t) compared with that of 2014 (table 1). U.S. apparent consumption of primary nickel was 120,000 t, or about 6% of world consumption, based on the 1.88 million metric tons (Mt) reported by the international nickel Study Group (inSG). Stainless steel production accounted for 42% of U.S. primary consumption in contrast with 66% globally. This was likely a reflection of the large number of specialty metal companies and a readily available supply of stainless steel scrap in the United States (table 4). U.S. industry reported melting 90,100 t of nickel contained in scrap, a slight decrease from 90,900 t (revised) in 2014 (table 3) (international nickel Study Group, 2016, p. A-1; nickel institute, 2016, p. 14).
World mine production of nickel was 2.28 Mt of contained nickel in 2015, a slight decrease from that of 2014 (table 10). The london Metal exchange ltd. (lMe) average monthly cash price for nickel metal trended downward throughout 2015 and averaged $8,689 per metric ton in December. As reported by Platts Metals Week, the lMe average annual price was $11,831 per metric ton in 2015, a 30% decrease compared with the average annual price of $16,865 per metric ton in 2014 (table 1). The 2015 average price was the lowest average annual cash price since 2003. Daily stocks of nickel metal increased in lMe-sanctioned warehouses and ended the year at 441,342 t.
Stainless steel accounted for about 66% of global primary nickel (nickel produced from the refining of mined material rather than that recovered from recycled scrap) consumption. World production of stainless and heat-resisting steel was 41.5 Mt in 2015, essentially unchanged from 2014. china was the leading producer of stainless steel, accounting for about 52% of world output, as well as the leading consumer of primary nickel (international Stainless Steel Forum, 2017, p. 8, 13). On a global basis, nonferrous alloys accounted for about 10% of primary nickel use; electroplating and other surface finishing, 9%; alloy steels other than stainless, 8%; foundry products, 3%; and batteries, catalysts, and specialty chemicals, 4% (nickel institute, 2016, p. 14).
Legislation and Government Programs
U.S. Coinage.—The U.S. Mint increased circulating coin production in 2015 for the sixth consecutive year. Dimes, half dollars, nickels, one-dollar coins, and quarters contain nickel in the form of either cupronickel or manganese-brass alloy. Total nickel consumption for coin production was 3,998 t in 2015, a 48% increase compared with 2014 (U.S. Mint, undated a, b).
Production
The United States had one nickel mine in operation—the underground eagle Mine in the Upper Peninsula of Michigan, which began operation in 2014. The eagle Mine continued to ramp up operations in 2015, producing 27,200 t of nickel in concentrate compared with 4,300 t in 2014 (table 1) (lundin Mining corp., 2016b, p. 2). limited quantities of byproduct nickel were recovered at some copper and precious metal refineries, particularly the Stillwater Mining Co. (Billings, MT) base metal refinery. Leading processors of recycled nickel included international Metals Reclamation co. inc.’s (inMeTcO’s) [owned by Horsehead Holding corp. (Pittsburgh, PA)] secondary smelter in ellwood, PA, that processed nickel-containing scrap and Gulf chemical & Metallurgical corp.’s (Freeport, TX) [owned by eRAMeT Group (Paris, France)] facility in Freeport, TX, that processed spent catalysts from petroleum refineries. The refinery and secondary recovery data were included with scrap statistics to avoid disclosing company proprietary data (tables 1–5).
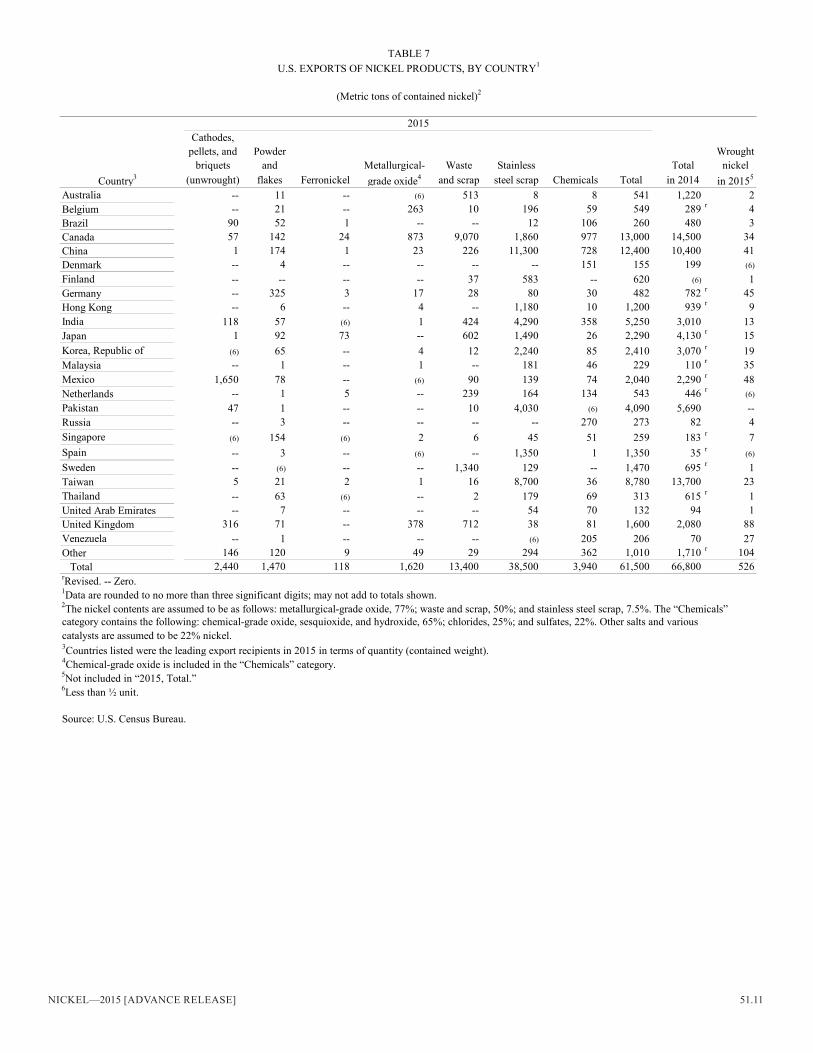
no ferronickel was produced from ores in the United States in 2015. Almost all U.S. ferronickel exports were either reexports or material upgraded for special purposes.
Michigan.—lundin Mining corp. (Toronto, Ontario, canada) mined the eagle deposit—a chalcopyrite-pentlandite-rich peridotite intrusion historically known as the Yellow Dog peridotites. The ore was processed at the associated Humboldt mill, which produced separate concentrates of copper and nickel sulfides. The two sulfide concentrates were railed on a dedicated spur from Humboldt Township to the canadian national Railway line, and then to smelters in canada or to ports for shipment overseas (lundin Mining corp., 2016a, p. 22–25).
in June, the company announced that exploration drilling had intersected a new zone of high-grade massive and semimassive copper-nickel sulfide mineralization named the eagle east discovery. lundin continued drilling to further delineate the deposit. At yearend 2015, the company lacked sufficient data to develop a resource estimate but planned to continue exploration of eagle east in 2016 (lundin Mining corp., 2016a, p. 11, 23, 25).
Minnesota.—PolyMet Mining corp. (Vancouver, British columbia, canada) was waiting for approval to begin developing the copper, nickel, and platinum-group-element (PGe) northmet deposit, located 10 kilometers (km) (6 miles) south of the town of Babbitt in St. louis county. Ore mined from a proposed open pit would be shipped to the reconditioned Erie mill near Hoyt Lakes, MN, for processing by flotation to

51.2 [ADVAnce ReleASe] U.S. GeOlOGicAl SURVeY MineRAlS YeARBOOk—2015
produce a marketable concentrate. in phase 2 of the project, the concentrate would be processed in a new hydrometallurgical plant at the erie site (PolyMet Mining corp., 2016, p. 14–24).
In November, the final Northmet Environmental Impact Statement was released for public comment by the Minnesota Department of natural Resources. in addition, the U.S. Forest Service issued a draft Record of Decision approving a proposal to exchange private lands within the Superior national Forest for Federal lands overlying the northmet deposit. The purpose of the exchange was to resolve discrepancies between mineral and surface rights (cherry, 2015; Myers, 2015).
Byproduct Smelter and Refinery Production.—in 2015, Stillwater Mining co. sold 660 t of nickel in crystalline sulfate, essentially unchanged from 2014. Stillwater mined PGes from the J-M Reef in Montana’s Beartooth Mountains. concentrates from the company’s two mills (east Boulder and Nye) were trucked to Stillwater’s smelting and refining complex at Columbus, MT, where a PGE filter cake and byproduct crystalline nickel sulfate containing minor amounts of cobalt were produced (Stillwater Mining co., 2017, p. 7–8, 21, 49).
Secondary Production.—inMeTcO operated the only secondary smelter in north America dedicated to recovering chromium- and nickel-containing waste and scrap. The smelter at ellwood city, PA, produced an iron-base remelt alloy that typically averaged 13% chromium and 12% nickel. Stainless steel producers used the remelt alloy as a substitute for ferrochromium and ferronickel. inMeTcO was capable of processing a wide range of nickel-bearing wastes including flue dust, grinding swarf, mill scale, and shot blast generated during the manufacturing of stainless steel. The complex also accepted filter cakes, plating solutions, spent pickle liquor, sludges, and all types of spent nickel-containing batteries (Horsehead Holding corp., 2015, p. 8–10).
Gulf chemical & Metallurgical corp. was one of a limited number of companies worldwide that processed spent catalysts from petroleum refineries. The Freeport facility treated nickel-molybdenum and cobalt-molybdenum hydrotreating catalysts that had been “poisoned” by nickel and vanadium contained in the crude oil. Gulf Chemical first roasted and leached the spent catalysts to recover the molybdenum and vanadium. The nickel-and-alumina residue was then converted to a marketable nickel-cobalt-molybdenum alloy in a direct-current electric arc furnace. catalyst processing was expected to increase in north America as the result of the increase in natural gas and oil production from shale and other low-permeability formations (Gulf chemical & Metallurgical corp., 2013a, b, 2014; Sieminski, 2014).
Consumption
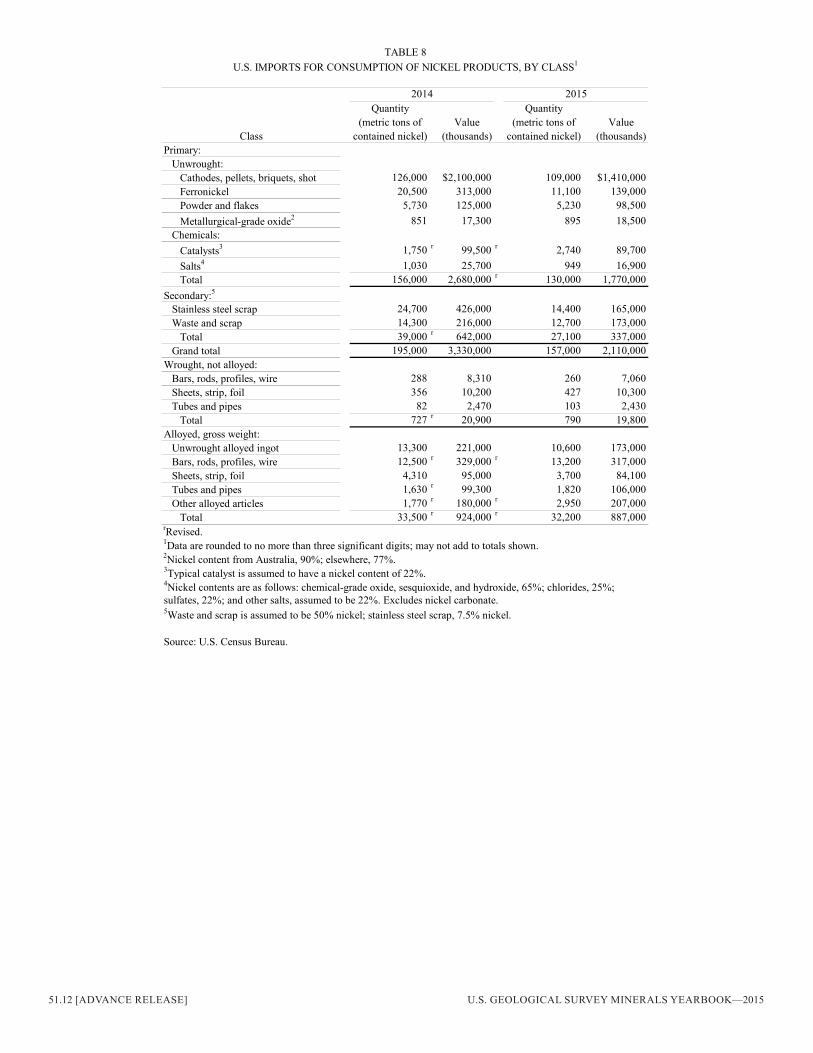
Apparent primary nickel consumption in the United States was 120,000 t in 2015, a 19% decrease from a revised 147,000 t in 2014 (table 1). The estimated value of apparent primary nickel consumption was $1.42 billion, a 43% decrease from 2014, owing to both the decrease in apparent consumption as well as a 30% decrease in the average annual lMe cash price. U.S. industry consumed 14,700 t of ferronickel in 2015, of which more than 80% was used in stainless, heat-resisting, or specialty alloy steels (table 4).
Stainless Steel and Low-Alloy Steels.—in 2015, stainless steel producers accounted for 42% of reported primary nickel consumption, 65% of total nickel consumption, and 93% of nickel-containing scrap consumption in the United States (table 4). Alloy steels—other than stainless—accounted for an additional 3% of U.S. primary nickel use. Production of raw stainless steel and heat-resisting steel in the United States decreased slightly to 2.59 Mt. nickel-bearing grades, which accounted for 69% of total stainless steel production, decreased by 5% to 1.78 Mt (American iron and Steel institute, 2015, 2016).
in December 2015, Allegheny Technologies inc. (ATi) (Pittsburgh, PA) announced that it intended to idle its standard stainless melt shop and sheet finishing operations in Midland, PA. The company cited increasingly challenging market conditions for commodity flat-rolled products, including inventory reductions by consumers, global excess capacity, and increasingly low-priced imports from china into the United States (Allegheny Technologies inc., 2015a).
Superalloys and Related Nickel-Base Alloys.—Of the primary nickel consumed in the United States in 2015, approximately 23% was used to make high-performance superalloys and related nickel-base alloys, primarily for the aerospace, electric power, and petrochemical industries.
At yearend 2014, ATi was preparing to commission a new $1.2 billion hot-rolling and processing facility at Brackenridge, PA. Siemens VAi Metals Technologies GmbH designed and engineered the new facility, which occupied 10 hectares (25 acres) north of Pittsburgh. construction began in 2011, and the new facility was officially integrated into ATI’s existing operations at Brackenridge in March 2015. completion of the facility was a critical component of the company’s strategy to meet expected increased demand for nickel-base alloys by diversifying its product offerings (Gannon, 2015; Allegheny Technologies inc., 2016, p. F–3, F–23).
in June, ATi announced its intention to expand its nickel-base superalloy powder production capabilities near Monroe, nc, in order to meet strong demand in the additive manufacturing and aerospace jet engine markets. The expansion would supplement the company’s existing superalloy powder production in Oakdale, PA, which was operating near full capacity (Allegheny Technologies inc., 2015b).
Stocks
Stocks of nickel in lMe-approved warehouses increased to 441,342 t by December 31, 2015, a 6% increase compared with 414,900 t at yearend 2014. Approximately 40%, or 178,050 t, was stored at Johor, Malaysia. An additional 132,444 t, or 30%, was held in Rotterdam, the netherlands—the traditional lMe storage point for the european Union and Russia. All stocks in LME warehouses were Class I material (refined products with a nickel content of 99% or greater) (london Metal exchange ltd., 2015).
Data collected by the inSG (international nickel Study Group, 2016, p. A1–A2) indicated that, at yearend 2015, world nickel producers (excluding those in Austria, china, kosovo, Macedonia, and the Ural region of Russia) held an additional 85,300 t of primary nickel stocks, a 7% decrease from 2014.

nickel—2015 [ADVAnce ReleASe] 51.3
About 73%, or 62,400 t, was class i material. The remaining 27%, or 22,900 t, was class ii material (products with nickel content less than 99%), which could include ferronickel, nickel pig iron (nPi), oxide sinter, and east Asian utility nickel. At yearend 2015, U.S. consumer stocks of primary nickel totaled 10,600 t, a 6% decrease from the revised 11,200 t held at yearend 2014 (tables 1, 5).
Prices
in January 2015, the lMe monthly mean of the cash buyer and settlement prices was $14,767 per metric ton. Prices decreased for most of 2015, ending the year with a December mean of $8,689 per metric ton. The average annual lMe price for 2015 was $11,831 per metric ton ($5.37 per pound)—30% less than the 2014 average.
World Review
Global nickel mine production decreased slightly to 2.28 Mt, and global plant production decreased by 3% to 1.93 Mt in 2015 (tables 10, 12). According to the inSG, world consumption of primary nickel was 1.88 Mt (international nickel Study Group, 2016, p. A–1).
Australia.—Australia was the fourth-ranked nickel-producing country in the world in terms of mine output. Australia was ranked fifth in plant output and predominantly produced refined metal (tables 10, 12). All nickel ore production was based in Western Australia, with approximately 60% of production from sulfide mines. The quantity of Australia’s nickel sales has trended downwards since 2012 reflecting the downward trend in nickel price [Department of Mines and Petroleum (Western Australia), 2015, p. 29; 2016, p. 35].
First Quantum Minerals ltd. (Vancouver, British columbia, canada) produced intermediate nickel-cobalt hydroxide containing 40% nickel and 1.4% cobalt at its Ravensthorpe nickel-cobalt laterite mine and hydrometallurgical processing plant in Western Australia. A 27% decrease in nickel production in 2015 was attributed to a structural failure in an atmospheric leaching tank in December 2014. The leach circuit was recommissioned in July, but the plant operated at reduced capacity for the remainder of the year while refurbishment efforts took place (First Quantum Minerals ltd., 2016, p. 12; undated).
Panoramic Resources ltd. (Perth, Western Australia, Australia) mined the Deacon sulfide orebody at its Lanfranchi project, 42 km south of kambalda, Western Australia. Owing to depletion of reserves and increased seismic activity, operations were suspended in August before the mine was formally placed on care-and-maintenance status. The company, however, discovered a new zone of mineralization and developed a new decline to facilitate further drilling and testwork and future mining operations (Panoramic Resources ltd., 2016, p. 2, 4, 11).
Brazil.—Four companies mined nickel ore in Brazil—Anglo American níquel Brasil limitada, Grupo Votorantim, Mirabela nickel ltd., and Vale S.A. The four companies extracted a total of 16.0 Mt of ore containing 174,000 t of nickel [Departamento nacional de Produção Mineral (Brazil), 2016, p. 3–4, 13]. Ferronickel accounted for approximately 60% of plant production, and the balance of production was refined nickel.
During the first half of 2015, Mirabela Nickel Ltd. produced nickel sulfide concentrate from its Santa Rita open pit mine and concentrator in Bahia State. in September, the company was placed under voluntary administration. Production was cut back beginning in late October to reduce operating costs in response to the low nickel price, and the company planned to place the mine on care-and-maintenance status in early 2016 (Williams, 2015; Mirabela nickel ltd., 2016).
Anglo American completed reconstruction of both furnaces at its Barro Alto mining and smelting complex in Goias State. Both furnaces were damaged during rampup in 2013, and company management subsequently decided to rebuild both furnaces in order to correct inherent design problems. Anglo American shut down one furnace in October 2014 for 7 months for rebuilding and upgrading. in September 2015, Anglo American restarted deliveries from its second furnace (Spinetto, 2013; Anglo American plc, 2015; 2016, p. 22).
Canada.—canada was the third-ranked nickel-producing country in the world in terms of mine output and ranked fourth in plant output (tables 10, 12). Four Provinces had active nickel mines in 2015—Manitoba, newfoundland and labrador, Ontario, and Quebec—with a total ore output of 235,000 t of contained nickel (table 10).
Vale canada ltd.’s operation at Thompson, Manitoba, processed refined nickel from ores extracted from the Birchtree and Thompson Mines. The Thompson operation also smelted concentrates shipped from Vale’s mining operation near Voisey’s Bay in northern newfoundland and labrador. Vale was considering phasing out smelting and refining at Thompson owing to canadian sulfur dioxide emission standards that came into effect in 2015. The company was allowed to continue smelting and refining through 2018, subject to negotiation of emission limits with environment canada (Vale S.A., 2016, p. 37, 42).
China.—china was the leading producer of primary nickel but ranked eighth in mine production (tables 10, 12). in 2015, china’s total production of primary nickel products decreased by 14% compared with that of 2014. Production of ferronickel and NPI, chemicals and other unspecified forms, and metal decreased by 18%, 10%, and 6%, respectively. in June, the Shanghai Futures exchange approved the registration of three brands of electrolytic nickel from PJSc MMc norilsk nickel (Shanghai Futures exchange, 2015).
According to inSG data (international nickel Study Group, 2016, p. A–6), china was the world’s leading consumer of nickel, accounting for 52% of world consumption in 2015. china’s imports of unalloyed, unwrought nickel increased by 125% to 293,000 t. imports from Russia accounted for 73% of the increase.
The price of china’s nPi declined throughout 2015. in many cases, sales prices were below production costs, leading to the suspension of activities at higher cost operations. The number of nPi producers in china reportedly fell to approximately 30 from over 300 in previous years (nickel & Stainless Steel Data Monthly, 2016, p. 8, 11, 18).
low nPi production was likely related to other changes in china’s trade and stocks of nickel ore and concentrates and ferronickel. in 2014 and 2015, gross weight imports of ferronickel (which likely included nPi) increased substantially

51.4 [ADVAnce ReleASe] U.S. GeOlOGicAl SURVeY MineRAlS YeARBOOk—2015
(by 45% and 131%, respectively), but gross weight imports of nickel ore and concentrates decreased (by 33% and 26%, respectively). Stocks of nPi reportedly declined by 40% in the second half of 2015 from a high of 490,000 t earlier in the year, and stocks of nickel ores at 12 major ports reportedly decreased by 17% from February 2015 to yearend 2015 (nickel & Stainless Steel Data Monthly, 2016, p. 11, 25, 26).
Indonesia.—The Government of indonesia continued to enforce its ban on the export of key unprocessed metalliferous ores. The regulations, originally enacted as law no. 4 in 2009, effectively halted all sales of Indonesian nickeliferous direct shipping ore to overseas producers of ferronickel and nPi. The intent of the ban was to stimulate development of processing facilities that would produce higher valued products (lederer, 2016). indonesia’s reported exports of nickel ores and concentrates were zero.
chinese companies invested heavily in the development of joint mining and smelting projects in indonesia, with numerous projects under construction or planned for commissioning in 2015 and 2016 (nickel & Stainless Steel Data Monthly, 2016, p. 16–17). One example was the PT indonesia Morowali industrial Park [Shanghai Decent investment (Group) co., ltd. and PT Bintangdelapan Group], a nickel pig iron and stainless steel complex at Bahodopi in Central Sulawesi. The park’s first NPI project, financed by the China Development Bank, was commissioned in January 2015. The project had a capacity of 300,000 metric tons per year (t/yr) (gross weight) of nPi with a nickel content of 10%. A second project that had a capacity of 600,000 t/yr was under construction, and construction of a 1,000,000-t/yr stainless steel slab facility began in July 2015 [Shanghai Decent investment (Group) co., ltd., undated].
Perusahaan Perseroan (Persero) PT Aneka Tambang Tbk was in the process of expanding its ferronickel production complex at the port of Pomalaa, Southeast Sulawesi, and continued construction of a processing complex at east Halmahera, north Maluku. in June, the company commenced production from its new furnace at Pomalaa, which was expected to increase capacity to 27,000 to 30,000 t/yr of nickel in ferronickel from the previous capacity of 18,000 to 20,000 t/yr. The east Halmahera plant was to be constructed in two stages, with each stage having a capacity of 13,500 to 15,000 t/yr of nickel in ferronickel. construction was scheduled to be completed in 2018 [Perusahaan Perseroan (Persero) PT Aneka Tambang Tbk, 2016, p. 15–16, 75, 109–110].
New Caledonia.—koniambo nickel SAS continued to ramp up operations at its mining and smelting project in the north Province. Operations at the facility were halted in late December 2014 owing to a hot-metal leak in one furnace. The furnace was subsequently rebuilt and was expected to restart production in January 2016. construction of a second furnace was well underway when the first furnace malfunctioned. After receiving regulatory approval, the second furnace started operation in January 2015 but was slated to be taken out of service and rebuilt once the first furnace returned to operation (Regan, 2014; Glencore plc, 2016, p. 55).
Philippines.—The Philippines was the leading producer of mined nickel, accounting for approximately 24% of world production. Because of a lack of processing facilities, the
country exported most of its production as direct shipping ore. However, two companies operated hydrometallurgical processing plants that produced mixed sulfide compounds that were shipped to Japan for refining. In 2015, mine and intermediate production decreased by 5% and 3%, respectively.
Russia.—Russia was ranked second in both nickel mine and plant production. PJSc MMc norilsk nickel, Russia’s leading producer, was in the process of upgrading the nadezhda Metallurgical Plant in order to process all concentrate produced by the company’s Polar Division. The company planned to close the refining capabilities of its Polar Division in 2016 (PJSC MMc norilsk nickel, 2016, p. 11–14, 74–76).
Spain.—Lundin mined sulfide ore from the Aguablanca Mine in the Province of Badajoz to produce nickel-copper concentrate. The company intended to transition from open pit to underground mining but was notified by the Government of Spain in July that the transition would require a full environmental evaluation. The mine’s operations were suspended in October. lundin later concluded that the operation was no longer financially feasible and announced its intention to permanently close the mine (lundin Mining corp., 2016b, p. 23).
Turkey.—After the commissioning of a high-pressure acid-leach plant in late 2014, Meta Nikel Kobalt A.Ş. (Meta Nikel Kobalt Madencilik Sanayi ve Ticaret A.Ş. and Zorlu Holding A.Ş.) began commercial production in 2015. The ore was trucked from the company’s mines at Gordes and eskisehir. The plant’s initial design capacity was 10,000 t/yr of nickel equivalent in mixed nickel-cobalt hydroxide product, and all production was shipped to china (Vestel elektronik Sanayi ve Ticaret AŞ, 2016, p. 47; Meta Nikel Kobalt A.Ş., undated).
Outlook
From 2005 to 2015, global nickel consumption has had a compound annual growth rate of approximately 4% (international nickel Study Group, 2016, p. A–1). Stainless steel is expected to continue to be the leading end use of primary nickel. World stainless melt shop production has had a compound annual growth rate of about 6%, climbing from 1 Mt in 1950 to 45.8 Mt (gross weight) in 2015. chromium-nickel grades (300 series) constitute more than 50% of stainless steel production (international Stainless Steel Forum, 2017, p. 4, 15).
Increased demand for more-fuel-efficient engines is expected to increase demand for nickel in the transportation manufacturing sector. in the aerospace market, the use of nickel alloys allows for more-fuel-efficient jet aircraft engines by reducing weight while allowing for more thrust and higher operating temperatures. in the automotive sector, austenitic stainless steels have been shown to reduce the weight of individual components by 20% compared to carbon steels, leading to improved fuel efficiency (Nickel, 2006, p. 13; 2008, p. 6).
The electric power industry is expected to remain an important consumer of austenitic stainless steel and various nickel-base superalloys—both for new construction and renovation. Global demand for electricity continues to increase and is accelerating as the population of the world increases. According to the U.S. energy information Administration (2014, p. MT–16), electricity consumption in the United States

nickel—2015 [ADVAnce ReleASe] 51.5
alone is expected to increase by at least 29% between 2012 and 2040. To meet demand, utilities will need to build more generating capacity, irrespective of whether the plants operate on fossil fuels, renewable energy (geothermal, hydropower, solar, or wind), or nuclear reactors. The increased capacity would require large tonnages of nickel-bearing stainless steel and superalloys.
The use of nickel in batteries has been estimated at 3% to 4% of total global consumption. Although there is significant opportunity for increased demand for nickel in battery applications, the battery market is highly competitive and evolving rapidly, particularly in vehicle electrification. Increased consumption of nickel in battery applications depends on a variety of factors such as how widely electric vehicles are adopted and which battery technologies are used. Many of the non-plug-in hybrid electric vehicles on U.S. highways use nickel-metal hydride batteries. nickel has recently begun to be used in lithium-ion cathode materials, primarily as nickel-cobalt-manganese and nickel-cobalt-aluminum. lithium-ion batteries are primarily used in consumer electronics, but the larger capacities required for vehicle electrification are expected to accelerate demand for nickel in the sector (Roskill information Services ltd., 2017).
References Cited
Allegheny Technologies inc., 2015a, ATi announces rightsizing actions to align flat rolled products operations to challenging market conditions: Pittsburgh, PA, Allegheny Technologies inc. press release, December 10. (Accessed January 16, 2018, at http://ir.atimetals.com/news-and-events/press-releases/2015/12-10-2015-122325378.)
Allegheny Technologies inc., 2015b, ATi to expand nickel-based superalloy powder capabilities: Pittsburgh, PA, Allegheny Technologies Inc. press release, June 17. (Accessed January 16, 2018, at http://ir.atimetals.com/news-and-events/press-releases/2015/06-17-2015-122346753.)
Allegheny Technologies Inc., 2016, ATI annual report 2015: Pittsburgh, PA, Allegheny Technologies inc., 119 p. (Accessed February 7, 2018, at http://ir.atimetals.com/~/media/Files/A/ATIMetals-IR/annual-reports/ati-2015-annual-report.pdf.)
American iron and Steel institute, 2015, Quarterly production of stainless and heat resisting steel (AIS 104)—Fourth quarter [2014]: Washington, DC, American iron and Steel institute, 2 p.
American iron and Steel institute, 2016, Quarterly production of stainless and heat resisting raw steel (AIS 104)—Fourth quarter [2015]: Washington, DC, American iron and Steel institute, 2 p.
Anglo American plc, 2015, Mine profile—Barro Alto: London, United kingdom, Anglo American plc, October 6. (Accessed January 19, 2018, at http://www.angloamerican.com/media/our-stories/mine-profile-barro-alto.)
Anglo American plc, 2016, Annual report 2015: London, United kingdom, Anglo American plc, 202 p. (Accessed February 8, 2018, at http://www.angloamerican.com/~/media/Files/A/Anglo-American-PLC-V2/documents/annual-reporting-2016/downloads/annual-report-2016-interactive-v2.pdf.)
Cherry, Jon, 2015, PolyMet’s final EIS completed: BusinessNorth [Duluth, MN], November 6. (Accessed April 16, 2018, at http://www.businessnorth.com/daily_briefing/polymet-s-final-eis-completed/article_bfad202a-8496-11e5-a0d0-67dfad683afd.html.)
Department of Mines and Petroleum (Western Australia), 2015, Western Australian mineral and petroleum statistics digest—2014–15: East Perth, Western Australia, Australia, Department of Mines and Petroleum (Western Australia), 70 p. (Accessed January 18, 2018, at http://www.dmp.wa.gov.au/Documents/About-Us-careers/Stats_Digest_2014-15.pdf.)
Department of Mines and Petroleum (Western Australia), 2016, Western Australian mineral and petroleum statistics digest—2015–16: East Perth, Western Australia, Australia, Department of Mines and Petroleum (Western Australia), 70 p. (Accessed January 18, 2018, at http://www.dmp.wa.gov.au/Documents/About-Us-careers/Stats_Digest_2015-16.pdf.)
Departamento nacional de Produção Mineral (Brazil), 2016, Anuário mineral brasileiro— Principais substâncias metálicas—2016 [Brazilian mineral year—Main metallic substances]: Brasilia, Brazil, Departamento nacional de Produção Mineral, 26 p. (Accessed January 18, 2018, at http://www.dnpm.gov.br/dnpm/publicacoes/serie-estatisticas-e-economia-mineral/anuario-mineral/anuario-mineral-brasileiro/anuario-mineral-brasileiro-2016-metalicos.)
First Quantum Minerals Ltd., 2016, 2015 annual report: Vancouver, British columbia, canada, First Quantum Minerals ltd., 94 p. (Accessed January 18, 2018, at http://s1.q4cdn.com/857957299/files/doc_downloads/2016/Annual-Report.pdf.)
First Quantum Minerals Ltd., [undated], Ravensthorpe: Vancouver, British columbia, canada, First Quantum Minerals ltd. (Accessed January 18, 2018, at http://www.first-quantum.com/Our-Business/operating-mines/Ravensthorpe/default.aspx.)
Gannon, Joyce, 2015, new Allegheny Technologies plant project is rolling along: Pittsburgh [PA] Post-Gazette, May 8. (Accessed January 16, 2018, at http://www.post-gazette.com/business/pittsburgh-company-news/2015/05/08/new-Allegheny-Technologies-plant-project-is-rolling-along/stories/201505080161/.)
Glencore plc, 2016, Annual report 2015: Baar, Switzerland, Glencore plc, 202 p. (Accessed February 8, 2018, at http://www.glencore.com/assets/investors/doc/reports_and_results/2016/Glen-2016-Annual-Report.pdf.)
Gulf Chemical & Metallurgical Corp., 2013a, Refining refiners’ spent catalysts: Freeport, TX, Gulf Chemical & Metallurgical Corp. press release, November 14. (Accessed July 10, 2015, at http://www.ERAMET-gulf.com/newsPublications_pressReleasesDetail.asp?newsPublicationsiD=18.).
Gulf Chemical & Metallurgical Corp., 2013b, Spent catalyst recycling: Freeport, TX, Gulf chemical & Metallurgical corp. (Accessed March 12, 2013, at http://www.eRAMeT-gulf.com/SpentcatalystRecycling.asp.)
Gulf Chemical & Metallurgical Corp., 2014, Gulf 360°—Closing the loop: Freeport, TX, Gulf chemical & Metallurgical corp. diagram. (Accessed May10, 2014, at http://www.ERAMET-gulf.com/about Gulf_360Process.asp.)
Horsehead Holding Corp., 2015, Form 10–K—2015: U.S. Securities and exchange commission, 76 p. plus exhibits. (Accessed February 15, 2018, at https://www.sec.gov/Archives/edgar/data/1385544/000119312516725704/d236839d10k.htm#tx236839_11.)
International Nickel Study Group, 2016, World nickel statistics—Yearbook: lisbon, Portugal, international nickel Study Group Bulletin, v. 25, no. 11, november, 4 sections (A–D).
International Stainless Steel Forum, 2017, Stainless steel in figures 2017: Brussels, Belgium, international Stainless Steel Forum, 25 p. (Accessed January 9, 2018, at http://www.worldstainless.org/Files/issf/non-image-files/PDF/iSSF_Stainless_Steel_in_Figures_2017_english_Public.pdf.)
Lederer, G.W., 2016, Resource nationalism in Indonesia—Effects of the 2014 mineral export ban: U.S. Geological Survey Fact Sheet 2016–3072, 6 p. (Accessed January 24, 2018, at https://doi.org/10.3133/fs20163072.)
London Metal Exchange Ltd., 2015, Nickel stocks: London, United Kingdom, london Metal exchange ltd., December 31.
lundin Mining corp., 2016a, Annual information form for the year ended December 31, 2015: Toronto, Ontario, Canada, Lundin Mining Corp., March 30, 69 p. (Accessed February 6, 2018, at http://www.lundinmining.com/i/pdf/2015-AiF.pdf.)
lundin Mining corp., 2016b, Management’s discussion and analysis for the year ended December 31, 2015: Toronto, Ontario, Canada, Lundin Mining corp., February 18, 51 p. (Accessed January 26, 2018, at http://www.lundinmining.com/i/pdf/2015YE.pdf.)
Meta Nikel Kobalt A.Ş., [undated], Gördes Meta nickel cobalt facility: Ankara, Turkey, Meta Nikel Kobalt A.Ş. (Accessed January 26, 2018, at http://www.metanikel.com.tr/en/gordes-meta-nickel-cobalt-facility/.)
Mirabela Nickel Ltd., 2016, Operational update: Perth, Western Australia, Australia, Mirabela nickel ltd. news release, February 19, 1 p.
Myers, John, 2015, Forest Service backs land exchange for PolyMet site: Duluth [Mn] news Tribune, november 17. (Accessed January 10, 2018, at http://www.miningminnesota.com/forest-service-backs-land-exchange-for-polymet-mine-site/.)
nickel, 2006, Farther, faster, and safer—Making air travel cleaner, quieter, and more fuel efficient: Nickel, v. 21, no. 3, May, p. 12–13. (Accessed January 29, 2018, at https://www.nickelinstitute.org/~/media/Files/Magazine/Volume21/Vol21-03May2006.ashx?la=en.)

51.6 [ADVAnce ReleASe] U.S. GeOlOGicAl SURVeY MineRAlS YeARBOOk—2015
Nickel, 2008, Stainless steel car frames—The next generation: Nickel, v. 24, no. 1, December, p. 6–7. (Accessed January 29, 2018, at https://www.nickelinstitute.org/~/media/Files/Magazine/Volume24/Vol24-01Dec2008.ashx#page=6?la=en.)
nickel & Stainless Steel Data Monthly, 2016, nickel & stainless steel data monthly: Nickel & Stainless Steel Data Monthly [published by Beijing Antaike information Development co., ltd., or Antaike], no. 56, January, 26 p.
Nickel Institute, 2016, The life of Ni: Toronto, Ontario, Canada, Nickel Institute, 18 p. (Accessed January 9, 2018, via https://www.nickelinstitute.org/en/Mediacentre/Publications/Thelifeofni.aspx.)
Panoramic Resources Ltd., 2016, 2015 annual report: Perth, Western Australia, Australia, Panoramic Resources ltd., 124 p. (Accessed January 18, 2018, at http://panoramicresources.com/wp-content/uploads/2015/10/151019-Panoramic-Resources-Annual-Report-30-June-2015.pdf.)
Perusahaan Perseroan (Persero) PT Aneka Tambang Tbk, 2016, 2015 annual report: Jakarta, Indonesia, Perusahaan Perseroan (Persero) PT Aneka Tambang Tbk, 685 p. (Accessed January 24, 2018, at http://www.antam.com/images/stories/joget/file/annual/2015/ar_antam_2015.pdf.)
PJSC MMC Norilsk Nickel, 2016, Annual report 2015: Moscow, Russia, PJSc MMc norilsk nickel, 196 p. (Accessed January 25, 2018, at https://www.nornickel.com/files/en/gsm/agm2016/materials/ANNUAL-RePORT-_2015.pdf.)
PolyMet Mining Corp., 2016, Form 20–F—2016: U.S. Securities and exchange commission, 62 p. plus exhibits. (Accessed January 11, 2018, at http://polymetmining.com/wp-content/uploads/2013/02/SEDAR-2016-01-31-Annual-Report-on-Form-20F.pdf.)
Regan, James, 2014, koniambo nickel plant suspends output after spill—Glencore: Thomson Reuters, December 29. (Accessed January 25, 2018, at http://www.reuters.com/article/glencore-nickel-spill-idUSL3N0UE15Z20141230.)
Roskill information Services ltd., 2017, nickel market beware—Batteries can no longer be ignored: London, United Kingdom, Roskill Information Services Ltd. press release, April 20. (Accessed January 29, 2018, at https://roskill.com/news/nickel-market-beware-batteries-can-no-longer-ignored/.)
Shanghai Decent investment (Group) co., ltd., [undated], indonesia Morowali Industrial Park: Shanghai, China, Shanghai Decent Investment (Group) Co., Ltd. (Accessed January 24, 2018, at http://www.decent-china.com/EN/index.php/channel/index/id/175.html.)
Shanghai Futures exchange, 2015, Approval of registration of the 3 electrolytic nickel brands produced by PJSC MMC Norilsk Nickel: Shanghai, china, Shanghai Futures exchange, June 29. (Accessed January 24, 2018, at http://www.shfe.com.cn/en/AnnouncementandNews/SHFeAnnouncement/911323136.html.)
Sieminski, Adam, 2014, Outlook for U.S. shale oil and gas: Annual meeting of the Allied Social Science Associations, Philadelphia, PA, January 4, presentation, 20 p. (Accessed July 10, 2015, at http://www.eia.gov/pressroom/presentations/sieminski_01042014.pdf.)
Spinetto, J.P., 2013, Anglo American sees Barro Alto nickel output cut until 2016: Bloomberg News, September 24. (Accessed February 4, 2015, at http://www.bloomberg.com/news/articles/2013-09-23/anglo-american-sees-barro-alto-nickel-output-cut-until-mid-2016.)
Stillwater Mining Co., 2017, Form 10–K—2016: U.S. Securities and Exchange Commission, 108 p. (Accessed February 6, 2018, at https://www.sec.gov/Archives/edgar/data/931948/000093194817000012/swc-12312016x10k.htm.)
U.S. energy information Administration, 2014, Annual energy outlook 2014 with projections to 2040: Washington, DC, U.S. Energy Information Administration, DOe/eiA–0383, April, 268 p. (Accessed February 14, 2018, at https://www.eia.gov/outlooks/aeo/pdf/0383(2014).pdf.)
U.S. Mint, [undated]a, Circulating coin production figures: Washington, DC, U.S. Mint. (Accessed January 9, 2018, via https://competition.usmint.gov/circulating-coins-production-figures/.)
U.S. Mint, [undated]b, Coin specifications: Washington, DC, U.S. Mint. (Accessed January 9, 2018, at https://www.usmint.gov/about_the_mint/index583f.html?action=coin_specifications.)
Vale S.A., 2016, Form 20–F—2015: U.S. Securities and Exchange Commission, 174 p. plus financial statements. (Accessed February 14, 2018, via http://www.vale.com/EN/investors/information-market/annual-reports/20f/Pages/default.aspx.)
Vestel Elektronik Sanayi ve Ticaret AŞ, 2016, 2015 annual report: Istanbul, Turkey, Vestel Elektronik Sanayi ve Ticaret AŞ, 168 p. (Accessed January 26, 2018, at http://www.vestelinvestorrelations.com/en/_assets/pdf/AnnualReport_2015.pdf.)
Williams, Peter, 2015, Failed Mirabela’s Brazil mine for sale: The West Australian [Perth, Western Australia, Australia], October 30. (Accessed January 18, 2018, at https://thewest.com.au/business/finance/failed-mirabelas-brazil-mine-for-sale-ng-ya-131572.)
GENERAL SOURCES OF INFORMATION
U.S. Geological Survey Publications
Historical Statistics for Mineral and Material commodities in the United States, Data Series 140.
nickel. ch. in Mineral commodity Summaries, annual.nickel. ch. in United States Mineral Resources, Professional
Paper 820, 1973.nickel. international Strategic Minerals inventory Summary
Report, circular 930–D, 1985.nickel. Mineral industry Surveys, monthly.nickel (ni). ch. in Metal Prices in the United States Through
2010, Scientific Investigations Report 2012–5188, 2013.
Other
international nickel Study Group (lisbon, Portugal).nickel. ch. in Mineral Facts and Problems, U.S. Bureau of
Mines Bulletin 675, 1985.nickel institute (Toronto).Roskill information Services ltd.
nickel—2015 [ADVAnce ReleASe] 51.7
2011 2012 2013 2014 2015United States:
Production, concentrate -- -- -- 4,300 27,200Secondary recovery from purchased scrap:
From ferrous scrap 78,900 82,300 81,100 82,500 r 85,000From nonferrous scrap 11,200 r 7,410 r 7,520 r 8,410 r 5,050Shipments of purchased scrap2 134,000 127,000 r 123,000 r 108,000 r 115,000
Exports:Ores and concentrates3 1,880 r 760 1,010 r 3,320 25,400Primary 12,400 9,130 r 10,600 10,400 9,580Secondary 64,100 r 59,600 r 61,100 r 56,300 r 51,900
Imports for consumption:Ores and concentrates3 1 (4) 3 92 24Primary 138,000 133,000 126,000 156,000 130,000Secondary 21,300 22,300 26,300 39,000 r 27,100
Consumption:Reported:
Primary 110,000 110,000 r 110,000 r 115,000 109,000Secondary, purchased scrap 90,100 r 89,800 r 88,600 r 90,900 r 90,100
Total 200,000 200,000 r 199,000 r 206,000 r 199,000Apparent, primary 124,000 125,000 111,000 r 147,000 r 120,000Apparent primary plus reported secondary 215,000 215,000 r 199,000 r 238,000 r 210,000
Stocks, yearend:Producers and traderse 6,650 6,380 10,000 9,030 10,300consumer, primary 11,400 10,200 r 11,800 r 11,200 r 10,600consumer, secondary 6,740 r 6,570 r 6,660 r 12,100 8,560
Total 24,800 23,200 r 28,400 r 32,400 r 29,500Price, cash, London Metal Exchange: Average annual dollars per metric ton 22,890 17,533 15,018 16,865 11,831 Average annual dollars per pound 10.383 7.953 6.812 7.650 5.367Price, Type 304 stainless steel scrap, gross weight:5
Average annual dollars per metric ton 2,276 1,859 1,574 1,714 1,240Average annual dollars per long ton 2,312 1,889 1,599 1,742 1,260
World, mine production 2,340,000 r 2,570,000 r 2,790,000 2,350,000 r 2,280,000
2Defined as scrap receipts less shipments by consumers plus exports minus imports plus adjustments for consumer stock changes.
5Derived from the monthly averages of the consumer buying price in Pittsburgh, PA, as published in American Metal Market.The price represents Type 304 solids and clips containing 18% to 20% chromium and 8% to 12% nickel.
(Metric tons of contained nickel unless otherwise specified)
TABle 1SAlienT nickel STATiSTicS1
4less than ½ unit.
3Nickel ores and concentrates (Harmonized Tariff Schedule of the United States code 2604.00.0040). Source: U.S. Census Bureau.
eestimated. rRevised. -- Zero.1Data are rounded to no more than three significant digits except prices; may not add to totals shown.
51.8 [ADVAnce ReleASe] U.S. GeOlOGicAl SURVeY MineRAlS YeARBOOk—2015
2014 2015Kind of scrap:
Aluminum-base 1,860 r 1,780copper-base 1,360 1,320Ferrous-base2 82,500 r 85,000nickel-base 5,190 r 1,970
Total 90,900 r 90,100Form of recovery:
Aluminum-base alloys 1,860 r 1,780copper-base alloys 2,410 2,350Ferrous alloys 85,600 r 85,100nickel-base alloys 996 r 871
Total 90,900 r 90,100
TABle 2nickel RecOVeReD FROM PURcHASeD ScRAP
in THe UniTeD STATeS,BY kinD OF ScRAP AnD FORM OF RecOVeRY1
(Metric tons of contained nickel)
2Primarily stainless and alloy steel scrap consumed at steel mills and add to totals shown.
foundries.
rRevised. 1Data are rounded to no more than three significant digits; may not
Form 2014 2015Primary:
Metal 96,200 r 91,100Ferronickel 15,800 r 14,700Oxide and oxide sinter2 228 r 308chemicals 1,070 WOther 1,400 r 2,880
Total 115,000 109,000Secondary, scrap3 90,900 r 90,100
Grand total 206,000 r 199,000
3Based on gross weight of purchased scrap consumed and estimated average nickel content.
TABle 3RePORTeD U.S. cOnSUMPTiOn OF nickel, BY FORM1
(Metric tons of contained nickel)
included with “Other.”
rRevised. W Withheld to avoid disclosing company proprietary data;
1Data are rounded to no more than three significant digits; may not add to totals shown.2includes chemical-grade oxide.

nickel—2015 [ADVAnce ReleASe] 51.9
GrandOxide and Other Total Secondary Grand total in
Use Metal Ferronickel oxide sinter chemicals forms primary (scrap) total 2014cast irons 41 -- -- -- 3 44 161 205 272 r
chemicals and chemical uses 1,570 -- W 196 5 1,770 -- 1,770 2,120 r
electric, magnet, expansion alloys 192 W -- -- -- 192 (2) 192 227 r
electroplating, sales to platers 7,490 -- -- W -- 7,490 -- 7,490 8,100 r
nickel-copper and copper-nickel alloys W -- (2) -- 41 41 2,200 2,240 2,300Other nickel and nickel alloys 13,000 17 1 -- 32 13,000 W 13,000 15,000Steel:
Stainless and heat resistant 33,100 12,400 65 -- 112 45,600 83,300 129,000 133,000Alloys, excludes stainless 3,290 30 -- -- -- 3,320 1,570 4,890 4,960 r
Superalloys 25,300 120 -- -- W 25,400 251 25,600 25,700 r
Other3 7,150 2,140 242 260 2,230 12,000 2,550 14,600 13,900 r
Total 91,100 14,700 308 455 2,430 109,000 90,100 199,000 206,000 r
rRevised. W Withheld to avoid disclosing company proprietary data; included with “Other.” -- Zero.1Data are rounded to no more than three significant digits; may not add to totals shown.2less than ½ unit.3includes batteries, catalysts, ceramics, coinage, other alloys containing nickel, and data indicated by symbol W.
2015
TABle 4RePORTeD U.S. cOnSUMPTiOn OF nickel, BY USe1
(Metric tons of contained nickel)
Form 2014 2015Primary:
Metal 10,400 r 9,930Ferronickel W WOxide and oxide sinter 30 r 76chemicals W WOther 846 r 608
Total 11,200 r 10,600Secondary, scrap 12,100 8,560
Grand total 23,400 r 19,200
included with “Other.”
rRevised. W Withheld to avoid disclosing company proprietary data;
1Data are rounded to no more than three significant digits; may not add to totals shown.
TABle 5nickel in cOnSUMeR STOckS in THe UniTeD STATeS,
BY FORM, DeceMBeR 311
(Metric tons of contained nickel)

51.10 [ADVAnce ReleASe] U.S. GeOlOGicAl SURVeY MineRAlS YeARBOOk—2015
Quantity Quantity(metric tons of Value (metric tons of Value
class contained nickel) (thousands) contained nickel) (thousands)Primary:
Unwrought:cathodes, pellets, briquets, shot 2,010 r $35,900 r 2,440 $34,900Ferronickel 110 r 3,070 r 118 3,270Powder and flakes 1,710 59,700 1,470 54,500Metallurgical-grade oxide2 1,970 22,000 1,620 22,400
Chemicals:catalysts3 3,430 r 315,000 r 2,990 285,000Salts4 1,210 29,400 948 14,200Total 10,400 465,000 r 9,580 414,000
Secondary:Stainless steel scrap 41,100 674,000 38,500 638,000Waste and scrap5 15,200 125,000 13,400 107,000
Total 56,300 r 799,000 51,900 745,000Grand total 66,800 1,260,000 61,500 1,160,000
Wrought, not alloyed:Bars, rods, profiles, wire 224 r 9,390 213 9,760Sheets, strip, foil 246 r 9,830 r 255 10,000Tubes and pipes 210 4,640 58 1,620
Total 680 23,900 526 21,400Alloyed, gross weight:
Unwrought alloyed ingot 5,350 128,000 6,050 116,000Bars, rods, profiles, wire 20,600 676,000 19,600 663,000Sheets, strip, foil 12,700 372,000 15,200 471,000Tubes and pipes 2,360 155,000 2,310 149,000Other alloyed articles 4,220 r 480,000 3,330 409,000
Total 45,200 1,810,000 46,500 1,810,000
sulfates, 22%; and other salts, assumed to be 22%.
Source: U.S. Census Bureau.
2014 2015
5Waste and scrap content is assumed to be 50% nickel; stainless steel scrap, 7.5%.
rRevised.
4Nickel contents are as follows: chemical-grade oxide, sesquioxide, and hydroxide, 65%; chlorides, 25%;
TABle 6U.S. eXPORTS OF nickel PRODUcTS, BY clASS1
1Data are rounded to no more than three significant digits; may not add to totals shown.2nickel content is assumed to be 77%.3Typical catalyst is assumed to have a nickel content of 22%.
nickel—2015 [ADVAnce ReleASe] 51.11
cathodes,pellets, and Powder Wrought
briquets and Metallurgical- Waste Stainless Total nickelcountry3 (unwrought) flakes Ferronickel grade oxide4 and scrap steel scrap chemicals Total in 2014 in 20155
Australia -- 11 -- (6) 513 8 8 541 1,220 2Belgium -- 21 -- 263 10 196 59 549 289 r 4Brazil 90 52 1 -- -- 12 106 260 480 3canada 57 142 24 873 9,070 1,860 977 13,000 14,500 34china 1 174 1 23 226 11,300 728 12,400 10,400 41Denmark -- 4 -- -- -- -- 151 155 199 (6)
Finland -- -- -- -- 37 583 -- 620 (6) 1Germany -- 325 3 17 28 80 30 482 782 r 45Hong kong -- 6 -- 4 -- 1,180 10 1,200 939 r 9india 118 57 (6) 1 424 4,290 358 5,250 3,010 13Japan 1 92 73 -- 602 1,490 26 2,290 4,130 r 15korea, Republic of (6) 65 -- 4 12 2,240 85 2,410 3,070 r 19Malaysia -- 1 -- 1 -- 181 46 229 110 r 35Mexico 1,650 78 -- (6) 90 139 74 2,040 2,290 r 48netherlands -- 1 5 -- 239 164 134 543 446 r (6)
Pakistan 47 1 -- -- 10 4,030 (6) 4,090 5,690 --Russia -- 3 -- -- -- -- 270 273 82 4Singapore (6) 154 (6) 2 6 45 51 259 183 r 7Spain -- 3 -- (6) -- 1,350 1 1,350 35 r (6)
Sweden -- (6) -- -- 1,340 129 -- 1,470 695 r 1Taiwan 5 21 2 1 16 8,700 36 8,780 13,700 23Thailand -- 63 (6) -- 2 179 69 313 615 r 1United Arab emirates -- 7 -- -- -- 54 70 132 94 1United kingdom 316 71 -- 378 712 38 81 1,600 2,080 88Venezuela -- 1 -- -- -- (6) 205 206 70 27Other 146 120 9 49 29 294 362 1,010 1,710 r 104
Total 2,440 1,470 118 1,620 13,400 38,500 3,940 61,500 66,800 526
Source: U.S. Census Bureau.
2The nickel contents are assumed to be as follows: metallurgical-grade oxide, 77%; waste and scrap, 50%; and stainless steel scrap, 7.5%. The “Chemicals”category contains the following: chemical-grade oxide, sesquioxide, and hydroxide, 65%; chlorides, 25%; and sulfates, 22%. Other salts and variouscatalysts are assumed to be 22% nickel.
4chemical-grade oxide is included in the “chemicals” category.5not included in “2015, Total.”6less than ½ unit.
3countries listed were the leading export recipients in 2015 in terms of quantity (contained weight).
2015
TABle 7U.S. eXPORTS OF nickel PRODUcTS, BY cOUnTRY1
(Metric tons of contained nickel)2
1Data are rounded to no more than three significant digits; may not add to totals shown.
rRevised. -- Zero.
51.12 [ADVAnce ReleASe] U.S. GeOlOGicAl SURVeY MineRAlS YeARBOOk—2015
Quantity Quantity(metric tons of Value (metric tons of Value
class contained nickel) (thousands) contained nickel) (thousands)Primary:
Unwrought:cathodes, pellets, briquets, shot 126,000 $2,100,000 109,000 $1,410,000Ferronickel 20,500 313,000 11,100 139,000Powder and flakes 5,730 125,000 5,230 98,500Metallurgical-grade oxide2 851 17,300 895 18,500
Chemicals:catalysts3 1,750 r 99,500 r 2,740 89,700Salts4 1,030 25,700 949 16,900Total 156,000 2,680,000 r 130,000 1,770,000
Secondary:5
Stainless steel scrap 24,700 426,000 14,400 165,000Waste and scrap 14,300 216,000 12,700 173,000
Total 39,000 r 642,000 27,100 337,000Grand total 195,000 3,330,000 157,000 2,110,000
Wrought, not alloyed:Bars, rods, profiles, wire 288 8,310 260 7,060Sheets, strip, foil 356 10,200 427 10,300Tubes and pipes 82 2,470 103 2,430
Total 727 r 20,900 790 19,800Alloyed, gross weight:
Unwrought alloyed ingot 13,300 221,000 10,600 173,000Bars, rods, profiles, wire 12,500 r 329,000 r 13,200 317,000Sheets, strip, foil 4,310 95,000 3,700 84,100Tubes and pipes 1,630 r 99,300 1,820 106,000Other alloyed articles 1,770 r 180,000 r 2,950 207,000
Total 33,500 r 924,000 r 32,200 887,000
Source: U.S. Census Bureau.
sulfates, 22%; and other salts, assumed to be 22%. excludes nickel carbonate. 5Waste and scrap is assumed to be 50% nickel; stainless steel scrap, 7.5% nickel.
2014 2015
rRevised.
4Nickel contents are as follows: chemical-grade oxide, sesquioxide, and hydroxide, 65%; chlorides, 25%;
TABle 8U.S. iMPORTS FOR cOnSUMPTiOn OF nickel PRODUcTS, BY clASS1
1Data are rounded to no more than three significant digits; may not add to totals shown.2nickel content from Australia, 90%; elsewhere, 77%. 3Typical catalyst is assumed to have a nickel content of 22%.

nickel—2015 [ADVAnce ReleASe] 51.13
cathodes,pellets, and Powder Wrought
briquets and Metallurgical- Waste Stainless Total nickelcountry3 (unwrought) flakes Ferronickel grade oxide4 and scrap steel scrap chemicals Total in 2014 in 20155
Australia 10,300 470 -- 883 251 -- -- 11,900 16,100 --Belgium -- 91 -- -- -- (6) 240 331 483 r 9Brazil 6,220 -- 2,200 -- 200 120 1,240 9,980 9,560 --canada 49,500 3,240 (6) (6) 3,310 6,980 71 63,100 72,100 5china 208 59 200 -- 652 14 7 1,140 1,580 r 11colombia -- -- 2,520 -- (6) 34 -- 2,550 7,960 --Denmark -- -- -- -- -- -- 243 243 211 --Finland 9,570 45 -- -- -- -- 118 9,730 10,600 --France 68 10 291 -- 1,040 2 230 1,640 1,970 114Germany -- 38 -- -- 852 2 335 1,230 1,850 417Guatemala -- -- 1,290 -- -- 8 -- 1,290 741 r --india -- -- (6) (6) 38 2 339 379 376 60Japan 3,270 86 -- 6 1,120 6 141 4,630 4,110 33korea, Republic of -- -- -- -- 240 (6) 37 278 203 --Madagascar 7,250 -- -- -- -- -- -- 7,250 4,610 --Mexico 1 1 -- -- 923 7,040 13 7,980 10,700 --netherlands 18 -- -- 1 -- -- 293 313 2,830 1new caledonia -- -- 3,020 -- -- -- -- 3,020 6,090 --norway 13,000 -- -- -- 8 -- -- 13,100 18,600 --Russia 8,540 241 -- -- 65 -- (6) 8,840 13,000 --South Africa 755 478 -- -- -- -- 14 1,250 1,510 --Taiwan -- -- (6) -- 223 3 12 238 328 (6)
Turkey -- -- -- -- 270 12 -- 282 315 --Ukraine -- -- 1,060 -- -- -- -- 1,060 938 --United kingdom 166 449 17 4 2,580 24 222 3,470 4,670 14Venezuela -- -- 502 -- -- -- -- 502 1,360 --Other -- 21 -- -- 888 173 126 1,210 2,040 r 126
Total 109,000 5,230 11,100 895 12,700 14,400 3,690 157,000 195,000 790rRevised. -- Zero.1Data are rounded to no more than three significant digits; may not add to totals shown.2The nickel contents are assumed to be as follows: metallurgical-grade oxide from Australia, 90%; elsewhere, 77%. The “Chemicals” category contains the
Source: U.S. Census Bureau.
following: chemical-grade oxide, sesquioxide, and hydroxide, 65%; chlorides, 25%; sulfates, 22%. Other salts and various catalysts are assumed to be 22% nickel.Waste and scrap is assumed to be 50% nickel; stainless steel scrap, 7.5% nickel.
4Primarily oxide, rondelles, and sinter.5not included in “2015, Total.”6less than ½ unit.
3countries listed were the leading exporters to the United States in 2015 in terms of quantity (contained weight).
TABle 9
2015
U.S. iMPORTS FOR cOnSUMPTiOn OF nickel PRODUcTS, BY cOUnTRY1
(Metric tons of contained nickel)2

51.14 [ADVAnce ReleASe] U.S. GeOlOGicAl SURVeY MineRAlS YeARBOOk—2015
country and products3 2011 2012 2013 2014 2015Albania, laterite oree 3,000 1,000 2,100 4,900 6,100Australia, ore and concentrate 215,000 244,000 234,000 245,000 222,000Botswana, matte 15,675 17,948 22,848 14,958 16,789Brazil, ore 131,673 139,531 r 104,829 167,063 160,000 e
Burma, laterite oree 800 5,000 9,000 21,000 26,400canada, concentrate 219,025 211,701 227,743 228,867 r 234,936china 94,500 103,860 107,160 4 94,101 r, 4 92,900Colombia, laterite ore:
Minede 76,000 84,000 84,700 nA nADry5 nA nA nA 44,100 40,400
Cuba, recoverable laterite:e
limonitic 38,100 35,700 34,500 26,300 nASerpentinitic 34,400 32,500 31,500 24,100 nA
Total 72,500 68,200 66,000 50,400 56,400Dominican Republic, laterite ore 21,693 25,590 15,825 -- --Finland 18,800 19,590 19,440 18,730 9,700Greece, laterite ore 21,710 21,980 19,100 e 21,405 19,610Guatemala, laterite oree -- 2,400 12,500 r 46,800 r 52,400indonesia, laterite ore 564,400 648,400 834,200 177,100 129,000kazakhstan, laterite oree 500 450 -- -- --kosovo, laterite ore 7,728 4,436 7,606 6,724 7,418Macedonia, laterite oree 3,600 1,680 nA nA --Madagascar, laterite ore (mixed sulfide)e (6) 8,300 r 27,200 r 37,400 r 45,500Morocco, nickel sulfate 217 288 175 220 250 e
new caledonia, laterite ore 128,732 131,693 164,406 178,080 186,065norway, concentrate 339 351 350 r 350 r, e 350 e
Papua new Guinea, laterite ore (mixed hydroxide) -- 5,283 11,369 20,987 25,582Philippines, laterite ore7 349,000 r 455,000 r 466,000 r 586,000 r 554,000Russia, marketable mine production:
laterite ore 41,777 26,620 10,000 e 11,200 --Sulfide concentrate 281,690 r 270,030 r 270,700 r 271,950 r 269,310
Total 323,467 r 296,650 r 281,000 r, e 283,150 r 269,310South Africa, concentrate 43,321 45,945 51,208 54,956 56,689Spain, concentrate -- 2,398 7,574 8,631 7,213Turkey, laterite oree 4,300 3,500 1,200 3,200 r 9,600United States, concentrate -- -- -- r 4,300 27,200Venezuela, laterite oree 14,000 r 8,100 r -- r 3,600 r 3,700Vietnam -- -- r 1,166 6,854 8,607Zambia, concentrate 2,724 -- -- -- --Zimbabwe, concentrate 7,992 7,899 12,962 16,633 16,108
Grand total 2,340,000 r 2,570,000 r 2,790,000 2,350,000 r 2,280,000Of which:8
Mined from laterite ore 1,310,000 r 1,500,000 r 1,730,000 r 1,210,000 r 1,160,000Mined from sulfide ore9 570,000 r 556,000 r 594,000 r 607,000 r 637,000Mined from undifferentiated and other10 461,000 r 508,000 r 466,000 r 525,000 r 485,000
eestimated. rRevised. NA Not available. -- Zero.
TABle 10NICKEL: WORLD MINE PRODUCTION, BY COUNTRY1, 2
(Metric tons of contained nickel)
1Grand totals, U.S. data, and estimated data are rounded to no more than three significant digits; may not add to totals shown.2insofar as possible, this table represents recoverable mine production of nickel. Where actual mine output was not available, data related to a more highly processed form have been used to provide an indication of the magnitude of mine output and this was noted.3in addition to the countries listed, north korea may have had an active nickel mine, but information was inadequate to make reliable
4Beginning in 2014, mine production was as reported by South32 ltd.
United States, concentrate; Vietnam; Zambia, concentrate; and Zimbabwe, concentrate.10includes Australia, ore and concentrate; Brazil, ore; china; Finland; Morocco, nickel sulfate; and norway, concentrate.
estimates of output.
6Buildup of ore stockpile.7nickel content of imported nickel ore and concentrates (Harmonized Tariff Schedule of the United States code 2604) into Australia, china, and Japan from the Philippines.8An effort has been made to characterize a country's mine production by ore type (laterite, sulfide, undifferentiated and other), but the data may include a small amount of production from other deposit types.9includes Botswana, matte; canada, concentrate; Russia, sulfide concentrate; South Africa, concentrate; Spain, concentrate;
5Data for fiscal year ending June 30 of the year stated.

nickel—2015 [ADVAnce ReleASe] 51.15
country 2011 2012 2013 2014 2015Matte:
Australia3 56,200 66,294 68,999 61,545 68,400Botswana 15,675 r 17,948 22,848 14,958 16,789Brazil4 13,703 14,345 11,641 -- r --canada5 69,774 r 69,605 r 70,670 r 71,075 r 78,833Finland 16,088 12,915 8,662 8,363 17,000indonesia6 67,800 r 69,000 r 78,800 r 78,700 r 79,500new caledonia 13,780 13,417 13,279 8,241 6,761Russia 65 7 1 7 -- -- -- e
South Africa -- -- 5,800 7,700 r 400Zimbabwe8 3,519 3,787 3,909 r 4,830 r 3,887
Total, matte 257,000 r 267,000 r 285,000 r 255,000 r 272,000Other:
Cuba:e, 9
nickel-cobalt sulfide 34,816 10 34,325 10 33,900 r 34,000 r 34,000Ammoniacal liquor precipitate and unspecified 2,400 2,300 1,400 r -- r --
Total, cuba 37,200 36,600 35,300 r 34,000 r 34,000new caledonia, nickel-cobalt hydroxide11 7,374 3,378 7,557 12,464 9,685Papua new Guinea, nickel-cobalt hydroxide11 -- 5,283 11,369 20,987 25,582Philippines 22,794 23,890 26,021 50,647 49,151
Total, other 44,600 45,300 54,200 r 67,500 r 69,300Grand total, matte and other 324,000 r 336,000 r 365,000 r 374,000 r 390,000
eestimated. rRevised. -- Zero.
TABle 11NICKEL: WORLD PRODUCTION OF INTERMEDIATE PRODUCTS FOR EXPORT, BY COUNTRY1, 2
(Metric tons of contained nickel)
10Reported figure.11Often called mixed hydroxide product or MHP by industry.
1Data represent nickel content of matte and other intermediate materials produced that were destined for export.2estimated data and totals are rounded to no more than three significant digits; may not add to totals shown.3Figures exclude toll-refined material. 4Represents the output of the Fortaleza smelter. All of the Fortaleza matte was shipped to Finland for further processing.5nickel content of reported exports. Matte from the smelter at Falconbridge typically assayed 55% nickel.6Represents the nickel output of the Sorowako smelter. The Soroako matte was shipped to Japan for further processing and contains on average 78% nickel.7Primarily exports to China. Sources: International Nickel Study Group (INSG) and United Nations Statistics Division. The average nickel content of the exported matte was estimated to be 25%.8Zimplats matte shipped to the Impala Refinery at Springs, South Africa.9corrected to remove byproduct cobalt.

51.16 [ADVAnce ReleASe] U.S. GeOlOGicAl SURVeY MineRAlS YeARBOOk—2015
country and product2 2011 2012 2013 2014 2015Australia:
Metal 97,655 115,796 133,019 130,799 122,000Unspecified 12,558 12,963 8,500 7,901 10,500
Total 110,213 128,759 141,519 138,700 132,500Austria, ferronickel and ferronickel molybdenume 700 800 800 r 1,000 1,200Brazil:
Ferronickel 16,750 31,342 34,501 37,237 30,300Metal 20,521 21,437 19,823 21,000 20,100
Total 37,271 52,779 54,324 58,237 50,400Burma, ferronickel3 -- -- 1,237 r 15,340 r 15,588canada, unspecified 142,445 146,850 r 152,728 r 149,486 r 146,233China:4
Ferronickel and high-nickel pig iron 248,400 353,200 480,000 470,000 385,000Metal 175,000 197,000 227,000 r 247,000 r 232,000chemicals and unspecified 8,900 9,000 9,000 21,000 19,000
Total 432,000 559,000 716,000 r 738,000 r 636,000colombia, ferronickel 37,817 51,595 49,320 41,221 r 36,671cuba, oxide sinter and oxides 19,186 25,702 15,279 13,000 r, e 13,000 e
Dominican Republic, ferronickel 13,528 15,186 9,400 -- --Finland:
Metal, electrolytic, including cathode and briquets 43,840 40,131 39,500 r 36,500 r 37,000chemicals and unspecified, including powder, salts, solutions,
and other 5,983 6,144 4,700 r 6,100 r, e 7,365Total 49,823 46,275 44,200 r 42,600 r, e 44,365
France:5
Metal 11,697 11,311 10,300 e 7,141 5,500 e
chemicals 2,039 1,927 1,821 1,263 990 e
Total 13,736 13,238 12,100 e 8,404 6,490 e
Greece, ferronickel 18,527 18,632 16,890 18,481 17,114Guatemala, ferronickel -- -- -- 5,000 10,826india, ferronickel magnesium6 107 114 200 200 e 200 e
indonesia, ferronickel 19,690 18,373 18,249 16,851 17,211Japan:
Ferronickel 62,773 73,248 80,554 70,070 74,224Metal 41,290 41,944 46,405 56,129 64,221Oxide sinter 50,437 51,999 48,873 45,907 48,197chemicals 2,383 2,362 2,191 5,673 6,147
Total 156,883 169,553 178,023 177,779 192,789Korea, Republic of:
Ferronickel 19,011 20,858 25,376 22,799 39,000Metal (7) (7) (7) (7) (7)
Total 19,011 20,858 25,376 22,799 39,000kosovo, ferronickel 7,728 4,436 r 7,606 r 6,724 r 7,418Macedonia, ferronickel 17,292 19,247 20,001 18,054 17,699Madagascar, metal -- 5,695 25,148 37,053 47,271Morocco, chemicals, including nickel sulfate (8) (8) (8) (8) (8)
New Caledonia:Ferronickel 40,015 43,030 40,459 54,863 56,486nickel oxide sinter -- 2,353 7,911 7,366 21,044
Total 40,015 45,383 48,370 62,229 77,530norway, metal 92,427 91,687 91,017 90,500 91,200Russia:e
Ferronickel:High-nickel 16,899 9 9,782 9 -- -- --Other10 5,360 3,110 -- -- --
Total, ferronickel 22,300 12,900 -- -- --Metal 264,900 9 255,000 9 241,800 9 231,000 223,000chemicals 2,900 2,700 r 2,700 r 2,700 2,900
Total, Russia 290,000 271,000 245,000 r 234,000 226,000
TABle 12NICKEL: WORLD PLANT PRODUCTION, BY COUNTRY1
(Metric tons of contained nickel)
See footnotes at end of table.

nickel—2015 [ADVAnce ReleASe] 51.17
country and product2 2011 2012 2013 2014 2015South Africa:
Ferronickel, high-nickel 575 658 650 e nA nAMetal 35,900 32,900 33,200 r 34,100 r 42,000chemicals 5,564 11 5,093 11 5,100 e 3,500 r, e 5,400
Total 42,039 38,651 39,000 r, e 37,600 r, e 47,400Taiwan, metale (7) (7) (7) (7) (7)
Ukraine, ferronickel12 14,640 20,628 21,184 18,615 15,516United kingdom, metal13 37,400 34,300 42,400 39,100 39,100 e
Venezuela, ferronickele 13,300 8,100 -- 4,000 4,000Zimbabwe, metal, toll refined from imported nickel feed14 3,715 1,754 2,845 2,915 r 617
Grand total 1,630,000 1,810,000 r 1,980,000 2,000,000 r 1,930,000Of which:
Ferronickel, including ferronickel magnesium, ferronickelmolybdenum, and high-nickel pig iron 553,000 692,000 r 806,000 r 800,000 r 728,000
Metal 824,000 r 849,000 r 912,000 r 933,000 r 924,000Oxide sinter 69,600 80,100 r 72,100 r 66,300 r 82,200chemicals, including nickel sulfate 12,900 12,100 r 11,800 r 13,100 r 15,400Unspecified 170,000 175,000 r 175,000 r 184,000 r 183,000
3imports to other countries of ferronickel from Burma, assumed 26% nickel content.
eestimated. rRevised. NA Not available. -- Zero.1Grand totals and estimated data are rounded to no more than three significant digits; may not add to totals shown.2Several countries produced nickel-containing matte and other intermediate nickel products, but output of nickel in such materials has been excluded from this table to avoid double counting. countries that produced matte for export are listed in table 11. in addition to the countries listed, north korea may have had an active mine and was thought to have produced metallic nickel and (or) ferronickel, but information was inadequate to make reliable estimates of output.
with the domestic copper concentrates.
4Figures for ferronickel and chemicals were derived from data published by Beijing Antaike information Development co. ltd. Figures for electrolytic and other class i nickel are based on data provided by the china nonferrous Metals industry Association and the international nickel Study Group. china also produced nickeliferous pig iron from lateritic ores imported from indonesia,
5Reported by eRAMeT Group for the Sandouville plant. includes a small amount of cobalt that was not recovered separately. Does not include secondary production from spent rechargeable batteries.6india’s fiscal year ending March 31 of the year stated.
new caledonia, and the Philippines.
11includes nickel sulfate plus exported metal in concentrate.12May include nickel in remelt alloys derived from scrap.13includes nickel contents of chemicals.14Data represent production from matte imported from Botswana and nickel sulfate imported from South Africa.
TABle 12—continuedNICKEL: WORLD PLANT PRODUCTION, BY COUNTRY1
(Metric tons of contained nickel)
7Utility® nickel production figures for the Republic of korea and Taiwan were not included because the production was derived wholly from imported metallurgical-grade oxides and to include them would result in double counting. 8Most of the nickel sulfate was a byproduct of the concentrating, smelting, and refining of domestically mined copper ores. Some production, however, may have been derived from imported nickeliferous raw materials that were blended
9Reported figure.10includes ferronickel chromium and nickel-resist cast iron.