2015 michigan economic competitiveness benchmarking report
TRANSCRIPT

2015 Economic Competitiveness Benchmarking Report:
Data Supporting the Michigan Turnaround PlanNovember 2015
About Business Leaders for MichiganBusiness Leaders for Michigan, the state’s business roundtable, is dedicated to making Michigan a “Top Ten” state for jobs, personalincome and a healthy economy. The organization is composed exclusively of the chairpersons, chief executive officers, or most seniorexecutives of Michigan’s largest companies and universities. Our members drive over 32% of the state’s economy, provide nearly375,000 direct jobs in Michigan, generate over $1 trillion in annual revenue and serve nearly one half of all Michigan public universitystudents. Find out more at www.businessleadersformichigan.com
Copyright © 2015 Business Leaders for Michigan. All Rights Reserved.
1 Introduction
2 Methodology
4 Key Findings
7 Output Metrics
18 Input Metrics
66 Michigan’s Regional Performance
74 Business Leaders for Michigan Board of Directors

Business Leaders for Michigan I 2015 Econom
ic Competitiveness Benchm
arking Report
1
Introduction
This report provides a fact-based assessment of Michigan’s economic competitiveness
relative to other states. Michigan’s performance is compared on key output (e.g.,
employment, GDP) and input (e.g., labor cost) metrics. A set of “traditional,” “new economy,”
and “Top Ten” benchmark states were used to provide multiple reference points to evaluate
Michigan’s performance.
While the intent of this report is not to make recommendations, general conclusions are
outlined. These conclusions are used by Business Leaders for Michigan to help develop
strategies for making Michigan a “Top Ten” state for jobs, personal income, and a healthy
economy.
Why is it important for Michigan to be a “Top Ten” state? Simply put, it would
result in more jobs, better incomes and a stronger economy. If Michigan were performing
like a “Top Ten” state today, there would be:
120,000more Michigan people working
$11,000more income per person
$13,000more GDP per person
Research for the 2015 Economic Competitiveness Benchmarking Report was
conducted by Anderson Economic Group, a research and consulting firm with
expertise in economics, public policy, finance, and industry analysis.

Methodology
UNEMPLOYMENT RATE
RANK
Leve
l
467.3%
5.1%
th
Tren
dTo
p 1
0 A
vg.
How To Read This Report
Across the globe, analysts use a series of commonmeasures to determine the economic strength ofcountries, states, and regions. The measures aredivided into two categories: outputs and inputs.
•Output indicators like jobs, income,population and GDP show us the impact of policydecisions. They are the end result of ongoingeconomic development and policy changes.
• Input indicators measure the factorsbusinesses look at when deciding where tolocate. In this report, Michigan’s input metricsare divided into two categories: costindicators and value indicators. Whendeciding whether nor not to locate or expandin a region, job providers evaluate the costs(e.g., taxes, fees, utilities) of doing business ina region relative to the value (e.g., talent,infrastructure) it provides. Ultimately, areasthat offer more value for equal or lower costencourage business growth and attraction
which leads to more jobs, higher incomes and astronger economy. They include factors like thecost of doing business, the incentives available, thepool of talent, and available infrastructure tosupport company operations. When these indicatorsare positive, they greatly influence site selectiondecisions and, ultimately, lead to stronger outputs.
The correlation between the inputs and the outputsis important to keep in mind when reading thisreport. Ultimately, the inputs are the factors overwhich state leaders have the greatest amount ofcontrol. This year’s benchmarking results can offercontinuing direction as we collectively evaluate thenext crucial decisions for our economy.
With all this in mind, readers of this benchmarkingreport can see at a glance what progress has beenmade, where Michigan ranks relative to the rest ofthe U.S., and which direction we’re moving. Thekey below shows you how.
Michigan’srank amongthe 50 states, with #1 being topperformance and#50 being worstperformance inthe category.
Michigan’s level ofperformance for themost recent year
One-year trend
Average performanceof the “Top Ten” states
Positive Negative Holding
Business Leaders for Michigan I20
15 Economic Com
petitiveness Benchmarking Report
2
3
STATE
North DakotaNew YorkTexasMassachusettsWyomingWashingtonAlaskaNebraskaPennsylvaniaIowa
OVERALRANK
123456789
10
EMPLOYMENTGROWTH2
1248
10145
16117
EMPLOYMENTLEVEL2
117312
2030374
116
POPULATIONGROWTH
11403
35101215273934
POPULATIONLEVEL
4742
14501348376
30
PER CAPITAINCOMEGROWTH
196172
244
151814
PER CAPITAINCOMELEVEL
64
2427
129
191725
PER CAPITAGDP
LEVEL
23
116591
152321
PER CAPITAGDP
GROWTH
143
1459
156
1812
Top Ten States
WA
OR
CA
NV
UT
AZNM
CO
ID
MT
KS
OK
MN
MO
AR
LA
ILIN
OH
KY
TN
MS AL GA
FL
SC
NC
VAWV
ME
NH
NJ
DE
MDDC
CTRI
MAWI
MI
HI
VT
Traditional Benchmarks
New Economy Benchmarks
Peer States
WA
OR
NV
UT
AZNM
WY
ID
MT ND
SD
NE
KS
OK
MN
IA
MO
AR
LA
KY
MS
FL
SC
WV
PA
NY
ME
NH
NJ
DE
MDDC
CTRI
MAWI
MI
AK
HI
VT
ND
SD
NEIA
TX
AK
NY
CA COIL
OH
TN
AL GA
NC
TX
IN
VA
WY
PA
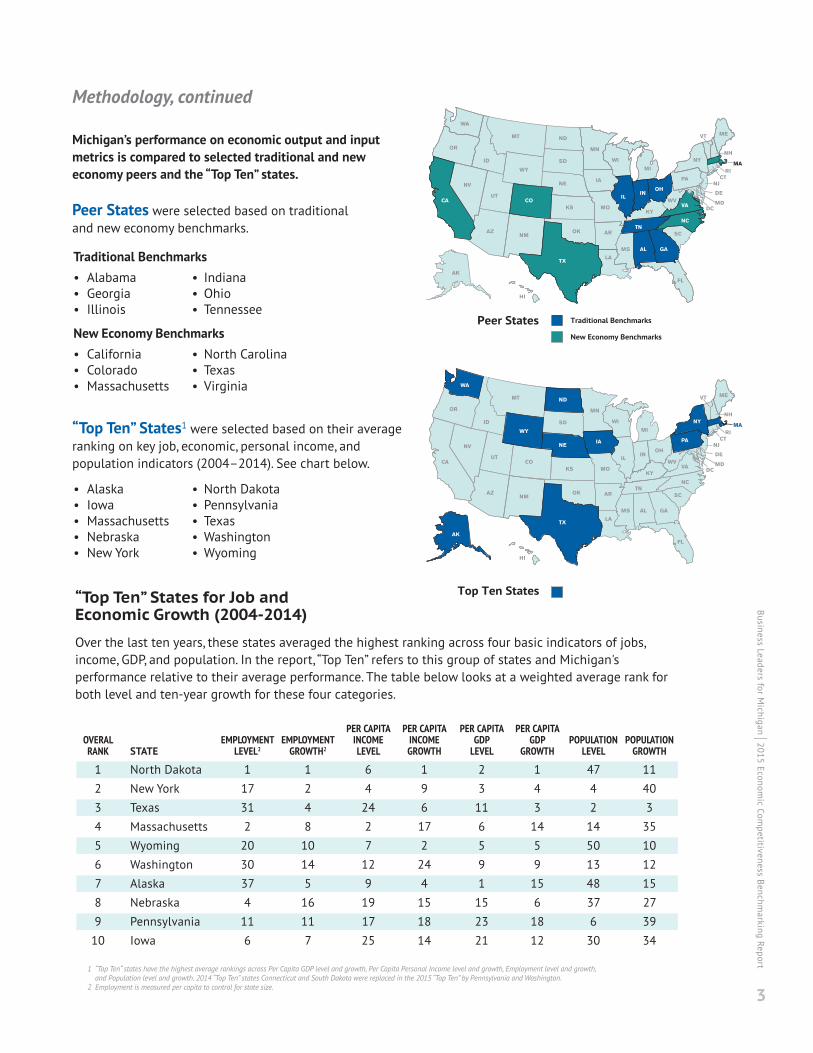
Methodology, continued
Michigan’s performance on economic output and inputmetrics is compared to selected traditional and neweconomy peers and the “Top Ten” states.
Peer States were selected based on traditionaland new economy benchmarks.
Traditional Benchmarks• Alabama • Indiana• Georgia • Ohio• Illinois • Tennessee
New Economy Benchmarks• California • North Carolina• Colorado • Texas• Massachusetts • Virginia
“Top Ten” States1 were selected based on their averageranking on key job, economic, personal income, andpopulation indicators (2004–2014). See chart below.
• Alaska • North Dakota• Iowa • Pennsylvania• Massachusetts • Texas• Nebraska • Washington• New York • Wyoming
“Top Ten” States for Job and Economic Growth (2004-2014)
Over the last ten years, these states averaged the highest ranking across four basic indicators of jobs,income, GDP, and population. In the report, “Top Ten” refers to this group of states and Michigan'sperformance relative to their average performance. The table below looks at a weighted average rank forboth level and ten-year growth for these four categories.
Business Leaders for Michigan I 2015 Econom
ic Competitiveness Benchm
arking Report
1 “Top Ten“ states have the highest average rankings across Per Capita GDP level and growth, Per Capita Personal Income level and growth, Employment level and growth,and Population level and growth. 2014 “Top Ten” states Connecticut and South Dakota were replaced in the 2015 “Top Ten” by Pennsylvania and Washington.
2 Employment is measured per capita to control for state size.

Business Leaders for Michigan I20
15 Economic Com
petitiveness Benchmarking Report
4
Key Findings
OutputIn 2009, Michigan was headed in the wrongdirection across 11 key output indicators ofeconomic performance.
In 2014, Michigan was headed in the rightdirection on most measures and ranked:
• 18th for employment growth• 10th for per capita personal income growth, and • 3rd for per capita gross domestic product growth.
Despite the fact that Michigan is growingfaster than most states, absolute levels foremployment, per capita income and per capitaGDP remain average or below.
While Michigan remains one of the 10 largeststates, population growth was slow, yielding aranking of only 41st nationwide.
2009
2014
0 2 4 6 8 10 12
Improving
Holding
11Declining
7Improving
1Holding
3 Declining
46thinUnemployment
Rate
36thinPer Capita
Personal Income
34thinGDP Per Capita
Michigan’s absolute levels:

5
Input - CostIn 2009, Michigan was headed in the wrongdirection on 10 of 15 indicators relative to thecost of being located in a given state.
In 2014, Michigan was headed in the rightdirection on 11 of 15 measures, and ranked:
• 10th for corporate tax climate, and• 13th for overall tax climate.
However this year, Michigan is trending in thewrong direction for both economicdevelopment expenditures and state unfundedpension liabilities, and ranks 28th for bothmeasures.
Input - ValueUnlike outputs and cost inputs, Michigan wasdoing better in 2009 on value inputs,improving in 15 of 24 areas.
In 2014, Michigan’s performance was flat orheaded in the wrong direction on 15measures, and ranked:
• 38th for 4th grade reading proficiency• 39th for urban road conditions, and • 41st for enrollment in high school careerand technical education.
While Michigan remains a Top Ten state forinnovation measures such as universityresearch and development and exports, recentperformance in those areas continues adownward trend.
Michigan ranked in the bottom five states forthe percent of population age 25–34.
Business Leaders for Michigan I 2015 Econom
ic Competitiveness Benchm
arking Report
2009
2014
0 2 4 6 8 10 12
2 Improving
3 Holding
10Declining
11Improving
1Holding
3 Declining
2009
2014
0 5 10 15
15 Improving
2 Holding
7Declining
9Improving
5Holding
10 Declining
Business Leaders for Michigan I20
15 Economic Com
petitiveness Benchmarking Report
6
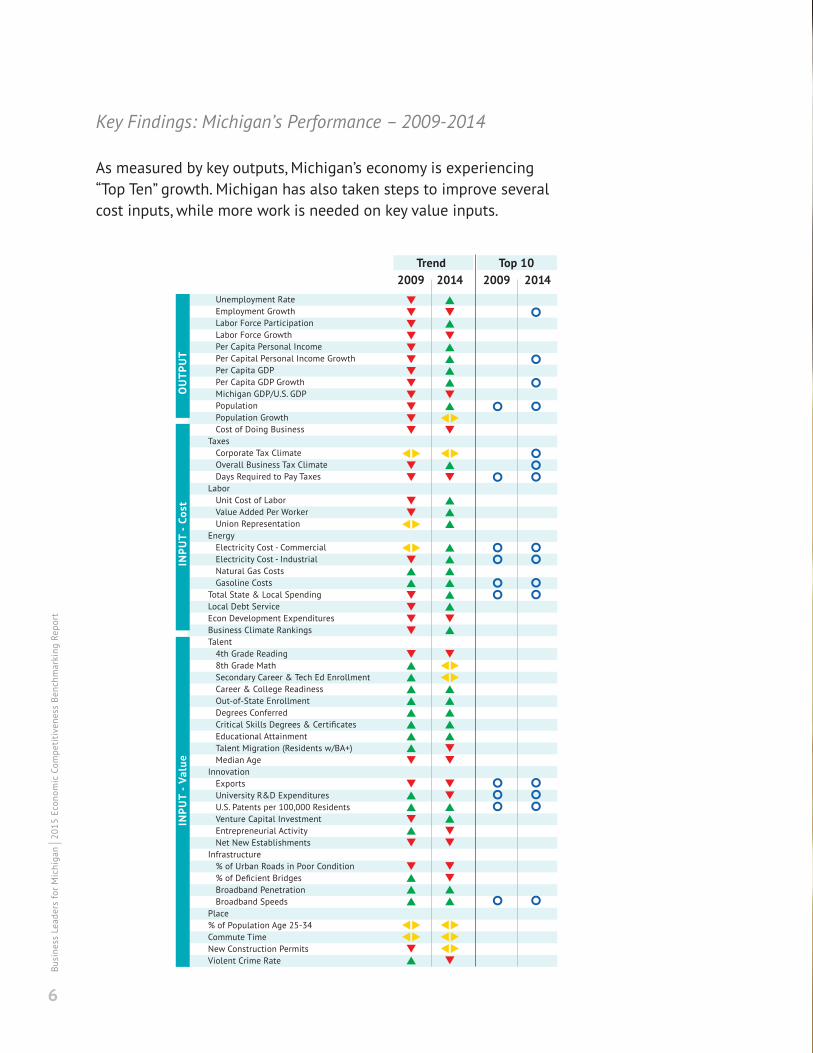
Unemployment Rate Employment Growth Labor Force Participation Labor Force Growth Per Capita Personal Income Per Capital Personal Income Growth Per Capita GDP Per Capita GDP Growth Michigan GDP/U.S. GDP Population Population Growth Cost of Doing Business
TaxesCorporate Tax ClimateOverall Business Tax ClimateDays Required to Pay Taxes
LaborUnit Cost of LaborValue Added Per WorkerUnion Representation
EnergyElectricity Cost - CommercialElectricity Cost - IndustrialNatural Gas CostsGasoline Costs
Total State & Local Spending Local Debt Service Econ Development Expenditures Business Climate Rankings Talent
4th Grade Reading8th Grade MathSecondary Career & Tech Ed EnrollmentCareer & College ReadinessOut-of-State Enrollment Degrees Conferred
Educational AttainmentTalent Migration (Residents w/BA+)Median Age
InnovationExportsUniversity R&D ExpendituresU.S. Patents per 100,000 ResidentsVenture Capital InvestmentEntrepreneurial ActivityNet New Establishments
Infrastructure% of Urban Roads in Poor Condition
Broadband PenetrationBroadband Speeds
Place% of Population Age 25-34Commute TimeNew Construction PermitsViolent Crime Rate
2009Trend Top 10
2014 2009 2014
OU
TPU
TIN
PUT
- Co
stIN
PUT
- Va
lue
Key Findings: Michigan’s Performance – 2009-2014
As measured by key outputs, Michigan’s economy is experiencing“Top Ten” growth. Michigan has also taken steps to improve severalcost inputs, while more work is needed on key value inputs.
Business Leaders for Michigan I 2015 Econom
ic Competitiveness Benchm
arking Report
7
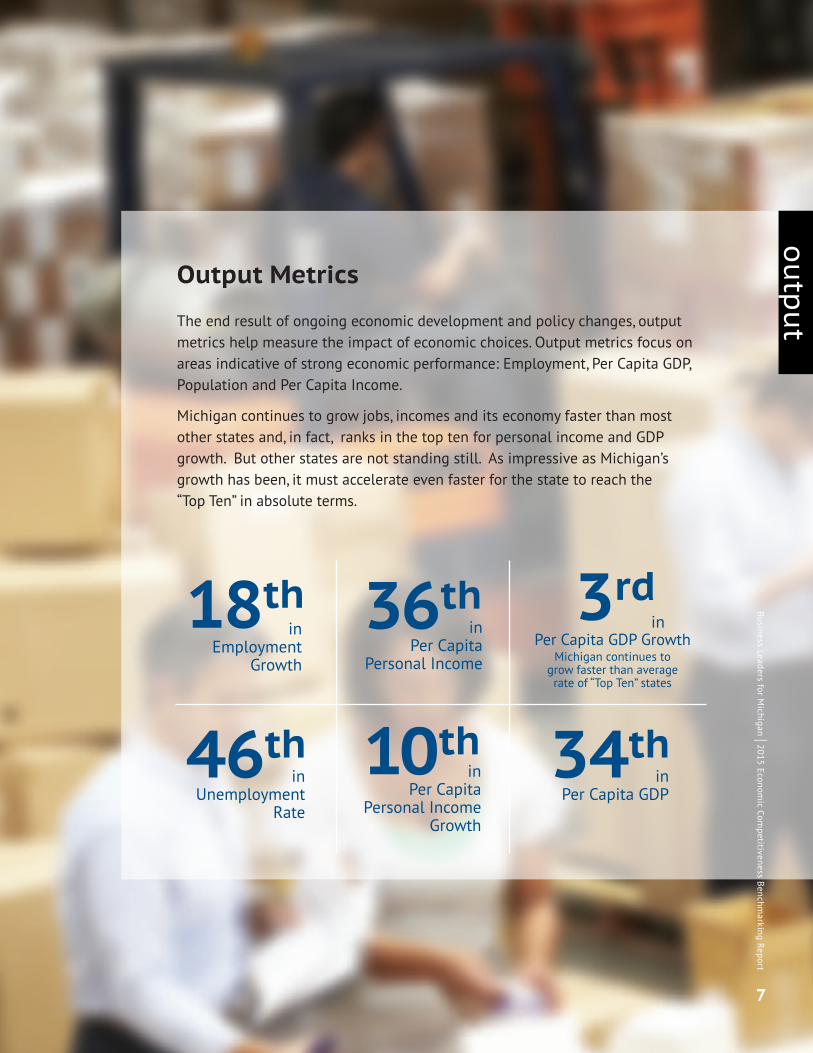
Output Metrics
The end result of ongoing economic development and policy changes, outputmetrics help measure the impact of economic choices. Output metrics focus onareas indicative of strong economic performance: Employment, Per Capita GDP,Population and Per Capita Income.
Michigan continues to grow jobs, incomes and its economy faster than mostother states and, in fact, ranks in the top ten for personal income and GDPgrowth. But other states are not standing still. As impressive as Michigan’sgrowth has been, it must accelerate even faster for the state to reach the“Top Ten” in absolute terms.
output
18thinEmployment
Growth
46thin Unemployment
Rate
34thin Per Capita GDP
36thin Per Capita
Personal Income
in
10thin Per Capita
Personal IncomeGrowth
3rdPer Capita GDP Growth
Michigan continues to grow faster than average rate of “Top Ten” states
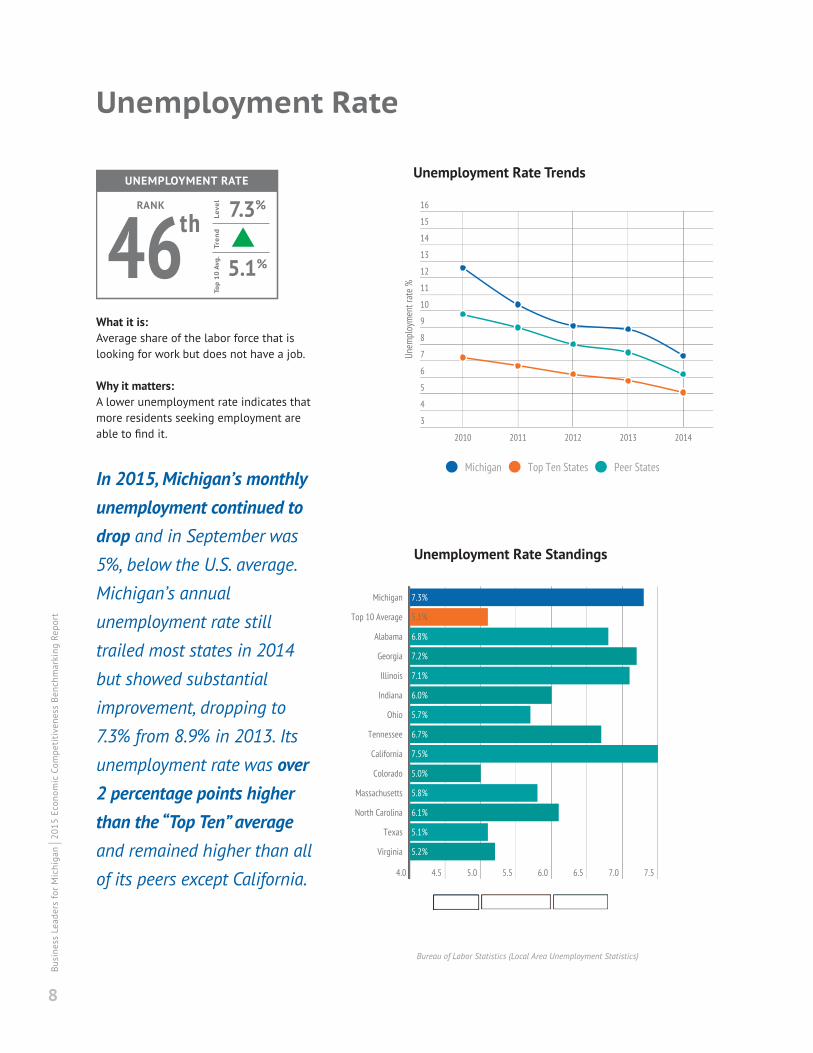
What it is:Average share of the labor force that islooking for work but does not have a job.
Why it matters:A lower unemployment rate indicates thatmore residents seeking employment areable to find it.
In 2015, Michigan’s monthlyunemployment continued todrop and in September was5%, below the U.S. average.Michigan’s annualunemployment rate stilltrailed most states in 2014but showed substantialimprovement, dropping to7.3% from 8.9% in 2013. Itsunemployment rate was over2 percentage points higherthan the “Top Ten” averageand remained higher than allof its peers except California.
Unemployment Rate Standings
Unemployment Rate
Bureau of Labor Statistics (Local Area Unemployment Statistics)
Business Leaders for Michigan I20
15 Economic Com
petitiveness Benchmarking Report
8
UNEMPLOYMENT RATE
RANKLe
vel
467.3%
5.1%
thTr
end
Top
10
Avg
.
Unemployment Rate Trends
9
output
Employment Growth Trends
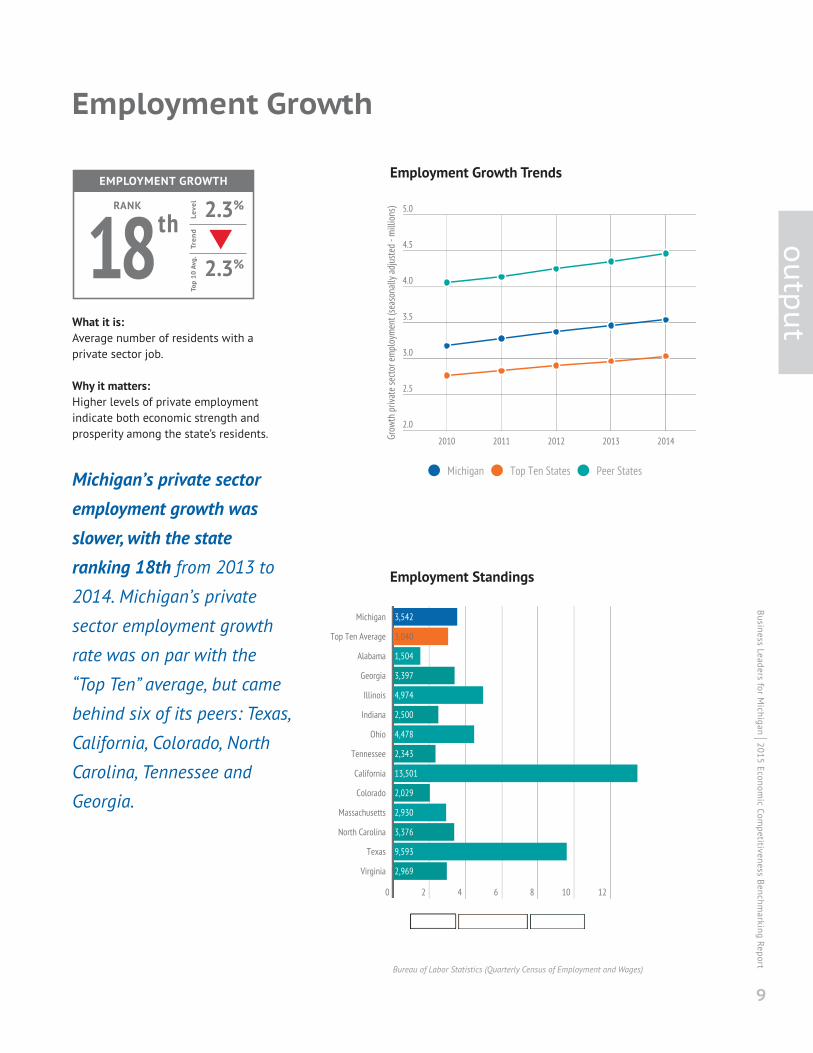
What it is:Average number of residents with aprivate sector job.
Why it matters:Higher levels of private employmentindicate both economic strength andprosperity among the state’s residents.
Michigan’s private sectoremployment growth wasslower, with the stateranking 18th from 2013 to2014. Michigan’s private
sector employment growth
rate was on par with the
“Top Ten” average, but came
behind six of its peers: Texas,
California, Colorado, North
Carolina, Tennessee and
Georgia.
Employment Standings
Bureau of Labor Statistics (Quarterly Census of Employment and Wages)
EMPLOYMENT GROWTH
RANKLe
vel
182.3%
2.3%
thTr
end
Top
10 A
vg.
Employment Growth
Business Leaders for Michigan I 2015 Econom
ic Competitiveness Benchm
arking Report
Labor Force Participation
Business Leaders for Michigan I20
15 Economic Com
petitiveness Benchmarking Report
10
Labor Force Participation Trends
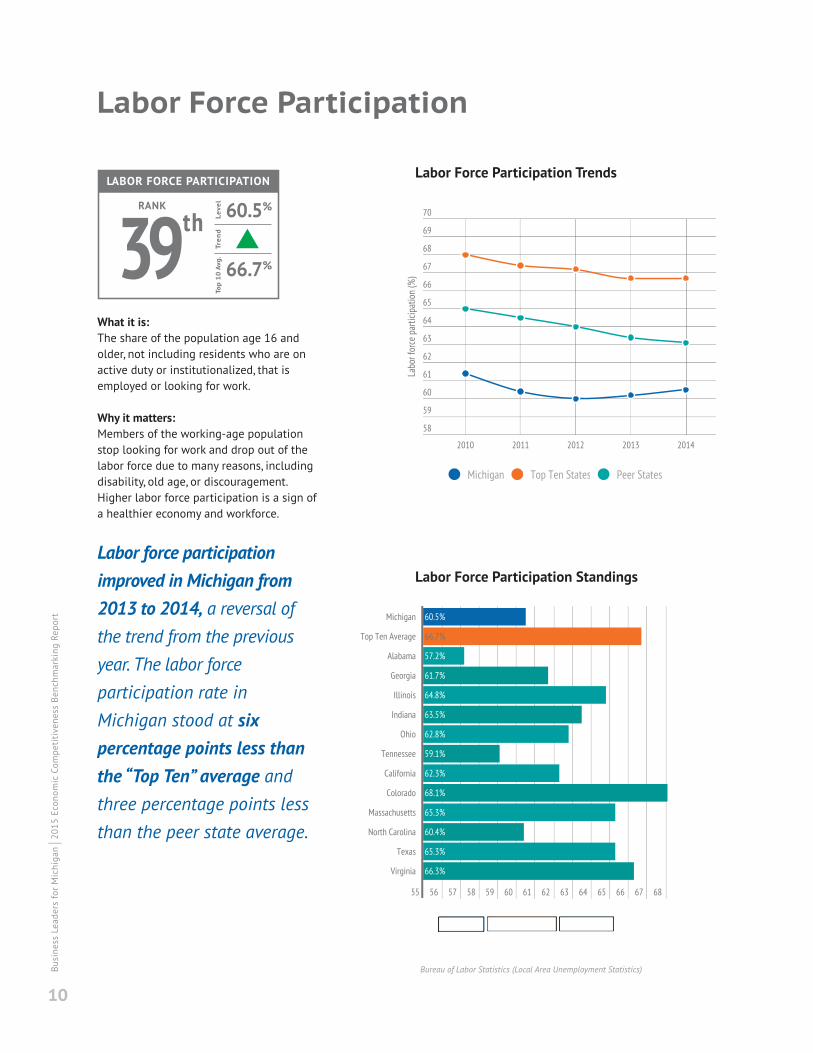
What it is:The share of the population age 16 andolder, not including residents who are onactive duty or institutionalized, that isemployed or looking for work.
Why it matters:Members of the working-age populationstop looking for work and drop out of thelabor force due to many reasons, includingdisability, old age, or discouragement.Higher labor force participation is a sign ofa healthier economy and workforce.
Labor force participationimproved in Michigan from2013 to 2014, a reversal ofthe trend from the previousyear. The labor forceparticipation rate inMichigan stood at sixpercentage points less thanthe “Top Ten” average andthree percentage points lessthan the peer state average.
Labor Force Participation Standings
Bureau of Labor Statistics (Local Area Unemployment Statistics)
LABOR FORCE PARTICIPATION
RANKLe
vel
3960.5%
66.7%
Tren
dTo
p 1
0 A
vg.
th

What it is:Change in the number of residentsemployed or looking for work.
Why it matters:Labor force includes the entire pool ofresidents that are interested in working,showing less volatility than employmentthroughout the business cycle. A growinglabor force shows a growing pool ofworkers for businesses.
The Michigan labor forcegrew more slowly from 2013to 2014 and now stands at
4.7 million. The increase in
Michigan’s labor force from
2013 to 2014 outpaced the
average increase for peer
states but was below the
average increase for the
“Top Ten” states.
Labor Force Standings
Labor Force Growth
Bureau of Labor Statistics (Local Area Unemployment Statistics)
11
output
LABOR FORCE GROWTH
RANKLe
vel
250.4%
0.7%
thTr
end
Top
10 A
vg.
Labor Force Growth Trends
Business Leaders for Michigan I 2015 Econom
ic Competitiveness Benchm
arking Report

Per Capita Personal Income
Business Leaders for Michigan I20
15 Economic Com
petitiveness Benchmarking Report
12
PER CAPITA PERSONAL INCOME GROWTH
RANK
Level
102.2%
1.4%
th
Trend
Top
10 A
vg.
Per Capita Personal Income Trends
What it is:Personal income (2014 dollars) divided bypopulation. Personal income includessalaries, wages, and bonuses fromemployment; dividends and interest frominvestments; rental income; pensions, etc.
Why it matters:This is an indicator of prosperity andaverage standard of living in a state.
Michigan’s per capitaincome growth from 2013 to2014 was the 10th fastest inthe nation—nearly twice asfast as the “Top Ten” averageand faster than all of itspeers save Colorado.However, its per capitaincome level was belowmore than half of its peers.
Per Capita Personal Income Standings
Bureau of Economic Analysis (personal income summary), Bureau of Labor Statistics (CPI Inflation Calculator)
PER CAPITA PERSONAL INCOME
RANKLe
vel
36$40,556
$51,300
thTr
end
Top
10
Avg
.

What it is:Total amount of goods and servicesproduced by private industries in thestate, adjusted for inflation and changesin relative prices, divided by population.
Why it matters:Higher private sector GDP per capita isone of the primary measures of a region’seconomic strength.
Michigan’s per capita GDP in2013 was ranked in thebottom half of states.However, growth in Michigan’sper capita GDP between 2013and 2014 ranked 3rd in thenation and was over fourtimes faster than the “TopTen” average. Michigan’s percapita GDP remained belowmost of its peers but itsgrowth over the past yearwas faster than most.
Per Capita GDP Standings
Per Capita GDP
Bureau of Economic Analysis (personal income summary),Bureau of Labor Statistics (CPI Inflation Calculator)
13
output
Per Capita GDP TrendsPER CAPITA GDP
RANK
Leve
l
34$37,593
$51,029
th
Tren
dTo
p 10
Avg
.
PER CAPITA GDP GROWTH
RANK
Leve
l
33.20%
0.73%
rd
Tren
dTo
p 1
0 A
vg.
Business Leaders for Michigan I 2015 Econom
ic Competitiveness Benchm
arking Report

Business Leaders for Michigan I20
15 Economic Com
petitiveness Benchmarking Report
14
What it is:Total amount of goods and servicesproduced in the state, as a share of allgoods and services produced in theUnited States.
Why it matters:A high share of United States GDP meansthat much of the country's production isoccurring in that state, and can result inhigher incomes for state workers.
Since 2009, Michigan’s
share of U.S. GDP has
remained relatively flat at
2.6% after falling from a
high of 3% in 2005.
Michigan GDP/U.S. GDP Standings
Michigan GDP/U.S. GDP
Bureau of Economic Analysis
Michigan GDP/U.S. GDP TrendsPER CAPITA GDP
RANKLe
vel
34$37,593
$51,029
thTr
end
Top
10 A
vg.
Population
POPULATION GROWTH
RANK
Leve
l
410.1%
0.7%
st
Tren
dTo
p 10
Avg
.
Population Trends
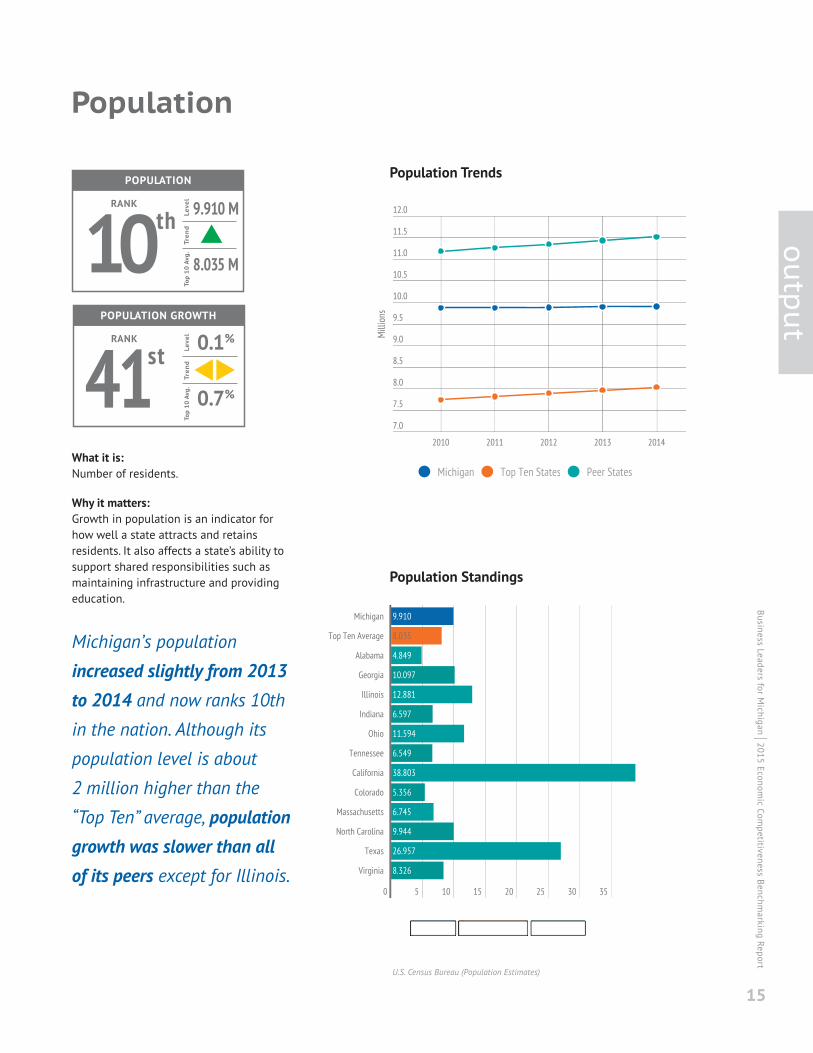
What it is:Number of residents.
Why it matters:Growth in population is an indicator forhow well a state attracts and retainsresidents. It also affects a state’s ability tosupport shared responsibilities such asmaintaining infrastructure and providingeducation.
Michigan’s population
increased slightly from 2013to 2014 and now ranks 10thin the nation. Although its
population level is about
2 million higher than the
“Top Ten” average, populationgrowth was slower than allof its peers except for Illinois.
Population Standings
U.S. Census Bureau (Population Estimates)
POPULATION
RANK
Level
10 9.910 M
8.035 M
th
Trend
Top
10 A
vg.
15
output
Business Leaders for Michigan I 2015 Econom
ic Competitiveness Benchm
arking Report

Output Conclusions
Despite Michigan’s outstanding post-recession growth,significant gaps remain between Michigan and “Top Ten” statesin job, income, and GDP levels.
Why is it important to be “Top Ten?”
Simply put, it would result in more jobs, betterincomes and a stronger economy. If Michigan wasperforming like a “Top Ten” state today, there would be:
More Jobs: 120,000 more Michigan people working
Higher incomes: $11,000 more income per person
Stronger economy: $13,000 more GDP per person
Business Leaders for Michigan I20
15 Economic Com
petitiveness Benchmarking Report
16

Business Leaders for Michigan I 2015 Econom
ic Competitiveness Benchm
arking Report
17
output

Business Leaders for Michigan I20
15 Economic Com
petitiveness Benchmarking Report
18
Input Metrics
In this report, Michigan’s input metrics are divided into two categories: cost indicatorsand value indicators. When deciding whether nor not to locate or expand in a region,job providers evaluate the costs (e.g., taxes, fees, utilities) of doing business in aregion relative to the value (e.g., talent, infrastructure) it provides. Ultimately, areasthat offer more value for equal or lower cost encourage business growth andattraction which leads to more jobs, higher incomes, and a stronger economy.
Cost indicators represent a region’s basic level of competitiveness. States that are notcompetitive on most cost factors don’t often get a second glance from job providerslooking to locate or expand their business.
Value indicators are what separate regions from one another when other factors areequal. When comparing two or more regions with similar cost structures, the regionwith better infrastructure, available talent, and innovation capabilities will often win.
When the relationship between cost and value indicators is positive, it can greatlyinfluence site selection decisions and, ultimately, lead to stronger outputs.
input
Cost Value

Moody's North American Business Cost Review (2012 data)
Cost of Doing Business
19
input
cost
Cost of Doing Business Trends
What it is:Index that compares the state’s averagebusiness costs (labor, energy, and state &local tax burden) with the nationalaverage (U.S. = 100).
Why it matters:Lower business costs make it easier forexisting businesses to succeed and makethe state more attractive to newbusinesses.
On average, businesses paid
more to operate in Michigan
than in “Top Ten” states and
peer states in 2012.
Michigan had the 12thhighest cost of doingbusiness in the nation. Theonly peer states whose costs
of doing business exceeded
Michigan’s were California
and Massachusetts.
Index: Cost of Doing Business Standings
COST OF DOING BUSINESS
RANKLe
vel 105
98
Tren
dTo
p 10
Avg
.39th
Business Leaders for Michigan I 2015 Econom
ic Competitiveness Benchm
arking Report

Corporate Tax Climate
Business Leaders for Michigan I20
15 Economic Com
petitiveness Benchmarking Report
20
Corporate Tax Climate Trends
What it is:Index that compares corporate tax burdenbased on corporate income tax and grossreceipts tax (10 = most favorable, 0 = leastfavorable).
Why it matters:A lower corporate tax burden can improvea state’s attractiveness to both new andexisting businesses.
Michigan was among the“Top Ten” states in terms ofcorporate tax climate in2014. Michigan’s corporate
tax climate rank exceeded all
of the “Top Ten” states except
Wyoming and tied for best
among peer states with
Virginia and Georgia.
Index: Corporate Tax Climate Standings
Tax Foundation (2014 State Business Tax Climate Index)
CORPORATE TAX CLIMATE
RANKLe
vel
105.8
5.3
thTr
end
Top
10
Avg
.
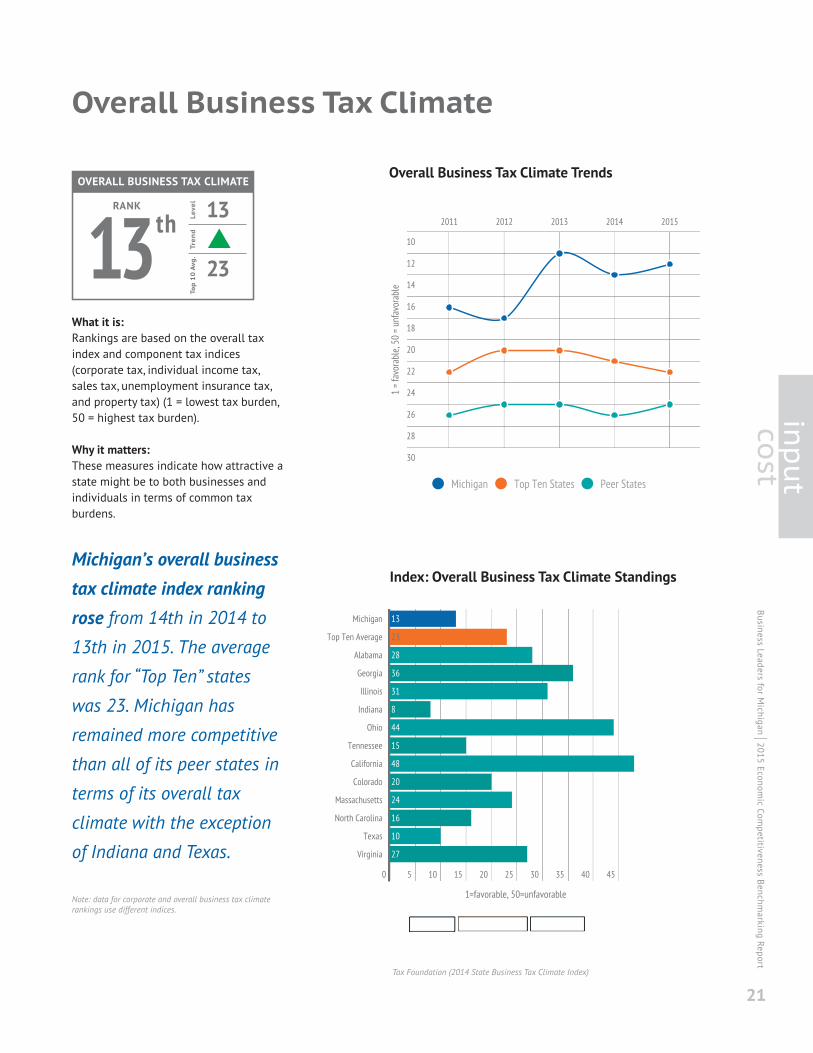
What it is:Rankings are based on the overall taxindex and component tax indices(corporate tax, individual income tax,sales tax, unemployment insurance tax,and property tax) (1 = lowest tax burden,50 = highest tax burden).
Why it matters:These measures indicate how attractive astate might be to both businesses andindividuals in terms of common taxburdens.
Michigan’s overall businesstax climate index rankingrose from 14th in 2014 to13th in 2015. The average
rank for “Top Ten” states
was 23. Michigan has
remained more competitive
than all of its peer states in
terms of its overall tax
climate with the exception
of Indiana and Texas.
Note: data for corporate and overall business tax climaterankings use different indices.
Index: Overall Business Tax Climate Standings
Overall Business Tax Climate
Tax Foundation (2014 State Business Tax Climate Index)
21
input
cost
OVERALL BUSINESS TAX CLIMATE
RANKLe
vel
1313
23
thTr
end
Top
10
Avg
.
Overall Business Tax Climate Trends
Business Leaders for Michigan I 2015 Econom
ic Competitiveness Benchm
arking Report
Business Leaders for Michigan I20
15 Economic Com
petitiveness Benchmarking Report
22
Days Required to Pay Taxes
Days Required to Pay Taxes Trends
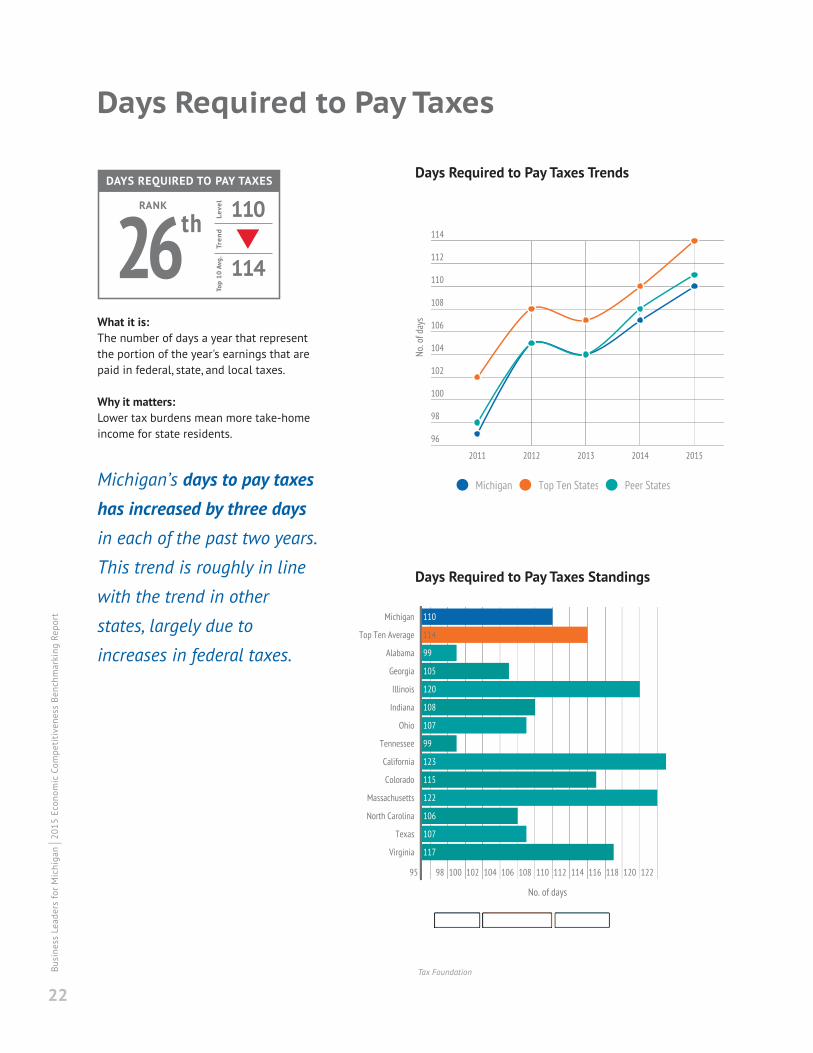
What it is:The number of days a year that representthe portion of the year's earnings that arepaid in federal, state, and local taxes.
Why it matters:Lower tax burdens mean more take-homeincome for state residents.
Michigan’s days to pay taxeshas increased by three daysin each of the past two years.
This trend is roughly in line
with the trend in other
states, largely due to
increases in federal taxes.
Days Required to Pay Taxes Standings
Tax Foundation
DAYS REQUIRED TO PAY TAXES
RANKLe
vel 110
114
Tren
dTo
p 10
Avg
.26th
Labor
Labor Trends
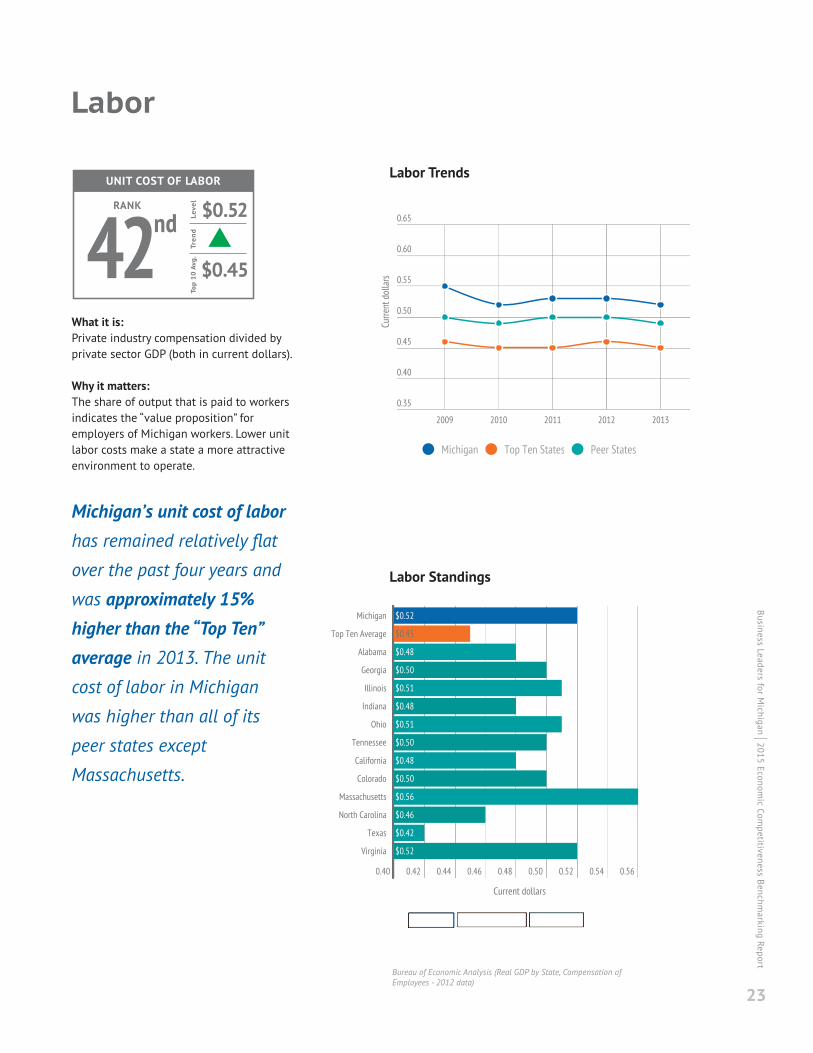
What it is:Private industry compensation divided byprivate sector GDP (both in current dollars).
Why it matters:The share of output that is paid to workersindicates the “value proposition” foremployers of Michigan workers. Lower unitlabor costs make a state a more attractiveenvironment to operate.
Michigan’s unit cost of laborhas remained relatively flat
over the past four years and
was approximately 15%higher than the “Top Ten”average in 2013. The unitcost of labor in Michigan
was higher than all of its
peer states except
Massachusetts.
Labor Standings
Bureau of Economic Analysis (Real GDP by State, Compensation ofEmployees - 2012 data)
UNIT COST OF LABOR
RANKLe
vel
42$0.52
$0.45
ndTr
end
Top
10
Avg
.
23
Business Leaders for Michigan I 2015 Econom
ic Competitiveness Benchm
arking Report

What it is:Real Private Industry GDP divided byaverage annual non-farm employment.
Why it matters:This is a measure of the amount ofproduction per worker, which is animportant way to increase income andeconomic activity.
Value added per workerin Michigan was 15% lowerthan the “Top Ten” averagein 2014 and ranked below
all but four of its peer
states. However, the growthin worker productivity inMichigan from 2013 to
2014 exceeded that of overhalf of its peer states.
Value Added Per Worker Standings
Value Added Per Worker
Bureau of Economic Analysis (Real GDP by State), Bureau of Labor Statistics(State and Metro Area Employment, Hours, and Earnings)
VALUE ADDED PER WORKER
RANKLe
vel
24$89,130
$105,000
thTr
end
Top
10 A
vg.
Value Added Per Worker Trends
Business Leaders for Michigan I20
15 Economic Com
petitiveness Benchmarking Report
24

25
input
cost
Business Leaders for Michigan I 2015 Econom
ic Competitiveness Benchm
arking Report
Union Representation
Union Representation Trends
What it is:Employees represented by a union (as apercent of those employed) (1 = best, 50 =worst).
Why it matters:An indicator of labor market bargainingpower, labor flexibility, and pro-businesssentiments in the state. For someemployers, lower union membership makesa state a more attractive place to operate.
Michigan had the 11th-highest share of workers thatare represented by a unionin 2014. Michigan’s
unionization rate was two
percentage points higher
than the “Top Ten” average.
Michigan’s union
membership and
representation rate remained
higher than all peer states
except California and Illinois.
Union Representation Standings
Bureau of Labor Statistics (Current Population Survey)
UNION REPRESENTATION
RANKLe
vel
3915.7%
13.9%
thTr
end
Top
10 A
vg.

Business Leaders for Michigan I20
15 Economic Com
petitiveness Benchmarking Report
26
What it is:Price per kilowatt-hour (kwh) ofelectricity for commercial users (1 = best,50 = worst).
Why it matters:Maintaining competitive energy costscontributes to a state’s attractiveness tobusinesses.
Michigan’s electricity costsfor commercial customerswere even with the “TopTen” average in 2014. Thisrepresented a decline of0.2¢ relative to 2013 forMichigan. Electricity costsfor commercial customers inMichigan are higher thanthose in all peer statesexcept Massachusetts andCalifornia but only 2%above the national average.
Note: 2015 rates are based on monthly reported datathrough August.
Electricity Costs - Commercial Standings
Electricity Costs - Commercial
Energy Information Administration
ELECTRICITY COSTS: COMMERCIAL
RANKLe
vel
3310.3¢
11.0¢
rdTr
end
Top
10 A
vg.
Electricity Costs - Commercial Trends
27
input
cost
Business Leaders for Michigan I 2015 Econom
ic Competitiveness Benchm
arking Report
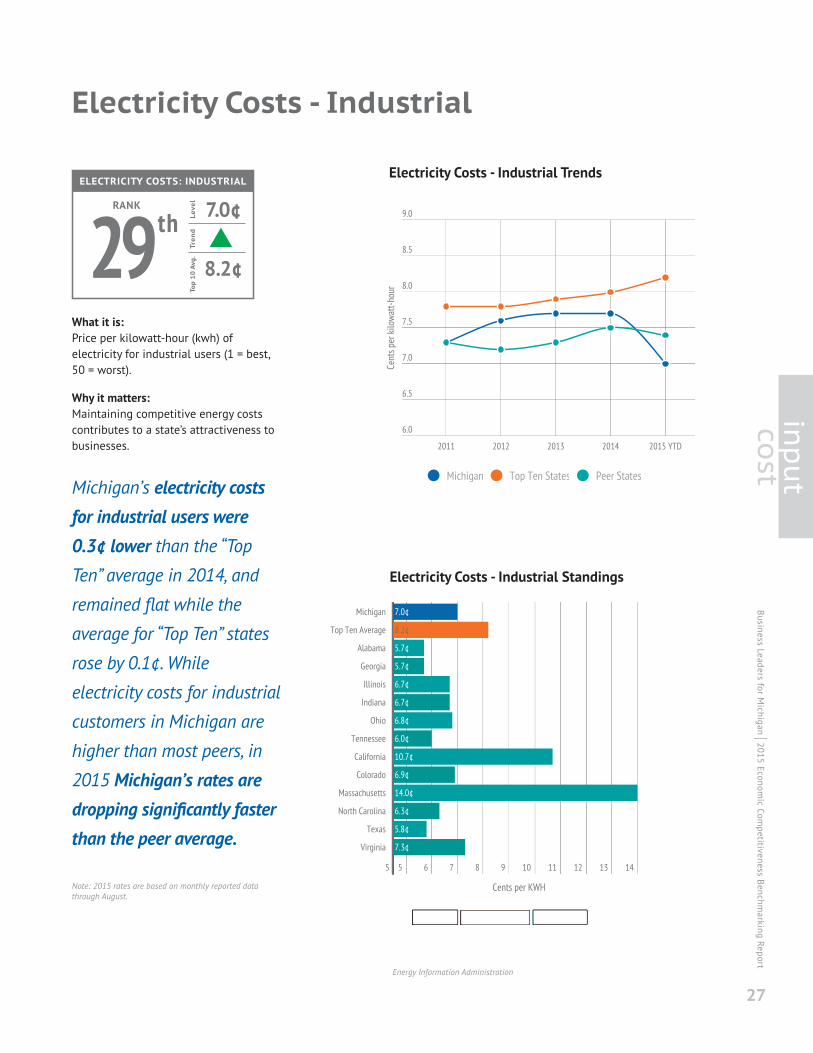
What it is:Price per kilowatt-hour (kwh) ofelectricity for industrial users (1 = best,50 = worst).
Why it matters:Maintaining competitive energy costscontributes to a state’s attractiveness tobusinesses.
Michigan’s electricity costsfor industrial users were0.3¢ lower than the “TopTen” average in 2014, and
remained flat while the
average for “Top Ten” states
rose by 0.1¢. While
electricity costs for industrial
customers in Michigan are
higher than most peers, in
2015 Michigan’s rates aredropping significantly fasterthan the peer average.
Note: 2015 rates are based on monthly reported datathrough August.
Electricity Costs - Industrial Standings
Electricity Costs - Industrial
Energy Information Administration
ELECTRICITY COSTS: INDUSTRIAL
RANKLe
vel
297.0¢
8.2¢
thTr
end
Top
10 A
vg.
Electricity Costs - Industrial Trends

Business Leaders for Michigan I20
15 Economic Com
petitiveness Benchmarking Report
28
What it is:A weighted average of the price perthousand cubic feet of natural gas forIndustrial and Commercial users,weighted by the proportion ofconsumption from each sector.
Why it matters:Maintaining competitive energy costscontributes to a state’s attractiveness tobusinesses.
Michigan’s natural gasprices have been fallingevery year since 2008, but
are still higher than theaverage of the “Top Ten”
states and all of its peer
states, except for
Massachusetts and North
Carolina.
.
Natural Gas Costs Standings
Natural Gas Costs
U.S. Energy Information Administration
NATURAL GAS COSTS
RANKLe
vel
257.52¢
7.17¢
thTr
end
Top
10 A
vg.
Natural Gas Costs Trends
29
input
cost
Business Leaders for Michigan I 2015 Econom
ic Competitiveness Benchm
arking Report
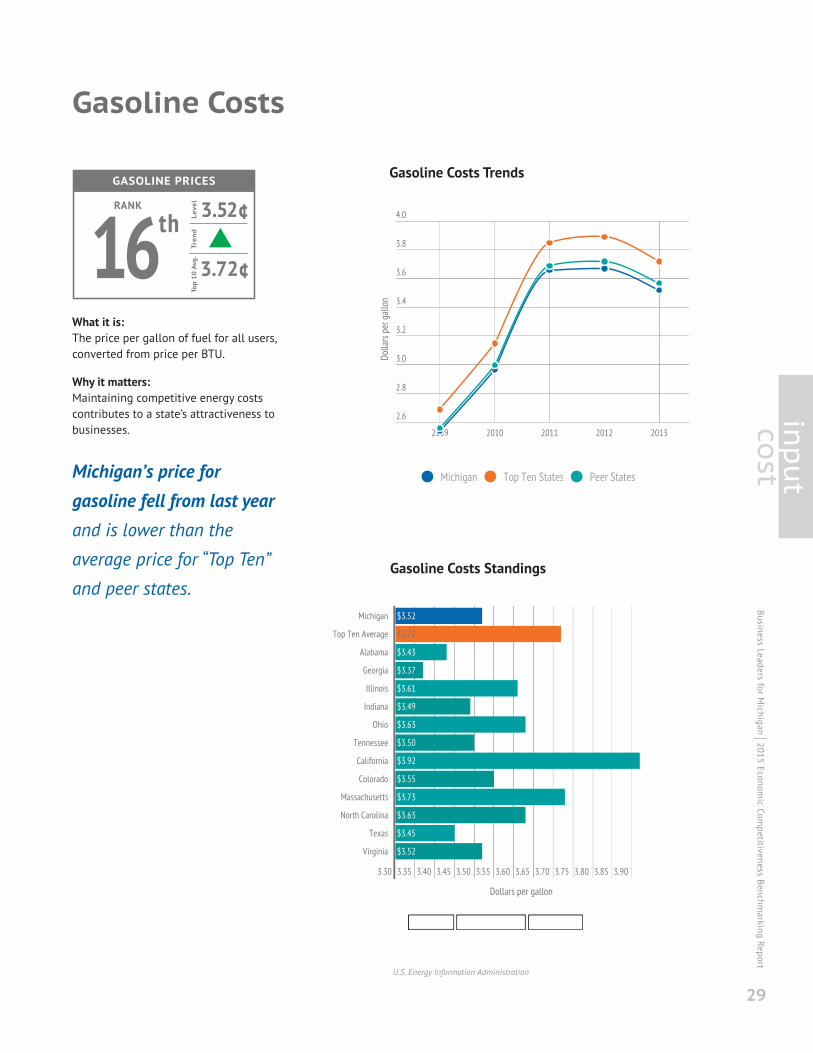
What it is:The price per gallon of fuel for all users,converted from price per BTU.
Why it matters:Maintaining competitive energy costscontributes to a state’s attractiveness tobusinesses.
Michigan’s price forgasoline fell from last yearand is lower than the
average price for “Top Ten”
and peer states.Gasoline Costs Standings
Gasoline Costs
U.S. Energy Information Administration
GASOLINE PRICES
RANKLe
vel
163.52¢
3.72¢
thTr
end
Top
10 A
vg.
Gasoline Costs Trends

Business Leaders for Michigan I20
15 Economic Com
petitiveness Benchmarking Report
30
State Unfunded Pension Liabilities
Unfunded Pension Liability Trends
What it is:State government unfunded pension andother postemployment benefit liability(UAAL) divided by population.
Why it matters:This measure indicates the burden ofunfunded retiree benefits on taxpayers.Payments for high unfunded liabilities maycrowd out spending for competing needs,such as infrastructure and education.
Michigan’s unfunded pensionliability per capita was lessthan the “Top Ten” average
in 2013.
Unfunded Pension Liability Standings
Census of Governments, Pew Center on the States
STATE UNFUNDED PENSION LIABILITIES
RANKLevel
$3,311
$3,372
Trend
Top
10 A
vg.28th

31
input
cost
Business Leaders for Michigan I 2015 Econom
ic Competitiveness Benchm
arking Report
OPEB Liability Trends
What it is:State government unfunded otherpostemployment benefit liability (OPEB)divided by population.
Why it matters:This measure indicates the burden ofunfunded retiree benefits on taxpayers.Payments for high unfunded liabilitiesmay crowd out spending for competingneeds, such as infrastructure andeducation.
Michigan’s OPEB unfunded
liability per capita was less
than the “Top Ten” average
in 2012, but over $700 perperson higher than theaverage of peer states.
Note: “Top Ten” average for OPEB excludes Nebraska due todata availability. Cannot make inter-year comparisons forOPEB due to use of a different data source for 2012.
OPEB Liability Standings
State Unfunded Non-Pension (OPEB) Liabilities
Census of Governments, Pew Center on the States
STATE UNFUNDED OPEB LIABILITIES
RANKLevel
41$2,384
$2,473
stTrend
Top
10 A
vg.

Business Leaders for Michigan I20
15 Economic Com
petitiveness Benchmarking Report
32
Local Debt Service
Local Debt Service Trends
What it is:Local government interest payments ondebt, divided by local government directexpenditures (both in current dollars).
Why it matters:Maintaining debt service at low levels is anindicator of fiscal sustainability.
Local government interest ondebt in Michigan exceededthe “Top Ten” average andranked in the bottom half ofthe nation. However, it wasrelatively constant from 2009
to 2012. Michigan is on par
with its peer average, and
only Illinois, Colorado, North
Carolina, and Texas had
higher local government
interest spending than
Michigan.
Note: This measure does not include debt service on principalsince the Census of Governments does not report a direct debtservice measure.
Local Debt Service Standings
Census of Governments (Annual Survey of State and Local Government Finances)
LOCAL DEBT SERVICE
RANKLe
vel
324.4%
3.9%
ndTr
end
Top
10 A
vg.

33
input
cost
Business Leaders for Michigan I 2015 Econom
ic Competitiveness Benchm
arking Report
Total State & Local Spending
Total State & Local Spending Trends
What it is:Total state and local governmentexpenditures (2014 dollars) divided bypopulation (1 = best, 50 = worst).
Why it matters:State and local government expendituresare used for important investments ineducation, infrastructure, and public safety.On the other hand, high expenditures cancrowd out private sector economic activityby redirecting tax revenue and stateworkers away from private use.
Michigan’s state and localspending was 28% lowerthan the “Top Ten” averagein 2012. Michigan was also4% below average among itspeer states. The growth inper capita governmentspending in Michigan was4th lowest in the nation overthe preceding decade andsecond behind only Georgiaamong its peer states.
Total State & Local Spending Standings
Census of Governments (Annual Survey of State and Local Government Finances)
TOTAL STATE & LOCAL SPENDING
RANKLe
vel
$9.30
$12.93
Tren
dTo
p 10
Avg
.19th
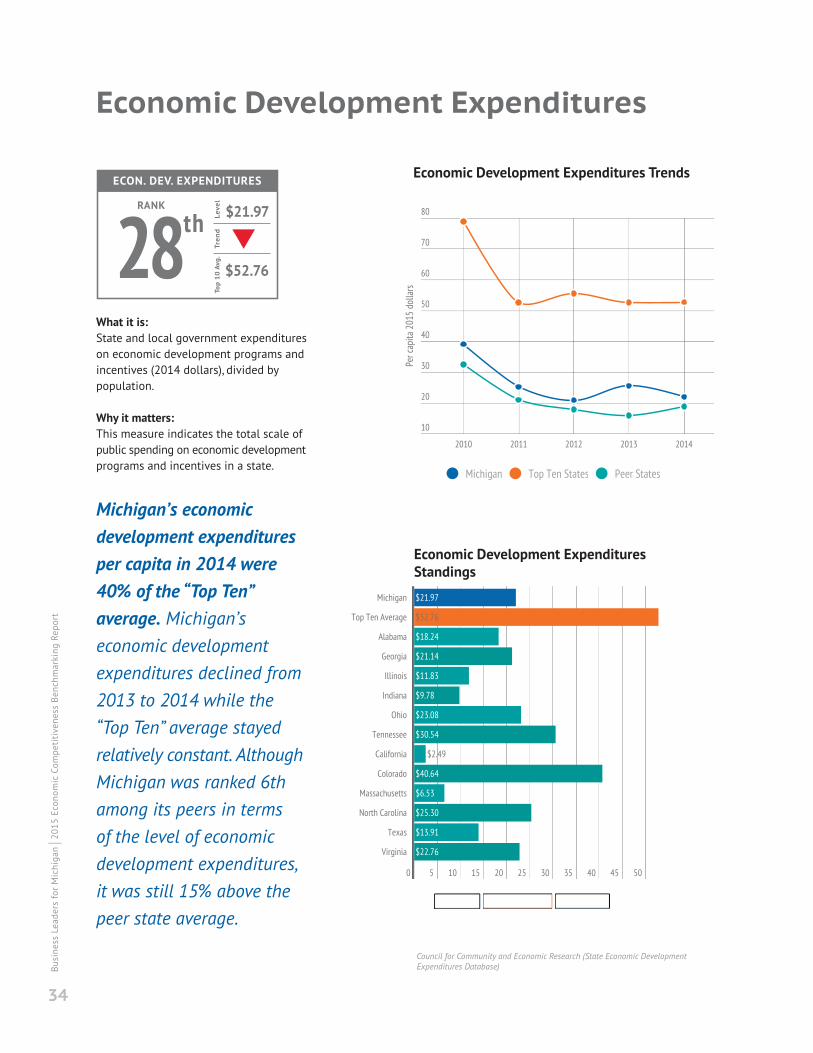
What it is:State and local government expenditureson economic development programs andincentives (2014 dollars), divided bypopulation.
Why it matters:This measure indicates the total scale ofpublic spending on economic developmentprograms and incentives in a state.
Michigan’s economicdevelopment expendituresper capita in 2014 were40% of the “Top Ten”average. Michigan’seconomic developmentexpenditures declined from2013 to 2014 while the“Top Ten” average stayedrelatively constant. AlthoughMichigan was ranked 6thamong its peers in termsof the level of economicdevelopment expenditures,it was still 15% above thepeer state average.
Economic Development ExpendituresStandings
Economic Development Expenditures
Council for Community and Economic Research (State Economic DevelopmentExpenditures Database)Bu
siness Leaders for Michigan I20
15 Economic Com
petitiveness Benchmarking Report
34
ECON. DEV. EXPENDITURES
RANKLe
vel
28$21.97
$52.76
thTr
end
Top
10
Avg
.
Economic Development Expenditures Trends

35
input
cost
Business Leaders for Michigan I 2015 Econom
ic Competitiveness Benchm
arking Report
What it is:Average of three major business climateindices that account for several factorssuch as business costs, business leaders’perceptions, regulatory climate, quality oflife, etc. (1 = best, 50 = worst).
Why it matters:This measure is an indicator for howattractive a state might be for businesses.
Michigan’s average rankingacross three major businessclimate indices improved bythree spots from 2013 to
2014, but still remained inthe bottom 15 states.Michigan’s average ranking
was below all peer states
except Illinois and
California.
Index: Business Climate Ranking Standings
Business Climate Rankings
CEO Magazine (Best and Worst States for Business), CNBC (Top States for Business), Forbes (Best States for Business)
BUSINESS CLIMATE RANKINGS
RANKLe
vel
3837.7
21.5
thTr
end
Top
10
Avg
.
Business Climate Rankings Trends

4th Grade Reading
Business Leaders for Michigan I20
15 Economic Com
petitiveness Benchmarking Report
36
4th Grade Reading Trends
What it is:Average score for reading proficiencyamong 4th graders, relative to the basescore (41.6% = basic, 47.6% = proficient).
Why it matters:This provides an indicator of how wellschools are meeting competitive academicstandards.
Michigan 4th graders areperforming below both the“Top Ten” average and thepeer state average in readingby about one percentagepoint. Both the Michiganaverage and the “Top Ten”average exceeded the “basic”level, but fall short of the“proficient” level. Michiganscores have declined since2007 and were among thebottom half among all states.Michigan’s 4th grade readingscores were outranked by allpeer states except Californiaand Texas.
4th Grade Reading Standings
National Center for Education Statistics (National Assessment of Educational Progress)
4TH GRADE READING
RANKLe
vel
3843.4%
44.6%
thTr
end
Top
10
Avg
.

What it is:Average score for mathematicsproficiency among 8th graders, relative tothe base score (52.4% = basic, 59.8% =proficient).
Why it matters:This provides an indicator of how wellschools are meeting competitiveacademic standards.
Michigan 8th gradersperformed below the “TopTen” average in mathematicsby 1.6 percentage points,and below the peer stateaverage by 0.9 percentagepoints. Both the Michiganaverage and the “Top Ten”average exceeded the “basic”level, but fall short of the“proficient” level. Michiganscores have improved overthe past decade, but werestill in the bottom half of thenation and were outrankedby over half of peer states.
8th Grade Math Standings
8th Grade Math
National Center for Education Statistics (National Assessment of Educational Progress)
37
input
value
8TH GRADE MATH
RANKLe
vel
3756.0%
57.6%
thTr
end
Top
10
Avg
.
8th Grade Math Trends
Business Leaders for Michigan I 2015 Econom
ic Competitiveness Benchm
arking Report
Career & Technical Education Enrollment
Business Leaders for Michigan I20
15 Economic Com
petitiveness Benchmarking Report
38
Career & Technical Education Enrollment Trends
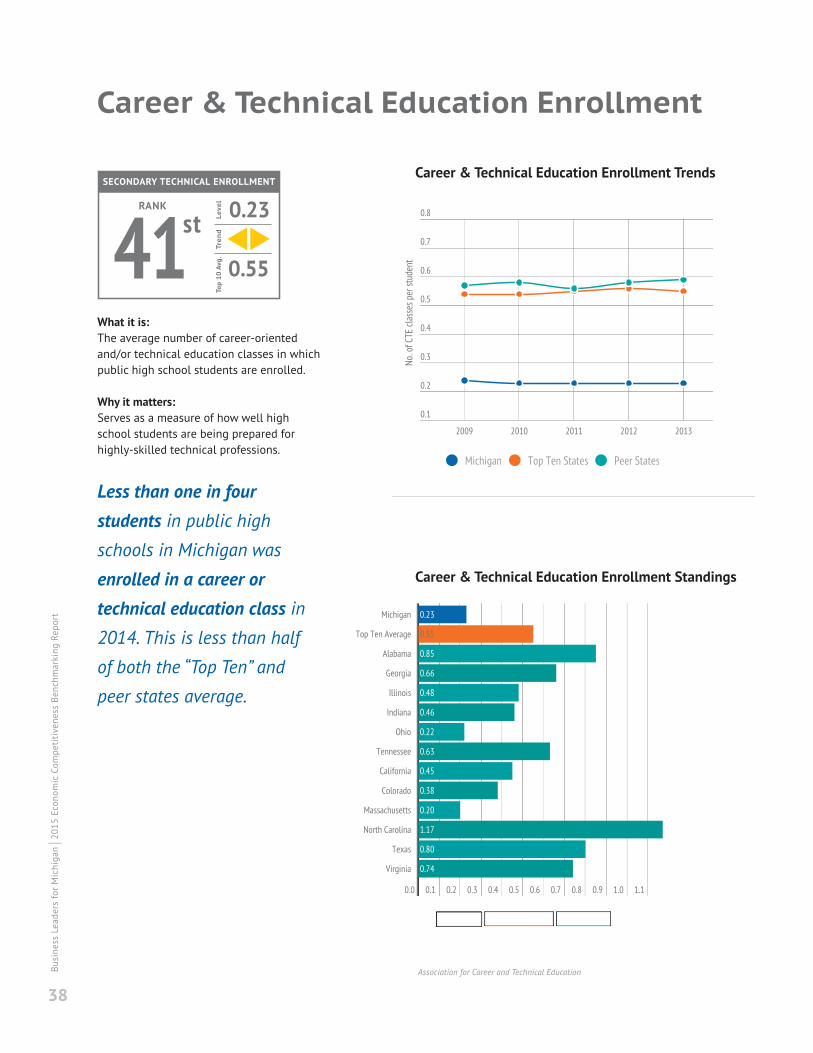
What it is:The average number of career-orientedand/or technical education classes in whichpublic high school students are enrolled.
Why it matters:Serves as a measure of how well highschool students are being prepared forhighly-skilled technical professions.
Less than one in fourstudents in public highschools in Michigan was
enrolled in a career ortechnical education class in2014. This is less than half
of both the “Top Ten” and
peer states average.
Career & Technical Education Enrollment Standings
Association for Career and Technical Education
SECONDARY TECHNICAL ENROLLMENT
RANKLe
vel
410.23
0.55
stTr
end
Top
10 A
vg.

39
input
value
Business Leaders for Michigan I 2015 Econom
ic Competitiveness Benchm
arking Report
What it is:Percent of students tested that met orexceeded the ACT College ReadinessBenchmarks in all four subjects (English,reading, mathematics, science).
Why it matters:This is an indicator of how well-preparedhigh school graduates are for enteringcollege and future careers.
The percentage of college-and career-ready graduatesin Michigan improved by onepercentage point from 2013to 2014, but is about 11percentage points lower thanthe “Top Ten” average.Michigan was among thebottom half of states in termsof college-ready graduatesand was outranked by allbut three of its peer states:Alabama, Tennessee, andNorth Carolina.
Career & College Readiness Standings
Career & College Readiness
ACT College and Career Readiness Benchmarks
CAREER & COLLEGE READINESS
RANKLe
vel
3522.0%
32.6%
thTr
end
Top
10
Avg
.
Career & College Readiness Trends

Business Leaders for Michigan I20
15 Economic Com
petitiveness Benchmarking Report
40
Out-of-State Enrollment
Out-of-State Enrollment Trends
What it is:Percent of entering first-yearundergraduates from out of state.
Why it matters:This indicates how well higher educationinstitutions are attracting students fromout of state to provide an infusion of talentand capital. This should be compared within-state enrollment to ensure that statesare maintaining in-state enrollment.
The rate of out-of-stateenrollment at highereducation institutions inMichigan was less than half ofthe “Top Ten” average in 2012and trailed all but four states inthe nation. However, Michigan’sout-of-state enrollment rategrew by 1.2 percentage-pointsfrom 2010 to 2012 comparedto the “Top Ten” average.Among peer states, onlyinstitutions in California andTexas have lower out-of-stateenrollment rates thanMichigan.
Out-of-State Enrollment Standings
National Center for Education Statistics Integrated Postsecondary EducationData System, U.S. Census Bureau Population Estimates (2012 data)
OUT-OF-STATE ENROLLMENT
RANKLe
vel
4611.7%
28.1%
thTr
end
Top
10 A
vg.

41
input
value
Business Leaders for Michigan I 2015 Econom
ic Competitiveness Benchm
arking Report
What it is:Total associate, bachelor’s, master’s, anddoctorate degrees conferred per 10,000residents by public and private institutions.
Why it matters:Number of students earning a degreeeach year. Educational attainment is afactor in accessing the quality of a state’stalent pool.
The number of degreesconferred by highereducation institutions in
Michigan has been
increasing, but remainedbelow the “Top Ten” averageby about 10% in 2014.
Michigan was near the
middle of its peers but above
average in terms of the
number of degrees conferred
per 10,000 of population.
Note: Degrees include associate, bachelor’s, andgraduate/professional degrees. Higher education institutionsinclude all public and private degree-granting institutions.
Degrees Conferred Standings
Degrees ConferredAssociate’s+ Per 10,000
National Center for Education Statistics (Integrated PostsecondaryEducation Data System), U.S. Census Bureau (Population Estimates)
DEGREES CONFERRED
RANKLe
vel
23201
224
rdTr
end
Top
10 A
vg.
Degrees Conferred Trends

Business Leaders for Michigan I20
15 Economic Com
petitiveness Benchmarking Report
42
Technical EducationCritical Skills Degrees & Certificates
Technical Education Trends
What it is:Total critical skills degrees and certificatesconferred divided by the working agepopulation (ages 20 through 64, inclusive).
Why it matters:These degrees especially prepare studentsfor high-skilled occupations, particularly inthe STEM fields, which are the types ofjobs Michigan expects to increase in thefuture.
The number of critical skillsdegrees and certificatesawarded in Michigan percapita has increased by over50% since 2005. However,the level of degrees awardedis still 12% lower than the“Top Ten” average in 2014.Michigan also came in 6thamong its peers in terms ofthe level of critical skillsdegrees and certificatesawarded.
Note: Higher education institutions include all public andprivate degree-granting institutions.
Technical Education Standings
National Center for Education Statistics (Integrated PostsecondaryEducation Data System), U.S. Census Bureau (Population Estimates)
CRITICAL SKILLS DEG. & CERT.
RANKLevel
2795.8
109.4
thTrend
Top
10 A
vg.

43
input
value
Business Leaders for Michigan I 2015 Econom
ic Competitiveness Benchm
arking Report
What it is:Share of residents aged 25 to 64 with anassociate degree or higher.
Why it matters:The availability of highly educated talentcan promote future growth of theeconomy, particularly in highly skilledprofessions.
The level of highly educatedtalent available in Michiganhas increased by about 14
percentage points in the
last decade, but was fourpercentage points lowerthan the “Top Ten” averagein 2013. Michigan was
among the bottom half
of states in terms of
educational attainment
and was outranked by
half of its peer states.
Educational Attainment Standings
Educational Attainment Population age 25-64 with Associates+
U.S. Census Bureau (American Community Survey)
EDUCATIONAL ATTAINMENT
RANKLe
vel
3138.4%
42.4%
stTr
end
Top
10
Avg
.
Educational Attainment Trends

Business Leaders for Michigan I20
15 Economic Com
petitiveness Benchmarking Report
44
Talent Migration Educated Adults with BA+
Talent Migration Trends
What it is:Immigrants with a bachelor’s degree orhigher minus emigrants with a bachelor’sdegree or higher.
Why it matters:This measure indicates how well a stateattracts and retains highly educatedindividuals to live in the state.
2013 marked the secondconsecutive year in whichMichigan had a net positivemigration of talentedindividuals after five prioryears of net losses. However,
the net migration of educated
residents in Michigan was
lower than the “Top Ten”
average. Michigan gained
highly educated residents at
a slower pace in 2013 than
it had the year before, and
ranked third from the bottom
among peer states.
Talent Migration Standings
U.S. Census Bureau (American Community Survey)
TALENT MIGRATION
RANKLe
vel
2,838
10,562
Tren
dTo
p 10
Avg
.28th

45
input
value
Business Leaders for Michigan I 2015 Econom
ic Competitiveness Benchm
arking Report
Median Age
Median Age Trends
What it is:Median age of state residents.
Why it matters:Increase in the median age is an indicatorof an aging population, where thepopulation growth rate of middle age andsenior citizens outpaces that for childrenand young adults. States with a highmedian age among residents may be goodat attracting retirees, but it also can be asign that younger people are seeking outother places to work and raise a family.
Michigan was among the top10 oldest states in 2013,with the ninth-highestmedian age. Michigan’smedian age increasedslightly from 2012 to 2013,rising by 0.1 years. Thiscontinues a trend that hasseen the Michigan medianage increase by 2.7 yearssince 2005. Michigan’smedian age was higher thanall of its peers and all of the“Top Ten” states except forPennsylvania.
Median Age Standings
U.S. Census Bureau (Population Estimates)
MEDIAN AGE
RANKLe
vel
4139.6
36.9
stTr
end
Top
10 A
vg.
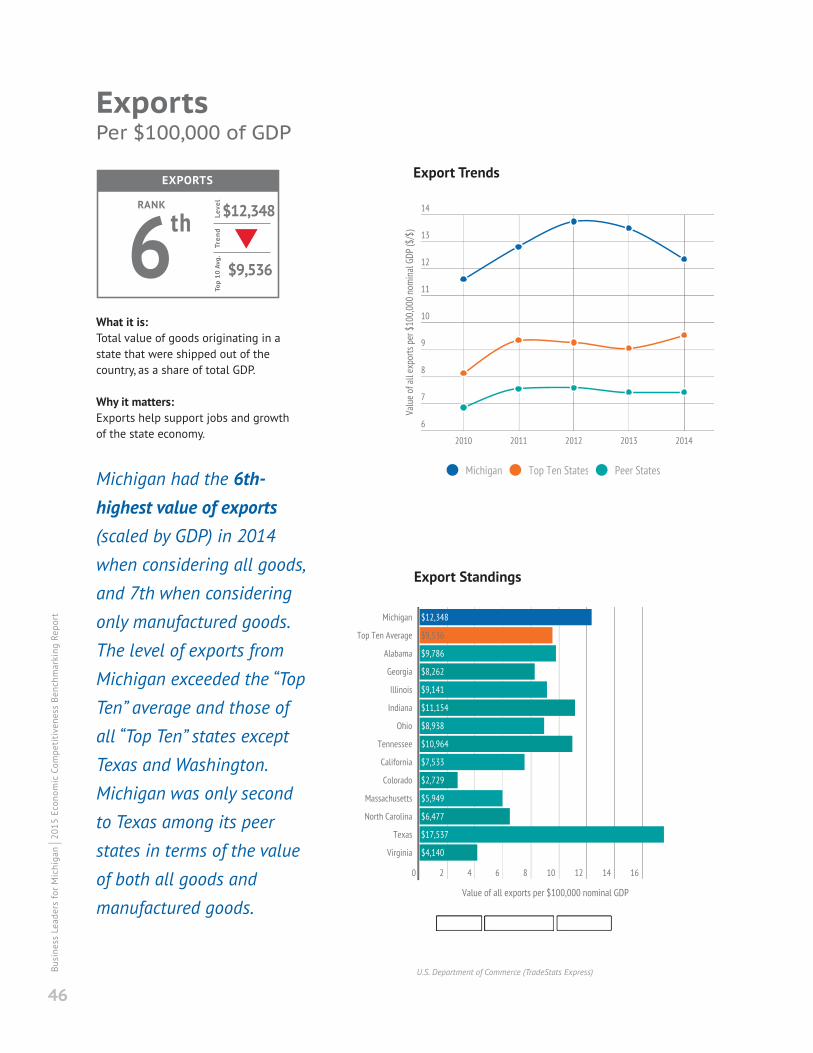
What it is:Total value of goods originating in astate that were shipped out of thecountry, as a share of total GDP.
Why it matters:Exports help support jobs and growthof the state economy.
Michigan had the 6th-highest value of exports(scaled by GDP) in 2014when considering all goods,and 7th when consideringonly manufactured goods.The level of exports fromMichigan exceeded the “TopTen” average and those ofall “Top Ten” states exceptTexas and Washington.Michigan was only secondto Texas among its peerstates in terms of the valueof both all goods andmanufactured goods.
Export Standings
ExportsPer $100,000 of GDP
U.S. Department of Commerce (TradeStats Express)Business Leaders for Michigan I20
15 Economic Com
petitiveness Benchmarking Report
46
EXPORTS
RANKLevel
6$12,348
$9,536
thTrend
Top
10 A
vg.
Export Trends

47
input
value
Business Leaders for Michigan I 2015 Econom
ic Competitiveness Benchm
arking Report
University R&D ExpendituresPer $1M of GDP
University R&D Expenditure Trends
What it is:Research and development expendituresby higher education institutions, as ashare of total GDP.
Why it matters:Research and development expenditures byuniversities improve the state’s attractivenessto out-of-state students and talent, andprovide an important source of innovationand entrepreneurship in the state.
Research and developmentexpenditures at universitiesin Michigan were 6th in thenation in 2013 and werehigher than all of the “Top Ten”states except Massachusetts.Michigan universities’
research and development
expenditures were greater
than those of all of its peers
except Massachusetts and
North Carolina.
University R&D Expenditure Standings
National Science Foundation Higher Education R&D Expenditures by State,Bureau of Economic Analysis Real GDP by State
UNIVERSITY R&D EXPEND
RANKLe
vel
6 $5,879
$4,740
thTr
end
Top
10
Avg
.

What it is:Number of U.S. patents awarded per100,000 residents.
Why it matters:Patents provide an incentive forinnovators and entrepreneurs to improvetechnology. The states whose residentsare the source of this innovation have anadvantage in reaping the economicbenefits derived from them.
Michigan ranked 12th inthe nation in terms ofpatents per capita andexceeded the “Top Ten”
average. Michigan inventors
were more prolific than
those for all of its peers
except Massachusetts,
Colorado, and California on
a per capita basis.
U.S. Patent Standings
U.S. PatentsPer 100,000 Residents
U.S. Patent and Trademark Office (Patents By Country, State, and Year -Utility Patents), U.S. Census Bureau (Population Estimates)
Business Leaders for Michigan I20
15 Economic Com
petitiveness Benchmarking Report
48
US PATENTS
RANKLe
vel
1253.5
39.8
thTr
end
Top
10 A
vg.
U.S. Patent Trends
49
input
value
Business Leaders for Michigan I 2015 Econom
ic Competitiveness Benchm
arking Report
Venture Capital InvestmentPer $100,000 of GDP
Venture Capital Investment Trends
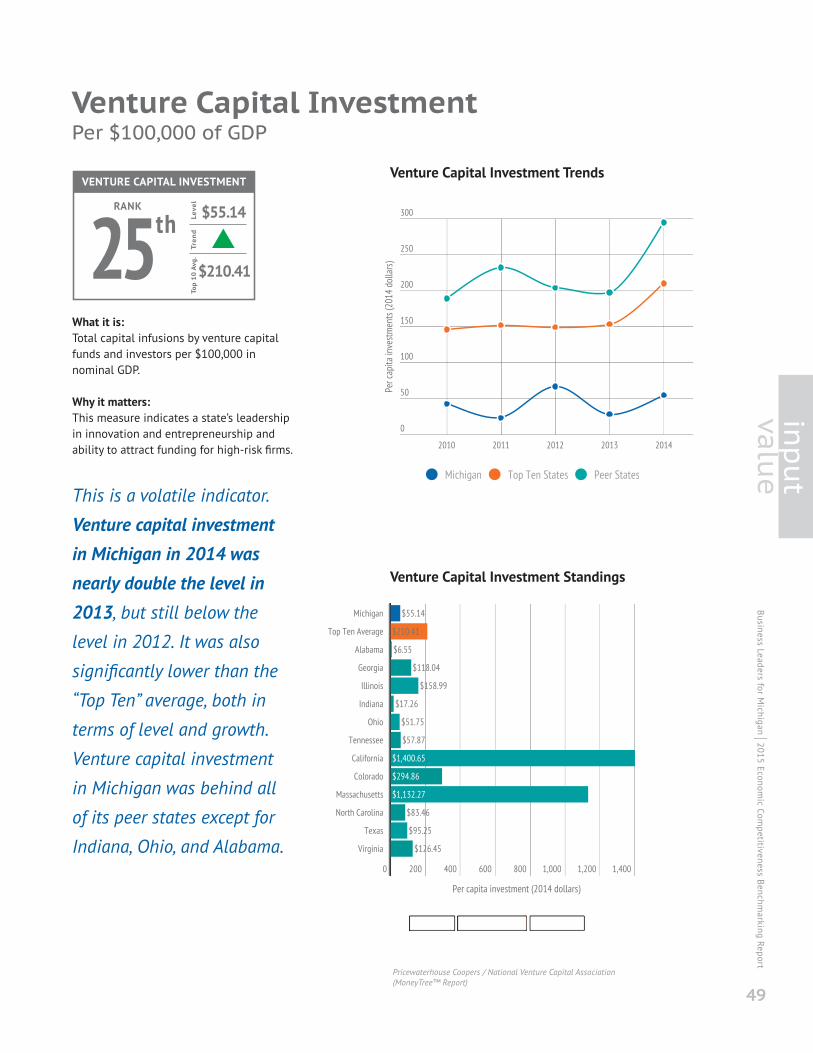
What it is:Total capital infusions by venture capitalfunds and investors per $100,000 innominal GDP.
Why it matters:This measure indicates a state’s leadershipin innovation and entrepreneurship andability to attract funding for high-risk firms.
This is a volatile indicator.
Venture capital investmentin Michigan in 2014 wasnearly double the level in2013, but still below thelevel in 2012. It was also
significantly lower than the
“Top Ten” average, both in
terms of level and growth.
Venture capital investment
in Michigan was behind all
of its peer states except for
Indiana, Ohio, and Alabama.
Venture Capital Investment Standings
Pricewaterhouse Coopers / National Venture Capital Association(MoneyTree™ Report)
VENTURE CAPITAL INVESTMENT
RANKLe
vel
25 $55.14
$210.41
thTr
end
Top
10 A
vg.
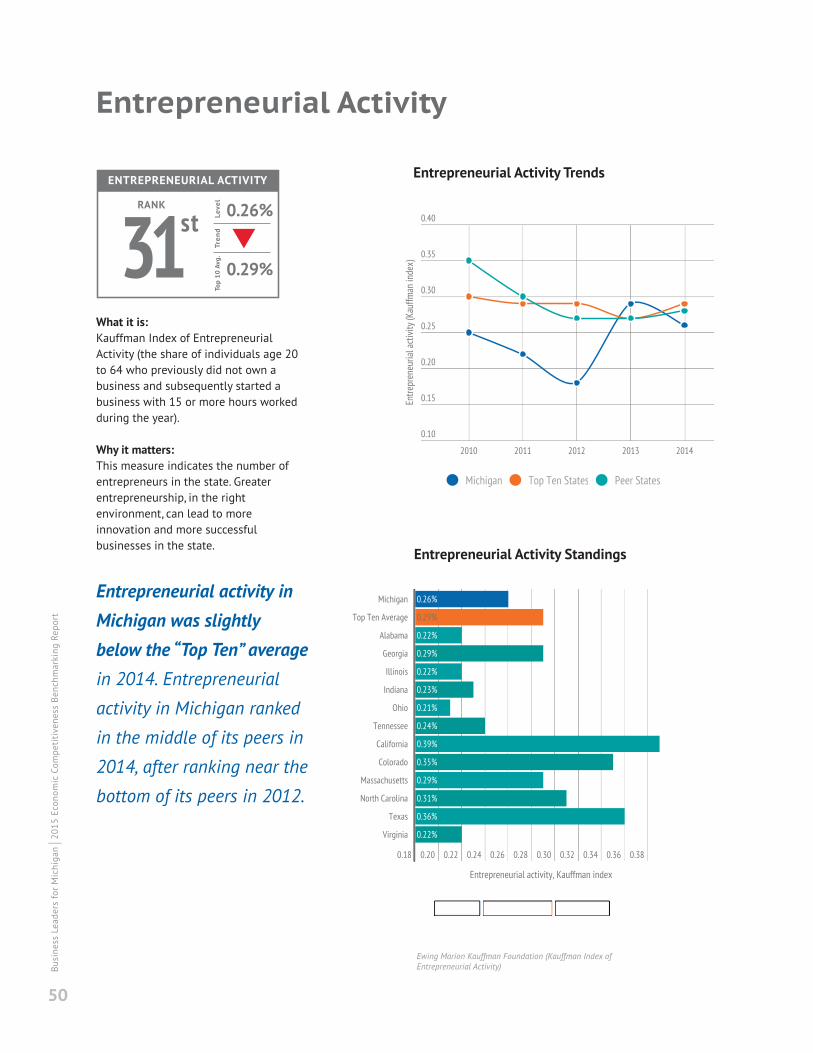
What it is:Kauffman Index of EntrepreneurialActivity (the share of individuals age 20to 64 who previously did not own abusiness and subsequently started abusiness with 15 or more hours workedduring the year).
Why it matters:This measure indicates the number ofentrepreneurs in the state. Greaterentrepreneurship, in the rightenvironment, can lead to moreinnovation and more successfulbusinesses in the state.
Entrepreneurial activity inMichigan was slightlybelow the “Top Ten” averagein 2014. Entrepreneurial
activity in Michigan ranked
in the middle of its peers in
2014, after ranking near the
bottom of its peers in 2012.
Entrepreneurial Activity Standings
Entrepreneurial Activity
Ewing Marion Kauffman Foundation (Kauffman Index ofEntrepreneurial Activity)Bu
siness Leaders for Michigan I20
15 Economic Com
petitiveness Benchmarking Report
50
ENTREPRENEURIAL ACTIVITY
RANKLe
vel
0.26%
0.29%
Tren
dTo
p 10
Avg
.31st
Entrepreneurial Activity Trends
51
input
value
Business Leaders for Michigan I 2015 Econom
ic Competitiveness Benchm
arking Report
Net New Establishments
Net New Establishments Trends
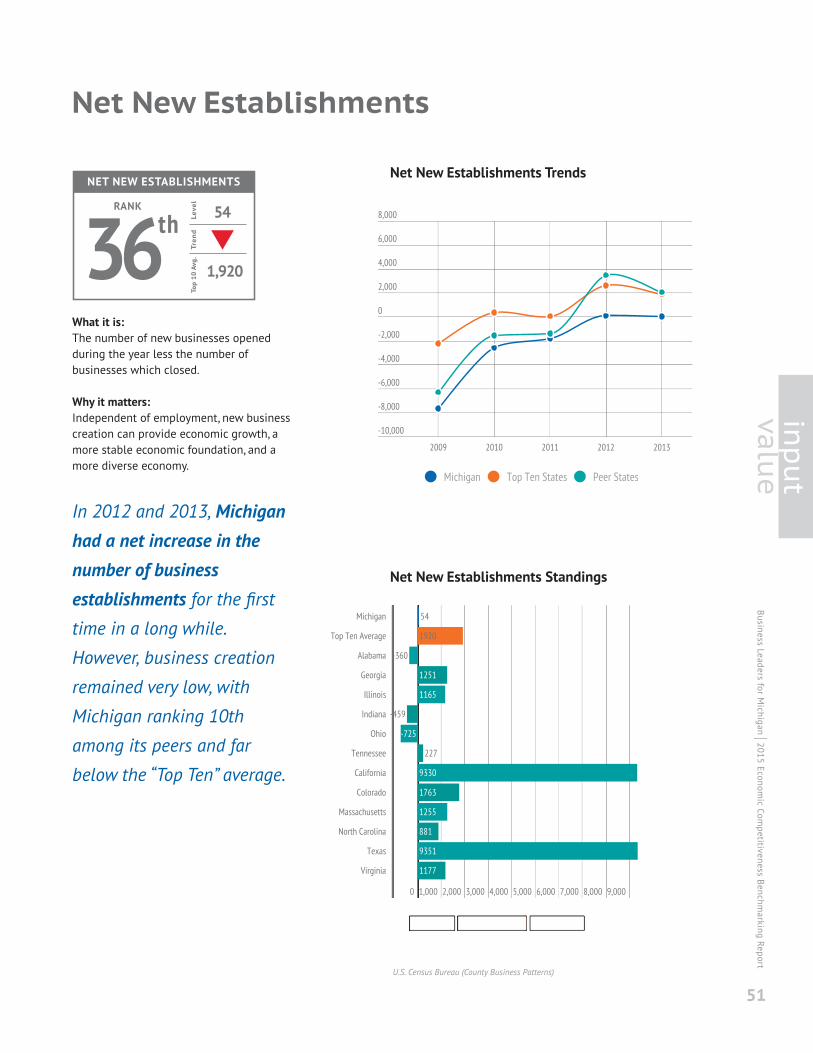
What it is:The number of new businesses openedduring the year less the number ofbusinesses which closed.
Why it matters:Independent of employment, new businesscreation can provide economic growth, amore stable economic foundation, and amore diverse economy.
In 2012 and 2013, Michiganhad a net increase in thenumber of businessestablishments for the firsttime in a long while.
However, business creation
remained very low, with
Michigan ranking 10th
among its peers and far
below the “Top Ten” average.
Net New Establishments Standings
U.S. Census Bureau (County Business Patterns)
NET NEW ESTABLISHMENTS
RANKLe
vel
3654
1,920
thTr
end
Top
10 A
vg.

What it is:The number of new, privately owned,housing units authorized for constructionper 1,000 residents.
Why it matters:This measure indicates how quickly newhousing stock is being created in thestate—a proxy for growing populationand household formation, and a source ofeconomic growth.
Permits for new constructionin Michigan have improvedin recent years but remainfar below pre-recession
levels. There were fewer new
construction permits issued
per capita in Michigan than
in all “Top Ten” states and all
peer states except for Illinois.
New Construction Permit Standings
New Construction Permits
U.S. Census Bureau
Business Leaders for Michigan I20
15 Economic Com
petitiveness Benchmarking Report
52
NEW CONSTRUCTION PERMITS
RANKLe
vel
461.6
4.6
thTr
end
Top
10 A
vg.
New Construction Permit Trends

53
input
value
Business Leaders for Michigan I 2015 Econom
ic Competitiveness Benchm
arking Report
Average Earnings ineconomy sectors
Average Earnings Trends - New Michigan sectors
What it is:Average annual earnings (in 2014 dollars), realGDP, and employment as a share of working-age population in the engineering, geographictrade, higher education, life sciences,automotive, and natural resources sectors.
Why it matters:These six sectors represent majoropportunities crucial for growing Michigan’seconomy, and moving it forward in the newglobal economy. These three major indicators(GDP, employment, and earnings) show howthese sectors are contributing to a state’sproduction and to residents' well-being.
While earnings in theindustries that have beenidentified as New Michiganopportunities remain wellabove the average earningsin Michigan, they have beenstagnant from 2011 to 2013.In earnings, employment, andGDP for these sectors,Michigan ranks in the middleof the pack among its peersand below the “Top Ten”average.
Average Earnings Standings - New Michigan sectors
New Michigan: The 2015 Report on Michigan's Progress inLeveraging Six Opportunities
AVERAGE EARNINGS
RANK
Leve
l
14$63,234
$64,593
th
Tren
dTo
p 10
Avg
.
newmichigan

What it is:Average annual earnings (in 2014dollars), real GDP, and employment as ashare of working-age population in theengineering, geographic trade, highereducation, life sciences, automotive, andnatural resources sectors.
Why it matters:These six sectors represent majoropportunities crucial for growingMichigan’s economy, and moving itforward in the new global economy.These three major indicators (GDP,employment, and earnings) show howthese sectors are contributing to a state’sproduction and to residents' well-being.
In real GDP among theindustries that have beenidentified as New Michiganopportunity industries,Michigan has improvedconsiderably over the pastfew years. In earnings,employment, and GDP,Michigan ranks in themiddle of the pack amongits peers and below the“Top Ten” average.
GDP Per Capita - New Michigan Standings
GDP Per Capita ineconomy sectors
New Michigan: The 2015 Report on Michigan's Progress inLeveraging Six OpportunitiesBu
siness Leaders for Michigan I20
15 Economic Com
petitiveness Benchmarking Report
54
GDP PER CAPITAL – NEW MI
RANKLe
vel
22 $7,973
$14,187
ndTr
end
Top
10 A
vg.
GDP Per Capita - New Michigan Trends
newmichigan

55
input
value
Business Leaders for Michigan I 2015 Econom
ic Competitiveness Benchm
arking Report
Employment/Working Age Population ineconomy sectors
Employment/Working Age Population Trends
What it is:Average annual earnings (in 2014 dollars),real GDP, and employment as a share ofworking-age population in theengineering, geographic trade, highereducation, life sciences, automotive, andnatural resources sectors.
Why it matters:These six sectors represent majoropportunities crucial for growingMichigan's economy, and moving it forwardin the new global economy. These threemajor indicators (GDP, employment, andearnings) show how these sectors arecontributing to a state's production and toresidents' well-being.
Michigan has improvedconsiderably over the pastfew years. In employmentamong the industries that
have been identified as New
Michigan opportunity
industries. Michigan ranks in
the middle of the pack
among its peers and below
the “Top Ten” average.
Employment/Working Age Population Standings
New Michigan: The 2015 Report on Michigan's Progress inLeveraging Six Opportunities
EMPLOYMENT PERCENTAGE
RANK
Leve
l
2313.2%
16.1%
rd
Tren
dTo
p 10
Avg
.
newmichigan

Business Leaders for Michigan I20
15 Economic Com
petitiveness Benchmarking Report
56
Urban Roads in Poor Condition
Urban Roads in Poor Condition Trends
What it is:Share of urban roads in poor condition, bylength.
Why it matters:A strong, reliable transportation systembenefits both businesses and individuals.Poor road quality imposes many tangiblecosts and reduces productivity.
The percentage of poor-quality urban roads inMichigan increased from2012 to 2013. Urban roadquality was worse in
Michigan than the “Top Ten”
average, and Michigan
ranked 39th among all
states. Among peers,only Massachusetts andCalifornia have a greaterpercentage of urban roadsin poor condition.
Note: Includes interstate highways, freeways, expressways, andmajor arterial roads in urban areas.
Urban Roads in Poor Condition Standings
U.S. Department of Transportation Federal Highway Administration(Length by measured pavement roughness, all systems)
URBAN ROADS IN POOR CONDITION
RANKLevel
3913.3%
11.8%
thTrend
Top
10
Avg
.

57
input
value
Business Leaders for Michigan I 2015 Econom
ic Competitiveness Benchm
arking Report
U.S. Department of Transportation Federal Highway Administration(Area of bridges by Functional Classification)
What it is:Percent of bridges in deficient condition,by area.
Why it matters:A strong, reliable transportation systembenefits both businesses and individuals.Poor bridge quality imposes manytangible costs and reduces productivity.
The share of bridgescategorized as deficient inMichigan has declinedconsiderably over the past10 years, declining at aconsiderably higher ratethan that for the “Top Ten”average and for peer states.However, the share ofbridges that are deficient inMichigan remains abovethose two averages.Michigan has a higher shareof deficient bridges than allpeer states except Californiaand Massachusetts.
Deficient Bridge Standings
Deficient Bridges
DEFICIENT BRIDGES
RANKLe
vel
4233.5%
32.0%
ndTr
end
Top
10 A
vg.
Deficient Bridge Trends
Akami
Business Leaders for Michigan I20
15 Economic Com
petitiveness Benchmarking Report
58
Broadband Speeds
Broadband Speed Trends
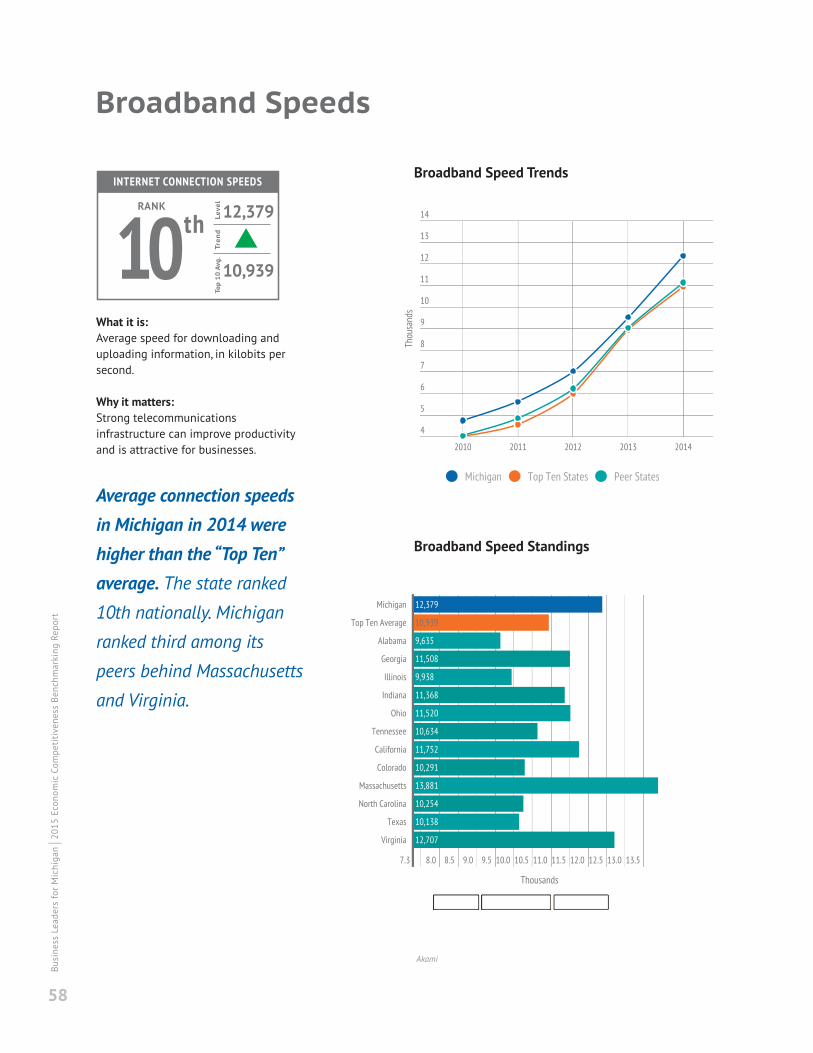
What it is:Average speed for downloading anduploading information, in kilobits persecond.
Why it matters:Strong telecommunicationsinfrastructure can improve productivityand is attractive for businesses.
Average connection speedsin Michigan in 2014 werehigher than the “Top Ten”average. The state ranked10th nationally. Michigan
ranked third among its
peers behind Massachusetts
and Virginia.
Broadband Speed Standings
INTERNET CONNECTION SPEEDS
RANKLevel
10 12,379
10,939
thTrend
Top
10 A
vg.

59
input
value
Business Leaders for Michigan I 2015 Econom
ic Competitiveness Benchm
arking Report
What it is:The percent of households with high-speed Internet connections, based onhousehold survey data.
Why it matters:Access to Internet at home makes iteasier for students, workers, andentrepreneurs to stay connected.
The number of households
with access to quality
internet service increased
by 25 percentage points
between 2007 and 2013.
However, Michigan still ranksbelow the averages of both“Top Ten” and peer states.
Broadband Penetration Standings
Broadband Penetration
U.S. Census Bureau
BROADBAND PENETRATION
RANKLe
vel
3870.7%
75.0%
thTr
end
Top
10 A
vg.
Broadband Penetration Trends
Business Leaders for Michigan I20
15 Economic Com
petitiveness Benchmarking Report
60
Population Age 25-34
Population Age 25-34 Trends
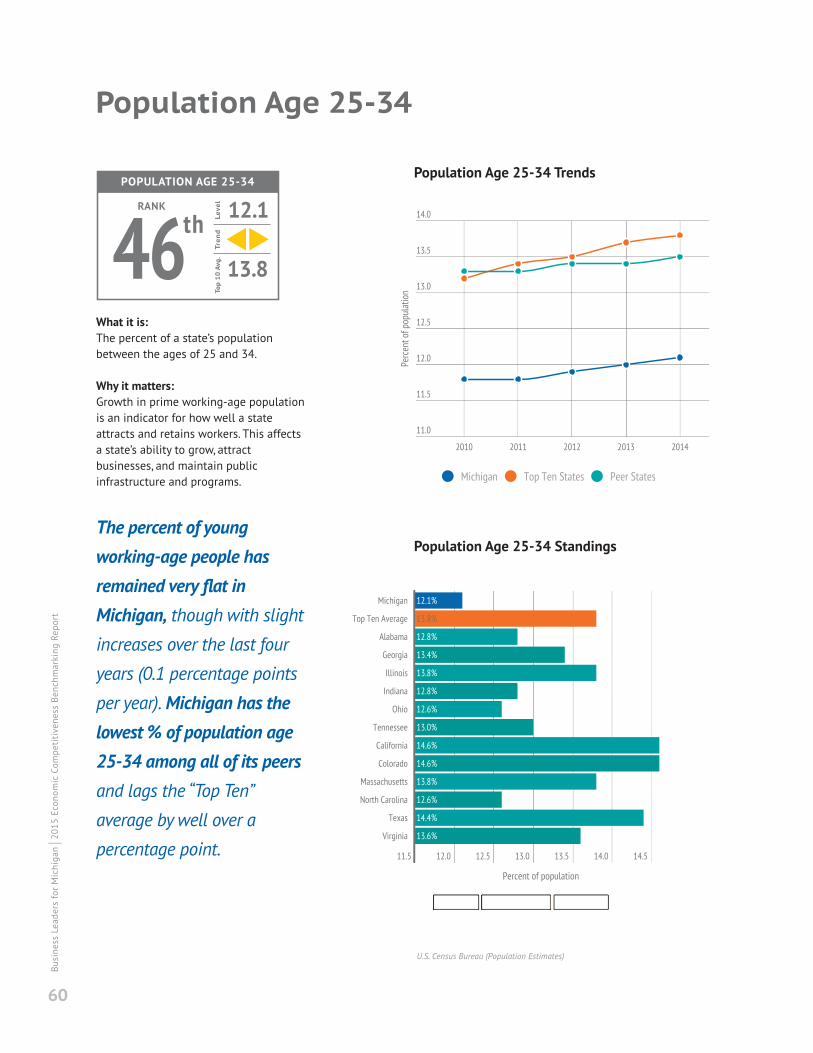
What it is:The percent of a state’s populationbetween the ages of 25 and 34.
Why it matters:Growth in prime working-age populationis an indicator for how well a stateattracts and retains workers. This affectsa state’s ability to grow, attractbusinesses, and maintain publicinfrastructure and programs.
The percent of youngworking-age people hasremained very flat inMichigan, though with slightincreases over the last four
years (0.1 percentage points
per year). Michigan has thelowest % of population age25-34 among all of its peersand lags the “Top Ten”
average by well over a
percentage point.
Population Age 25-34 Standings
U.S. Census Bureau (Population Estimates)
POPULATION AGE 25-34
RANKLe
vel
4612.1
13.8
thTr
end
Top
10 A
vg.

61
input
value
Business Leaders for Michigan I 2015 Econom
ic Competitiveness Benchm
arking Report
What it is:The average number of minutes it takesfor a worker to travel to and from work.
Why it matters:A shorter commute time means easieraccess to jobs for workers and lessproductive time wasted duringcommutes.
Michigan ranks in themiddle of all states forcommute time, with slightlylonger commutes than the
“Top Ten” average, but
shorter commutes than nine
of its peer states.
Commute Time Standings
Commute Time
US Census Bureau
COMMUTE TIME
RANKLe
vel
2824.0
22.7
thTr
end
Top
10 A
vg.
Commute Time Trends
Business Leaders for Michigan I20
15 Economic Com
petitiveness Benchmarking Report
62
Violent Crime Rate
Violent Crime Rate Trends
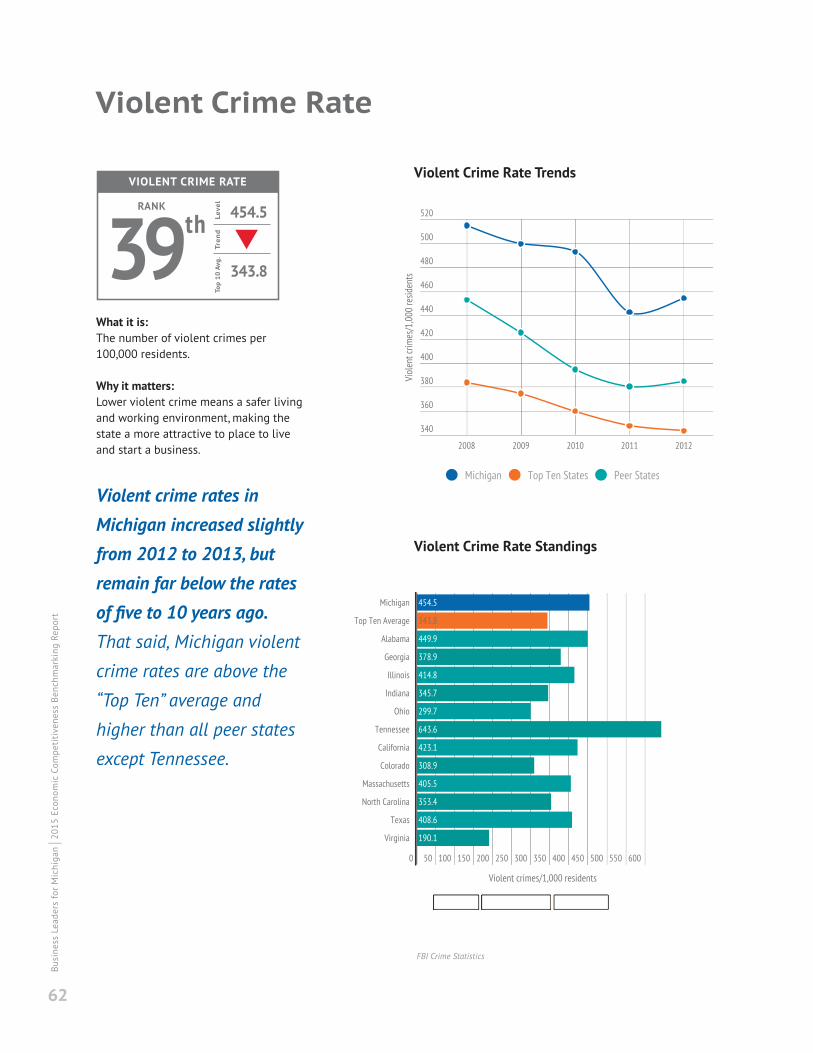
What it is:The number of violent crimes per100,000 residents.
Why it matters:Lower violent crime means a safer livingand working environment, making thestate a more attractive to place to liveand start a business.
Violent crime rates inMichigan increased slightlyfrom 2012 to 2013, butremain far below the ratesof five to 10 years ago.That said, Michigan violent
crime rates are above the
“Top Ten” average and
higher than all peer states
except Tennessee.
Violent Crime Rate Standings
FBI Crime Statistics
VIOLENT CRIME RATE
RANKLe
vel
39454.5
343.8
thTr
end
Top
10 A
vg.
States that prohibit discrimination based on sexual orientation and gender identity
WA
OR
CA
NV
UT
AZNM
CO
WY
ID
MT ND
SD
NE
KS
OK
MN
IA
MO
AR
TXLA
ILIN
OH
KY
TN
MS AL GA
FL
SC
NC
VAWV
PA
NY
ME
NH
NJ
DE
MDDC
CTRI
MAWI
MI
AK
HI
VT
States that prohibit discrimination based on sexual orientation only
States that prohibit discrimination based on gender identity only
63
input
value
Business Leaders for Michigan I 2015 Econom
ic Competitiveness Benchm
arking Report
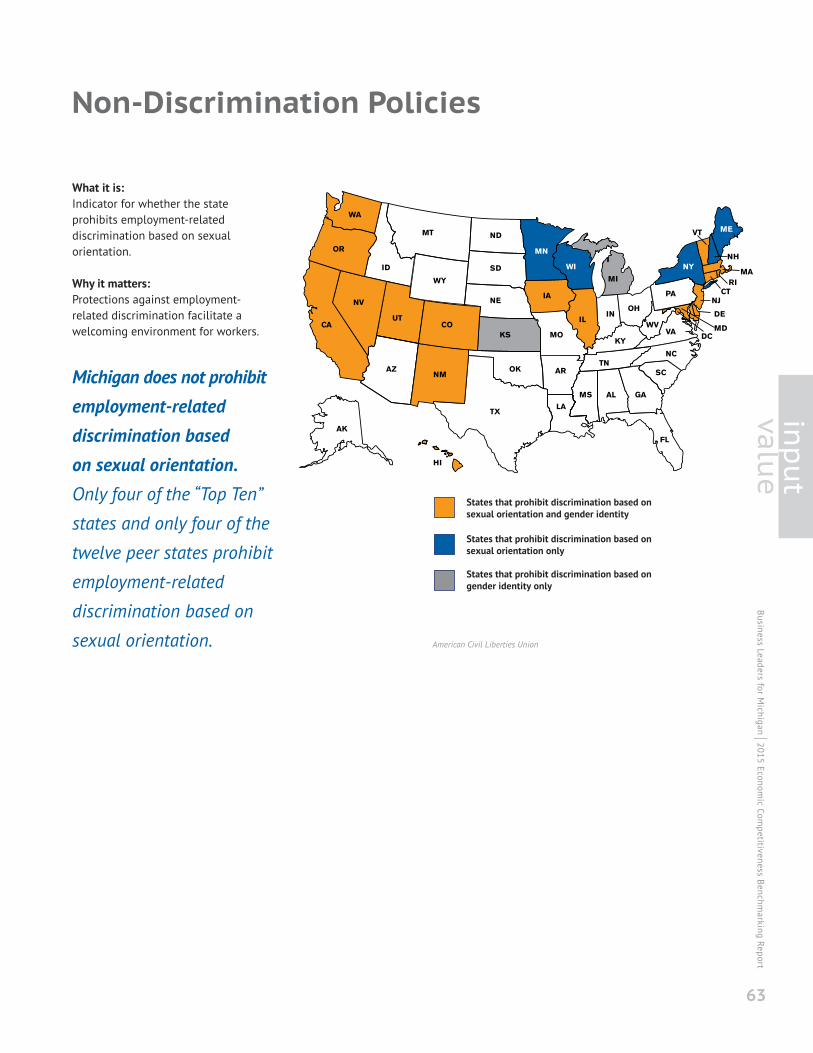
Non-Discrimination Policies
What it is:Indicator for whether the stateprohibits employment-relateddiscrimination based on sexualorientation.
Why it matters:Protections against employment-related discrimination facilitate awelcoming environment for workers.
Michigan does not prohibitemployment-relateddiscrimination basedon sexual orientation.Only four of the “Top Ten”
states and only four of the
twelve peer states prohibit
employment-related
discrimination based on
sexual orientation. American Civil Liberties Union

Business Leaders for Michigan I20
15 Economic Com
petitiveness Benchmarking Report
64
Input Conclusions
Michigan has achieved Top Ten performance on cost inputssuch as Business and Overall Tax Climates and is trendingpositive on Labor and Energy cost inputs.
Michigan’s performance on key value inputs is mixed withstrengths in innovation areas such as University Researchand Development, Exports and Patents. Michigan’sperformance is in the bottom third of states on severaltalent measures, including 4th grade reading, career- andcollege-ready graduates, out-of-state enrollment, andeducational attainment.

Business Leaders for Michigan I 2015 Econom
ic Competitiveness Benchm
arking Report
65
input
Bottom10
RoadQuality
4th GradeReading
Career &CollegeReadiness
Patents
Top 10
UniversityR&D
Exports
Educational Attainment
TaxClimate

Business Leaders for Michigan I20
15 Economic Com
petitiveness Benchmarking Report
66
KEWEENAWW
ONTONAGON
GOGEBIC
IRON
BARAGA
MARQUETTE
DICKINSON
MENOMINEE
DELTA
ALGERSCHOOLCRAFT
LUCE
MACKINAC
CHIPPEWA
EMMET
CHEBOYGANPRESQUE ISLE
CHARLEVOIX
ALPENA
MONTMORENCYOTSEGANTRIM
LEELANAU
BENZIEGRAND
TRAVERS
KALKASKACODA ALCONA
IOSCOOGEMAWROSCOMMONUKEEWEXFORMANISTEE
MASON LAKE OSCEOLA CLARE GLADWINARENAC
HURON
MIDLAND
TUSCOLA SANILAC
LAPSHIAWASSEE
GRATIOAGINAW
GENESEE
MECOSTANEWAYGO
OCEANA
OTTAWA
MONTCALM
IONIA CLINTON
EATOLIVINGSTON
ALLEGAN
VAN BURENJACKSON
BERRIEN CAS JOSEPH BRANCH HILLSDALE WEE MONROE
HOUGHTON
ISABELLA
MUSKEGON
KENT
GHAM
KALAMAZOO CALHOUN WASHTENAW WAYNE
OAKLAND
MACOMB
ST. CLAIR
BAY
CRAWF
BARRY
1
SE
KALKA
MIMISSMISSAURD2
MGO
OSCORD3
KENT
4MIDLAND
OTSA
5 A SAN
PEER S
6CLINTON
ON ING7
ON
LENAW
W
9WAYNE
10SS ST. J
KALA
8
1
5
9
3
7
2
6
10
4
8
Upper Peninsula region
Lake Superior Community
Partnership
Northwest region NWMCOG
Northeast region NEMCOG
West Michigan region The Right Place
East Central Michigan region
Saginaw Future
East Michigan region Flint and Genesee Chamber of Commerce
South Central region LEAP
Southwest region Southwest Michigan First
Southeast Michigan region
Ann Arbor SPARK
Detroit Metro region Detroit Economic Growth Corp
Oakland County PCD
Macomb County PED
Wayne County EDGE
REGIONS
Michigan’s Regional PerformanceMichigan is not one economy; rather it is multiple economies identified by commonregional assets. This section illustrates the economic performance of Michigan'sregions over the last five years.
OutputEmployment GrowthUnemployment RateLabor ForcePer Capita IncomePopulation
InputDegrees ConferredTechnical EducationEducational AttainmentPatents Per 100,000 Residents

What it is:Seasonally-adjusted average number of residents
with a private-sector job.
Why it matters:Higher levels of private employment indicate both
economic strength and prosperity among the
region’s residents.
Employment Growth
What it is:Average share of labor force that is looking for
work but does not have a job (not seasonally-
adjusted).
Why it matters:A lower unemployment rate indicates that more
residents seeking employment are able to find it.
Unemployment Rate
67
regional
Bureau of Labor Statistics (Quarterly Census of Employment and Wages)
Bureau of Labor Statistics (Local Area Unemployment Statistics)
2014 Unemployment Rate
2009-14 Employment CAGR
Business Leaders for Michigan I 2015 Econom
ic Competitiveness Benchm
arking Report

Business Leaders for Michigan I20
15 Economic Com
petitiveness Benchmarking Report
68
What it is:The share of the population age 16 and older, not
including residents who are on active duty or
institutionalized, that is employed or looking for work.
Why it matters:Members of the working-age population can stop
looking for work and drop out of the labor force due
to many reasons, including disability, old age, or
discouragement. Higher labor force participation is
a sign of a healthier economy and workforce.
Labor Force
Bureau of Labor Statistics (Local Area Unemployment Statistics)
What it is:Share of residents aged 25 to 64 with an
associates degree or higher.
Why it matters:The availability of highly educated talent can
promote future growth of the economy.
Educational Attainment
U.S. Census Bureau (American Community Survey)
2009–14 Labor Force CAGR
Educational Attainment (2009–13 Estimates)

69
regional
What it is:Personal income (2014 dollars) divided by
population. Personal income includes salaries,
wages, and bonuses from employment; dividends
and interest from investments; rental income;
pensions, etc.
Why it matters:Personal income is an indicator of prosperity and
average standard of living in a region.
Per Capita Income 2013 Per Capita Personal Income
Bureau of Economic Analysis (Personal income summary), Bureau of Labor Statistics (CPI Inflation Calculator)
2008-13 Per Capita Personal Income CAGR
Business Leaders for Michigan I 2015 Econom
ic Competitiveness Benchm
arking Report
Business Leaders for Michigan I20
15 Economic Com
petitiveness Benchmarking Report
70
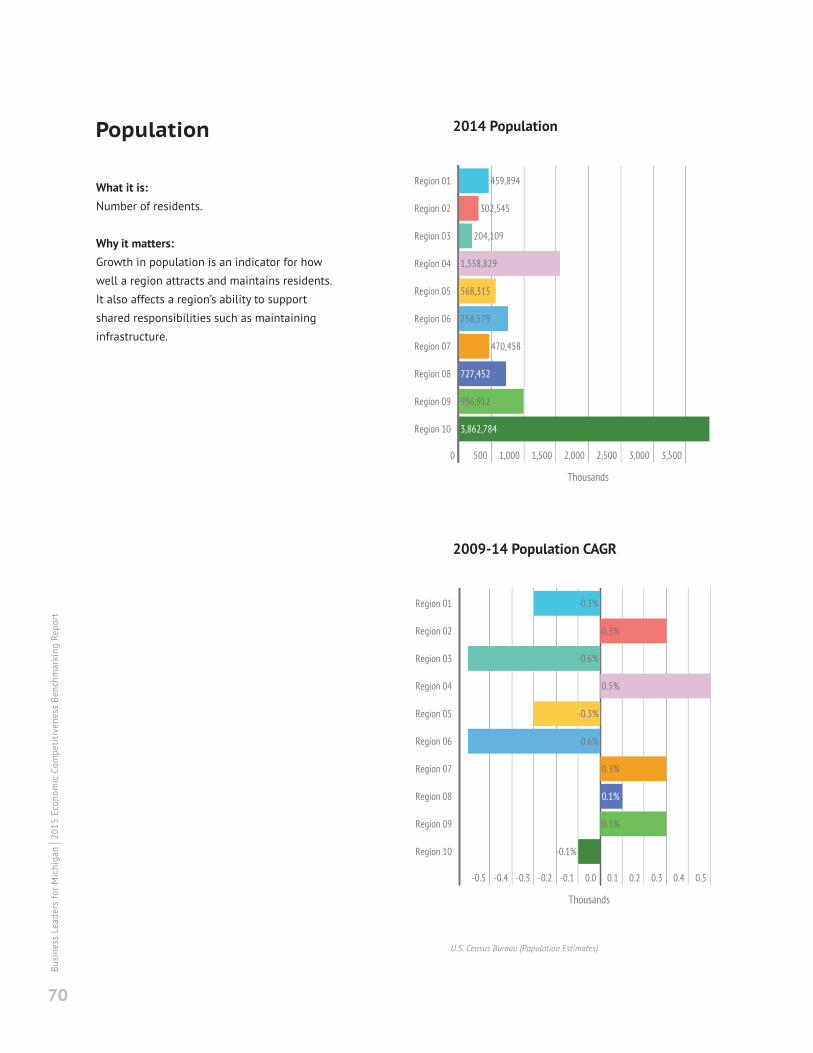
What it is:Number of residents.
Why it matters:Growth in population is an indicator for how
well a region attracts and maintains residents.
It also affects a region’s ability to support
shared responsibilities such as maintaining
infrastructure.
Population
U.S. Census Bureau (Population Estimates)
2014 Population
2009-14 Population CAGR
71
regional
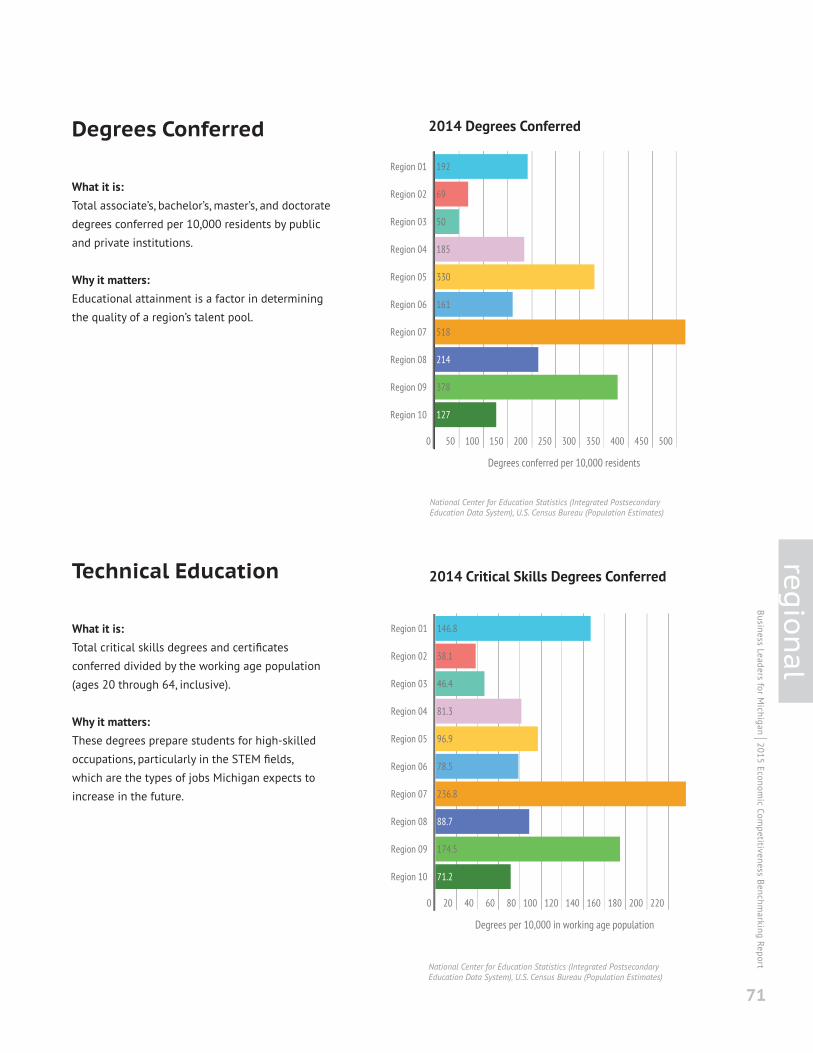
What it is:Total associate’s, bachelor’s, master’s, and doctorate
degrees conferred per 10,000 residents by public
and private institutions.
Why it matters:Educational attainment is a factor in determining
the quality of a region’s talent pool.
Degrees Conferred
National Center for Education Statistics (Integrated PostsecondaryEducation Data System), U.S. Census Bureau (Population Estimates)
2014 Degrees Conferred
What it is:Total critical skills degrees and certificates
conferred divided by the working age population
(ages 20 through 64, inclusive).
Why it matters:These degrees prepare students for high-skilled
occupations, particularly in the STEM fields,
which are the types of jobs Michigan expects to
increase in the future.
Technical Education
National Center for Education Statistics (Integrated PostsecondaryEducation Data System), U.S. Census Bureau (Population Estimates)
2014 Critical Skills Degrees Conferred
Business Leaders for Michigan I 2015 Econom
ic Competitiveness Benchm
arking Report
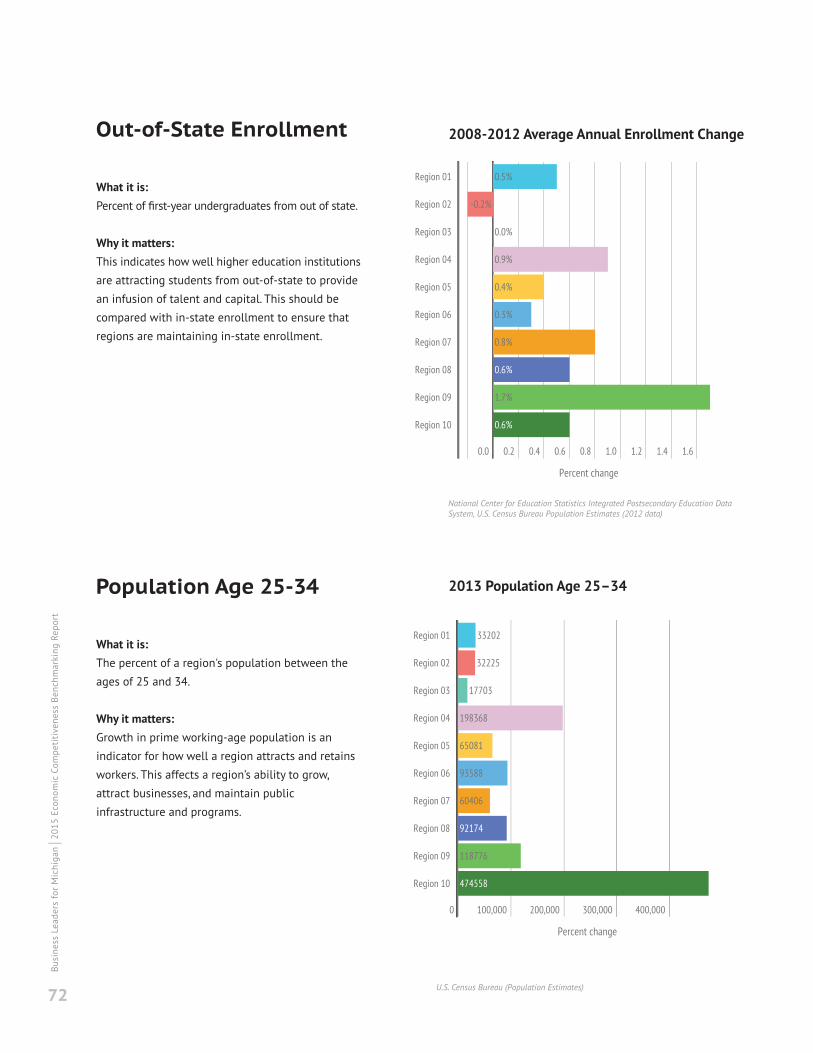
Business Leaders for Michigan I20
15 Economic Com
petitiveness Benchmarking Report
72
What it is:Percent of first-year undergraduates from out of state.
Why it matters:This indicates how well higher education institutions
are attracting students from out-of-state to provide
an infusion of talent and capital. This should be
compared with in-state enrollment to ensure that
regions are maintaining in-state enrollment.
Out-of-State Enrollment
National Center for Education Statistics Integrated Postsecondary Education DataSystem, U.S. Census Bureau Population Estimates (2012 data)
What it is:The percent of a region's population between the
ages of 25 and 34.
Why it matters:Growth in prime working-age population is an
indicator for how well a region attracts and retains
workers. This affects a region’s ability to grow,
attract businesses, and maintain public
infrastructure and programs.
Population Age 25-34
U.S. Census Bureau (Population Estimates)
2008-2012 Average Annual Enrollment Change
2013 Population Age 25–34

73
regional
What it is:Number of U.S. patents awarded per 100,000
residents.
Why it matters:Patents provide an incentive for innovators and
entrepreneurs to improve technology. The regions
whose residents are the source of this innovation
have an advantage in reaping the economic
benefits derived from them.
Patents Per Capita
U.S. Patent and Trademark Office (Patents By Country, State, and Year -Utility Patents), U.S. Census Bureau (Population Estimates)
2013 Patents Per Capita
What it is:The number of new, privately owned, housing
units authorized for construction per 1,000
residents.
Why it matters:This measure indicates how quickly new housing
stock is being created in the region — a proxy for
growing population and household formation,
and a source of economic growth.
New Construction Permits
U.S. Census Bureau
New Construction Permits
Business Leaders for Michigan I 2015 Econom
ic Competitiveness Benchm
arking Report

Business Leaders for Michigan I20
15 Economic Com
petitiveness Benchmarking Report
74
JEFF M. FETTIGWhirlpool CorporationCHAIR, BLM BOARD
TERENCE E. ADDERLEYKelly Services, Inc.
KEITH J. ALLMANMasco Corporation
G. MARK ALYEAAlro Steel Corporation
GERARD M. ANDERSON DTE Energy
JOSEPH B. ANDERSON, JR.TAG Holdings, LLC
DAVID W. BARFIELD The Bartech Group, Inc.
MARY BARRAGeneral Motors Company
ALBERT M. BERRIZ McKinley, Inc.
MARK J. BISSELLBISSELL Inc.
LAURENT BRESSONNexteer Automotive
JOHN C. CARTERChase
GREGORY J. CRABBAmerisure Insurance Company
ROBERT S. CUBBINMeadowbrook Insurance Group, Inc.
MATTHEW P. CULLENRock Ventures LLC
MARY CULLERFord Motor Company
WALTER P. CZARNECKIPenske Corporation
KURT L. DARROWLa-Z-Boy Incorporated
DAVID C. DAUCH American Axle & Manufacturing
RICHARD L. DeVOREPNC Financial Services Group
DOUG DeVOSAmway
ALESSANDRO P. DiNELLOFlagstar Bank
STEFAN O. DOERRBASF Corporation
J. PATRICK DOYLEDomino’s
JAMES E. DUNLAPHuntington
MATTHEW B. ELLIOTT Bank of America
WILLIAM CLAY FORD, JR. Ford Motor Company
DAN GILBERTQuicken Loans
DAVID GIRODATFifth Third Bank-Eastern Michigan
DAN GORDONGordon Food Service, Inc.
RONALD E. HALL Bridgewater Interiors, LLC
RICHARD G. HAWORTHHaworth, Inc.
CHRISTOPHER ILITCH Ilitch Holdings, Inc.
MICHAEL J. JANDERNOAPerrigo Company
MILES E. JONESDawn Food Products, Inc.
HANS-WERNER KAAS McKinsey & Company
ALAN JAY KAUFMANKaufman Financial Group
JAMES P. KEANESteelcase Inc.
JOHN C. KENNEDYAutocam Medical
STEPHEN M. KIRCHERBoyne Resorts
WILLIAM L. KOZYRATI Automotive
BLAKE W. KRUEGERWolverine World Wide, Inc.
BRIAN K. LARCHEEngineered Machined Products, Inc.
ANDREW N. LIVERISThe Dow Chemical Company
KEVIN A. LOBOStryker Corporation
DANIEL J. LOEPP Blue Cross Blue Shield of Michigan
EVAN D. LYALL Roush Enterprises, Inc.
Business Leaders for Michigan - 2015 Board of Directors

BEN C. MAIBACH III Barton Malow Company
DENNIS MANNIONPalace Sports & Entertainment
RICHARD A. MANOOGIAN Masco Corporation
FLORINE MARK The Weight Watchers Group, Inc.
CHARLES G. McCLUREMichigan Capital Partners, LP
DAVID E. MEADORDTE Energy
HANK MEIJERMeijer, Inc.
MICHAEL MILLERGoogle, Inc.
FREDERICK K. MINTURNMSX International
PAUL J. MUELLERThe Hanover Insurance Group
MARK A. MURRAYMeijer, Inc.
JAMES B. NICHOLSONPVS Chemicals, Inc.
WILLIAM U. PARFETMPI Research
CYNTHIA J. PASKY Strategic Staffing Solutions
ROGER S. PENSKE Penske Corporation
WILLIAM F. PICKARD Global Automotive Alliance, LLC
SANDRA E. PIERCE FirstMerit Michigan
CHARLES H. PODOWSKI The Auto Club Group
JOHN RAKOLTA, JR. Walbridge
MICHAEL T. RITCHIEComerica Bank
DOUG ROTHWELL Business Leaders for Michigan
ANDRA M. RUSHRush Group Family of Companies
JOHN G. RUSSELLCMS Energy & Consumers Energy
MARK S. SCHLISSELUniversity of Michigan
J. DONALD SHEETSDow Corning Corporation
GARY A. SHIFFMANSun Communities, Inc.
LOU ANNA K. SIMON Michigan State University
SAM SIMONSimon Holdings
MATTHEW J. SIMONCINILear Corporation
BRIG SORBERTwo Men And A Truck/International, Inc.
ROBERT S. TAUBMAN Taubman Centers, Inc.
GARY TORGOWTalmer Bancorp, Inc.
HOWARD UNGERLEIDERThe Dow Chemical Company
SAMUEL VALENTI III TriMas Corporation
STEPHEN A. VAN ANDELAmway
BRIAN C. WALKERHerman Miller, Inc.
THOMAS J. WEBBCMS Energy & Consumers Energy
THOMAS G. WELCH, JR.Fifth Third Bank-Western Michigan
GIL WESTDelta Air Lines, Inc.
M. ROY WILSONWayne State University
ROGER J. WOODDana Holding Corporation
WILLIAM C. YOUNG Plastipak Holdings, Inc.
MARK ZEFFIROHorizon Global
This list represents the boardmembers at the time of printing.For a current list, visitbusinessleadersformichigan.com
75
Business Leaders for Michigan I 2015 Econom
ic Competitiveness Benchm
arking Report

Business Leaders for Michigan I20
15 Economic Com
petitiveness Benchmarking Report
76


www.BusinessLeadersforMichigan.com