hot spots: benchmarking global city competitiveness
TRANSCRIPT

Hot spotsBenchmarking global city competitiveness
Commissioned by
A report from the Economist Intelligence Unit

© The Economist Intelligence Unit Limited 2012 1
Hot spotsBenchmarking global city competitiveness
Contents
Preface 2
Executive summary 3
Introduction: Striving for competitiveness 8 Finding a competitive advantage 9
Case study: Singapore—Asia’s most competitive city 10
Rebalancing West and East: Legacy versus growth 11 Case study: Wipro—From East to West to East 14
Beyond the megacities: Tomorrow’s new power brokers? 15 Case study: Dell’s city selection criteria 17
Talent, jobs and quality of life 18 Case study: New York’s talent as a competitive edge 20
City size, density and competitive performance 21
Conclusion: Leapfrogging ahead? 23
Appendix 1: Index scores by category 25
Appendix 2: Index scores by region 27
Appendix 3: Full methodology 29

© The Economist Intelligence Unit Limited 20122
Hot spotsBenchmarking global city competitiveness
Hot spots is an Economist Intelligence Unit (EIU) research programme, commissioned by Citigroup, which ranks the competitiveness of 120 of the world’s major cities. The EIU bears sole responsibility for the content of this report. The EIU’s editorial team built the Global City Competitiveness Index, conducted the analysis and wrote the report. The findings and views expressed in this report do not necessarily reflect the views of the sponsor.
Our research drew on two main initiatives:
• A unique Index that compares 120 of the world’s major urban agglomerations across eight distinct categories of competitiveness and 31 individual indicators. These cities collectively represent about 29% of the global economy, with a combined GDP of US$20.2tr. A detailed note on definitions and methodology is provided in the appendix.
• We conducted in-depth interviews with ten city experts, mayors and corporate executives, to get their insights on city competitiveness.
The Index was devised and constructed by an EIU research team led by Manoj Vohra. The author of the report was James Watson and the editor was Sudhir Vadaketh. Sarah Fister Gale and Premila Nazareth assisted with further interviews. Our sincere thanks go to the following interviewees (listed alphabetically by organisation) for their time and insights:
• Dane Parker, vice president, global facilities, real estate and environmental health and safety, Dell
• Kevin Stolarick, research director, Martin Prosperity Institute
• Jaana Remes, senior fellow, McKinsey Global Institute
• Michael Bloomberg, mayor, New York
• Javier Sanchez-Reaza, economist and urban specialist, OECD
• Lamia Kamal-Chaoui, head, urban development programme, OECD
• Johannes Schmidt, CEO, project and structured finance, Infrastructure & Cities and Industry, Siemens
• Khoo Teng Chye, executive director, Singapore’s Centre for Liveable Cities
• Todd Overmyer, global head of retail, Triumph
• Hariprasad Hegde, global head of operations, Wipro
January 2012
Preface
© The Economist Intelligence Unit Limited 2012 3
Hot spotsBenchmarking global city competitiveness
Executive summary
W ell over half of the world’s population now lives in cities, generating more than 80% of global GDP. Already, global business is beginning to plan strategy from a city, rather than a country,
perspective. Given the rapid growth and development of many cities, particularly in emerging markets such as China
and India, competition between them for business, investment and talent will only get fiercer. Size alone does not determine a city’s growth potential. While some megacities, such as New York
and Tokyo, are immensely influential, there are smaller ones, such as Hong Kong and Singapore, which have established themselves as globally competitive centres in recent years. Meanwhile, emerging market cities such as Ahmedabad and Tianjin are witnessing double-digit economic growth and have the potential to grow even faster.
Competitiveness, however, is a holistic concept. While economic size and growth are important and necessary, several other factors determine a city’s overall competitiveness, including its business and regulatory environment, the quality of human capital and indeed the quality of life. These factors not only help a city sustain a high economic growth rate, but also create a stable and harmonious business and social environment.
With this in mind, the Economist Intelligence Unit (EIU) was commissioned by Citigroup to develop a “Global City Competitiveness Index” to rank cities according to their demonstrated ability to attract capital, businesses, talent and visitors. Overall rankings and the Index methodology are summarised at the end of this chapter (see pages 6-7 for a table of the final scores and the appendix for a full explanation of the methodology).
To put the results of the index in context, the EIU interviewed experts around the world and reviewed existing research on the topic of city competitiveness for this briefing paper. Among the key findings of the research are as follows:
• US and European cities are the world’s most competitive today, despite concerns over ageing infrastructure and large budget deficits. While there is much concern in the West about the impact of the financial crisis, which has slowed plans for urban renewal, this has not reduced the ability of US and European cities to attract capital, businesses, talent and tourists, which is ultimately what this Index

© The Economist Intelligence Unit Limited 20124
Hot spotsBenchmarking global city competitiveness
seeks to measure. New York (1st) and London (2nd) are rated as the world’s two most competitive cities, while cities from the United States and Western Europe account for 24 of the top 30 cities. All these cities perform relatively well across all eight pillars of competitiveness measured in the Index, making them good all-round performers.
Although many Western countries have sombre growth outlooks over the next decade, some of their leading cities may be able to harness their legacy advantages and global connectivity to continue to compete and succeed against fast-growing emerging market cities.
• Asia’s economic rise is reflected in the economic competitiveness of its cities. Asian cities dominate the “economic strength” category of the competitiveness Index—the most highly weighted category. All but five of the top 20 cities on this measure are Asian. Tianjin, Shenzhen and Dalian top the list, while nine other Chinese cities rank in the top 20. Singapore (15th), Bangalore (16th), Ahmedabad (19th) and Hanoi (joint 20th) round off the list. The top 32 Asian cities are all forecast to grow by at least 5% annually between now and 2016. Twelve of them will grow by at least 10%. This is in stark contrast to the low single-digit growth of most developed market cities in Europe and the United States.
• A “middle tier” of mid-size cities is emerging as a key driver of global growth. Although most firms target a combination of advanced economies and emerging market megacities, the fastest overall growth is found in a middle tier of mid-sized cities with populations of 2m-5m. Just nine of the 23 megacities (those with populations of at least 10m) tracked in this Index ranked among the top 30 cities on economic strength, for example. Indeed, mid-sized cities—ranging from Hanoi to Houston—dominate the growth rankings. They are collectively forecast to grow by 8.7% annually over the next five years, ahead of the megacities on which many firms focus.
• The most significant advantage that developed country cities hold is their ability to develop and attract the world’s top talent. European and American cities dominate the human capital category of the Index. This stems primarily from the quality of their educational systems and the entrepreneurial mindset of their citizens (the two largest indicators within the category). But other factors bolster their performance too, such as cultural activities and a generally good quality of life. Michael Bloomberg, New York’s mayor, says such factors are a key part of maintaining competitiveness: “I’ve always believed that talent attracts capital more effectively and consistently than capital attracts talent.”
• Infrastructure investments will drive emerging market growth, but more will be needed to secure their attractiveness to tomorrow’s talent. One of the most pressing challenges for emerging market cities in the decades ahead will be whether they can focus their development not just on skyscrapers, rail links and other infrastructure, but also on the softer aspects that will be crucial to their ability to attract and develop tomorrow’s talent—including education, quality of life, and personal freedoms, among other things. Another more basic factor will be the ability, especially within China’s cities, to grapple with the pollution challenges that threaten the health of their citizens.
© The Economist Intelligence Unit Limited 2012 5
Hot spotsBenchmarking global city competitiveness
• Cities of all sizes can be competitive, but density is a factor in the competitiveness of larger cities. The top ten most competitive cities in this ranking range from the world’s biggest (Tokyo’s estimated 36.7m people) to some of its smallest (Zurich’s estimated 1.2m). Indeed, there is no correlation seen between size and competiveness in the Index. While bigger cities offer a greater pool of labour and higher demand, as well as potential economies of scale, if they are not planned correctly congestion and other issues can actively impede their competitiveness. Urban density is clearly linked to higher productivity: Hong Kong’s efficient density is one reason it performs far better in the Index than, say, Mexico City’s inefficient urban sprawl.
• African and Latin American cities lag most on competitiveness. All regions have leaders and laggards in terms of competitive cities. But while most regions host at least some competitive cities, Latin America in particular performs relatively poorly across most categories, including in physical capital (its best city, Santiago, is joint 66th) and institutional effectiveness (Panama City tops the list at 53rd). Just one city, Buenos Aires (60th), makes the top half of the Index. Africa lags further, with South Africa providing the only decent contenders, such as Johannesburg (67th) and Cape Town (73rd).
Nevertheless, the economies of several African and Latin American cities are set to expand rapidly in 2010-16. For instance, Lagos (6.8% cumulative average annual growth), Lima (6.3%), Bogotá (5.4%), Medellin (5.4%) and Nairobi (5.2%) are expected to be among the world’s 40 fastest-growing cities over this period. With concomitant improvement in some other aspects of competitiveness—such as the quality of infrastructure and their regulatory environments—these cities could rise up the Index rankings quickly.
Methodology overview
Competitiveness is a holistic concept. While economic size and growth are important and necessary, several other factors help determine a city’s competitiveness as well, including its business and regulatory environment, the quality of human capital and cultural aspects. These factors not only help a city sustain high economic growth rates, but also create a stable and harmonious business and social environment.
Against this backdrop, we define ‘competitiveness’ as the demonstrated ability to attract capital,
businesses, talent and visitors. We assessed 120 cities across the world and examined 31 indicators for each city. Indicators were grouped under eight distinct, thematic categories: economic strength, human capital, institutional effectiveness, financial maturity, global appeal, physical capital, environment and natural hazards, and social and cultural character. There are 21 qualitative and 10 quantitative indicators.
A city’s overall ranking in the benchmark Index is a weighted score of the underlying categories. For a full breakdown of the categories, individual indicators, weightings and data sources, see the appendix.
© The Economist Intelligence Unit Limited 20126
Hot spotsBenchmarking global city competitiveness
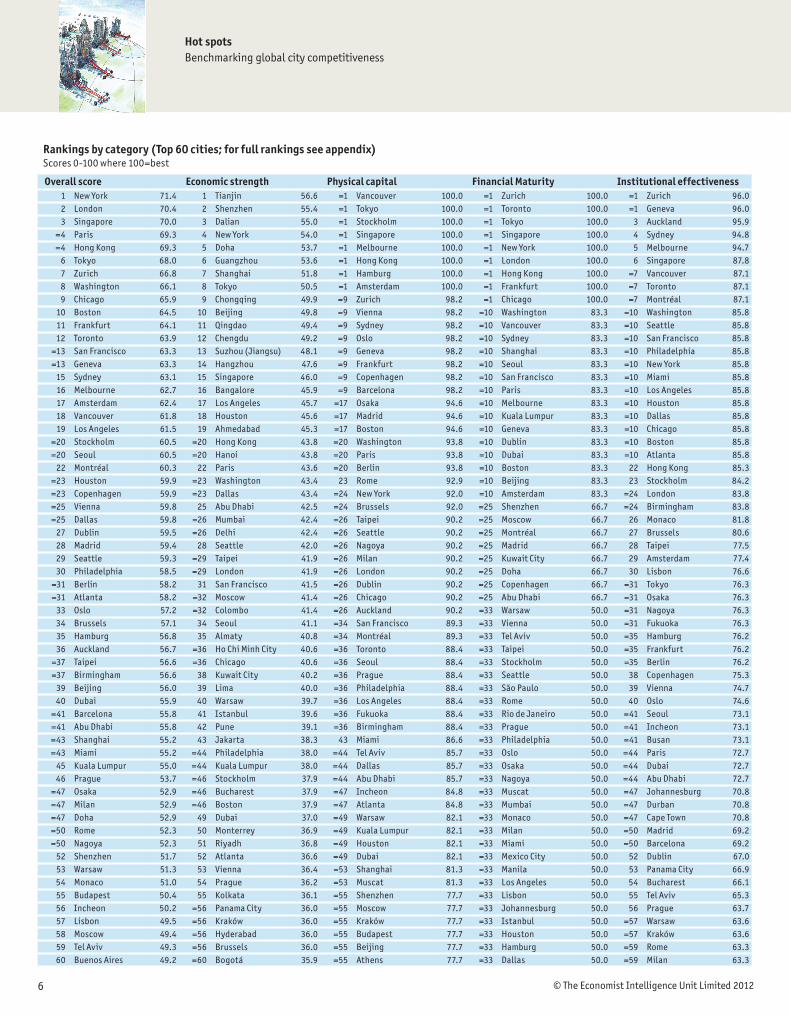
Rankings by category (Top 60 cities; for full rankings see appendix)Scores 0-100 where 100=best
Overall score Economic strength Physical capital Financial Maturity Institutional effectiveness Social and cultural character Human capital Environment and natural hazards Global appeal1 New York 71.4 1 Tianjin 56.6 =1 Vancouver 100.0 =1 Zurich 100.0 =1 Zurich 96.0 1 Zurich 97.5 1 Dublin 82.8 =1 Montréal 100.0 1 London 65.12 London 70.4 2 Shenzhen 55.4 =1 Tokyo 100.0 =1 Toronto 100.0 =1 Geneva 96.0 =2 Sydney 95.0 2 Hong Kong 82.4 =1 Frankfurt 100.0 2 Paris 64.83 Singapore 70.0 3 Dalian 55.0 =1 Stockholm 100.0 =1 Tokyo 100.0 3 Auckland 95.9 =2 New York 95.0 3 Copenhagen 80.2 =1 Budapest 100.0 3 Tokyo 44.4
=4 Paris 69.3 4 New York 54.0 =1 Singapore 100.0 =1 Singapore 100.0 4 Sydney 94.8 =2 Los Angeles 95.0 4 Paris 80.1 =1 Birmingham 100.0 4 Singapore 43.2=4 Hong Kong 69.3 5 Doha 53.7 =1 Melbourne 100.0 =1 New York 100.0 5 Melbourne 94.7 =5 Madrid 92.5 5 Geneva 78.9 5 Milan 95.8 5 Beijing 41.5
6 Tokyo 68.0 6 Guangzhou 53.6 =1 Hong Kong 100.0 =1 London 100.0 6 Singapore 87.8 =5 London 92.5 6 Oslo 78.1 =6 Paris 91.7 6 Hong Kong 37.77 Zurich 66.8 7 Shanghai 51.8 =1 Hamburg 100.0 =1 Hong Kong 100.0 =7 Vancouver 87.1 =5 Frankfurt 92.5 7 Zurich 77.9 =6 Berlin 91.7 7 Amsterdam 36.38 Washington 66.1 8 Tokyo 50.5 =1 Amsterdam 100.0 =1 Frankfurt 100.0 =7 Toronto 87.1 =5 Chicago 92.5 8 Seattle 77.7 =8 Zurich 87.5 8 New York 35.79 Chicago 65.9 9 Chongqing 49.9 =9 Zurich 98.2 =1 Chicago 100.0 =7 Montréal 87.1 =5 Berlin 92.5 =9 Washington 77.6 =8 Vienna 87.5 9 Barcelona 33.8
10 Boston 64.5 10 Beijing 49.8 =9 Vienna 98.2 =10 Washington 83.3 =10 Washington 85.8 =5 Barcelona 92.5 =9 San Francisco 77.6 =8 Singapore 87.5 10 Vienna 33.311 Frankfurt 64.1 11 Qingdao 49.4 =9 Sydney 98.2 =10 Vancouver 83.3 =10 Seattle 85.8 =11 Vienna 90.0 =11 Houston 77.3 =8 Riyadh 87.5 11 Washington 32.712 Toronto 63.9 12 Chengdu 49.2 =9 Oslo 98.2 =10 Sydney 83.3 =10 San Francisco 85.8 =11 Toronto 90.0 =11 Boston 77.3 =8 Pune 87.5 12 Madrid 32.3
=13 San Francisco 63.3 13 Suzhou (Jiangsu) 48.1 =9 Geneva 98.2 =10 Shanghai 83.3 =10 Philadelphia 85.8 =11 Paris 90.0 =11 Atlanta 77.3 =8 Monterrey 87.5 13 Seoul 30.6=13 Geneva 63.3 14 Hangzhou 47.6 =9 Frankfurt 98.2 =10 Seoul 83.3 =10 New York 85.8 =11 Miami 90.0 14 Dallas 77.0 =8 Madrid 87.5 14 Berlin 30.3
15 Sydney 63.1 15 Singapore 46.0 =9 Copenhagen 98.2 =10 San Francisco 83.3 =10 Miami 85.8 =11 Dublin 90.0 15 Los Angeles 76.9 =8 Geneva 87.5 15 Boston 27.216 Melbourne 62.7 16 Bangalore 45.9 =9 Barcelona 98.2 =10 Paris 83.3 =10 Los Angeles 85.8 =16 Vancouver 87.5 16 Philadelphia 76.8 =8 Doha 87.5 16 Toronto 26.817 Amsterdam 62.4 17 Los Angeles 45.7 =17 Osaka 94.6 =10 Melbourne 83.3 =10 Houston 85.8 =16 Prague 87.5 17 Chicago 76.7 =8 Chengdu 87.5 17 Zurich 26.118 Vancouver 61.8 18 Houston 45.6 =17 Madrid 94.6 =10 Kuala Lumpur 83.3 =10 Dallas 85.8 =16 Montréal 87.5 =18 New York 76.5 =8 Bangalore 87.5 18 Sydney 25.519 Los Angeles 61.5 19 Ahmedabad 45.3 =17 Boston 94.6 =10 Geneva 83.3 =10 Chicago 85.8 =16 Melbourne 87.5 =18 Miami 76.5 =19 Vancouver 83.3 =19 Taipei 24.8
=20 Stockholm 60.5 =20 Hong Kong 43.8 =20 Washington 93.8 =10 Dublin 83.3 =10 Boston 85.8 =16 Amsterdam 87.5 20 Auckland 76.4 =19 Stockholm 83.3 =19 Copenhagen 24.8=20 Seoul 60.5 =20 Hanoi 43.8 =20 Paris 93.8 =10 Dubai 83.3 =10 Atlanta 85.8 21 Milan 86.7 21 Vancouver 75.7 =19 Oslo 83.3 21 Brussels 24.7
22 Montréal 60.3 22 Paris 43.6 =20 Berlin 93.8 =10 Boston 83.3 22 Hong Kong 85.3 =22 Washington 85.0 =22 Toronto 75.6 =19 Melbourne 83.3 22 Istanbul 24.1=23 Houston 59.9 =23 Washington 43.4 23 Rome 92.9 =10 Beijing 83.3 23 Stockholm 84.2 =22 Stockholm 85.0 =22 London 75.6 =19 Hamburg 83.3 23 Shanghai 22.6=23 Copenhagen 59.9 =23 Dallas 43.4 =24 New York 92.0 =10 Amsterdam 83.3 =24 London 83.8 =22 San Francisco 85.0 24 Montréal 75.2 =19 Guadalajara 83.3 24 Chicago 22.1=25 Vienna 59.8 25 Abu Dhabi 42.5 =24 Brussels 92.0 =25 Shenzhen 66.7 =24 Birmingham 83.8 =22 Monaco 85.0 25 Birmingham 74.8 =19 Boston 83.3 25 Rome 21.7=25 Dallas 59.8 =26 Mumbai 42.4 =26 Taipei 90.2 =25 Moscow 66.7 26 Monaco 81.8 =22 Geneva 85.0 26 Stockholm 73.2 =19 Belo Horizonte 83.3 26 Stockholm 21.2
27 Dublin 59.5 =26 Delhi 42.4 =26 Seattle 90.2 =25 Montréal 66.7 27 Brussels 80.6 =22 Budapest 85.0 27 Madrid 72.2 =19 Atlanta 83.3 =27 Frankfurt 21.028 Madrid 59.4 28 Seattle 42.0 =26 Nagoya 90.2 =25 Madrid 66.7 28 Taipei 77.5 =28 Tokyo 84.2 28 Amsterdam 71.9 =28 Kuala Lumpur 79.2 =27 Buenos Aires 21.029 Seattle 59.3 =29 Taipei 41.9 =26 Milan 90.2 =25 Kuwait City 66.7 29 Amsterdam 77.4 =28 Seoul 84.2 29 Barcelona 71.6 =28 Jakarta 79.2 29 Dublin 20.930 Philadelphia 58.5 =29 London 41.9 =26 London 90.2 =25 Doha 66.7 30 Lisbon 76.6 =28 Rome 84.2 30 Vienna 71.3 =28 Hyderabad 79.2 30 Los Angeles 20.5
=31 Berlin 58.2 31 San Francisco 41.5 =26 Dublin 90.2 =25 Copenhagen 66.7 =31 Tokyo 76.3 =31 Seattle 82.5 31 Abu Dhabi 71.2 =28 Dallas 79.2 31 Dubai 20.0=31 Atlanta 58.2 =32 Moscow 41.4 =26 Chicago 90.2 =25 Abu Dhabi 66.7 =31 Osaka 76.3 =31 Philadelphia 82.5 32 Hamburg 70.8 =32 Toronto 75.0 32 Lisbon 19.5
33 Oslo 57.2 =32 Colombo 41.4 =26 Auckland 90.2 =33 Warsaw 50.0 =31 Nagoya 76.3 =31 Houston 82.5 33 Frankfurt 70.5 =32 Sydney 75.0 =33 Prague 18.934 Brussels 57.1 34 Seoul 41.1 =34 San Francisco 89.3 =33 Vienna 50.0 =31 Fukuoka 76.3 =31 Dallas 82.5 34 Berlin 70.3 =32 Prague 75.0 =33 Melbourne 18.935 Hamburg 56.8 35 Almaty 40.8 =34 Montréal 89.3 =33 Tel Aviv 50.0 =35 Hamburg 76.2 =31 Copenhagen 82.5 35 Santiago 70.1 =32 Moscow 75.0 35 Kuala Lumpur 18.136 Auckland 56.7 =36 Ho Chi Minh City 40.6 =36 Toronto 88.4 =33 Taipei 50.0 =35 Frankfurt 76.2 36 Athens 81.7 36 Singapore 69.8 =32 Monaco 75.0 36 Budapest 17.7
=37 Taipei 56.6 =36 Chicago 40.6 =36 Seoul 88.4 =33 Stockholm 50.0 =35 Berlin 76.2 =37 Hamburg 80.0 37 Dubai 69.1 =32 London 75.0 37 Montréal 17.5=37 Birmingham 56.6 38 Kuwait City 40.2 =36 Prague 88.4 =33 Seattle 50.0 38 Copenhagen 75.3 =37 Brussels 80.0 38 Melbourne 68.9 =32 Guangzhou 75.0 =38 São Paulo 16.6
39 Beijing 56.0 39 Lima 40.0 =36 Philadelphia 88.4 =33 São Paulo 50.0 39 Vienna 74.7 =37 Boston 80.0 39 Sydney 68.7 =32 Dublin 75.0 =38 Bangkok 16.640 Dubai 55.9 40 Warsaw 39.7 =36 Los Angeles 88.4 =33 Rome 50.0 40 Oslo 74.6 =37 Atlanta 80.0 40 Cape Town 67.9 =32 Copenhagen 75.0 40 Moscow 16.2
=41 Barcelona 55.8 41 Istanbul 39.6 =36 Fukuoka 88.4 =33 Rio de Janeiro 50.0 =41 Seoul 73.1 41 Hong Kong 79.2 41 Athens 67.8 =32 Auckland 75.0 41 Mexico City 15.5=41 Abu Dhabi 55.8 42 Pune 39.1 =36 Birmingham 88.4 =33 Prague 50.0 =41 Incheon 73.1 =42 Singapore 77.5 42 Bangkok 66.7 =32 Abu Dhabi 75.0 42 Milan 15.4=43 Shanghai 55.2 43 Jakarta 38.3 43 Miami 86.6 =33 Philadelphia 50.0 =41 Busan 73.1 =42 Lisbon 77.5 =43 Buenos Aires 66.6 =43 Warsaw 70.8 =43 Vancouver 15.3=43 Miami 55.2 =44 Philadelphia 38.0 =44 Tel Aviv 85.7 =33 Oslo 50.0 =44 Paris 72.7 =42 Kraków 77.5 =43 Brussels 66.6 =43 Suzhou (Jiangsu) 70.8 =43 San Francisco 15.3
45 Kuala Lumpur 55.0 =44 Kuala Lumpur 38.0 =44 Dallas 85.7 =33 Osaka 50.0 =44 Dubai 72.7 =45 Oslo 75.0 45 Taipei 66.1 =43 Seoul 70.8 45 Geneva 15.246 Prague 53.7 =46 Stockholm 37.9 =44 Abu Dhabi 85.7 =33 Nagoya 50.0 =44 Abu Dhabi 72.7 =45 Auckland 75.0 46 Kuala Lumpur 65.9 =43 Rome 70.8 46 Athens 14.0
=47 Osaka 52.9 =46 Bucharest 37.9 =47 Incheon 84.8 =33 Muscat 50.0 =47 Johannesburg 70.8 =47 São Paulo 74.2 47 Shenzhen 65.7 =43 Porto Alegre 70.8 47 Oslo 13.9=47 Milan 52.9 =46 Boston 37.9 =47 Atlanta 84.8 =33 Mumbai 50.0 =47 Durban 70.8 =47 Rio de Janeiro 74.2 =48 Rome 65.3 =43 Philadelphia 70.8 48 Delhi 12.0=47 Doha 52.9 49 Dubai 37.0 =49 Warsaw 82.1 =33 Monaco 50.0 =47 Cape Town 70.8 =47 Nagoya 74.2 =48 Milan 65.3 =43 Kiev 70.8 49 Rio de Janeiro 11.9=50 Rome 52.3 50 Monterrey 36.9 =49 Kuala Lumpur 82.1 =33 Milan 50.0 =50 Madrid 69.2 =47 Busan 74.2 50 Nairobi 65.0 =43 Incheon 70.8 =50 Santiago 11.7=50 Nagoya 52.3 51 Riyadh 36.8 =49 Houston 82.1 =33 Miami 50.0 =50 Barcelona 69.2 51 Warsaw 72.5 51 Delhi 64.8 =43 Houston 70.8 =50 Philadelphia 11.7
52 Shenzhen 51.7 52 Atlanta 36.6 =49 Dubai 82.1 =33 Mexico City 50.0 52 Dublin 67.0 =52 Osaka 71.7 52 Mexico City 64.6 =43 Durban 70.8 52 Osaka 11.453 Warsaw 51.3 53 Vienna 36.4 =53 Shanghai 81.3 =33 Manila 50.0 53 Panama City 66.9 =52 Incheon 71.7 =53 Johannesburg 64.3 =43 Chicago 70.8 53 Atlanta 11.054 Monaco 51.0 54 Prague 36.2 =53 Muscat 81.3 =33 Los Angeles 50.0 54 Bucharest 66.1 54 Birmingham 70.0 =53 Doha 64.3 =43 Brussels 70.8 54 Warsaw 10.355 Budapest 50.4 55 Kolkata 36.1 =55 Shenzhen 77.7 =33 Lisbon 50.0 55 Tel Aviv 65.3 55 Istanbul 68.3 55 Lima 64.2 =43 Barcelona 70.8 55 Lima 10.256 Incheon 50.2 =56 Panama City 36.0 =55 Moscow 77.7 =33 Johannesburg 50.0 56 Prague 63.7 56 Bangkok 67.5 =56 Tokyo 64.1 =43 Ankara 70.8 56 Incheon 9.857 Lisbon 49.5 =56 Kraków 36.0 =55 Kraków 77.7 =33 Istanbul 50.0 =57 Warsaw 63.6 =57 Tel Aviv 66.7 =56 Beijing 64.1 =43 Amsterdam 70.8 =57 Miami 9.358 Moscow 49.4 =56 Hyderabad 36.0 =55 Budapest 77.7 =33 Houston 50.0 =57 Kraków 63.6 =57 Fukuoka 66.7 58 Lisbon 64.0 =43 Almaty 70.8 =57 Bogotá 9.359 Tel Aviv 49.3 =56 Brussels 36.0 =55 Beijing 77.7 =33 Hamburg 50.0 =59 Rome 63.3 =57 Buenos Aires 66.7 59 Tel Aviv 63.8 =59 Washington 66.7 =59 Seattle 9.260 Buenos Aires 49.2 =60 Bogotá 35.9 =55 Athens 77.7 =33 Dallas 50.0 =59 Milan 63.3 60 Manila 65.8 =60 Shanghai 63.7 =59 Tel Aviv 66.7 =59 Birmingham 9.2

© The Economist Intelligence Unit Limited 2012 7
Hot spotsBenchmarking global city competitiveness
Rankings by category (Top 60 cities; for full rankings see appendix)Scores 0-100 where 100=best
Overall score Economic strength Physical capital Financial Maturity Institutional effectiveness Social and cultural character Human capital Environment and natural hazards Global appeal1 New York 71.4 1 Tianjin 56.6 =1 Vancouver 100.0 =1 Zurich 100.0 =1 Zurich 96.0 1 Zurich 97.5 1 Dublin 82.8 =1 Montréal 100.0 1 London 65.12 London 70.4 2 Shenzhen 55.4 =1 Tokyo 100.0 =1 Toronto 100.0 =1 Geneva 96.0 =2 Sydney 95.0 2 Hong Kong 82.4 =1 Frankfurt 100.0 2 Paris 64.83 Singapore 70.0 3 Dalian 55.0 =1 Stockholm 100.0 =1 Tokyo 100.0 3 Auckland 95.9 =2 New York 95.0 3 Copenhagen 80.2 =1 Budapest 100.0 3 Tokyo 44.4
=4 Paris 69.3 4 New York 54.0 =1 Singapore 100.0 =1 Singapore 100.0 4 Sydney 94.8 =2 Los Angeles 95.0 4 Paris 80.1 =1 Birmingham 100.0 4 Singapore 43.2=4 Hong Kong 69.3 5 Doha 53.7 =1 Melbourne 100.0 =1 New York 100.0 5 Melbourne 94.7 =5 Madrid 92.5 5 Geneva 78.9 5 Milan 95.8 5 Beijing 41.5
6 Tokyo 68.0 6 Guangzhou 53.6 =1 Hong Kong 100.0 =1 London 100.0 6 Singapore 87.8 =5 London 92.5 6 Oslo 78.1 =6 Paris 91.7 6 Hong Kong 37.77 Zurich 66.8 7 Shanghai 51.8 =1 Hamburg 100.0 =1 Hong Kong 100.0 =7 Vancouver 87.1 =5 Frankfurt 92.5 7 Zurich 77.9 =6 Berlin 91.7 7 Amsterdam 36.38 Washington 66.1 8 Tokyo 50.5 =1 Amsterdam 100.0 =1 Frankfurt 100.0 =7 Toronto 87.1 =5 Chicago 92.5 8 Seattle 77.7 =8 Zurich 87.5 8 New York 35.79 Chicago 65.9 9 Chongqing 49.9 =9 Zurich 98.2 =1 Chicago 100.0 =7 Montréal 87.1 =5 Berlin 92.5 =9 Washington 77.6 =8 Vienna 87.5 9 Barcelona 33.8
10 Boston 64.5 10 Beijing 49.8 =9 Vienna 98.2 =10 Washington 83.3 =10 Washington 85.8 =5 Barcelona 92.5 =9 San Francisco 77.6 =8 Singapore 87.5 10 Vienna 33.311 Frankfurt 64.1 11 Qingdao 49.4 =9 Sydney 98.2 =10 Vancouver 83.3 =10 Seattle 85.8 =11 Vienna 90.0 =11 Houston 77.3 =8 Riyadh 87.5 11 Washington 32.712 Toronto 63.9 12 Chengdu 49.2 =9 Oslo 98.2 =10 Sydney 83.3 =10 San Francisco 85.8 =11 Toronto 90.0 =11 Boston 77.3 =8 Pune 87.5 12 Madrid 32.3
=13 San Francisco 63.3 13 Suzhou (Jiangsu) 48.1 =9 Geneva 98.2 =10 Shanghai 83.3 =10 Philadelphia 85.8 =11 Paris 90.0 =11 Atlanta 77.3 =8 Monterrey 87.5 13 Seoul 30.6=13 Geneva 63.3 14 Hangzhou 47.6 =9 Frankfurt 98.2 =10 Seoul 83.3 =10 New York 85.8 =11 Miami 90.0 14 Dallas 77.0 =8 Madrid 87.5 14 Berlin 30.3
15 Sydney 63.1 15 Singapore 46.0 =9 Copenhagen 98.2 =10 San Francisco 83.3 =10 Miami 85.8 =11 Dublin 90.0 15 Los Angeles 76.9 =8 Geneva 87.5 15 Boston 27.216 Melbourne 62.7 16 Bangalore 45.9 =9 Barcelona 98.2 =10 Paris 83.3 =10 Los Angeles 85.8 =16 Vancouver 87.5 16 Philadelphia 76.8 =8 Doha 87.5 16 Toronto 26.817 Amsterdam 62.4 17 Los Angeles 45.7 =17 Osaka 94.6 =10 Melbourne 83.3 =10 Houston 85.8 =16 Prague 87.5 17 Chicago 76.7 =8 Chengdu 87.5 17 Zurich 26.118 Vancouver 61.8 18 Houston 45.6 =17 Madrid 94.6 =10 Kuala Lumpur 83.3 =10 Dallas 85.8 =16 Montréal 87.5 =18 New York 76.5 =8 Bangalore 87.5 18 Sydney 25.519 Los Angeles 61.5 19 Ahmedabad 45.3 =17 Boston 94.6 =10 Geneva 83.3 =10 Chicago 85.8 =16 Melbourne 87.5 =18 Miami 76.5 =19 Vancouver 83.3 =19 Taipei 24.8
=20 Stockholm 60.5 =20 Hong Kong 43.8 =20 Washington 93.8 =10 Dublin 83.3 =10 Boston 85.8 =16 Amsterdam 87.5 20 Auckland 76.4 =19 Stockholm 83.3 =19 Copenhagen 24.8=20 Seoul 60.5 =20 Hanoi 43.8 =20 Paris 93.8 =10 Dubai 83.3 =10 Atlanta 85.8 21 Milan 86.7 21 Vancouver 75.7 =19 Oslo 83.3 21 Brussels 24.7
22 Montréal 60.3 22 Paris 43.6 =20 Berlin 93.8 =10 Boston 83.3 22 Hong Kong 85.3 =22 Washington 85.0 =22 Toronto 75.6 =19 Melbourne 83.3 22 Istanbul 24.1=23 Houston 59.9 =23 Washington 43.4 23 Rome 92.9 =10 Beijing 83.3 23 Stockholm 84.2 =22 Stockholm 85.0 =22 London 75.6 =19 Hamburg 83.3 23 Shanghai 22.6=23 Copenhagen 59.9 =23 Dallas 43.4 =24 New York 92.0 =10 Amsterdam 83.3 =24 London 83.8 =22 San Francisco 85.0 24 Montréal 75.2 =19 Guadalajara 83.3 24 Chicago 22.1=25 Vienna 59.8 25 Abu Dhabi 42.5 =24 Brussels 92.0 =25 Shenzhen 66.7 =24 Birmingham 83.8 =22 Monaco 85.0 25 Birmingham 74.8 =19 Boston 83.3 25 Rome 21.7=25 Dallas 59.8 =26 Mumbai 42.4 =26 Taipei 90.2 =25 Moscow 66.7 26 Monaco 81.8 =22 Geneva 85.0 26 Stockholm 73.2 =19 Belo Horizonte 83.3 26 Stockholm 21.2
27 Dublin 59.5 =26 Delhi 42.4 =26 Seattle 90.2 =25 Montréal 66.7 27 Brussels 80.6 =22 Budapest 85.0 27 Madrid 72.2 =19 Atlanta 83.3 =27 Frankfurt 21.028 Madrid 59.4 28 Seattle 42.0 =26 Nagoya 90.2 =25 Madrid 66.7 28 Taipei 77.5 =28 Tokyo 84.2 28 Amsterdam 71.9 =28 Kuala Lumpur 79.2 =27 Buenos Aires 21.029 Seattle 59.3 =29 Taipei 41.9 =26 Milan 90.2 =25 Kuwait City 66.7 29 Amsterdam 77.4 =28 Seoul 84.2 29 Barcelona 71.6 =28 Jakarta 79.2 29 Dublin 20.930 Philadelphia 58.5 =29 London 41.9 =26 London 90.2 =25 Doha 66.7 30 Lisbon 76.6 =28 Rome 84.2 30 Vienna 71.3 =28 Hyderabad 79.2 30 Los Angeles 20.5
=31 Berlin 58.2 31 San Francisco 41.5 =26 Dublin 90.2 =25 Copenhagen 66.7 =31 Tokyo 76.3 =31 Seattle 82.5 31 Abu Dhabi 71.2 =28 Dallas 79.2 31 Dubai 20.0=31 Atlanta 58.2 =32 Moscow 41.4 =26 Chicago 90.2 =25 Abu Dhabi 66.7 =31 Osaka 76.3 =31 Philadelphia 82.5 32 Hamburg 70.8 =32 Toronto 75.0 32 Lisbon 19.5
33 Oslo 57.2 =32 Colombo 41.4 =26 Auckland 90.2 =33 Warsaw 50.0 =31 Nagoya 76.3 =31 Houston 82.5 33 Frankfurt 70.5 =32 Sydney 75.0 =33 Prague 18.934 Brussels 57.1 34 Seoul 41.1 =34 San Francisco 89.3 =33 Vienna 50.0 =31 Fukuoka 76.3 =31 Dallas 82.5 34 Berlin 70.3 =32 Prague 75.0 =33 Melbourne 18.935 Hamburg 56.8 35 Almaty 40.8 =34 Montréal 89.3 =33 Tel Aviv 50.0 =35 Hamburg 76.2 =31 Copenhagen 82.5 35 Santiago 70.1 =32 Moscow 75.0 35 Kuala Lumpur 18.136 Auckland 56.7 =36 Ho Chi Minh City 40.6 =36 Toronto 88.4 =33 Taipei 50.0 =35 Frankfurt 76.2 36 Athens 81.7 36 Singapore 69.8 =32 Monaco 75.0 36 Budapest 17.7
=37 Taipei 56.6 =36 Chicago 40.6 =36 Seoul 88.4 =33 Stockholm 50.0 =35 Berlin 76.2 =37 Hamburg 80.0 37 Dubai 69.1 =32 London 75.0 37 Montréal 17.5=37 Birmingham 56.6 38 Kuwait City 40.2 =36 Prague 88.4 =33 Seattle 50.0 38 Copenhagen 75.3 =37 Brussels 80.0 38 Melbourne 68.9 =32 Guangzhou 75.0 =38 São Paulo 16.6
39 Beijing 56.0 39 Lima 40.0 =36 Philadelphia 88.4 =33 São Paulo 50.0 39 Vienna 74.7 =37 Boston 80.0 39 Sydney 68.7 =32 Dublin 75.0 =38 Bangkok 16.640 Dubai 55.9 40 Warsaw 39.7 =36 Los Angeles 88.4 =33 Rome 50.0 40 Oslo 74.6 =37 Atlanta 80.0 40 Cape Town 67.9 =32 Copenhagen 75.0 40 Moscow 16.2
=41 Barcelona 55.8 41 Istanbul 39.6 =36 Fukuoka 88.4 =33 Rio de Janeiro 50.0 =41 Seoul 73.1 41 Hong Kong 79.2 41 Athens 67.8 =32 Auckland 75.0 41 Mexico City 15.5=41 Abu Dhabi 55.8 42 Pune 39.1 =36 Birmingham 88.4 =33 Prague 50.0 =41 Incheon 73.1 =42 Singapore 77.5 42 Bangkok 66.7 =32 Abu Dhabi 75.0 42 Milan 15.4=43 Shanghai 55.2 43 Jakarta 38.3 43 Miami 86.6 =33 Philadelphia 50.0 =41 Busan 73.1 =42 Lisbon 77.5 =43 Buenos Aires 66.6 =43 Warsaw 70.8 =43 Vancouver 15.3=43 Miami 55.2 =44 Philadelphia 38.0 =44 Tel Aviv 85.7 =33 Oslo 50.0 =44 Paris 72.7 =42 Kraków 77.5 =43 Brussels 66.6 =43 Suzhou (Jiangsu) 70.8 =43 San Francisco 15.3
45 Kuala Lumpur 55.0 =44 Kuala Lumpur 38.0 =44 Dallas 85.7 =33 Osaka 50.0 =44 Dubai 72.7 =45 Oslo 75.0 45 Taipei 66.1 =43 Seoul 70.8 45 Geneva 15.246 Prague 53.7 =46 Stockholm 37.9 =44 Abu Dhabi 85.7 =33 Nagoya 50.0 =44 Abu Dhabi 72.7 =45 Auckland 75.0 46 Kuala Lumpur 65.9 =43 Rome 70.8 46 Athens 14.0
=47 Osaka 52.9 =46 Bucharest 37.9 =47 Incheon 84.8 =33 Muscat 50.0 =47 Johannesburg 70.8 =47 São Paulo 74.2 47 Shenzhen 65.7 =43 Porto Alegre 70.8 47 Oslo 13.9=47 Milan 52.9 =46 Boston 37.9 =47 Atlanta 84.8 =33 Mumbai 50.0 =47 Durban 70.8 =47 Rio de Janeiro 74.2 =48 Rome 65.3 =43 Philadelphia 70.8 48 Delhi 12.0=47 Doha 52.9 49 Dubai 37.0 =49 Warsaw 82.1 =33 Monaco 50.0 =47 Cape Town 70.8 =47 Nagoya 74.2 =48 Milan 65.3 =43 Kiev 70.8 49 Rio de Janeiro 11.9=50 Rome 52.3 50 Monterrey 36.9 =49 Kuala Lumpur 82.1 =33 Milan 50.0 =50 Madrid 69.2 =47 Busan 74.2 50 Nairobi 65.0 =43 Incheon 70.8 =50 Santiago 11.7=50 Nagoya 52.3 51 Riyadh 36.8 =49 Houston 82.1 =33 Miami 50.0 =50 Barcelona 69.2 51 Warsaw 72.5 51 Delhi 64.8 =43 Houston 70.8 =50 Philadelphia 11.7
52 Shenzhen 51.7 52 Atlanta 36.6 =49 Dubai 82.1 =33 Mexico City 50.0 52 Dublin 67.0 =52 Osaka 71.7 52 Mexico City 64.6 =43 Durban 70.8 52 Osaka 11.453 Warsaw 51.3 53 Vienna 36.4 =53 Shanghai 81.3 =33 Manila 50.0 53 Panama City 66.9 =52 Incheon 71.7 =53 Johannesburg 64.3 =43 Chicago 70.8 53 Atlanta 11.054 Monaco 51.0 54 Prague 36.2 =53 Muscat 81.3 =33 Los Angeles 50.0 54 Bucharest 66.1 54 Birmingham 70.0 =53 Doha 64.3 =43 Brussels 70.8 54 Warsaw 10.355 Budapest 50.4 55 Kolkata 36.1 =55 Shenzhen 77.7 =33 Lisbon 50.0 55 Tel Aviv 65.3 55 Istanbul 68.3 55 Lima 64.2 =43 Barcelona 70.8 55 Lima 10.256 Incheon 50.2 =56 Panama City 36.0 =55 Moscow 77.7 =33 Johannesburg 50.0 56 Prague 63.7 56 Bangkok 67.5 =56 Tokyo 64.1 =43 Ankara 70.8 56 Incheon 9.857 Lisbon 49.5 =56 Kraków 36.0 =55 Kraków 77.7 =33 Istanbul 50.0 =57 Warsaw 63.6 =57 Tel Aviv 66.7 =56 Beijing 64.1 =43 Amsterdam 70.8 =57 Miami 9.358 Moscow 49.4 =56 Hyderabad 36.0 =55 Budapest 77.7 =33 Houston 50.0 =57 Kraków 63.6 =57 Fukuoka 66.7 58 Lisbon 64.0 =43 Almaty 70.8 =57 Bogotá 9.359 Tel Aviv 49.3 =56 Brussels 36.0 =55 Beijing 77.7 =33 Hamburg 50.0 =59 Rome 63.3 =57 Buenos Aires 66.7 59 Tel Aviv 63.8 =59 Washington 66.7 =59 Seattle 9.260 Buenos Aires 49.2 =60 Bogotá 35.9 =55 Athens 77.7 =33 Dallas 50.0 =59 Milan 63.3 60 Manila 65.8 =60 Shanghai 63.7 =59 Tel Aviv 66.7 =59 Birmingham 9.2
© The Economist Intelligence Unit Limited 20128
Hot spotsBenchmarking global city competitiveness
Introduction: Striving for competitiveness
The balance of power between countries and cities is at an interesting juncture today. While global trade and power is usually defined at a country level, cities are increasingly likely to be the focus of
global business in the decade ahead. One obvious driver of this trend is the rapid and sustained rate of global urbanisation, with well over half of the world’s population now living in cities, generating more than 80% of global GDP.
Indeed, the 120 cities assessed in this report account for an outsized proportion of the global economy. With a combined population of about 750m, they generated some US$20.2trn dollars in GDP in 2008 (measured in purchasing power parity), or about 29% of the global total. This gives them a larger contribution to the global economy than the European Union (US$15.5trn), United States (US$14.3trn) or China (US$8.3trn), according to the Economist Intelligence Unit (EIU). In short, cities matter.
Even more compelling is their average real rate of growth: from 2010-16, these 120 cities are forecast to expand by an average of 4.8%, with double-digit rates likely across many Chinese cities in particular. Boston Consulting Group considers the rise of cities, especially in emerging markets, to be the “single largest commercial growth opportunity globally in the decade ahead”.1 Although the average population growth rate across all these cities is low, at just over 1%, this implies that a city around the size of Chengdu (estimated population 8.4m) is added to the collective total each year—the equivalent of some 22,000 new people moving into the city each and every day.
Businesses are taking note. Todd Overmyer, the global head of retail for Triumph, a multi-billion dollar European lingerie brand that already operates in over 120 countries, says his firm views its future expansion through the prism of “strategic countries and then key cities”. The most obvious example is China. Many firms recognise a need to enter this market today, but they then quickly define their strategy according to the key cities that matter most.
In this regard, cities compete with each other in a very material sense. “They have an active role in competing nationally and globally for investment flows. They also compete with other cities for
1 “Winning in emerging market cities”, Boston Consulting Group, Sep 2010

© The Economist Intelligence Unit Limited 2012 9
Hot spotsBenchmarking global city competitiveness
skills and talents that are globally mobile,” explains Javier Sanchez-Reaza, an urban economist at the OECD. Dane Parker, a vice president at Dell, a technology firm, who is responsible for the firm’s global footprint, notes that when assessing where to locate new operations within a country, cities not only compete in terms of their overall availability of talent, potential growth and cost levels, but also in terms of direct and indirect incentives they might offer businesses for relocating there. While this Index does not consider the potential incentives cities might offer, it directly seeks to measure and rank cities by their ability to attract and retain skilled labour, businesses and capital.
Finding a competitive advantageNo city can hold an absolute advantage in every dimension that could matter to a prospective investor. A manufacturer seeking cheap land, good shipping links and a low-cost workforce will inevitably be attracted to a different city than a technology firm seeking highly skilled graduates to develop their next-generation product. Even firms in the same sector, such as consumer goods, will find different cities appealing. Luxury brands, such as Louis Vuitton, will consider the purchasing power of local residents, as well as the city’s relevance to fashion, while a low-cost mobile phone handset maker might focus on raw population growth as a key metric. The appeal of New York and London at the top of the rankings is largely due to their appeal to a wide range of businesses, even though both are regarded as world-beating financial services hubs.
As such, even the most competitive cities in our ranking will be unappealing prospects to certain firms with particular needs. Rather, they are simply the cities that hold the widest appeal to a diverse array of potential needs. For cities seeking to do better at attracting future investment, they need to focus on developing and enhancing their comparative advantage and develop a niche: whether cheap land, a dense consumer populace, a high quality education, a reputation for creativity, or whatever else. This comparative advantage can then help them drive future growth.
Of course, while nearly all cities strive for growth, it is also clear that growth can come in many different forms, which in turn affects a city’s future competitiveness. Kevin Stolarick, research director at the Martin Prosperity Institute, a Canadian think tank that is part of the Rotman School of Management at the University of Toronto, gives the example of two cities in the US. “Some places like Portland, Oregon are fighting tooth and nail to prevent urban sprawl whereas a place like Phoenix, Arizona is doing everything it possibly could to promote growth.”
While Portland has continued to pursue growth, it maintains a tight control on its physical makeup: it wants to be smaller, more easily commutable, and environmentally friendly. This adds to its appeal for the target market it is aiming for—service and knowledge-based firms—even though it would naturally deter other kinds of investors. Such shifts are evident across the world. In Shanghai, for example, policymakers are actively fostering the city as a sophisticated new financial hub, while shifting inland the manufacturers that initially propelled growth there.
Overall, this Index provides a balanced view across eight broad categories that shape competitiveness. No city excels at all of these facets. As a result, a diverse range of cities tops each of the eight specific pillars of competitiveness, from Tianjin (economic strength) and Dublin (human capital) to Zurich (joint first in financial maturity, institutional effectiveness, and social and cultural character),

© The Economist Intelligence Unit Limited 201210
Hot spotsBenchmarking global city competitiveness
and Vancouver (joint first in physical capital). While it is many of the world’s most prominent global cities that rank highest overall—New York, London, Singapore, Paris and Hong Kong—this research highlights the new challengers seeking to compete with them in the decade ahead.
This report reviews the dimensions of this competition. It considers how newly emerging cities compete with more developed cities, not least as the world’s centre of economic gravity shifts eastwards. It reviews where the global centres of growth are likely to be found in coming years and explores the link between talent and competitiveness. Finally, it reviews whether size matters in terms of city competitiveness.
Case study: Singapore—Asia’s most competitive city
Singapore ranks third overall in the Index and is the highest-placed Asian city. The city-state ranks particularly well in terms of its physical capital (ranked joint first overall), financial maturity (joint first), institutional effectiveness (6th), environment and natural hazards (joint 8th) and global appeal (4th). For locals, none of this will be surprising, given the city’s efficient transport, lean bureaucracy, safe and clean environment, and its increasingly highly regarded reputation internationally.
Fundamental to its competitiveness has been its openness to the rest of the world, says Mr Khoo Teng Chye, executive director of Singapore’s Centre for Liveable Cities, a government think tank. “We have always been a hub open to the flow of people, ideas, capital, goods and services,” he says. In particular, he says, the city has always strived to attract both businesses and human capital. It has lured in businesses by, among other things, offering tax incentives and streamlining license approvals.
On the talent front, the city has focussed on what Mr Khoo says are the three aspects of liveability: quality of life (safety, good schools and so on); competitive economy (high quality jobs); and environmental sustainability. Importantly, Singapore emphasised the third element from very early on. “Environmental regulations and enforcement even in the late 1960s were very tough,” says Mr Khoo. Despite being a small, developing economy then, Singapore was ready to turn away industries that could not meet its strict environmental regulations, he says, because it “did not want factories here that would pollute the environment”.
In addition, the city promoted cleanliness through numerous public campaigns as well as concerted clean-up efforts, such as one involving the Singapore River. It also embarked on a systematic tree-planting programme in order to “green” the city. This involved very detailed
regulations that, for instance, specify the ratio of trees to parking spaces in the city.
Mr Khoo contrasts Singapore’s forward-thinking, long-term approach to sustainability with some other cities, which pursue what he calls a “Grow first and clean up later” approach. That is to their detriment, he argues, because “beyond a certain point they realise there is too much pollution, and they end up turning away people and investors.”
Figure 1
Singapore Rank / 120 Score / 100
Overall score 3 70.0
Economic strength 15 46.0
Physical capital =1 100.0
Financial maturity =1 100.0
Institutional effectiveness 6 87.8
Social and cultural character =42 77.5
Human capital 36 69.8
Environment and natural hazards =8 87.5
Global appeal 4 43.2
Source: Economist Intelligence Unit.
0
25
50
75
100
SingaproeAverage
Economic strength
Physical capital
Financial maturity
Institutional effectiveness
Social and cultural character
Human capital
Environment and naturalhazards
Global appeal
© The Economist Intelligence Unit Limited 2012 11
Hot spotsBenchmarking global city competitiveness
Rebalancing West and East: Legacy versus growth
The relative power of cities is something that shifts only gradually. One obvious factor determining the pace of this shift is infrastructure. The core infrastructure that shapes and defines urban landscapes—
metro lines, skyscrapers, stadiums, universities, airports and other physical geology—evolves over decades. Developed markets are, in part, termed as such because they largely have this infrastructure in place. This gives them a huge advantage in terms of their physical assets, when compared to newer cities around the world.
Of course, it is evident to any traveller that this picture is changing quickly: visitors to Beijing’s modern and efficient airport, for example, would compare it favourably to many ageing airports in American cities, including those in New York. Combined with the political rhetoric in many Western cities about their crumbling infrastructure, it would seem that a rebalancing process is underway.
But if such a shift is indeed underway, it is not yet complete. In key metrics such as quality of physical infrastructure and quality of telecommunications infrastructure (which account for the bulk of the physical capital category), developed cities perform better than their counterparts in emerging markets. In other aspects, such as the development of talent, they also clearly outperform the rest of the world (see chapter Talent, jobs and quality of life).
In particular, European cities, from Stockholm and Frankfurt, to Amsterdam, Vienna and Zurich, all rank highly based on their comprehensive public transport systems, well-established utility networks, high quality building stock, and more. Creating this infrastructure has required a lot of time and capital, but it serves to ease the flow of commerce and people—from sending a parcel to a client, to exporting goods to new markets, to enabling staff to easily commute to work.
By contrast, the top-ranked emerging market city in terms of physical infrastructure is Kuala Lumpur, in joint 49th position. In short, from a physical perspective, a long history of investment matters.
Even though physical capital is weighted to account for just 10% of any given city’s overall score,

© The Economist Intelligence Unit Limited 201212
Hot spotsBenchmarking global city competitiveness
there is a clear correlation between overall city competitiveness and physical capital (see figure 2). This suggests that physical capital is a prerequisite for competitiveness—good infrastructure that undergirds a city probably boosts all its other scores.
However, it is clear to any business leader seeking growth that the tectonic plates of global economic development are shifting. In terms of economic competitiveness, the weight of power is moving rapidly eastwards, as high growth Asian economies jostle to compete with their more developed rivals.
The fastest growing West European city is forecast to be Stockholm, expanding by an average of 3.2% over 2010-2016; all others will grow by less than 3% per annum over that period and many by far less, with the economies of Athens and Lisbon expected to contract. Some American cities, such as Dallas, Houston and Seattle, expect to do better, growing at over 4%.
But growth rates in Asia put this all in stark relief: 12 cities in that region expect to expand by more than 10% per annum over that period, with Chinese cities dominating the list. Thirty-two of the 44 Asian cities ranked are forecast to expand by 5% or more. The only Asian cities expanding at
European rates of growth are those in already developed Australia or Japan.In turn, this economic boom is altering the landscape of leading cities more rapidly than at any
point in human history. In an unprecedentedly short space of time, cities such as Dubai, Shanghai and Shenzhen have carved out a new physical identity to match their rapid economic emergence. China’s investment in urban infrastructure increased at some 20% year-on-year over the last decade, building out roads, bridges, mass transit systems, utilities and so on.2 This isn’t expected to slow: in its 2011-15 economic plan, the country’s leadership allocated a further US$1trn towards urban infrastructure.
By contrast, many developed world cities are grappling with sizeable budget deficits, with a growing number at risk of defaulting, putting cutbacks, rather than growth and development, on top of their agenda. Johannes Schmidt, the CEO for project and structured finance in the Infrastructure & Cities and Industry unit at Siemens, a conglomerate, highlights how infrastructure projects in Europe and the US have been cut back, while those in Asia continue apace. “Asian cities continue growing very strongly in terms of the projects started. In Europe, by contrast, there’s been a drastic reduction from the highs of 2007-08,” he says. In particular, some renewable energy-related projects in Europe have been cancelled, following reductions in government subsidies and feed-in tariffs in the face of public debt constraints. Similarly, he notes that infrastructure projects in the US have gone “fairly flat”. However, energy and
Muscat
0
20
40
60
80
100
120
0 10 20 30 40 50 60 70 80
Phys
ical
cap
ital
Overall score
Figure 2: Overall competitiveness versus physical capitalCalculated score 0-100 (100=best)
Correlation (X, Y)
Source: Economist Intelligence Unit
2 “Preparing for China’s urban billion”, McKinsey Global Institute, Feb 2009
© The Economist Intelligence Unit Limited 2012 13
Hot spotsBenchmarking global city competitiveness
water projects remain key priorities across Asia.
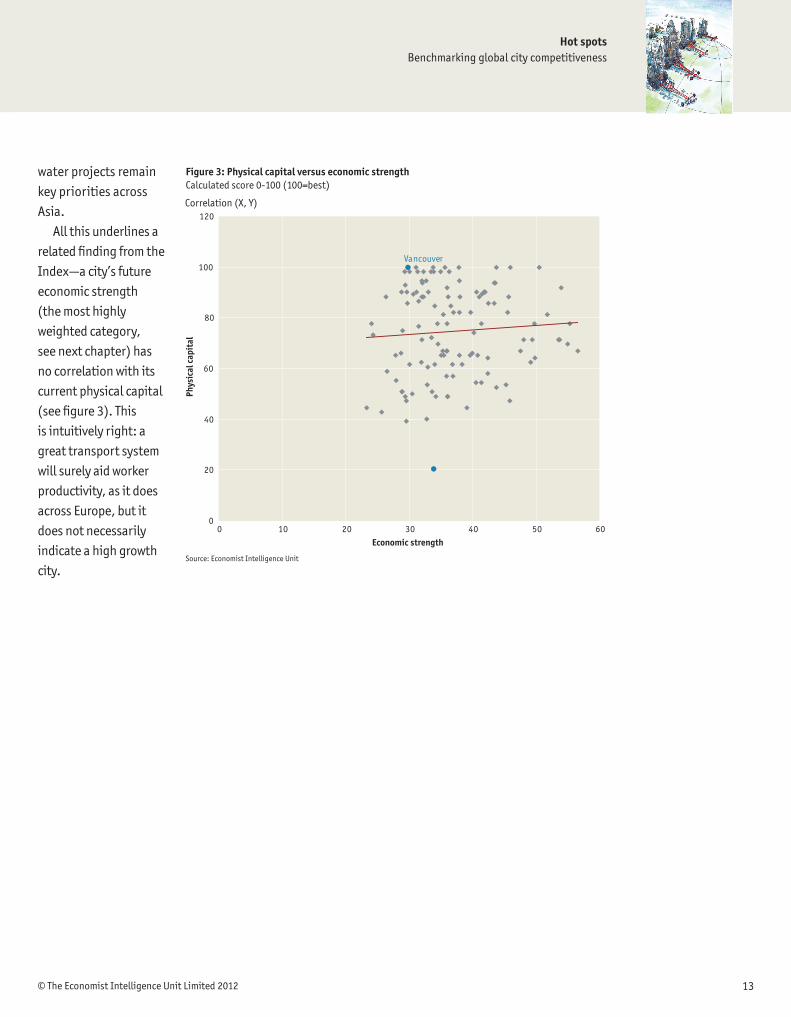
All this underlines a related finding from the Index—a city’s future economic strength (the most highly weighted category, see next chapter) has no correlation with its current physical capital (see figure 3). This is intuitively right: a great transport system will surely aid worker productivity, as it does across Europe, but it does not necessarily indicate a high growth city.
Figure 3: Physical capital versus economic strengthCalculated score 0-100 (100=best)
Correlation (X, Y)
Source: Economist Intelligence Unit
Vancouver
0
20
40
60
80
100
120
0 10 20 30 40 50 60
Phys
ical
cap
ital
Economic strength

© The Economist Intelligence Unit Limited 201214
Hot spotsBenchmarking global city competitiveness
Case study: Wipro—From East to West to East
India’s IT services industry has grown rapidly over the past decade, as its firms’ operational footprints have expanded across the entire world. Consider Wipro, one of India’s largest IT services firms with fiscal year 2010-11 (April-March) revenues of US$6.9bn.3 Wipro’s IT business today employs some 131,000 people in 55 countries.
Wipro’s IT business has delivery centers in ten Indian cities and in more than 20 cities outside of India. These ‘global delivery centres’ generally serve offshore as well as onsite customers. Wipro categorises a few of these centres as ‘strategic delivery centres’, based on either their importance to Wipro from a business perspective or on their strategic location in relation to a customer’s needs.
“Our choice of city to set up a ‘global delivery centre’ depends on a set of well-articulated parameters that determine its suitability,” emphasises Hariprasad Hegde, global head of operations at Wipro. To vet potential investment locations, Wipro uses a seven-point decision matrix, which broadly analyses the availability and cost of human capital, telecommunication infrastructure, the business environment, business conveniences such as hotels, quality of life, security and political stability.
“Talent availability and geographic proximity to major clients is
important for global delivery centres,” says Mr Hegde. This approach is reflected in its choice of strategic global delivery centres outside India, in places such as Atlanta (USA), Bucharest (Romania), Cebu (The Philippines), Chengdu (China), Curitiba (Brazil), and Monterrey (Mexico).
Before investing in a city, Wipro seeks to better understand, among other things, the potential socio-economic and environmental impacts of its actions. It conducts an analysis of the local economy to forecast how its business operations might generate jobs for the local workforce and contribute to creating a supply ecosystem that further enhances local resources and skills.
Wipro also considers the environmental sustainability of potential investments from a local water, bio-diversity, waste generation, energy, transportation and land use perspective. “A 25,000-person global delivery centre can have a fairly significant impact on its immediate social and ecological environment, something Wipro is extremely sensitive to,” Mr Hegde says.
Despite an expanding global presence, “Wipro’s global IT delivery and employment footprint is likely to be relatively weighted in favour of India and Asia in the mid-term as Wipro’s markets here grow and more cities in this region develop,” says Mr Hegde.
3 Wipro’s IT services business accounted for US$5.2bn of the conglomerate’s total US$6.9bn in revenues in the fiscal year 2010-11.

© The Economist Intelligence Unit Limited 2012 15
Hot spotsBenchmarking global city competitiveness
Beyond the megacities: Tomorrow’s new power brokers?
Considering just the “economic strength” category of the Index—which emphasises a city’s overall GDP, growth rate and relative income, making it the highest weighted competitiveness category
overall at 30%—a wholly different top 10 list emerges. New York (4th) and Tokyo (8th) are the only developed world cities that remain, while Tianjin, Shenzhen and Dalian top the table. Beyond those, Doha, Guangzhou, Shanghai, Chongqing and Beijing round off the leading cities (see figure 4). From an economic perspective, this showcases the reality of the ongoing rise and rapid urbanisation of emerging markets, especially within Asia.
But a more interesting finding that emerges from this ranking is a relative lack of prominence of the world’s so-called megacities, defined here as those with populations of 10m or more. In all, there are 23 such cities within the Index, collectively hosting some 350m people. But only nine of them make the top 30 ranking shown here. This is despite their already outsized economies that give them a built-in advantage; Tokyo and New York, the two largest, both have economies worth in excess of a trillion dollars, for example.
This highlights a key shift that is under way, which is the rise of a second tier of emerging market cities. China already has some 150 cities with at least a million inhabitants; by 2020, analysts expect this number to swell to between 220 and 400 cities, depending on overall growth rates. This will surely propel some hitherto unknown cities onto the world stage. Jaana Remes, a senior fellow at the McKinsey Global Institute, the research arm of consultancy McKinsey & Company, says that cities such as these are likely to account for a rapidly expanding proportion of global growth.
Between now and 2025, according to McKinsey, the proportion of global growth accounted for by developed economies and emerging market megacities will decline from over 70% to about one-third. Meanwhile, almost 40% of growth will come from what McKinsey terms “middleweight” emerging market cities, which have populations between 150,000 and 10m. These cities are expanding rapidly both in

© The Economist Intelligence Unit Limited 201216
Hot spotsBenchmarking global city competitiveness
terms of population and overall GDP.4 “For companies that are seeking to be in those places where both increasingly wealthy consumers, as well as a lot of the investments are going to be, they do need to look beyond the top cities only,” says Ms Remes.
This is not to suggest that the megacities are headed for a period of stagnancy: among the top 30 cities from an economic strength perspective in the Index, the megacities are forecast to expand at a healthy 6.3% over 2010-16. But the middle tier, defined here as those with populations of 2-5m, will outpace that, growing at 8.7% overall.5
Nevertheless, the rise of a new middle tier of cities in the coming decade will require a shift in focus for many corporate leaders, many of whom primarily consider developed economies and emerging market megacities as their key growth targets. “We think this is really the new trend going forward and it’s perhaps the most challenging trend for many of the companies who are looking to position their portfolios for growth,” says Ms Remes.
Naturally, the dynamics of each of these cities will vary widely, as they pursue different growth paths. Equally, the issues that matter to any given business also differ significantly (see the case study on Dell for more). Some cities will become major new sources of consumer demand; others will become new centres of low-cost manufacturing.
China’s Tianjin, for example, is heavily promoting its Eco-City project—a more environmentally friendly city concept—which is being developed with significant investment from Singaporean companies in particular, but also many multinational firms, such as electronics firms Hitachi and Philips. In Qatar’s Doha, by contrast, the emphasis is on economic diversification, with widespread investment in real estate, steel and cement, financial services, and sport—investments which recently
helped the country win the nomination to host the 2022 FIFA World Cup.Many of these cities will invest hundreds of millions of dollars in city infrastructure, thus making
them hugely important targets for infrastructure firms such as GE and Siemens. In recognition of this, Siemens in 2011 set up a dedicated urban infrastructure and services arm, specifically aimed at targeting such opportunities. Highlighting the importance of these new cities, perhaps, it announced that one of its three global centres of competence would be in China. Other firms will surely be following suit.
4 “Urban world: Mapping the economic power of cities”, McKinsey Global Institute, Mar 2011
5 For the purposes of this Index, we have defined “middle tier” cities as those with populations of 2-5m. This is different from McKinsey’s definition of “middleweight” cities, which have populations between 150,000 and 10m
Figure 4: Top 30 cities—economic strength
RankOverall economic
strength score/100*GDP 2010-2016
(% real change p.a.)**
1 Tianjin 56.6 12.9
2 Shenzhen 55.4 11.5
3 Dalian 55.0 12.7
4 New York 54.0 2.4
5 Doha 53.7 8.3
6 Guangzhou 53.6 11.3
7 Shanghai 51.8 9.5
8 Tokyo 50.5 1.7
9 Chongqing 49.9 12.2
10 Beijing 49.8 9.4
11 Qingdao 49.4 11.4
12 Chengdu 49.2 11.7
13 Suzhou (Jiangsu) 48.1 10.5
14 Hangzhou 47.6 10.3
15 Singapore 46.0 5.7
16 Bangalore 45.9 10.3
17 Los Angeles 45.7 2.7
18 Houston 45.6 4.4
19 Ahmedabad 45.3 10.1
=20 Hong Kong 43.8 4.9
=20 Hanoi 43.8 10.2
22 Paris 43.6 2.2
=23 Washington 43.4 3.6
=23 Dallas 43.4 4.1
25 Abu Dhabi 42.5 4.7
=26 Mumbai 42.4 8.4
=26 Delhi 42.4 8.9
28 Seattle 42.0 4.2
=29 Taipei 41.9 5.1
=29 London 41.9 2.7
* The overall economic strength score is comprised of f ive indicators, including real GDP growth. For more information, please see the appendix** Cumulative average annual growth rate
Source: Economist Intelligence Unit
© The Economist Intelligence Unit Limited 2012 17
Hot spotsBenchmarking global city competitiveness
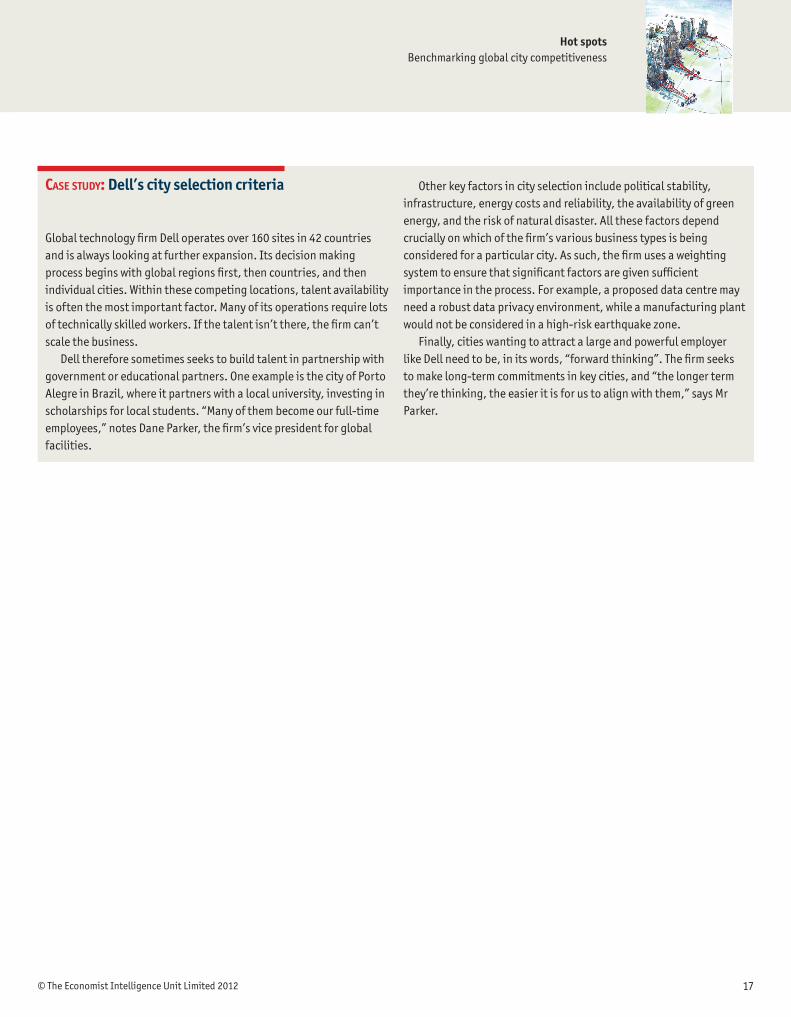
Case study: Dell’s city selection criteria
Global technology firm Dell operates over 160 sites in 42 countries and is always looking at further expansion. Its decision making process begins with global regions first, then countries, and then individual cities. Within these competing locations, talent availability is often the most important factor. Many of its operations require lots of technically skilled workers. If the talent isn’t there, the firm can’t scale the business.
Dell therefore sometimes seeks to build talent in partnership with government or educational partners. One example is the city of Porto Alegre in Brazil, where it partners with a local university, investing in scholarships for local students. “Many of them become our full-time employees,” notes Dane Parker, the firm’s vice president for global facilities.
Other key factors in city selection include political stability, infrastructure, energy costs and reliability, the availability of green energy, and the risk of natural disaster. All these factors depend crucially on which of the firm’s various business types is being considered for a particular city. As such, the firm uses a weighting system to ensure that significant factors are given sufficient importance in the process. For example, a proposed data centre may need a robust data privacy environment, while a manufacturing plant would not be considered in a high-risk earthquake zone.
Finally, cities wanting to attract a large and powerful employer like Dell need to be, in its words, “forward thinking”. The firm seeks to make long-term commitments in key cities, and “the longer term they’re thinking, the easier it is for us to align with them,” says Mr Parker.

© The Economist Intelligence Unit Limited 201218
Hot spotsBenchmarking global city competitiveness
Talent, jobs and quality of life
M any firms fight to attract highly educated and skilled workers, and as such, many choose new cities for growth on the basis of the potential talent pool located there. An ongoing shift towards a more
knowledge-oriented economy is exacerbating this process, meaning that human capital plays a key role in the relative competitiveness of cities. For their part, such workers are attracted to cities that offer them not only good jobs, but also a high standard of living.
Accordingly, the global picture of city competitiveness swings sharply towards developed world cities here. They hold a clear advantage in various factors, such as the quality of both education and healthcare, as well as the relative attractiveness of their environments. Other rankings clearly highlight this. For example, the 2011-12 Times Higher Education ranking of the top 200 universities in the world features none from India and just two from mainland China (albeit with a further four from Hong Kong). By contrast, universities in Europe and the United States dominate the list.
The Index shows a clear correlation between human capital (which accounts for 15% of the overall weighting of the Index) and overall competitiveness (see figure 5), highlighting the importance of talent to city competitiveness. Lamia Kamal-Chaoui, head of the urban development programme at the OECD, cites talent as a key differentiator between many cities in developed and emerging economies, with the former focussing on skills development and the latter on low-cost labour. “In the advanced economies, the availability of skills becomes much more important and the issue of the attractiveness of the location becomes much more important,” she says.
As a result, in the human capital dimension, emerging market cities clearly underperform. The highest placed emerging market city in this category is Santiago (35th), with most others languishing far further down. Changing this will not be easy. Despite huge investments being made in education in particular, such as can be seen in the Middle East over the past decade, building a stock of high quality institutions—and sufficiently compelling environments to attract the highest skilled workers—is a difficult and long-term process. For those Asian cities that are focussed on growth that is oriented

© The Economist Intelligence Unit Limited 2012 19
Hot spotsBenchmarking global city competitiveness
Nairobi
0
10
20
30
40
50
60
70
80
90
0 10 20 30 40 50 60 70 80
Figure 5: Human capital versus overall competitivenessCalculated score 0-100 (100=best)
Correlation (X, Y)
Source: Economist Intelligence Unit
Hum
an c
apit
al
Overall score
towards lower-cost and lower-skilled workers, this is less of a problem right now. However, for those cities seeking to make the leap into the global knowledge economy, this is a clear challenge for the decade ahead.
“The one thing that can stop a city cold in its tracks is not having enough of the right kind of talented people, or not being able to attract those kinds of people,” says Mr Stolarick. Kuala Lumpur is an example of a city whose otherwise strong growth prospects are set back by talent shortages, exacerbated by the steady emigration of skilled locals, many of whom leave for better prospects in Singapore or elsewhere, according to the World Bank.6
However, talented individuals are also typically highly mobile. This brings opportunities and challenges for all cities: on the one hand, cities can thus actively compete to attract highly skilled workers; on the other hand, a city that helps develop a strong pipeline of talent may well see them all leave for other cities once they graduate. Boston and Oxford are both synonymous with higher education, but relatively few graduates stay there after graduating.
In this regard, the current advantage held by developed market cities is potentially under threat, thanks to a shortage of jobs. Unemployment in the US, UK and many European states are at long-term highs, with little sign of relief ahead. Accordingly, while cities such as Vancouver, Vienna and Zurich all vie for the top spots on quality of life rankings, they perform far more poorly in terms of job growth. “Just having great quality of life is not enough. You still have to have things for people to do. If you don’t have work for them, then it doesn’t matter how wonderful your quality of life is, you’re not going to be able to attract people,” says Mr Stolarick.
However, this argument can only be carried so far, as unemployment rates in developed economies are highest among poorly skilled workers, which are typically also the least mobile. Meanwhile, the world’s most upwardly mobile individuals often choose cities such as London and New York as their homes, even if their core businesses are elsewhere. Indian steel magnate Lakshi Mittal may be London’s most famous foreign resident, but there are many others, from Malaysia’s Tony Fernandes, boss of airline AirAsia, to South Africa’s Nathan Kirsh, a property tycoon, who have a home there. Such choices are due to a range of reasons, but the magnetism of these city’s attractions and services, as well as other aspects such as safety and personal freedoms, all help to draw in the world’s talent.
Nevertheless, the greatest question for the decade ahead is where the world’s newly emerging talent will move. Just as America’s cities received a huge talent boost in the wake of the Second World War, so
6 “Malaysia economic monitor: brain drain”, World Bank, Apr 2011

© The Economist Intelligence Unit Limited 201220
Hot spotsBenchmarking global city competitiveness
too might emerging market cities in the wake of today’s ongoing financial crisis in the West. Opportunistic cities are spotting the gap: Dubai, Santiago and Singapore are just three examples
of cities with specific programmes in place to attract talent from elsewhere. Dubai is rapidly building a business friendly, zero tax environment to attract workers; Santiago is helping host a national initiative to directly incentivise hundreds of entrepreneurs from around the world to move there; and Singapore is bolstering its reputation as the gateway to Asia’s growth, with a first-rate living environment to support it. Such cities may have held far less appeal a decade earlier; it’s likely they will hold far more a decade hence. Equally, cities such as New York are hardly standing still in their quest to maintain their appeal to the world’s top talent (see case study).
Case study: New York’s talent as a competitive edge
New York tops our Index as the most competitive city globally, which is perhaps unsurprising given its strong performance across a diverse array of categories. But Michael Bloomberg, its mayor, is particularly focussed on the city’s diversity of career opportunities, excellent quality of life and a job market driven by intellectual capital. “We are the world’s most diverse city, and that diversity breeds new ideas and new innovations,” he says. “And the fact is, talented people want to live in places that not only offer the best career opportunities, but also the best cultural attractions and highest quality of life.”
New York’s economy is driven by a range of sources, from the media, arts and fashion, to technology and finance. This generates a range of opportunities, from entry-level tourism jobs to highly-paid Wall Street careers. In 2010, the city was second only to Silicon Valley as a source of venture capital funding in the US. But supplying the demands of a talent-driven market continues to be a challenge. Overall, its ranking for human capital was one of its lowest performances—at joint 18th. Part of this lies out of the city’s control: Mr Bloomberg cites inflexible federal immigrations policies as a major roadblock for skilled professionals from around the world who want to migrate to the US.
Nevertheless, New York has a range of initiatives underway to help maintain its competitiveness. For example, it is currently creating a new applied science and engineering campus in partnership with Cornell University and The Technion-Israel Institute of Technology, aimed at expanding its capacity in the applied sciences and to attract more scientists and engineers. This is expected to generate
US$6bn in economic activity, draw in over US$1bn in private capital, while creating thousands of temporary and permanent jobs. “[It’s] designed to help us attract even more talent,” says Mr Bloomberg, “and to ensure that more of the companies that grow out of laboratories start right here.”
Figure 6
New York Rank / 120 Score / 100
Overall score 1 71.4
Economic strength 4 54.0
Physical capital =24 92.0
Financial maturity =1 100.0
Institutional effectiveness =10 85.8
Social and cultural character =2 95.0
Human capital 18 76.5
Environment and natural hazards =59 66.7
Global appeal 8 35.7
Source: Economist Intelligence Unit.
0
25
50
75
100
New YorkAverage
Economic strength
Physical capital
Financial maturity
Institutional effectiveness
Social and cultural character
Human capital
Environment and naturalhazards
Global appeal

© The Economist Intelligence Unit Limited 2012 21
Hot spotsBenchmarking global city competitiveness
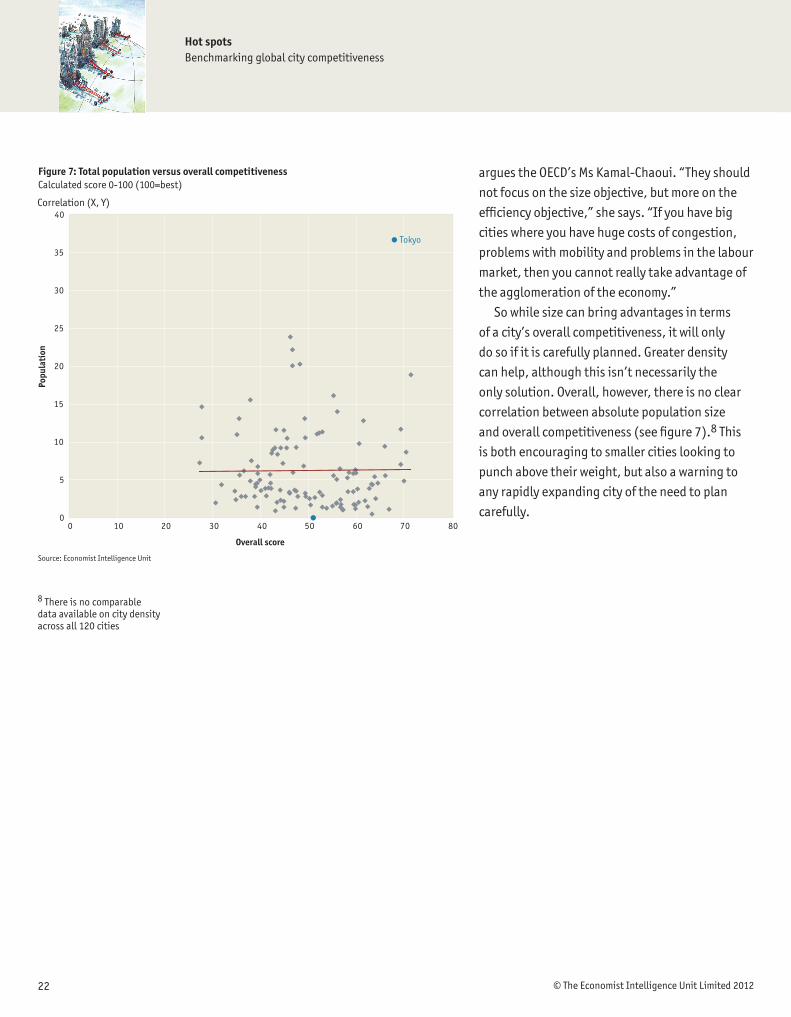
City size, density and competitive performance
The leading urban agglomerations in the Index vary hugely in size. Tokyo is a megacity of nearly 37m people, Singapore has about 5m, while Zurich has just over 1m. Yet they all rank in the top 10 most
competitive cities. So does size matter? In many regards, size does appear to have a significant impact. Firms have a bigger and more diverse
workforce to draw on, as well as greater demand for their products and services. Mr Stolarick at the Martin Prosperity Institute also argues that cities get increasing returns to scale, in terms of patents filed, per capita income and so on. “Size generates tons of advantages, not just economies of scale. As you double in size you more than double other things [such as productivity or patents filed],” he says.
But in many other regards, size can also hinder competitiveness, especially if not properly planned. One obvious example is in transport: while larger cities typically have greater resources to implement public transport networks, they also have a far larger physical space to cover. Sprawling cities with gridlock can impede competitiveness, as can bureaucratic inefficiency and other factors. Accordingly, there can also be diseconomies of scale.
“I think there are many things that can go wrong,” says Ms Remes at the McKinsey Global Institute. She gives the example of many Latin American cities that have expanded rapidly, ahead of the capacity of these cities to adapt and grow. This hampers growth. “Right now the growth rate of the top ten cities in the region has been below the mid-sized cities and in many cases even the economies overall,” she says.
In this regard, efficiency matters. Hong Kong and Mexico City give two clear examples. Both are large cities, of 7m and nearly 24m people, respectively. However, while Hong Kong is highly competitive (joint 4th), Mexico City (71st) is far less so. Here, density helps. Visitors to either city quickly discover this: Hong Kong’s tight density helps ensure that its public transport is both comprehensive and effective, while commuters in Mexico City find themselves locked in traffic with few alternatives.
This example holds more generally: other studies show, for example, that a doubling of density increases a city’s productivity by 2-4%.7 This holds a key lesson for China’s rapidly expanding cities,
7 “Productivity and the density of human capital”, Jaison R. Abel, et al, Federal Reserve Bank of New York Staff Reports, Mar 2010, Revised Sep 2011
© The Economist Intelligence Unit Limited 201222
Hot spotsBenchmarking global city competitiveness
argues the OECD’s Ms Kamal-Chaoui. “They should not focus on the size objective, but more on the efficiency objective,” she says. “If you have big cities where you have huge costs of congestion, problems with mobility and problems in the labour market, then you cannot really take advantage of the agglomeration of the economy.”
So while size can bring advantages in terms of a city’s overall competitiveness, it will only do so if it is carefully planned. Greater density can help, although this isn’t necessarily the only solution. Overall, however, there is no clear correlation between absolute population size and overall competitiveness (see figure 7).8 This is both encouraging to smaller cities looking to punch above their weight, but also a warning to any rapidly expanding city of the need to plan carefully.
8 There is no comparable data available on city density across all 120 cities
Tokyo
0
5
10
15
20
25
30
35
40
0 10 20 30 40 50 60 70 80
Figure 7: Total population versus overall competitivenessCalculated score 0-100 (100=best)
Correlation (X, Y)
Source: Economist Intelligence Unit
Popu
lati
on
Overall score
© The Economist Intelligence Unit Limited 2012 23
Hot spotsBenchmarking global city competitiveness
Conclusion: Leapfrogging ahead?
This study has highlighted several aspects of city competitiveness and how they influence a city’s overall development. The relative positions of these cities will naturally shift over the coming decade,
as they sharpen their various comparative advantages. In particular, the rise of emerging markets will likely make a number of largely unknown cities rather more prominent by 2020. Bandung, Hangzhou, Lagos and Lima, for example, all feature growth rates of 6% or higher, but are familiar to few outside of their home countries today. That will change.
A key question is the speed with which this will happen. Do emerging market cities need to follow the same development lifecycle that Western cities have taken over the past two centuries, moving slowly from an industrial to a post-industrial era? Or can they accelerate through this? Shanghai is already making this evolution in record time. And other cities, particularly within the Gulf, are seeking to leapfrog the industrial phase altogether, using their vast wealth to create cities that can compete on the global stage in various industries. Others aim to leapfrog rivals in specific aspects, such as their communication technologies. For example, some are implementing citywide high-speed wireless networking, entirely bypassing the need to lay cable. This in turn can open up new prospects for various technology firms such as Dell.
The speed question is especially pertinent for the new “middle tier” of emerging market cities, with the highest overall growth rates. Of course, the success of this group isn’t guaranteed. For example, many already have significant levels of pollution, which may increasingly hinder progress as they seek to move up the value chain, especially in terms of attracting more skilled labour. To give one example, the OECD has reviewed five metropolitan regions within China’s Guangdong province, which are seeking to change how they compete. “This region was highly specialised in low value-added activities, but with the emergence of other regions in China which now offer an even cheaper labour force, they have an imperative to move up the value chain,” says Ms Kamal-Chaoui.
To do so, they need to adapt their investment attraction policies, but this in turn requires more
© The Economist Intelligence Unit Limited 201224
Hot spotsBenchmarking global city competitiveness
fundamental shifts. “They understand they have to change, [beyond just investing in infrastructure],” says Ms Kamal-Chaoui. “They have a good stock of infrastructure, but it’s highly polluted and there are no public spaces and things like this. They now understand that they have to move to something more qualitative.”
To truly become globally competitive, these cities will need to work hard to develop softer aspects beyond just growth: their institutional effectiveness, social character, financial maturity and global appeal. Put another way, will these emerging market cities be able to make the leap from attracting just capital to attracting talent as well?
These cities will be competing not only amongst themselves, but also against cities in the developed world, which have legacy advantages, such as strong educational and infrastructure foundations, built up over decades.
Which emerging market cities will leapfrog their peers? Which developed world cities will be able to maintain their primacy? The decade ahead will offer much guidance to these questions.

© The Economist Intelligence Unit Limited 2012 25
Hot spotsBenchmarking global city competitiveness
OverallEconomic strength
Physical capital
Financial maturity
Institutional effectiveness
Social and cultural character
Human capital
Environment and natural hazards
Global appeal
Category weight 30.0% 10.0% 10.0% 15.0% 5.0% 15.0% 5.0% 10.0%1 New York 71.4 54.0 92.0 100.0 85.8 95.0 76.5 66.7 35.72 London 70.4 41.9 90.2 100.0 83.8 92.5 75.6 75.0 65.13 Singapore 70.0 46.0 100.0 100.0 87.8 77.5 69.8 87.5 43.2
=4 Hong Kong 69.3 43.8 100.0 100.0 85.3 79.2 82.4 66.7 37.7=4 Paris 69.3 43.6 93.8 83.3 72.7 90.0 80.1 91.7 64.8
6 Tokyo 68.0 50.5 100.0 100.0 76.3 84.2 64.1 62.5 44.47 Zurich 66.8 30.1 98.2 100.0 96.0 97.5 77.9 87.5 26.18 Washington 66.1 43.4 93.8 83.3 85.8 85.0 77.6 66.7 32.79 Chicago 65.9 40.6 90.2 100.0 85.8 92.5 76.7 70.8 22.1
10 Boston 64.5 37.9 94.6 83.3 85.8 80.0 77.3 83.3 27.211 Frankfurt 64.1 35.0 98.2 100.0 76.2 92.5 70.5 100.0 21.012 Toronto 63.9 32.3 88.4 100.0 87.1 90.0 75.6 75.0 26.8
=13 Geneva 63.3 29.3 98.2 83.3 96.0 85.0 78.9 87.5 15.2=13 San Francisco 63.3 41.5 89.3 83.3 85.8 85.0 77.6 66.7 15.3
15 Sydney 63.1 31.3 98.2 83.3 94.8 95.0 68.7 75.0 25.516 Melbourne 62.7 31.1 100.0 83.3 94.7 87.5 68.9 83.3 18.917 Amsterdam 62.4 33.8 100.0 83.3 77.4 87.5 71.9 70.8 36.318 Vancouver 61.8 29.9 100.0 83.3 87.1 87.5 75.7 83.3 15.319 Los Angeles 61.5 45.7 88.4 50.0 85.8 95.0 76.9 54.2 20.5
=20 Seoul 60.5 41.1 88.4 83.3 73.1 84.2 61.7 70.8 30.6=20 Stockholm 60.5 37.9 100.0 50.0 84.2 85.0 73.2 83.3 21.2
22 Montréal 60.3 30.7 89.3 66.7 87.1 87.5 75.2 100.0 17.5=23 Copenhagen 59.9 32.3 98.2 66.7 75.3 82.5 80.2 75.0 24.8=23 Houston 59.9 45.6 82.1 50.0 85.8 82.5 77.3 70.8 8.4=25 Dallas 59.8 43.4 85.7 50.0 85.8 82.5 77.0 79.2 7.0=25 Vienna 59.8 36.4 98.2 50.0 74.7 90.0 71.3 87.5 33.3
27 Dublin 59.5 31.2 90.2 83.3 67.0 90.0 82.8 75.0 20.928 Madrid 59.4 32.7 94.6 66.7 69.2 92.5 72.2 87.5 32.329 Seattle 59.3 42.0 90.2 50.0 85.8 82.5 77.7 62.5 9.230 Philadelphia 58.5 38.0 88.4 50.0 85.8 82.5 76.8 70.8 11.7
=31 Atlanta 58.2 36.6 84.8 50.0 85.8 80.0 77.3 83.3 11.0=31 Berlin 58.2 32.1 93.8 50.0 76.2 92.5 70.3 91.7 30.3
33 Oslo 57.2 33.9 98.2 50.0 74.6 75.0 78.1 83.3 13.934 Brussels 57.1 36.0 92.0 50.0 80.6 80.0 66.6 70.8 24.735 Hamburg 56.8 35.7 100.0 50.0 76.2 80.0 70.8 83.3 8.836 Auckland 56.7 28.8 90.2 50.0 95.9 75.0 76.4 75.0 6.5
=37 Birmingham 56.6 32.0 88.4 50.0 83.8 70.0 74.8 100.0 9.2=37 Taipei 56.6 41.9 90.2 50.0 77.5 61.7 66.1 58.3 24.8
39 Beijing 56.0 49.8 77.7 83.3 37.6 53.3 64.1 58.3 41.540 Dubai 55.9 37.0 82.1 83.3 72.7 49.2 69.1 50.0 20.0
=41 Abu Dhabi 55.8 42.5 85.7 66.7 72.7 36.7 71.2 75.0 5.9=41 Barcelona 55.8 33.4 98.2 33.3 69.2 92.5 71.6 70.8 33.8=43 Miami 55.2 31.5 86.6 50.0 85.8 90.0 76.5 45.8 9.3=43 Shanghai 55.2 51.8 81.3 83.3 37.6 53.3 63.7 62.5 22.6
45 Kuala Lumpur 55.0 38.0 82.1 83.3 57.1 57.5 65.9 79.2 18.146 Prague 53.7 36.2 88.4 50.0 63.7 87.5 63.2 75.0 18.9
=47 Doha 52.9 53.7 71.4 66.7 42.9 34.2 64.3 87.5 7.7=47 Milan 52.9 29.7 90.2 50.0 63.3 86.7 65.3 95.8 15.4=47 Osaka 52.9 32.0 94.6 50.0 76.3 71.7 63.3 62.5 11.4=50 Nagoya 52.3 33.0 90.2 50.0 76.3 74.2 63.7 62.5 5.1=50 Rome 52.3 29.4 92.9 50.0 63.3 84.2 65.3 70.8 21.7
52 Shenzhen 51.7 55.4 77.7 66.7 37.6 33.3 65.7 66.7 1.753 Warsaw 51.3 39.7 82.1 50.0 63.6 72.5 56.6 70.8 10.354 Monaco 51.0 33.6 72.3 50.0 81.8 85.0 54.5 75.0 2.555 Budapest 50.4 34.5 77.7 33.3 59.8 85.0 60.0 100.0 17.756 Incheon 50.2 34.1 84.8 33.3 73.1 71.7 60.9 70.8 9.857 Lisbon 49.5 24.3 73.2 50.0 76.6 77.5 64.0 58.3 19.558 Moscow 49.4 41.4 77.7 66.7 34.2 61.7 59.5 75.0 16.259 Tel Aviv 49.3 29.7 85.7 50.0 65.3 66.7 63.8 66.7 8.0
Appendix 1: Index scores by category

© The Economist Intelligence Unit Limited 201226
Hot spotsBenchmarking global city competitiveness
OverallEconomic strength
Physical capital
Financial maturity
Institutional effectiveness
Social and cultural character
Human capital
Environment and natural hazards
Global appeal
60 Buenos Aires 49.2 34.6 69.6 50.0 54.4 66.7 66.6 66.7 21.061 Bangkok 49.0 35.9 67.0 50.0 54.4 67.5 66.7 66.7 16.662 São Paulo 48.3 35.3 67.0 50.0 59.6 74.2 56.8 62.5 16.663 Fukuoka 47.7 26.4 88.4 33.3 76.3 66.7 63.1 62.5 2.6
=64 Busan 47.4 31.5 76.8 33.3 73.1 74.2 58.1 62.5 4.6=64 Guangzhou 47.4 53.6 71.4 33.3 37.6 38.3 61.0 75.0 3.6
66 Kraków 47.3 36.0 77.7 33.3 63.6 77.5 54.2 66.7 5.267 Johannesburg 47.1 28.7 66.1 50.0 70.8 61.7 64.3 54.2 8.5
=68 Delhi 46.7 42.4 64.3 33.3 52.0 50.8 64.8 58.3 12.0=68 Santiago 46.7 32.0 71.4 33.3 63.1 60.0 70.1 50.0 11.7
70 Mumbai 46.6 42.4 58.0 50.0 52.0 58.3 60.4 50.0 8.071 Mexico City 46.2 35.5 65.2 50.0 47.1 55.8 64.6 58.3 15.572 Athens 46.1 24.1 77.7 33.3 60.0 81.7 67.8 62.5 14.073 Cape Town 45.9 30.1 61.6 33.3 70.8 49.2 67.9 66.7 8.374 Istanbul 45.5 39.6 65.2 50.0 49.0 68.3 48.5 33.3 24.175 Tianjin 45.4 56.6 67.0 33.3 37.6 20.8 61.1 50.0 0.8
=76 Bucharest 44.9 37.9 65.2 33.3 66.1 56.7 55.0 41.7 5.7=76 Rio de Janeiro 44.9 27.9 65.2 50.0 59.6 74.2 53.6 62.5 11.9
78 Panama City 44.8 36.0 67.0 33.3 66.9 56.7 52.1 54.2 5.979 Bangalore 44.6 45.9 47.3 33.3 50.1 40.8 57.9 87.5 1.780 Kuwait City 44.2 40.2 74.1 66.7 35.5 29.2 60.0 37.5 3.681 Jakarta 44.1 38.3 61.6 33.3 51.4 40.8 59.0 79.2 5.782 Dalian 44.0 55.0 69.6 16.7 37.6 30.8 61.0 50.0 0.783 Chengdu 43.5 49.2 62.5 16.7 35.8 38.3 60.2 87.5 1.584 Suzhou (Jiangsu) 43.4 48.1 71.4 16.7 37.6 33.3 61.3 70.8 0.985 Manila 43.2 34.0 61.6 50.0 45.6 65.8 56.6 54.2 5.286 Muscat 43.0 35.4 81.3 50.0 39.8 29.2 61.6 45.8 3.087 Chongqing 42.9 49.9 64.3 33.3 37.6 15.8 58.4 58.3 0.988 Lima 42.5 40.0 66.1 16.7 45.2 58.3 64.2 37.5 10.289 Bogotá 42.3 35.9 57.1 33.3 48.4 42.5 61.9 58.3 9.390 Monterrey 42.2 36.9 57.1 16.7 47.0 53.3 63.3 87.5 1.591 Qingdao 42.1 49.4 71.4 16.7 37.6 20.8 59.8 54.2 1.092 Ahmedabad 41.9 45.3 53.6 16.7 52.0 28.3 57.3 66.7 1.493 Hangzhou 41.6 47.6 67.0 16.7 37.6 20.8 61.4 54.2 4.094 Durban 41.2 26.5 58.9 16.7 70.8 36.7 63.5 70.8 1.995 Ankara 40.9 35.1 65.2 33.3 49.0 58.3 43.9 70.8 1.696 Medellín 40.0 33.0 60.7 16.7 50.4 45.0 63.0 58.3 2.297 Pune 39.8 39.1 44.6 16.7 50.1 28.3 57.4 87.5 0.4
=98 Belo Horizonte 39.4 28.9 50.9 16.7 61.5 51.7 52.2 83.3 1.3=98 Hyderabad 39.4 36.0 49.1 16.7 50.1 30.8 58.1 79.2 3.0
=100 Almaty 39.3 40.8 65.2 33.3 29.2 24.2 53.3 70.8 0.8=100 Saint Petersburg 39.3 29.0 75.0 33.3 34.2 61.7 56.1 54.2 4.4=102 Guadalajara 39.0 32.9 53.6 16.7 47.1 38.3 57.8 83.3 2.7=102 Porto Alegre 39.0 28.9 50.9 16.7 63.2 51.7 51.4 70.8 2.2
104 Hanoi 38.8 43.8 52.7 16.7 34.6 21.7 57.4 66.7 4.7105 Chennai 38.1 34.2 49.1 16.7 50.1 30.8 58.0 62.5 3.5
=106 Kolkata 37.8 36.1 49.1 16.7 50.1 40.8 57.8 41.7 1.0=106 Riyadh 37.8 36.8 61.6 33.3 33.9 25.8 41.4 87.5 3.4
108 Kiev 36.8 30.5 50.0 16.7 39.0 49.2 58.6 70.8 3.9109 Ho Chi Minh City 36.5 40.6 54.5 16.7 34.6 21.7 58.1 37.5 3.4110 Surabaya 35.9 28.0 55.4 16.7 51.4 25.8 55.5 58.3 0.6111 Colombo 35.6 41.4 54.5 16.7 36.0 22.5 48.3 37.5 3.8112 Karachi 35.5 32.0 62.5 33.3 37.6 9.2 56.3 33.3 1.0113 Cairo 35.0 33.6 50.9 33.3 28.6 41.7 48.2 41.7 8.1114 Bandung 34.8 29.6 47.3 16.7 51.3 25.8 54.7 41.7 2.5115 Nairobi 34.6 23.3 44.6 33.3 31.2 28.3 65.0 62.5 8.3116 Alexandria 31.8 32.8 40.2 16.7 28.7 41.7 45.7 58.3 1.3117 Beirut 30.6 29.4 49.1 16.7 31.5 40.8 49.2 12.5 4.3118 Dhaka 27.7 33.9 20.5 16.7 41.8 20.0 36.3 16.7 2.5119 Lagos 27.6 29.6 39.3 16.7 23.2 22.5 44.2 33.3 2.8120 Tehran 27.2 25.7 42.9 16.7 21.2 15.8 40.6 66.7 1.3
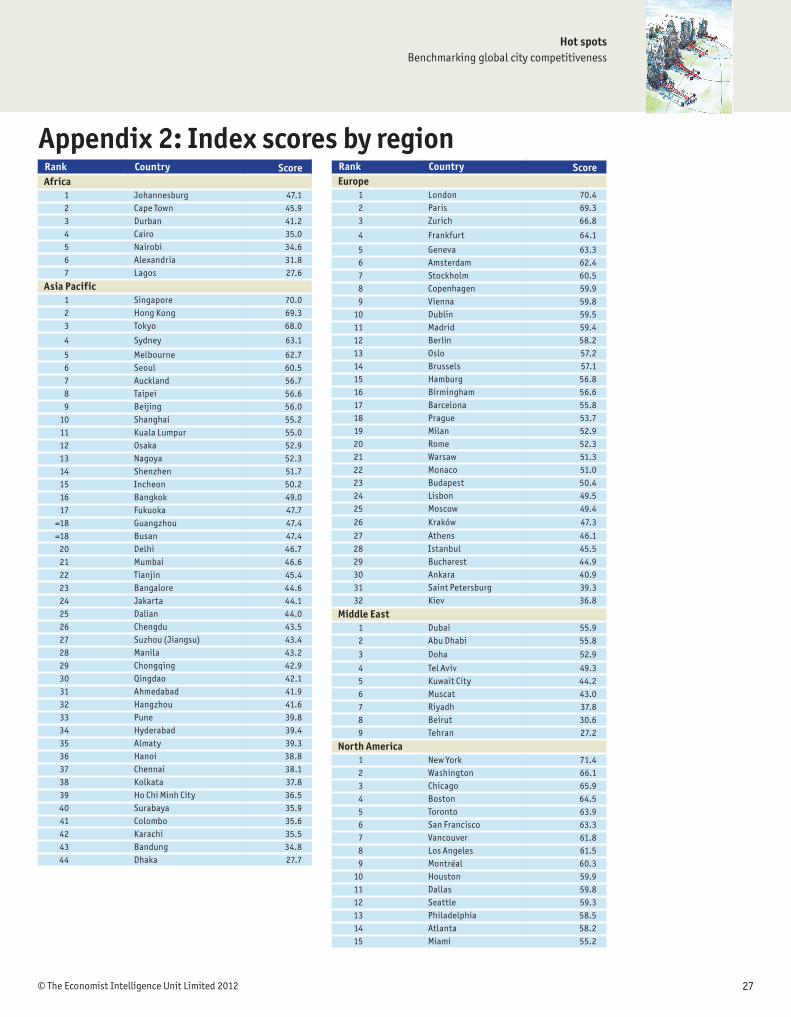
© The Economist Intelligence Unit Limited 2012 27
Hot spotsBenchmarking global city competitiveness
Appendix 2: Index scores by regionRank Country ScoreAfrica
1 Johannesburg 47.12 Cape Town 45.93 Durban 41.24 Cairo 35.05 Nairobi 34.66 Alexandria 31.87 Lagos 27.6
Asia Pacific1 Singapore 70.02 Hong Kong 69.33 Tokyo 68.0
4 Sydney 63.1
5 Melbourne 62.76 Seoul 60.57 Auckland 56.78 Taipei 56.69 Beijing 56.0
10 Shanghai 55.211 Kuala Lumpur 55.012 Osaka 52.913 Nagoya 52.314 Shenzhen 51.715 Incheon 50.216 Bangkok 49.017 Fukuoka 47.7
=18 Guangzhou 47.4=18 Busan 47.4
20 Delhi 46.721 Mumbai 46.622 Tianjin 45.423 Bangalore 44.624 Jakarta 44.125 Dalian 44.026 Chengdu 43.527 Suzhou (Jiangsu) 43.428 Manila 43.229 Chongqing 42.930 Qingdao 42.131 Ahmedabad 41.932 Hangzhou 41.633 Pune 39.834 Hyderabad 39.435 Almaty 39.336 Hanoi 38.837 Chennai 38.138 Kolkata 37.839 Ho Chi Minh City 36.540 Surabaya 35.941 Colombo 35.642 Karachi 35.543 Bandung 34.844 Dhaka 27.7
Rank Country ScoreEurope
1 London 70.42 Paris 69.33 Zurich 66.8
4 Frankfurt 64.1
5 Geneva 63.36 Amsterdam 62.47 Stockholm 60.58 Copenhagen 59.99 Vienna 59.8
10 Dublin 59.511 Madrid 59.412 Berlin 58.213 Oslo 57.214 Brussels 57.115 Hamburg 56.816 Birmingham 56.617 Barcelona 55.818 Prague 53.719 Milan 52.920 Rome 52.321 Warsaw 51.322 Monaco 51.023 Budapest 50.424 Lisbon 49.525 Moscow 49.4
26 Kraków 47.3
27 Athens 46.128 Istanbul 45.529 Bucharest 44.930 Ankara 40.931 Saint Petersburg 39.332 Kiev 36.8
Middle East1 Dubai 55.92 Abu Dhabi 55.8
3 Doha 52.9
4 Tel Aviv 49.35 Kuwait City 44.26 Muscat 43.07 Riyadh 37.88 Beirut 30.69 Tehran 27.2
North America1 New York 71.42 Washington 66.13 Chicago 65.94 Boston 64.55 Toronto 63.96 San Francisco 63.37 Vancouver 61.88 Los Angeles 61.59 Montréal 60.3
10 Houston 59.911 Dallas 59.812 Seattle 59.313 Philadelphia 58.514 Atlanta 58.215 Miami 55.2

© The Economist Intelligence Unit Limited 201228
Hot spotsBenchmarking global city competitiveness
Rank Country ScoreSouth and Central America
1 Buenos Aires 49.22 São Paulo 48.33 Santiago 46.74 Mexico City 46.25 Rio de Janeiro 44.96 Panama City 44.87 Lima 42.58 Bogotá 42.39 Monterrey 42.2
10 Medellín 40.011 Belo Horizonte 39.4
=12 Porto Alegre 39.0=12 Guadalajara 39.0

© The Economist Intelligence Unit Limited 2012 29
Hot spotsBenchmarking global city competitiveness
Appendix 3: Full methodology
OverviewWith more than half of the world’s population now living in urban areas, cities are more important than ever before to economic and social development. As mass urbanisation continues apace across the world, particularly in emerging economies, the influence of cities will keep growing. For most countries, developmental success today hinges on the performance of their biggest cities. However, size alone does not inform a city’s growth potential. While some megacities (such as New York or Tokyo) are immensely influential, there are smaller ones (such as Hong Kong and Singapore) which have established themselves as globally competitive and influential centres in recent years. Emerging-market cities (such as Tianjin or Ahmedabad), on the other hand, are witnessing double-digit economic growth, and have the potential to grow even faster.
Competitiveness, however, is a holistic concept. While economic size and growth are important and necessary, several other factors determine a city’s competitiveness, including its business and regulatory environment, the quality of human capital and cultural aspects. These factors not only help a city sustain high economic growth rate, but also create a stable and harmonised business and social environment.
Against this backdrop, we define ‘competitiveness’ as cities’ demonstrated ability to attract capital, businesses, talent and visitors. We assessed 120 cities across the world and examined 31 indicators for each city. Indicators were grouped under eight distinct, thematic categories: economic strength, human capital, institutional effectiveness, financial maturity, global appeal, physical capital, environment and natural hazards, and social and cultural character. There are 21 qualitative and 10 quantitative indicators.
A city’s overall ranking in the benchmark Index is a weighted score of the underlying categories.

© The Economist Intelligence Unit Limited 201230
Hot spotsBenchmarking global city competitiveness
Definition and selection of citiesCities are no longer limited to their political boundaries today. They are rapidly metamorphosing into bigger urban agglomerations or metropolitan areas, with the city proper at the core. New York City, for example, has a population of only 8.2m, compared to 18.9m people living in the New York-Northern New Jersey-Long Island metropolitan area. Typically, an urban agglomeration or metropolitan area is defined as the continuous area encompassing the city proper and smaller cities or towns close to the city’s boundaries at comparable urban density levels (World Urbanisation Prospects, United Nations, 2009). In the context of this benchmark, we define “city” as the urban agglomeration or metropolitan area it holds together.
The 120 cities included in our assessment were selected on the basis of their size and regional economic importance. Data availability was a consideration too. To build a relevant universe, we first considered all cities with population estimates of over a million in 2010. From this selection, we excluded cities with an estimated nominal GDP of less than US$20bn in 2008 (the most recent year for which comparable data are available). To ensure a balanced regional representation, we established an upper limit on the number of cities for several large economies: China (11 cities), India (8 cities), and the US (12 cities). Finally, the EIU analyst team reviewed the list and included established financial and commercial centres (e.g., Geneva), as well as important emerging cities (Ahmedabad, Ho Chi Minh City, Nairobi, Panama City, etc), which did not meet our initial population-GDP size criteria.
To preserve analytical rigour, we limited our selection to 120 cities for benchmark assessment this year.
Data sources and indicator normalisationThe EIU collected data for the Index from May to August 2011. Wherever possible, publicly-available data from official sources are used for the latest available year. The qualitative indicator scores were informed by publicly available information, and assigned by the EIU’s research team. Qualitative indicators scored by the EIU are often presented on an integer scale of 1-5 (where 1=worst, 5=best). This scale varies for ratings from third party sources.
Indicator scores are normalised and then aggregated across categories to enable an overall comparison. To make data comparable, we normalised the data on the basis of:
Normalised x = (x - Min(x)) / (Max(x) - Min(x))where Min(x) and Max(x) are, respectively, the lowest and highest values in the 120 cities for any
given indicator. The normalised value is then transformed into a positive number on a scale of 0-100. This was similarly done for quantitative indicators where a high value indicates greater competitiveness.
Categories and weightsWe assessed 31 indicators across eight thematic categories: economic strength, human capital, institutional effectiveness, financial maturity, global appeal, physical capital, environment and natural hazards, and social and cultural character. The benchmark includes 21 qualitative and 10 quantitative indicators.
Category and indicator weights were assigned by the EIU research team after consultations with internal and external experts. The economic strength of a city (GDP size, pace of growth, income levels,

© The Economist Intelligence Unit Limited 2012 31
Hot spotsBenchmarking global city competitiveness
etc), undisputedly, is a key driver of attractiveness. Investors follow sizable and growing markets. Therefore, we have given a relatively higher weight (30%) to economic strength category, with city’s real GDP growth rate as the dominant indicator.
Both demographics and institutional underpinnings are important sources of sustained competitiveness. While emerging economies boast of their demographic dividend, a stable institutional environment is often cited as developed markets’ key advantage. Both are important and, therefore, human capital and institutional effectiveness categories carry substantial weights (15% each) in our benchmark assessment. A city’s physical infrastructure, financial maturity and global appeal help businesses operate efficiently. While with the growing use of technology, concerns around accessibility and connectivity are becoming less urgent, these factors remain important in driving a city’s competitiveness. Physical capital, financial maturity and global appeal categories have been assigned a 10% weight each.
Although not a non-negotiable condition for competitiveness, social and cultural character of a city plays an important role in shaping its attractiveness for talent and visitors. This category has been weighted at 5%. With the growing incidence of natural disasters, investors are increasingly building locational risks into their operational strategies. Equally, the environmental quality of cities is increasingly being compared and benchmarked as cities lead the countries’ charge against climate change. Taking note of this trend, our benchmark framework includes environment and natural hazards as a category with a 5% weight.

© The Economist Intelligence Unit Limited 201232
Hot spotsBenchmarking global city competitiveness
Indicator Unit Year Source Weight Description
Economic strength 30.0%
Nominal GDP (PPP) US$ billion 2008 EIU analysis 25.0% Nominal GDP reflecting differences in costs of living
GDP per capita (PPP) US$ 2008 EIU analysis 10.0% Nominal GDP (PPP) per person.
Households with annual consump-tion >US$14,000 (PPP)
Percentage 2010 C-GIDD, EIU analysis 10.0% Proportion of a city's households with annual consumption over US$14,000 (PPP).
City real GDP growth rate CAGR 2010-2016 C-GIDD, EIU analysis 45.0% Cumulative average annual growth rate (CAGR).
Regional market integration EIU rating 2011-2015 EIU analysis 10.0% 5=The country belongs to an economic union. There is freedom of movement for goods, people and capital; 1=Not member of any regional grouping.
Human capital 15.0%
Population growth CAGR 2010-2020 World urbanisation prospects 2009, United Nations; Demographia World Urban Areas, 2011; Country statisti-cal agencies; and EIU estimates
12.5% Cumulative average annual growth of population size.
Working-age population Percentage of total popula-tion
2010 Country statistical offices; EIU analysis
8.3% Working-age population (15-64 years) as a percentage of the total population.
Entrepreneurship and risk-taking mindset
EIU rating 2010 Eurobarometer survey (2009); World Values Survey; Global Entre-preneurship Monitor 2010; BBC World Ser-vice Poll-GlobeScan/PIPA survey; and EIU analysis
25.0% 5=Strong entrepreneurial/risk-taking mindset; 1=Weak entrepreneurial/risk-averse mindset; Ratings are based on fear of failure, entrepreneurship/self-employment as a career choice and entrepreneurial intentions.
Quality of education EIU rating 2010 EIU analysis 33.3% 5=Highest, 1=Lowest; Availability and quality of private education, and general public education indicators.
Quality of healthcare EIU rating 2010 EIU analysis 8.3% 5=Highest, 1=Lowest; Availability and quality of public and private healthcare, and availability of over the counter (OTC) drugs.
Hiring of foreign nationals EIU rating 2011- 2015 EIU analysis 12.5% 5=Very easy; 1=Very difficult. Assessment includes immi-gration barriers, rules on employment of local nationals and other unofficial barriers.
Institutional effectiveness 15.0%
Electoral process and pluralism EIU rating 2010 EIU Democracy Index 2010
14.3% 10=Free and fair electoral process and vibrant pluralism; 1=Limited electoral processes
Local government fiscal autonomy EIU rating 2010 Global Observatory on Local Democracy and Decentralisation, United Cities and Local Governments
28.6% 1=No fiscal autonomy; 2=Some fiscal discretion, but exten-sive controls exist; 3=Fair fiscal independence, but some controls exist; 4=Extensive fiscal autonomy.
Taxation EIU rating 2011 EIU analysis 14.3% 5=Highest, 1=Lowest; Standard VAT rate in the city and the broader complexity of tax regime.
Rule of law World Bank score
2009 World Bank 14.3% 2.5=Very good; -2.5=Very poor; Assessment of confidence in and abide by rules of society.
Government effectiveness EIU rating 2010-2011 Transparency Interna-tional; EIU analysis
28.6% Based on the level of corruption (10=Least corrupt, 0=Most corrupt) measured by Corruption Perceptions Index 2010, Transparency International, and EIU analysis of effective-ness in policy implementation, and quality of bureaucracy (5=Highest, 1=Lowest).
Financial maturity 10.0%
Breadth and depth of the financial cluster
EIU rating 2011 Z/Yen Group's Global Financial Centres Report 2011; EIU analysis
100% 7=Established global cluster which is broad and deep; 1=City is lacking even basic financial infrastructure.
The following table provides a brief description of indicators, data sources and weights:
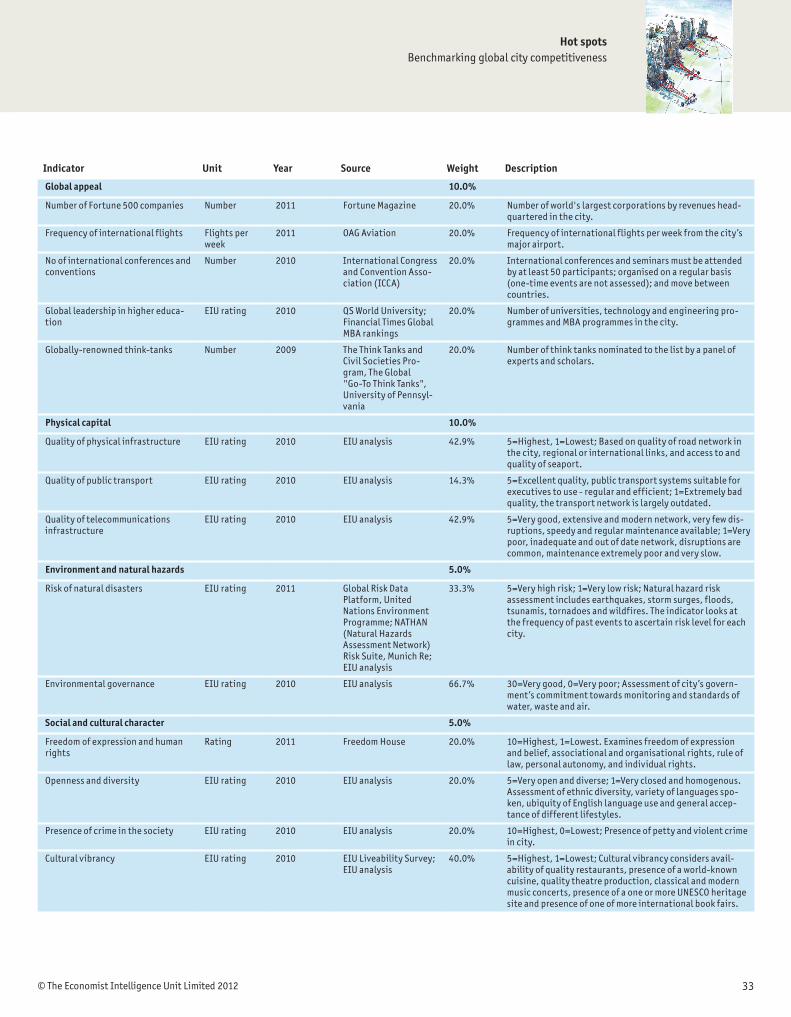
© The Economist Intelligence Unit Limited 2012 33
Hot spotsBenchmarking global city competitiveness
Indicator Unit Year Source Weight Description
Global appeal 10.0%
Number of Fortune 500 companies Number 2011 Fortune Magazine 20.0% Number of world's largest corporations by revenues head-quartered in the city.
Frequency of international flights Flights per week
2011 OAG Aviation 20.0% Frequency of international flights per week from the city’s major airport.
No of international conferences and conventions
Number 2010 International Congress and Convention Asso-ciation (ICCA)
20.0% International conferences and seminars must be attended by at least 50 participants; organised on a regular basis (one-time events are not assessed); and move between countries.
Global leadership in higher educa-tion
EIU rating 2010 QS World University; Financial Times Global MBA rankings
20.0% Number of universities, technology and engineering pro-grammes and MBA programmes in the city.
Globally-renowned think-tanks Number 2009 The Think Tanks and Civil Societies Pro-gram, The Global "Go-To Think Tanks", University of Pennsyl-vania
20.0% Number of think tanks nominated to the list by a panel of experts and scholars.
Physical capital 10.0%
Quality of physical infrastructure EIU rating 2010 EIU analysis 42.9% 5=Highest, 1=Lowest; Based on quality of road network in the city, regional or international links, and access to and quality of seaport.
Quality of public transport EIU rating 2010 EIU analysis 14.3% 5=Excellent quality, public transport systems suitable for executives to use - regular and efficient; 1=Extremely bad quality, the transport network is largely outdated.
Quality of telecommunications infrastructure
EIU rating 2010 EIU analysis 42.9% 5=Very good, extensive and modern network, very few dis-ruptions, speedy and regular maintenance available; 1=Very poor, inadequate and out of date network, disruptions are common, maintenance extremely poor and very slow.
Environment and natural hazards 5.0%
Risk of natural disasters EIU rating 2011 Global Risk Data Platform, United Nations Environment Programme; NATHAN (Natural Hazards Assessment Network) Risk Suite, Munich Re; EIU analysis
33.3% 5=Very high risk; 1=Very low risk; Natural hazard risk assessment includes earthquakes, storm surges, floods, tsunamis, tornadoes and wildfires. The indicator looks at the frequency of past events to ascertain risk level for each city.
Environmental governance EIU rating 2010 EIU analysis 66.7% 30=Very good, 0=Very poor; Assessment of city’s govern-ment’s commitment towards monitoring and standards of water, waste and air.
Social and cultural character 5.0%
Freedom of expression and human rights
Rating 2011 Freedom House 20.0% 10=Highest, 1=Lowest. Examines freedom of expression and belief, associational and organisational rights, rule of law, personal autonomy, and individual rights.
Openness and diversity EIU rating 2010 EIU analysis 20.0% 5=Very open and diverse; 1=Very closed and homogenous. Assessment of ethnic diversity, variety of languages spo-ken, ubiquity of English language use and general accep-tance of different lifestyles.
Presence of crime in the society EIU rating 2010 EIU analysis 20.0% 10=Highest, 0=Lowest; Presence of petty and violent crime in city.
Cultural vibrancy EIU rating 2010 EIU Liveability Survey; EIU analysis
40.0% 5=Highest, 1=Lowest; Cultural vibrancy considers avail-ability of quality restaurants, presence of a world-known cuisine, quality theatre production, classical and modern music concerts, presence of a one or more UNESCO heritage site and presence of one of more international book fairs.

© The Economist Intelligence Unit Limited 201234
Hot spotsBenchmarking global city competitiveness
Economic strength (30%)To gauge the economic strength of cities, we studied indicators that analyse market size, purchasing power and growth prospects. For market size estimates, nominal GDP data in local currency units were collected. We then used International Monetary Fund’s implied purchasing power parity (PPP) conversion rate to calculate nominal GDP (PPP) in US dollars. This allows us to compare the size of city economies, by taking into account the cost of living at the national level.
Another aspect of economic strength, particularly for emerging-market cities, is the size of the middle class, a segment that contributes greatly to economic growth. For the purposes of this study, we define the middle class as households with average annual consumption above US$14,000 (PPP). Finally, to identify and reward cities with robust growth potential, we examine cities’ real GDP growth prospects over the next five years.
In many cases, constrained by the unavailability of credible data, the Economist Intelligence Unit relied on estimates and approximations.
Human capital (15%)A large, skilled, healthy and productive labour force is a key driver of competitiveness, particularly for emerging-market cities with favourable demographics. To study the attractiveness of a city on this dimension, we gathered information on the size of working-age population, quality of education and healthcare. Additionally, we also examined entrepreneurial and risk-taking mindset among citizens, as such attitudes drive new businesses, which in turn create jobs and add to the overall growth. This indicator, however, is not a measure of the environment for entrepreneurship. Finally, we believe the strength of a city’s labour force is not limited to its resident population. Ease of hiring foreign nationals, defined in our study as low immigration barriers and flexible regulations over hiring foreigners, makes a city more attractive to businesses (e.g., Singapore).
Institutional effectiveness (15%)To assess cities’ institutional effectiveness, we examined indicators that encourage stability of regulations, predictability and fairness of political processes and effectiveness of the system. Local government’s fiscal autonomy and government effectiveness were weighted relatively higher within this category. Local governments’ with greater autonomy to raise revenues and invest in the development of the city, like New York, are believed to be more effective in formulating and implementing growth strategies.
Financial maturity (10%)For this category, we evaluated the breadth and depth of the city as a financial cluster. On one extreme,
there are established global clusters (e.g., NY, London, Singapore, etc), which are both broad (diverse) and deep (specialist), covering various industry segments such as asset management, investment banking, insurance, professional services and wealth management. On the other end of the scale are cities which don’t even have adequate transactional financial infrastructure.
Global appeal (10%)We studied the attractiveness of each city by considering the presence of globally renowned institutions (Fortune 500 companies, world-renowned think-tanks, top universities and colleges) headquartered in

© The Economist Intelligence Unit Limited 2012 35
Hot spotsBenchmarking global city competitiveness
the city, and its international orientation. This mix is an indication of diversity, global attractiveness and civil society strength in each city, factors which arguably add to a city’s competitiveness.
Physical capital (10%)This category reflects the availability of and access to developed and efficient infrastructure (road networks, international links, public transport and telecommunications), which helps businesses operate more efficiently. It also has an element of quality of life for residents and visitors. Emerging-market cities are increasingly harnessing telecommunications in much the same way as developed-market companies harnessed the railroads and the telegraph. Taking note of this great equaliser, quality of telecommunication infrastructure has been included as a prominent indicator in the physical capital category.
Environment and natural hazards (5%) Environmental factors may affect both decision to start a new businesses and an individual’s desire to visit or live in the city. We analysed the city government’s commitment to maintain environmental standards by collecting data on codes, standards and strategies related to air, water and waste. This category also includes natural disaster hazard risk. As it is difficult to conduct an accurate, scientific assessment of natural disaster risk, we looked at the frequency of past events to ascertain hazard levels in each city.
Social and cultural character (5%)This category encompasses several liveability aspects that add dynamism to a city. We argue that these factors add vibrancy that attracts talent and enhance a city’s global appeal. Cultural vibrancy of the city has an additional benefit: the potential to develop the creative industries’ cluster, which in turn generates greater economic benefits through the multiplier effect.


Whilst every effort has been taken to verify the accuracy of this information, neither The Economist Intelligence Unit Ltd. nor the sponsor of this report can accept any responsibility or liability for reliance by any person on this report or any of the information, opinions or conclusions set out herein.
Cover image - David Simonds

LONDON26 Red Lion SquareLondonWC1R 4HQUnited KingdomTel: (44.20) 7576 8000Fax: (44.20) 7576 8500E-mail: [email protected]
NEW YORK750 Third Avenue5th FloorNew York, NY 10017, USTel: (1.212) 554 0600Fax: (1.212) 586 0248E-mail: [email protected]
HONG KONG6001, Central Plaza18 Harbour RoadWanchaiHong KongTel: (852) 2585 3888Fax: (852) 2802 7638E-mail: [email protected]
GENEVABoulevard des Tranchées 161206 GenevaSwitzerlandTel: (41) 22 566 2470Fax: (41) 22 346 9347E-mail: [email protected]