2015 investor day presentation (final...
TRANSCRIPT

NYSE / EURONEXT: CHMT
achieving our vision
Chemtura Corporation
2015 Investor Day Presentation
The Westin New York Grand CentralFebruary 5, 2015
INNOVATION | GROWTH | VALUE

Forward Looking Statement
This document includes forward-looking statements within the meaning of Section 27(a) of the Securities Act of 1933, as amended and Section 21(e) of the Exchange Act of 1934, as amended. These forward-looking statements are identified by terms and phrases such as “anticipate,” “believe,” “intend,” “estimate,” “expect,” “continue,” “should,” “could,” “may,” “plan,” “project,” “predict,” “will” and similar expressions and include references to assumptions and relate to our future prospects, developments and business strategies.
Factors that could cause our actual results to differ materially from those expressed or implied in such forward-looking statements include, but are not limited to:
The cyclical nature of the global chemicals industry; Increases in the price of raw materials or energy and our ability to recover cost increases through increased selling prices for our products; Disruptions in the availability of raw materials or energy; Our ability to implement our growth strategies in rapidly growing markets and faster growing regions; Our ability to execute timely upon our portfolio management strategies and mid and long range business plans; The successful separation of the Chemtura AgroSolutions business from the rest of our businesses; Our ability to execute timely on our restructuring plan and achieve the expected cost reductions; Declines in general economic conditions; The ability to comply with product registration requirements of regulatory authorities, including the U.S. Food and Drug Administration (the “FDA”) and European Union
REACh legislation; The effect of adverse weather conditions; Current and future litigation, governmental investigations, prosecutions and administrative claims; Environmental, health and safety regulation matters; Federal regulations aimed at increasing security at certain chemical production plants; Significant international operations and interests; Our ability to maintain adequate internal controls over financial reporting; Exchange rate and other currency risks; Our dependence upon a trained, dedicated sales force; Operating risks at our production facilities; Our ability to protect our patents or other intellectual property rights; Whether our patents may provide full protection against competing manufacturers; Our ability to remain technologically innovative and to offer improved products and services in a cost-effective manner; Our ability to reduce the risks of cyber incidents and protect our information technology; Our unfunded and underfunded defined benefit pension plans and post-retirement welfare benefit plans; Risks associated with strategic acquisitions and divestitures; Risks associated with possible climate change legislation, regulation and international accords; The ability to support the carrying value of the goodwill and long-lived assets related to our businesses; Whether we repurchase any additional shares of our common stock that our Board of Directors has authorized us to purchase and the terms on which any such repurchases
are made; and Other risks and uncertainties described in our filings with the Securities and Exchange Commission, including Item 1A, Risk Factors, in our Annual Report on Form 10-K.
These statements are based on our estimates and assumptions and on currently available information. Our forward-looking statements include information concerning possible or assumed future results of operations, and our actual results may differ significantly from the results discussed. Forward-looking information is intended to reflect opinions as of the date of this document. We undertake no duty to update any forward-looking statements to conform the statements to actual results or changes in our operations.
Cautionary Statement Regarding Forward-Looking Statement
CHEMTURA CORPORATION INVESTOR DAY - FEBRUARY 5, 2015
2

Managed Basis Financial Measures
See Appendix for Reconciliation to GAAP
The information presented in this presentation includes financial measures that are not calculated or presented in accordance with Generally AcceptedAccounting Principles in the United States (“GAAP”). Our managed basis financial measures consist of adjusted results of operations that exclude certainexpenses, gains and losses that may not be indicative of our core operations. Excluded items include costs associated with facility closures, severance andrelated costs; gains and losses on sale of businesses and assets; increased depreciation due to the change in useful life of assets; unusual and non-recurringsettlements; accelerated recognition of asset retirement obligations; impairment charges; changes in our pension plans as a result of dispositions, merger orsignificant plan amendments; the release of cumulative translation adjustments upon the complete or substantial liquidation of any majority-owned entity and therecognition of the fair value net of accretion of any significant below market contractual obligation. They also include the computation of Adjusted EBITDA. Inaddition to the managed basis financial measures discussed below, we have applied a managed basis effective income tax rate to our managed basis incomebefore taxes. Our managed basis tax rate of 31% in 2014 and 2013 represents refined estimated tax rates for our core operations to simplify comparison ofunderlying operating performance. Our projected managed basis tax rate for 2014 is lower than 31%. However, as we will revise our tax rate for 2015 to reflectthe sale of our Chemtura AgroSolutions business, we deferred revising the rate to avoid two potential changes in one year and to assist investors with thecomparability of our reported managed basis results. Reconciliations of these managed basis financial measures to their most directly comparable GAAPfinancial measures are provided in the attached financial tables. We believe that such managed basis financial measures provide useful information to investorsand may assist them in evaluating our underlying performance and identifying operating trends. In addition, management uses these managed basis financialmeasures internally to allocate resources and evaluate the performance of our operations. While we believe that such measures are useful in evaluating ourperformance, investors should not consider them to be a substitute for financial measures prepared in accordance with GAAP. In addition, these managedbasis financial measures may differ from similarly titled managed basis financial measures used by other companies and may not provide a comparable view ofour performance relative to other companies in similar industries.
CHEMTURA CORPORATION INVESTOR DAY - FEBRUARY 5, 2015
3

Adjusted Financial Measures
See Appendix for Reconciliation
The presentation also includes adjusted financial measures to portray how the Company may have performed in the applicable periods had the transactionsdiscussed in this document occurred prior to the commencement of those periods. The computation of these adjusted financial measures is also provided in theAppendix. Such adjusted financial measures are provided as illustrative examples of the impact of the transactions and are not a projection of actual futureperformance or the Company’s reported financial statements following the consummation of such transactions.
CHEMTURA CORPORATION INVESTOR DAY - FEBRUARY 5, 2015
4

Speaker Presentation Schedule
TIMES PRESENTATIONS SPEAKERS
1:00 PM Welcome Matthew Sokol
1:05 PM Strategy and Outlook Craig Rogerson
1:20 PM Industrial Performance Products Simon Medley
2:00 PM BREAK
2:15 PM Industrial Engineered Products (Intro) Simon Medley
2:20 PM IEP: Organometallics Alan Swiech
2:40 PM IEP: GLS Simon Medley
3:30 PM BREAK
3:40 PM Operational Update Chet Cross
3:55 PM Financial Performance and Outlook Stephen Forsyth
4:15 PM Summary and Q&A Craig Rogerson
CHEMTURA CORPORATION INVESTOR DAY - FEBRUARY 5, 2015
5

Presenters’ Biographies
CRAIG A. ROGERSONMr. Rogerson is President, Chief Executive Officer and Chairman of the board of Chemtura Corporation. Mr. Rogerson came to Chemtura in December 2008after serving as President, CEO and Director of Hercules Inc. until its acquisition by Ashland Inc. in November 2008. Mr. Rogerson joined Hercules in 1979 in thefirm’s Water Management Chemicals Division. In April 1997, he left Hercules to join Wacker Silicones Corporation, where he served as President and CEO. InMay 2000, he rejoined Hercules as Vice President, business operations of their BetzDearborn Division. He was eventually named Vice President and GeneralManager of that division in August 2000. Prior to being named CEO of Hercules in December 2003, Mr. Rogerson held a variety of senior management positionswith the company, including President of the FiberVisions and Pinova Divisions, Vice President of Global Procurement and COO. Mr. Rogerson serves on theBoards of Directors of PPL, the Society of Chemical Industry, and the American Chemistry Council.
STEPHEN FORSYTHMr. Forsyth is Executive Vice President and Chief Financial Officer. Before joining Chemtura in 2007, Mr. Forsyth served for 26 years with Hexcel Corporation ina variety of executive capacities, the last 11 years as Executive Vice President and Chief Financial Officer. Prior to becoming Hexcel’s CFO, he had heldpositions of increasing responsibility including serving as the General Manger of their specialty chemicals and specialty resins businesses, Vice President ofInternational Operations and leading a number of their major M&A initiatives.
CHET CROSSMr. Cross is Executive Vice President of Supply Chain Operations. He is responsible for Chemtura’s supply chain, procurement, manufacturing, EHS&S andengineering functions. Mr. Cross joined Chemtura in January 2010 from Ashland Corporation, where he was Vice President of operations for Ashland HerculesWater Technologies, primarily responsible for strategic oversight of the global manufacturing footprint and for the global operations and planning organizations.Previously, he held positions of increasing responsibility over two decades with Hercules Incorporated, most recently as General Manager for Hercules’s $700million Americas pulp and paper business and as President of Hercules Canada.
SIMON MEDLEYMr. Medley is Executive Vice President of Industrial Performance Products and Great Lakes Solutions. Mr. Medley joined Chemtura in 2012 after 18 years withBASF, where he built a track record of international success in diverse industries leading sustainable, profitable growth. His positions included Senior VicePresident of BASF’s Fine Chemicals and Care Chemicals North American business units, as well as Senior Vice President and Managing Director of BASFPersonal Care & Nutrition GmbH.
ALAN SWIECHMr. Swiech is Executive Vice President of Support Services for Chemtura Corporation, with responsibility for Human Resources, Corporate Communications, Strategic Project Management, Information Technology and also serves as General Manager of Chemtura’s Organometallics Specialties business. Mr. Swiech joined Chemtura in April 2006 as Vice President of Human Resources for Supply Chain Operations. Previously he was Vice President of Administration for Akebono Corporation (North America), responsible for the HR, information systems, legal, public relations, environmental health and safety, purchasing and customer service functions in North America. He also served as President of AMAK Brake, LLC a joint venture between Akebono and Itochu International. Before that he served as HR Vice President for Cambridge Industries Inc., a privately held supplier to the automotive industry. His experience also includes positions of increasing responsibility with United Technologies Corporation, including senior leadership positions in industrial and employee relations.
MATTHEW SOKOLMr. Sokol is Director of Investor Relations and Corporate Development for Chemtura. He joined Chemtura in 2005 and has served in a number of legal, corporate and business roles. Most recently, he was General Manager of Chemtura’s flame retardant business. Prior to joining Chemtura, Mr. Sokol was a Senior Associate with the law firm of Tyler Cooper & Alcorn in New Haven, Connecticut.
CHEMTURA CORPORATION INVESTOR DAY - FEBRUARY 5, 2015
6

Craig A. RogersonChairman, President and Chief Executive Officer
Strategy and Outlook
7

Portfolio Transformation
Strategic Priorities Going Forward
Focused Shareholder Value Creation
Overview
CHEMTURA CORPORATION INVESTOR DAY - FEBRUARY 5, 2015
8

Great Lakes Solutions
Organometallics
Petroleum Additives
Urethanes
Portfolio Actions Taken to Maximize Value to Shareholders
Antioxidants
Consumer Products
Chemtura AgroSolutions
IEP
IPPCORE
CORE
Sold to SK Capital for $200 million in April 2013
Sold to KIK Products for $300 million in December 2013
Sold to Platform Specialty Products for $1.0 billion in
November 2014
Minimal tax leakage due to sizeable NOL’s
Deployed majority of divestiture proceeds to position the company for the next stage of value creation
~ $800 million returned to shareholders including a successful $300 million Dutch tender
~ $500 million used to de-lever, reduce pension obligations and strengthen the balance sheet
PORTFOLIO ACTIONS DELIVERED $1.5 BILLION IN GROSS PROCEEDS
STRATEGY AND OUTLOOK
CHEMTURA CORPORATION INVESTOR DAY - FEBRUARY 5, 2015
9

New Chemtura
STRATEGY AND OUTLOOK
Portfolio of four industrial businesses organized in two reporting segments
FOCUSED ON DELIVERING REVENUE GROWTH AND MARGIN EXPANSION IN BOTH SEGMENTS
Industrial Engineered Products
Great Lakes Solutions Organometallics
Revenue $641m Revenue $159m
Segment Adjusted EBITDA $63m
Positioned to Recover
Industrial Performance Products
Petroleum Additives Urethanes
Revenue $687m Revenue $300m
Segment Adjusted EBITDA $141m
Positioned to Grow
IEPIPP
CHEMTURA CORPORATION INVESTOR DAY - FEBRUARY 5, 2015
10

Execute on Portfolio Growth Levers
Strategic Priorities
› Increasing customer demand for Petroleum Additives › Rapid market adoption of synthetic lubricant base-stocks
and finished fluids› Switch to Emerald InnovationTM flame retardants› Exploit growing demand for bromine based chemistries in
fine chemicals and Mercury Control› Duracast® and Thermo Plastic Urethanes (TPU)› Electronic applications for High Purity MOCVD
FOCUSED TO EXPOLIT SECULAR GROWTH TRENDS WHILE IMPROVING ABILITY TO EXECUTE AND DELIVER
STRATEGY AND OUTLOOK
› Manufacturing and SG&A cost-out programs› Driving productivity improvements through a simpler
organization and focus on continuous improvement› Enhanced customer focus› Maintain strength and flexibility of balance sheet› Best-in-class Safety and Environmental stewardship
› Leverage secular growth opportunities for our chemistries
› Innovation through customer collaboration› Commercial Excellence initiatives› Harvest recent new capacity investments› Invest in capacity and innovation › Positioned for cyclical recovery in international
markets
› Sustainable and consistent results› Adjusted EBITDA margins approaching 20%› Consistent free cash flow generation› Long term leverage of 2X Adjusted EBITDA› Continue to return value to shareholders› Disciplined M&A
Grow Our Businesses
Manage What We Can Control
Deliver Shareholder Value
CHEMTURA CORPORATION INVESTOR DAY - FEBRUARY 5, 2015
11

IPP: Key Revenue and Margin Growth Drivers
Leveraging increasing customer demand with broad based portfolio of Lubricant Additives› Inhibitors (antioxidants)› Detergents and Friction modifiers› Corrosion inhibitors and Anti-wear additives
Benefiting from growth in usage of Synthetic Lubricants› HVPAO base-stocks › Gear oils for wind turbines & industrial gearboxes› Refrigerant compatible lubricants
Driving Commercial and Operational Excellence› Focus on customer intimacy, executions and value creation› Manufacturing and SG&A cost-out programs› Innovation and continuous improvement
Positioned to deliver repeatable organic growth
STRATEGY AND OUTLOOK
Secular growth from increasing Regulation› Increasing CAFE standards› Reducing emission targets› Hydrochlorofluorocarbon (HCFC) phase-out in Refrigerants
Developing Urethane products to meet customer performance needs› ULTRALAST™ TPU demonstrated resilience and strong price: performance ratio› Duracast® unparalleled performance benefits
CHEMTURA CORPORATION INVESTOR DAY - FEBRUARY 5, 2015
12

IEP: Key Revenue and Margin Growth Drivers
Continuing to introduce next generation Emerald InnovationTM products
› Emerald InnovationTM 3000 benefits from full market conversion in EPS/XPS foams
› Next generation products for connectors market
› Innovative flame retardants for enclosure applications
Diversifying applications for Bromine and Bromine Derivatives
› Fine chemical brominated intermediates
› Geographic expansion of markets for clear brine fluids used in deep well offshore oil and gas production
› Mercury Control
Driving Commercial and Operational Excellence
› Focus on customer intimacy, executions and value creation
› Manufacturing cost and productivity improvements in Bromine and Organometallics
› Accelerated margin improvement when bromine market conditions recover
Positioned to return to 2012 performance levels and grow beyond
STRATEGY AND OUTLOOK
Diversifying Organometallics applications
› High purity MOCVD agents used in the production of high brightness LEDs and Photovoltaics
› MAO single site catalysts
› Octyl tin products
CHEMTURA CORPORATION INVESTOR DAY - FEBRUARY 5, 2015
13

* Plants to be closed
Asia/Pacific2014
Net Sales
23%
Europe/Africa2014
Net Sales
29%
Latin America2014
Net Sales
3%
North America2014
Net Sales
45%
Geographic Diversity to Support Growth Initiatives
› 55% of 2014 Net Sales outside North America
› Operate 21 manufacturing sites in 11 countriesNorth AmericaEl Dorado, ARMapleton, ILAdrian, MI*East Hanover, NJFords, NJPerth Amboy, NJGastonia, NCElmira, CanadaWest Hill, Canada
EMEALatina, ItalyBergkamen, GermanyAccrington, UKTrafford Park, UKAnkerweg, The Netherlands
Asia/PacificNantong, ChinaNanjing, China*Kaohsiung, TaiwanHyeongok, South Korea
Latin AmericaRio Claro, BrazilAltamira, MexicoReynosa, Mexico
Manufacturing Plants by Region
Post-transformation global footprint (pro-forma revenues excluding the divested businesses and the Platform Supply Agreements)
CHEMTURA CORPORATION INVESTOR DAY - FEBRUARY 5, 2015
STRATEGY AND OUTLOOK14
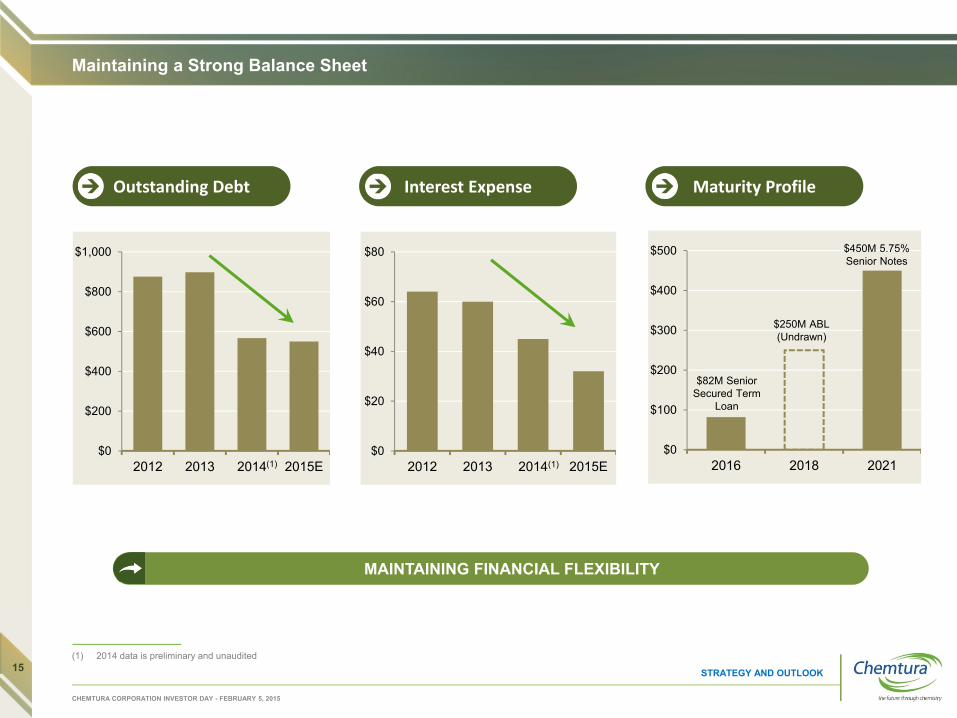
Maintaining a Strong Balance Sheet
MAINTAINING FINANCIAL FLEXIBILITY
$0
$200
$400
$600
$800
$1,000
2012 2013 2014 2015E$0
$20
$40
$60
$80
2012 2013 2014 2015E$0
$100
$200
$300
$400
$500
2016 2018 2021
Outstanding Debt Interest Expense Maturity Profile
$82M Senior Secured Term
Loan
$250M ABL(Undrawn)
$450M 5.75% Senior Notes
STRATEGY AND OUTLOOK
CHEMTURA CORPORATION INVESTOR DAY - FEBRUARY 5, 2015
(1) 2014 data is preliminary and unaudited
(1) (1)
15

Long Range Projections(1)
Preliminary2014
2015 2016 2017 2018
REVENUE GROWTH
Preliminary2014
2015 2016 2017 2018
ADJUSTED EBITDA GROWTH
EXECUTION OF STRATEGIC PRIORITIES TO DRIVE SIGNIFICANT ADJUSTED EBITDA AND MARGIN GROWTH
STRATEGY AND OUTLOOK
Preliminary2014
2015 2016 2017 2018
ADJUSTED EBITDA MARGIN GROWTH
CHEMTURA CORPORATION INVESTOR DAY - FEBRUARY 5, 2015
(1) 2014 data is preliminary and unaudited. It has been adjusted to exclude Chemtura AgroSolutions and expenses incurred in the process to sell the business16

2014 – 2015 Adjusted EBITDA Bridge
STRATEGY AND OUTLOOK
CHEMTURA CORPORATION INVESTOR DAY - FEBRUARY 5, 2015
2014Preliminary
Selling Price Vol/Mix RM/Energy Mfg Cost Out SG&AReductions
FX / Other 2015
Cost improvement actions underpin 2015 performance
NOTE: 2014 data is preliminary and unaudited. It has been adjusted to exclude Chemtura AgroSolutions and expenses incurred in the process to sell the business
17
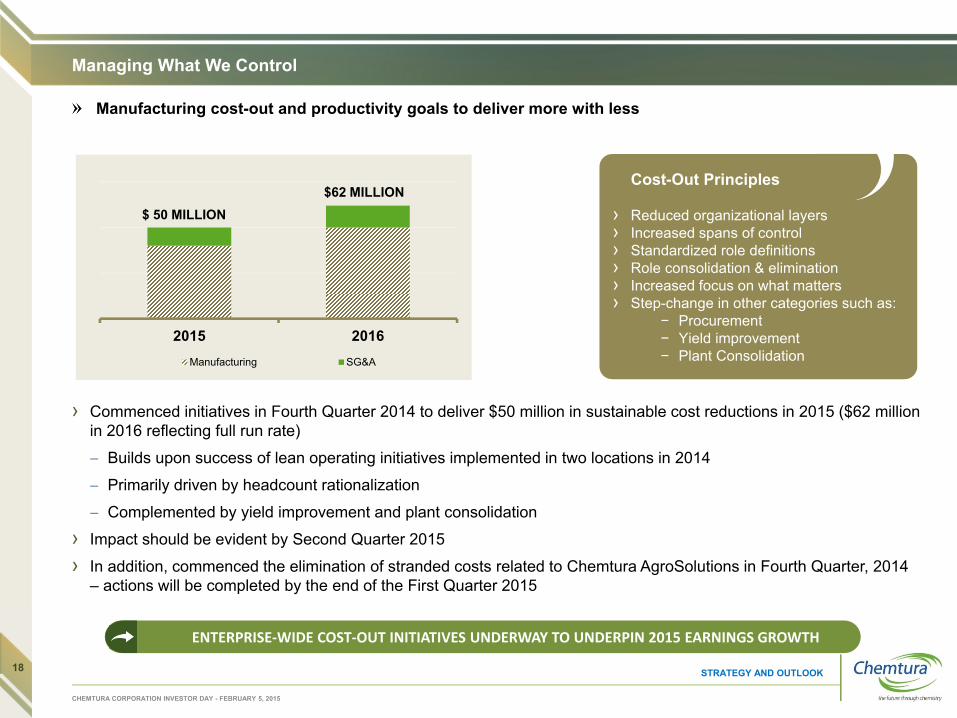
Cost-Out Principles
› Reduced organizational layers› Increased spans of control› Standardized role definitions› Role consolidation & elimination› Increased focus on what matters› Step-change in other categories such as:
− Procurement − Yield improvement− Plant Consolidation
2015 2016Manufacturing SG&A
Managing What We Control
› Commenced initiatives in Fourth Quarter 2014 to deliver $50 million in sustainable cost reductions in 2015 ($62 million in 2016 reflecting full run rate)
– Builds upon success of lean operating initiatives implemented in two locations in 2014
– Primarily driven by headcount rationalization
– Complemented by yield improvement and plant consolidation
› Impact should be evident by Second Quarter 2015
› In addition, commenced the elimination of stranded costs related to Chemtura AgroSolutions in Fourth Quarter, 2014 – actions will be completed by the end of the First Quarter 2015
STRATEGY AND OUTLOOK
ENTERPRISE‐WIDE COST‐OUT INITIATIVES UNDERWAY TO UNDERPIN 2015 EARNINGS GROWTH
Manufacturing cost-out and productivity goals to deliver more with less
$ 50 MILLION$62 MILLION
CHEMTURA CORPORATION INVESTOR DAY - FEBRUARY 5, 2015
18

0%
20%
40%
60%
80%
100%
120%
140%
160%
180%
12/31/11 06/30/12 12/31/12 06/30/13 12/31/13 06/30/14 12/31/14
CHMT RUSSELL 3000 ^CEX - Chemicals Index
Rewarding Our Shareholders
Deployed majority of net divestiture proceeds to position company for next stage of value creation
$22 $41$95
$719
$885
0
0.1
0.2
0.3
0.4
0.5
0.6
0.7
0.8
0.9
2011 2012 2013 2014 2015
Bill
ion
3-Year Stock Performance vs. Russell 3000 & Chemicals Indices
STRATEGY AND OUTLOOK
REPURCHASED ~34% OF OUTSTANDING SHARES THROUGH 1/31/15 AT AN AVERAGE COST OF $22.50 PER SHARETARGETING 65 MILLION OF SHARES OUTSTANDING BY YEAR END 2015
Open Market Remaining Authorization
^CEX↑68%
^RUA↑65%
CHMT↑118%
CHEMTURA CORPORATION INVESTOR DAY - FEBRUARY 5, 2015
$0.9 Billion in cumulative targeted share repurchases
19

Continuing the Transformation
› Proven track record of portfolio management
› Simplified and streamlined portfolio makes us an attractive and sensible partner
› Full flexibility on debt structure to promote a growth agenda
› Leadership and organizational teams experienced in M&A allows us to move quickly and decisively
STRATEGY AND OUTLOOK
POSITIONED TO DELIVER NEXT STAGE OF VALUE CREATION
CHEMTURA CORPORATION INVESTOR DAY - FEBRUARY 5, 2015
20

Simon MedleyExecutive Vice President
Industrial Performance Products
PetroleumAdditives
Urethanes
21

Urethanes
Synthetic Base-stocks
Lubricant Additives
Synthetic Finished Fluids
Industrialization
Globalization
Sustainability
Automotive
Aviation
Marine
Steel
Military
Recreational
Oil & Gas
Mining
Powergen
Electronics
Specialty Industrial
RefrigerationSynthetic Lubricants
5.5% CAGR
Hot Cast ElastomersIPI*+2% CAGR
Portfolio IndustryMarket PerformanceMega-Trend
SophisticationHigh quality OEM approved DurabilityLow maintenance
Demographics Global economyExtreme conditions Market standard Compatibility
Regulations LegislationEmissions Energy efficiency Fuel efficiency
*IPI – Industrial Production Index
Industrial Performance Products: Industries and Key Growth Drivers
Chemtura is a recognized leader in Industrial Performance Products
INDUSTRIAL PERFORMANCE PRODUCTS SEGMENT: PETROLEUM ADDITIVES & URETHANES
CHEMTURA CORPORATION INVESTOR DAY - FEBRUARY 5, 2015
22

Industrial Performance Products Overview: Strategy
Innovation through
Collaboration
Strategy ExecutionStructure
Industrial Performance Products
Petroleum Additives UrethanesCommon foundations
› Market-focused & Value-based strategy› Organization designed for successful
implementation › Processes & people with a culture of rigorous
and disciplined execution
Business specific strategies & execution models
› Industry and application view › Product, technology and asset view
Common approach to innovation management› Innovation infrastructure› Marketing-led innovation process› Collaborative approach
The IPP “House of Growth”
INDUSTRIAL PERFORMANCE PRODUCTS SEGMENT: PETROLEUM ADDITIVES & URETHANES
CHEMTURA CORPORATION INVESTOR DAY - FEBRUARY 5, 2015
23

Petroleum Additives UrethanesMarket-Driven Valued Innovator Applications-Focused Solutions Provider
Raws
Base-stocks Additives
Packages
Finished Fluid Manufacturers
End-User Applications
Raws
System Houses
Formulators and Processors
End-User Applications
Simplified Industry Value Chains
Industrial Performance Products Overview: Value Chain and Portfolio
› Intermediates for antioxidant inhibitors› Synthetic Group IV & V Base-stocks› Antioxidant inhibitors› Detergents› Friction modifiers› Corrosion inhibitors› Anti-wear additives› Extreme pressure additives› Industrial high performance grease› Synthetic finished fluids
› Polyester Polyol intermediate for polyurethanes› Customized curatives› Customized cast elastomers› Customized thermoplastic urethanes› Polyurethane dispersions› Urethane coatings
INDUSTRIAL PERFORMANCE PRODUCTS SEGMENT: PETROLEUM ADDITIVES & URETHANES
CHEMTURA CORPORATION INVESTOR DAY - FEBRUARY 5, 2015
24
Petroleum Additives UrethanesMarket-Driven Valued Innovator Applications-Focused Solutions Provider
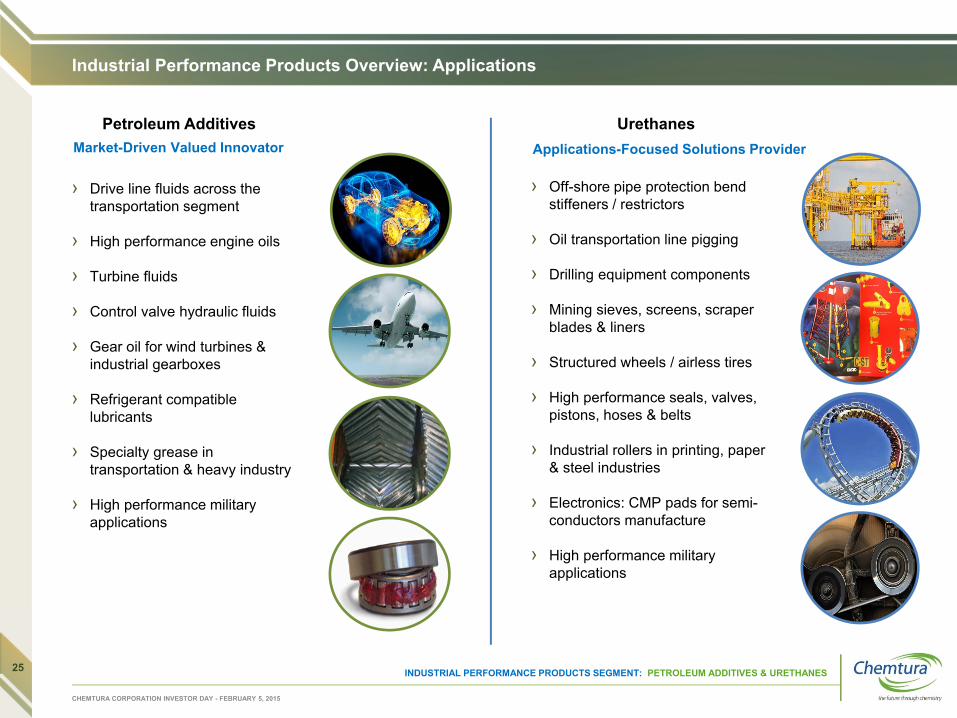
Industrial Performance Products Overview: Applications
› Drive line fluids across the transportation segment
› High performance engine oils
› Turbine fluids
› Control valve hydraulic fluids
› Gear oil for wind turbines & industrial gearboxes
› Refrigerant compatible lubricants
› Specialty grease in transportation & heavy industry
› High performance military applications
› Off-shore pipe protection bend stiffeners / restrictors
› Oil transportation line pigging
› Drilling equipment components
› Mining sieves, screens, scraper blades & liners
› Structured wheels / airless tires
› High performance seals, valves, pistons, hoses & belts
› Industrial rollers in printing, paper & steel industries
› Electronics: CMP pads for semi-conductors manufacture
› High performance military applications
CHEMTURA CORPORATION INVESTOR DAY - FEBRUARY 5, 2015
INDUSTRIAL PERFORMANCE PRODUCTS SEGMENT: PETROLEUM ADDITIVES & URETHANES25

CHEMTURA CORPORATION INVESTOR DAY - FEBRUARY 5, 2015
Petroleum Additives Urethanes
Market-Driven Valued Innovator Applications-Focused Solutions Provider
Industrial Performance Products Overview: Customers
Raws
Base-stocks Additives
Packages
Finished Fluid Manufacturers
End-User Applications
Raws
System Houses
Formulators & Processors
End-User Applications
Simplified Industry Value Chains
26

Innovation through Collaboration: Establishing the Network
Open Innovation
Universities
Customers
External Research Institutes
› UMass CUMIRP › University of Connecticut
› Warner Babcock Institute › Southwest Research Institute› Gersen Lehman Group› National Renewable Energy Laboratory
› Chemtura ideation portal› ‘Think Tanks’› Knowledge network› Suppliers
› Collaboration projects › Joint Development Agreements › Technology forum › Marketing Voice of the Customer
INDUSTRIAL PERFORMANCE PRODUCTS SEGMENT: PETROLEUM ADDITIVES & URETHANES
CHEMTURA CORPORATION INVESTOR DAY - FEBRUARY 5, 2015
27

Longer life finished fluids Reduced maintenance costs Extended drain life Durability
Energy efficiency Fuel economy Regulatory requirements Environmental impact
Advances in OEM technology Cost effective solutions for new
specifications
Reduced emissions Regulatory requirements
After treatment devices
Innovation through Collaboration: Focusing the Efforts using Innovation Vectors as ‘Aiming Points’
Longer component life Abrasion Extreme conditions Durability
Dynamic performance Increased speeds Increased loads Heat dissipation
Broader performance range Harder and softer grades as
rubber replacement solutions
Superior processing Improved productivity
Process flexibility Regulatory requirements
Petroleum Additives UrethanesMarket‐Driven Valued Innovator Applications‐Focused Solutions Provider
INDUSTRIAL PERFORMANCE PRODUCTS SEGMENT: PETROLEUM ADDITIVES & URETHANES
CHEMTURA CORPORATION INVESTOR DAY - FEBRUARY 5, 2015
28

Photo Courtesy of Southwest Research Institute
Sequence VEI Engine Test Stand
Innovation through Collaboration: New Friction Modifier Update
0
1
2
3
4
5
6
Fuel
Eco
nom
y In
crea
se (F
EI)
Fuel Economy of 0W-20 Motor Oil with 0.5% CHMT FM
FEI-SUM FEI-1 FEI-2
0W-20 0W-20 + CHMT FM
Providing Fuel Economy Retention through a new Durable Friction Modifier Additive
› Research into new friction modifiers has led to improved fuel economy retention as proven in engine testing
› Durability and additional anti-wear formulation credit
› Collaborating with a major oil company and auto-OEM
− Pilot scale development follows engine tests
− Target launch 2017
INDUSTRIAL PERFORMANCE PRODUCTS SEGMENT: PETROLEUM ADDITIVES & URETHANES
CHEMTURA CORPORATION INVESTOR DAY - FEBRUARY 5, 2015
29
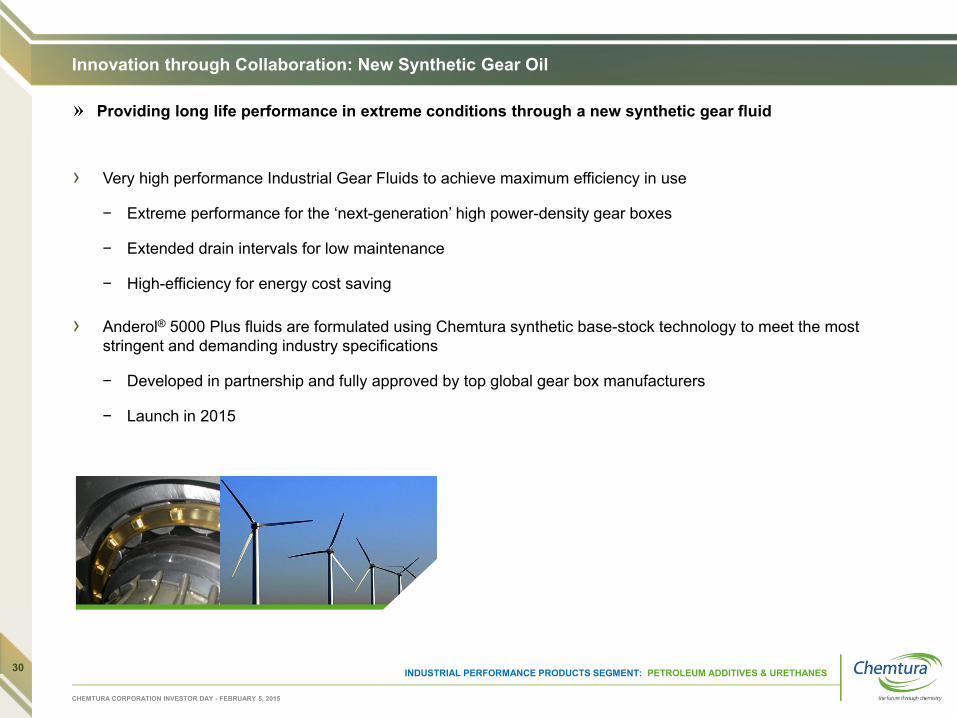
Innovation through Collaboration: New Synthetic Gear Oil
Providing long life performance in extreme conditions through a new synthetic gear fluid
› Very high performance Industrial Gear Fluids to achieve maximum efficiency in use
− Extreme performance for the ‘next-generation’ high power-density gear boxes
− Extended drain intervals for low maintenance
− High-efficiency for energy cost saving
› Anderol® 5000 Plus fluids are formulated using Chemtura synthetic base-stock technology to meet the most stringent and demanding industry specifications
− Developed in partnership and fully approved by top global gear box manufacturers
− Launch in 2015
INDUSTRIAL PERFORMANCE PRODUCTS SEGMENT: PETROLEUM ADDITIVES & URETHANES
CHEMTURA CORPORATION INVESTOR DAY - FEBRUARY 5, 2015
30

Innovation through Collaboration: Manufacturing Process Innovations in Petroleum Additives
Providing continued competitiveness in our flagship product lines of Inhibitors and HVPAO
› Anti-oxidants are the key additives involved in enabling durable, longer life fluids − Engine oil durability is mandated in new engine oil specifications to support OEM targets
› Research into the manufacturing process for antioxidant inhibitors has been successful− Processing steps eliminated, reduced investment cost & raw material efficiencies gained
− Currently in scale up with new technology asset expansion targeted for 2017
− Chemtura strengthens its industry leadership position
− Collaboration with a major customer in base-loading future assets
› HVPAO synthetic base-stock is the technology of choice for extreme condition gear oils − Chemtura expanded its HVPAO asset platform with Ankerweg, NL in 2014
− Chemtura is the leading producer in the merchant market
› Research into further improving the manufacturing process has been successful− Conversion performance, improved catalyst productivity and raw material efficiencies gained
− Chemtura’s knowledge network in action
− Phased launch already underway
INDUSTRIAL PERFORMANCE PRODUCTS SEGMENT: PETROLEUM ADDITIVES & URETHANES
CHEMTURA CORPORATION INVESTOR DAY - FEBRUARY 5, 2015
31

Innovation through Collaboration: Thermo Plastic Polyurethanes Technology Platform in Urethanes
A new technology platform providing extended component life
› Initial proof of concept enabled business development with Callaway golf balls
− ULTRALAST™ TPU demonstrated its resilience, scuff resistance and excellent processability
› Chemtura has superior technology
− Thermoset properties and better processing than other specialty TPUs
− ULTRALAST™ is the only TPU to provide high temperature oil, water and chemical resistance
− Enabling a strong price: performance ratio
› New target applications identified through market collaborations
− High performance seals and gaskets
− Pumps and valves
− Mining screens
− Tubes and hoses
− Belting
› Launched successfully in 2014
− Expanding into more applications in 2015
$0
$50
$100
$150
$200
Seals &Gaskets
Pumps &Valves
MiningScreens
Tubes &Hoses
Belt DrivesAd
dres
sabl
e M
arke
t
INDUSTRIAL PERFORMANCE PRODUCTS SEGMENT: PETROLEUM ADDITIVES & URETHANES
CHEMTURA CORPORATION INVESTOR DAY - FEBRUARY 5, 2015
Source: Internal Estimates
32
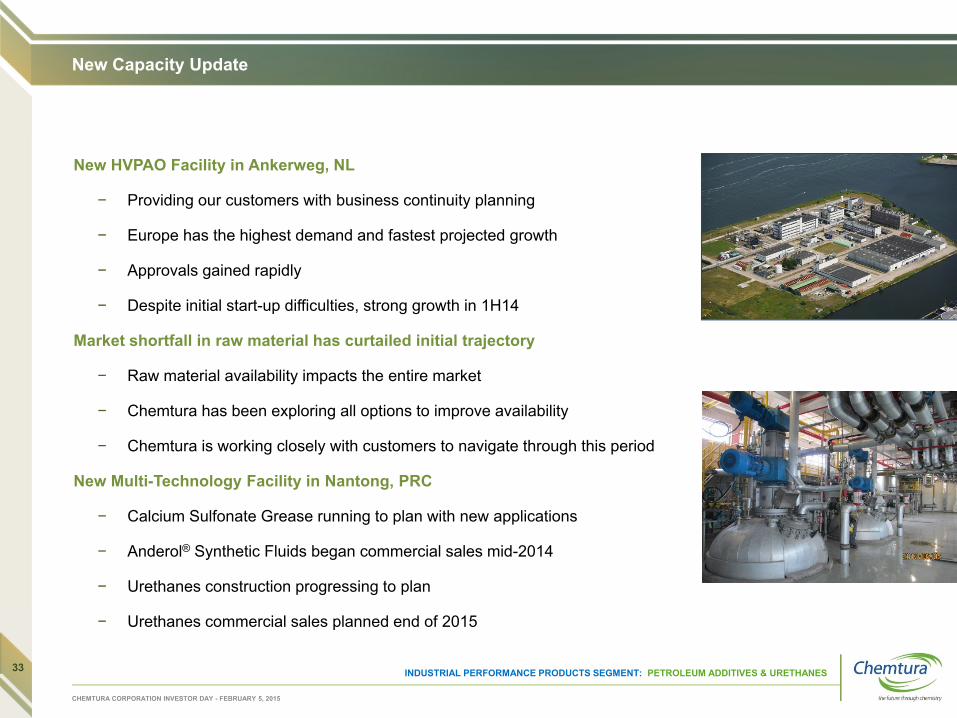
New HVPAO Facility in Ankerweg, NL
− Providing our customers with business continuity planning
− Europe has the highest demand and fastest projected growth
− Approvals gained rapidly
− Despite initial start-up difficulties, strong growth in 1H14
Market shortfall in raw material has curtailed initial trajectory
− Raw material availability impacts the entire market
− Chemtura has been exploring all options to improve availability
− Chemtura is working closely with customers to navigate through this period
New Multi-Technology Facility in Nantong, PRC
− Calcium Sulfonate Grease running to plan with new applications
− Anderol® Synthetic Fluids began commercial sales mid-2014
− Urethanes construction progressing to plan
− Urethanes commercial sales planned end of 2015
New Capacity Update
INDUSTRIAL PERFORMANCE PRODUCTS SEGMENT: PETROLEUM ADDITIVES & URETHANES
CHEMTURA CORPORATION INVESTOR DAY - FEBRUARY 5, 2015
33

Commercial Excellence
Sales Force Effectiveness
Operational Marketing
› Channel management with differentiated segmentation› Strategic growth accounts opportunity management process› ‘Hunting’ process with identification to penetration › Rigorous implementation discipline
› Fully loaded account profitability › New pricing model with database and tools › Enhanced demand process to support hunting activities › Margin management process established
› Significant progress has been made in upgrading commercial standards
− Significant gross profit improvements have been realized
− The capability of the Chemtura team has been improved
› The full year impact of these improvements will bring an additional $14M in 2015
› An Implementation Manager role has been created to continue to drive execution
INDUSTRIAL PERFORMANCE PRODUCTS SEGMENT: PETROLEUM ADDITIVES & URETHANES
CHEMTURA CORPORATION INVESTOR DAY - FEBRUARY 5, 2015
34

Commercial Excellence
CHEMTURA CORPORATION INVESTOR DAY - FEBRUARY 5, 2015
› Demonstrated improvement in commercial performance diluted by raw material disruption
› The PAO supply disruption cost Chemtura ~$7M in 2014 in lost contribution and extra costs
2013 A Business improvement Supply chaininefficiencies - PAO
Unabsorbedmanufacturing
2014 A
~ 6% improvement
Includes freight and manufacturing inefficienciesLost contribution
Gross Profit$M
Preliminary
(1) 2014 preliminary and unaudited35

Expansion
Petroleum Additives – Market Driven Valued Innovator expansion
− Strengthening the core of our lubricant additives portfolio
− Further strengthening or accelerating our innovation pipeline
− Enabling penetration of one step adjacencies:
− New geographies using the existing product portfolio
− New markets using the existing technology base
− We have an active target list, but continue to search for the right project
Urethanes – Applications Focused Solutions Provider expansion
− Strengthening our core cast elastomer business to accelerate growth
− Further strengthening the innovation pipeline with additional technology platforms
− Further strengthening our application know-how for target industries
Expansion through ‘bolt-on’ acquisitions have been explored against our strategic criteria
INDUSTRIAL PERFORMANCE PRODUCTS SEGMENT: PETROLEUM ADDITIVES & URETHANES
CHEMTURA CORPORATION INVESTOR DAY - FEBRUARY 5, 2015
36

2014 A Price Vol / Mix Cost -COGS
Cost -SG&A
FX / Other 2015 B Price Vol / Mix Cost -COGS
Cost -SG&A
2018 LRF
Industrial Performance Products Strategic Plan
CHEMTURA CORPORATION INVESTOR DAY - FEBRUARY 5, 2015
Growth at sustainable profitability levels
INDUSTRIAL ENGINEERED SEGMENT
› Cost improvement actions are expected to provide a significant contribution to our 2015 plan› 2015 pricing includes substantial carry-over from 2014› Volume growth in PAO, the inhibitors value chain, finished fluids and cast elastomers
2014Preliminary
NOTE: 2014 preliminary and unaudited
2018
37
Industrial Engineered Products (IEP)
Simon MedleyExecutive Vice President
Organometallic Specialties
38
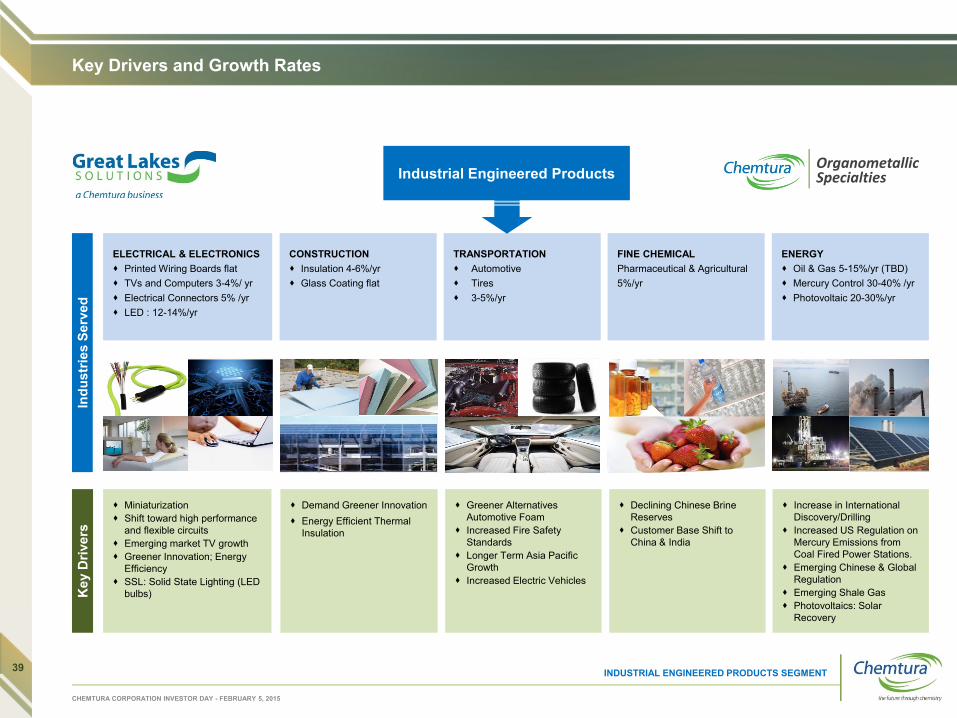
Key Drivers and Growth Rates
Industrial Engineered Products
Key
Driv
ers
Miniaturization Shift toward high performance
and flexible circuits Emerging market TV growth Greener Innovation; Energy
Efficiency SSL: Solid State Lighting (LED
bulbs)
Demand Greener Innovation Energy Efficient Thermal
Insulation
Greener Alternatives Automotive Foam
Increased Fire Safety Standards
Longer Term Asia Pacific Growth
Increased Electric Vehicles
Declining Chinese Brine Reserves
Customer Base Shift to China & India
Increase in International Discovery/Drilling
Increased US Regulation on Mercury Emissions from Coal Fired Power Stations.
Emerging Chinese & Global Regulation
Emerging Shale Gas Photovoltaics: Solar
Recovery
ELECTRICAL & ELECTRONICS Printed Wiring Boards flat TVs and Computers 3-4%/ yr Electrical Connectors 5% /yr LED : 12-14%/yr
CONSTRUCTION Insulation 4-6%/yr Glass Coating flat
FINE CHEMICALPharmaceutical & Agricultural5%/yr
ENERGY Oil & Gas 5-15%/yr (TBD) Mercury Control 30-40% /yr Photovoltaic 20-30%/yr
TRANSPORTATION Automotive Tires 3-5%/yr
Indu
strie
s Se
rved
Organometallic Specialties
INDUSTRIAL ENGINEERED PRODUCTS SEGMENT
CHEMTURA CORPORATION INVESTOR DAY - FEBRUARY 5, 2015
39

Alan SwiechExecutive Vice President, Human Resources and Support Services
IEP: Organometallics Specialties
40

Key End Markets
AXION® OrganometallicsAl, Zn, B, Si, Zr, Hf, Mg, Sn, In, Ga
Electronics / LED$10Bn (2012)
CAGR : 12-14% for SSL*
Energy /$45Bn (2012)PhotovoltaicCAGR: 12% for
Crystaline Panels*
Industrial /Polymerization
Catalysts$2.4Bn (2010)
CAGR: 4%(Z/N)-12% SCC*
Transportation /Rubber CatalystsPaint Catalysts
CAGR 3-5%*
Construction /Glass Coating$40Bn (2009)
Flat Glass MarketTin Intermediates
Pharmaceutical /Fine Chemicals
$40Bn (2010)CAGR: 5%, higher for
Generica*
Indu
strie
s Se
rved
Key
Driv
ers Energy Efficiency
SSL: Solid State Lighting (LED bulbs)
Politics support renewable energy
Increased panel performance approaching grid parity
HIV treatment supported by WHO
Blockbuster API’s becoming generic
Customer Base Shift to China & India
Single Site Catalyst growth
Oligomer/LAO /PO capacity increases
Proportional to Automotive industry growth trend
EU Regulation forces tin catalyst changes
EU Regulation forces tin stabilizer changes
Energy Efficient Thermal Insulation
Recycling
INDUSTRIAL ENGINEERED PRODUCTS SEGMENT: ORGANOMETALLICS
* Compound Annual Growth Rates (CAGR): Chemtura Internal Estimates
CHEMTURA CORPORATION INVESTOR DAY - FEBRUARY 5, 2015
OMS MANUFACTURES AND MARKETS HIGHLY REACTIVE, METAL CONTAINING SPECIALTIES THAT ARE ESSENTIAL FOR A VARIETY OF LARGE, FAST GROWING AND ATTRACTIVE END MARKETS
41

Current Organometallics Landscape
The organometallic industry has experienced a series of changes and challenges over the past three years:› Aggressive new competition in metal alkyls, particularly in APAC, significantly impacted TEA
– Increased production capacities exacerbated pricing pressures
› Overcapacity in non-captive tin intermediates business led to unsatisfactory profit contribution
› Identified emerging markets, especially LEDs, developed at a slower pace than anticipated
TEA accounts for 42% of MA price
declinesVolume decline due to
overcapacity and increased competition
Tin – negative contribution
Metal Alkyls
Tin Compounds
Other costs
INDUSTRIAL ENGINEERED PRODUCTS SEGMENT: ORGANOMETALLICS
DayStar™ slow to start up
CHEMTURA CORPORATION INVESTOR DAY - FEBRUARY 5, 2015
NOTE: 2014 preliminary and unaudited
Changes in profitability 2011 to 2014 by driver
20142011
42

What We Will Do: Aggressive Cost-Out - Bergkamen
Savings Plan
Waste
› Multiple waste reduction projects (MAO, DEAC from DEZ)
› External solvent disposal
Others
› Site support contract improvements
› Reduction of Rental Equipment and Tainers
Personnel
› Spans and Layers
› Staffing: manufacturing
› Shorter hours/fewer days of operation
INDUSTRIAL ENGINEERED PRODUCTS SEGMENT: ORGANOMETALLICS
CHEMTURA CORPORATION INVESTOR DAY - FEBRUARY 5, 2015
43

Tin MA (excludingMAO/BEM) MAO Specialties Daystar™
› Leverage expertise and strong customer relationships
- Benefit from process improvement - newpurification technology
- Take advantage of European regulation change and local footprint
- APAC – grow at existing customers
› Significant volume contribution from new customer
› Focus on productsand regions where we have “right to win”
- Maintain TEA business in US and Europe
- Selectively pursue APAC TEA opportunities
- Focus growth on solutions and more differentiated neat products
› Major customers strongly desire two suppliers (surety of supply)
› CHMT one of two globally capable suppliers
› MAO growth alsobenefits TMA
› Capitalize on growth of pharma in India
› Focus on higher margin Photovoltaic business in SouthEast Asia
› Leverage local cost competitive Korean footprint
› Begin local production of highly differentiated TMI
› Take advantage of rapid market growth in APAC
What We Will Do
Manage as commodity business Seek out growth and higher profits for these differentiated products in growth markets
Overall focus on differentiated, higher margin products
INDUSTRIAL ENGINEERED PRODUCTS SEGMENT: ORGANOMETALLICS
CHEMTURA CORPORATION INVESTOR DAY - FEBRUARY 5, 2015
44
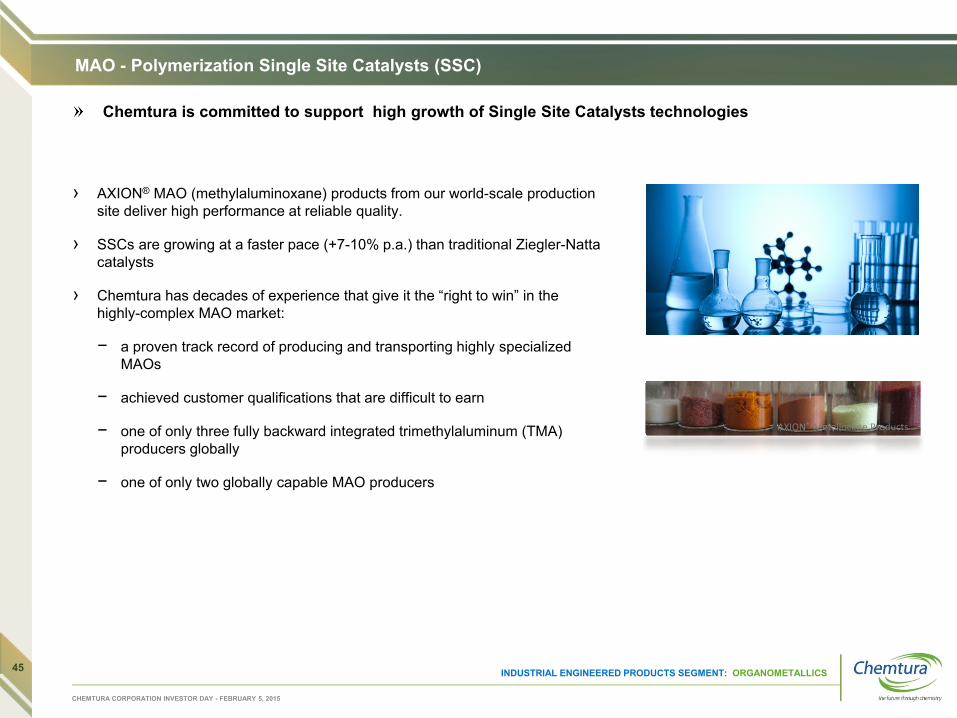
MAO - Polymerization Single Site Catalysts (SSC)
› AXION® MAO (methylaluminoxane) products from our world-scale production site deliver high performance at reliable quality.
› SSCs are growing at a faster pace (+7-10% p.a.) than traditional Ziegler-Natta catalysts
› Chemtura has decades of experience that give it the “right to win” in the highly-complex MAO market:
− a proven track record of producing and transporting highly specialized MAOs
− achieved customer qualifications that are difficult to earn
− one of only three fully backward integrated trimethylaluminum (TMA) producers globally
− one of only two globally capable MAO producers
AXION® Metallocene Products
Chemtura is committed to support high growth of Single Site Catalysts technologies
INDUSTRIAL ENGINEERED PRODUCTS SEGMENT: ORGANOMETALLICS
CHEMTURA CORPORATION INVESTOR DAY - FEBRUARY 5, 2015
45

Specialty Chemicals – Higher Margin Opportunities
Tailor-made AXION® Organometallic Specialties for all high efficiency Photovoltaics
Markets:› Crystalline Technologies:
Silicon (mono- & polycrystalline)supplied with AXION® 1303 HP(TMA, Trimethylaluminum)
› ThinFilm Technologies:Silicon ThinFilm (amorph & micro-morph): CIGS (CopperIndiumGalliumSelenide) supplied with AXION® EP 2201 HP (DEZ, Diethylzinc)
› Chemtura can provide highly effective solutions for the 2 leading and growing PV technologies
Differentiated Products in higher margin businesses:
› Tailor-made AXION® Organometallics are essential for Active Pharmaceutical Ingredients (API´s) i.e. for treatment of hypertension, cholesterol and HIV
› Security of supply from our integrated manufacturing capacities for AXION® Organometallic Specialties
› Our Technology teams are working closely with important pharmaceutical companies to help develop advanced organometallic reagents and novel API´s
› Strengthening our position in the fast growing Generic Pharma market in India
Pharmaceuticals and Fine ChemicalsEnergy and Electronics: Photovoltaics
CAGR 12% p.a.
NOTE: Annually added PV capacities: Global market scenarios until 2018
INDUSTRIAL ENGINEERED PRODUCTS SEGMENT: ORGANOMETALLICS
CHEMTURA CORPORATION INVESTOR DAY - FEBRUARY 5, 2015
Source: European Photovoltaic Industry Association
46

Light Emitting Diodes (LEDs)
Market demand driven by shift away from incandescent lighting
› Double digit growth in spite of saturated markets in other applications like screens or monitors:
− General lighting market expected to the primary growth driver for the LED industry with a rapid growth over the next decade
− More than 1 billion LED lamps shipped in 2014, increasing to 3 billion in 2016*
− The LED market is expected to reach a total volume of $42.7 billion by 2020*
Daystar™ can reasonably grow greater than market expectations because:
› Offers the full range of high purity metal organics for LED (eTMG, eTMA, eTEG, eTMI) - the purity of these MO’s exceeds 99.9999%.
› Excellent economies of scale as fully backwards integrated with proven best in class production technology and regional footprint (cost competitive)
› Sufficient capacity to cover growing market demand.
› Opportunities to bid on new business at key customers in 2015
Developing strong relationships at key customers and numerous product qualifications in progress.
INDUSTRIAL ENGINEERED PRODUCTS SEGMENT: ORGANOMETALLICS
CHEMTURA CORPORATION INVESTOR DAY - FEBRUARY 5, 2015
* Source: Aixtron Q3 2014 Financial Report
47
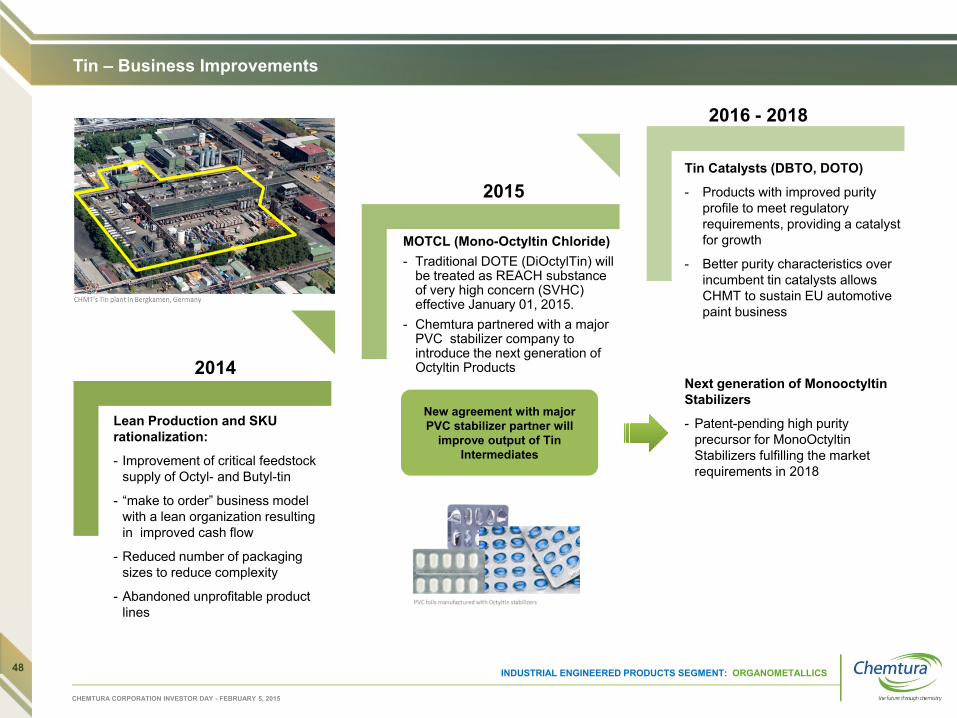
Tin – Business Improvements
Lean Production and SKU rationalization:
- Improvement of critical feedstock supply of Octyl- and Butyl-tin
- “make to order” business model with a lean organization resulting in improved cash flow
- Reduced number of packaging sizes to reduce complexity
- Abandoned unprofitable product lines
Tin Catalysts (DBTO, DOTO)
- Products with improved purity profile to meet regulatory requirements, providing a catalyst for growth
- Better purity characteristics over incumbent tin catalysts allows CHMT to sustain EU automotive paint business
Next generation of MonooctyltinStabilizers
- Patent-pending high purity precursor for MonoOctyltinStabilizers fulfilling the market requirements in 2018
MOTCL (Mono-Octyltin Chloride)- Traditional DOTE (DiOctylTin) will
be treated as REACH substance of very high concern (SVHC) effective January 01, 2015.
- Chemtura partnered with a major PVC stabilizer company to introduce the next generation of Octyltin Products2014
2015
2016 - 2018
New agreement with major PVC stabilizer partner will
improve output of Tin Intermediates
INDUSTRIAL ENGINEERED PRODUCTS SEGMENT: ORGANOMETALLICS
CHEMTURA CORPORATION INVESTOR DAY - FEBRUARY 5, 2015
48

Summary
Accomplishments and next steps:› Significant operational cost
savings implemented early in 2015
› Focused regional strategies in our key markets and expand in the markets and product lines where we have strong “right to win”
› Robust, detailed initiatives with clear accountabilities and strong organizational “buy-in”
› Full product portfolio, local cost competitive production in our Daystar™ business
› Execution of defined, customized and customer-driven R&D projects in Catalyst Systems
Strong focus on growing the higher margin value chain from TMA:› Single Site Catalysts (MAO)› Opto electronics (eTMA, et. al)› Photovoltaic (TMA, DEZ)› Pharma (DEZ)
CHEMTURA CORPORATION INVESTOR DAY - FEBRUARY 5, 2015
INDUSTRIAL ENGINEERED PRODUCTS SEGMENT: ORGANOMETALLICS
Well Positioned to Serve Higher Margin Growth Markets
49
2014
Bas
e
PCC
Tin/S
pecia
lties
Days
tar
Cost
out
2015
PCC
Tin/S
pecia
lties
Days
tar
Cost
out
2018
Organometallics Strategic Plan
CHEMTURA CORPORATION INVESTOR DAY - FEBRUARY 5, 2015
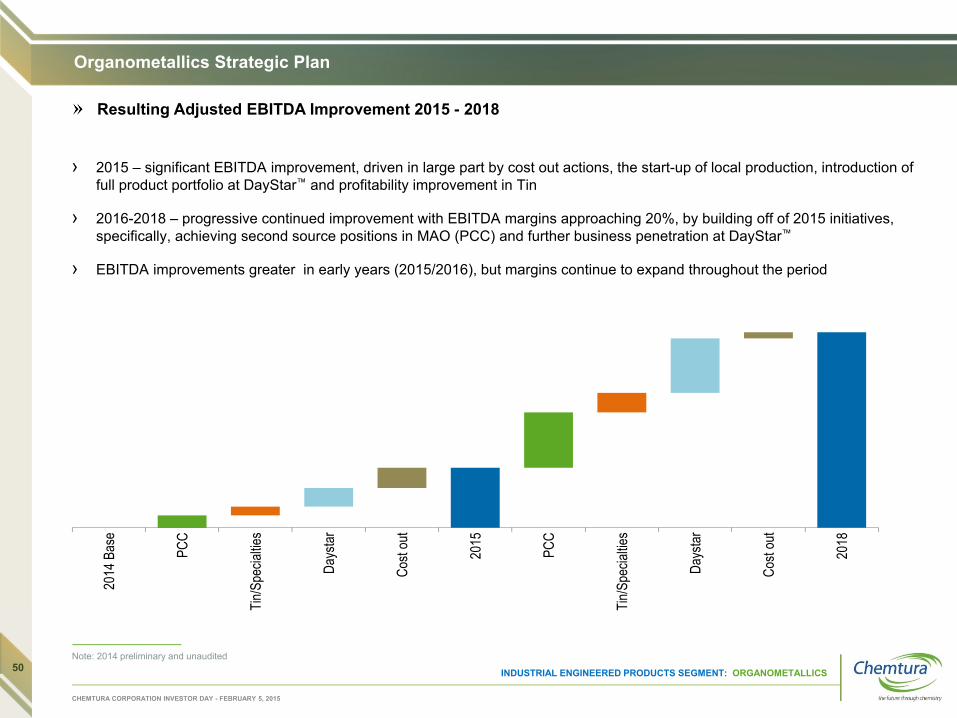
› 2015 – significant EBITDA improvement, driven in large part by cost out actions, the start-up of local production, introduction of full product portfolio at DayStar™ and profitability improvement in Tin
› 2016-2018 – progressive continued improvement with EBITDA margins approaching 20%, by building off of 2015 initiatives, specifically, achieving second source positions in MAO (PCC) and further business penetration at DayStar™
› EBITDA improvements greater in early years (2015/2016), but margins continue to expand throughout the period
Resulting Adjusted EBITDA Improvement 2015 - 2018
INDUSTRIAL ENGINEERED PRODUCTS SEGMENT: ORGANOMETALLICS
Note: 2014 preliminary and unaudited50
Industrial Engineered Products: Great Lakes Solutions
Simon MedleyExecutive Vice President
51

The Journey to Sustainable Value Creation
CHEMTURA CORPORATION INVESTOR DAY - FEBRUARY 5, 2015
Performance characteristics:Earnings capability:
Attractive Adjusted EBITDA margins
Strong cash flow
ROIC
Cyclicality: Electronics and Insulation
Timing new product introductions
Bromine Supply vs. Demand – The Capital Cycle
Managing for Value: Diversify - Oil, Gas, Mercury Control and Fine Chemicals
Flexible strategic sourcing deals
Capital efficiency
Timing new product introductions
Cost-out to ensure lean, efficient and effective operations
An integrated business approach to value optimization
Sustainable Value Creation
Continuous Innovation
Business Excellence
Fire Safety Advocacy
IndustryDiversification
INDUSTRIAL ENGINEERED PRODUCTS SEGMENT: GREAT LAKES SOLUTIONS52
Global Mega Trends
CHEMTURA CORPORATION INVESTOR DAY - FEBRUARY 5, 2015
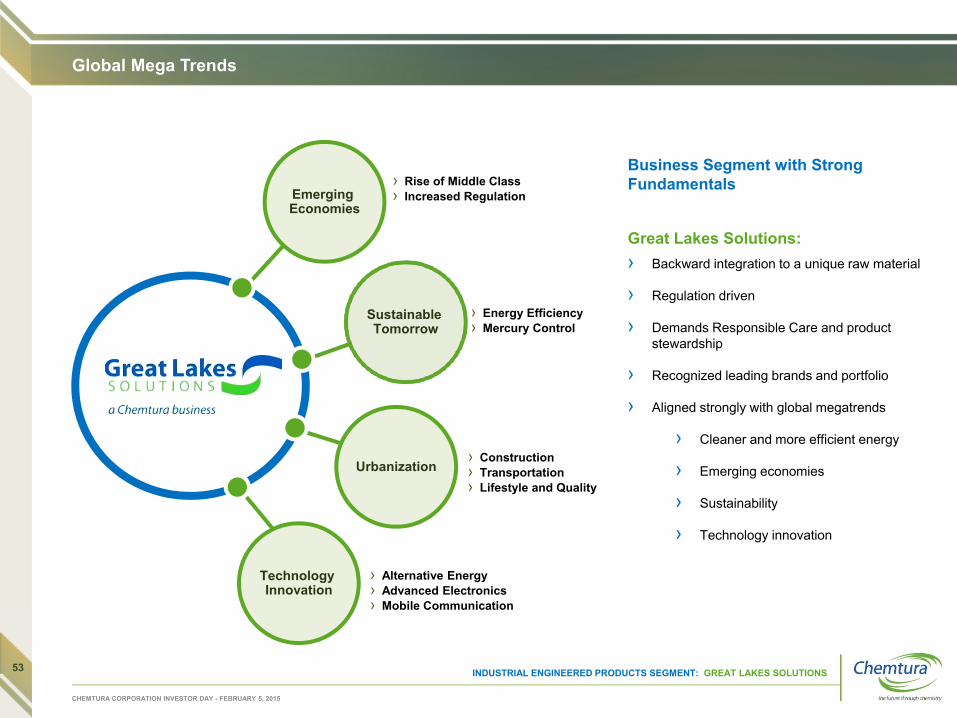
› Rise of Middle Class› Increased Regulation
› Construction› Transportation› Lifestyle and Quality
› Alternative Energy› Advanced Electronics› Mobile Communication
› Energy Efficiency› Mercury Control
Emerging Economies
Technology Innovation
Urbanization
Sustainable Tomorrow
Business Segment with Strong Fundamentals
Great Lakes Solutions:› Backward integration to a unique raw material
› Regulation driven
› Demands Responsible Care and product stewardship
› Recognized leading brands and portfolio
› Aligned strongly with global megatrends
› Cleaner and more efficient energy
› Emerging economies
› Sustainability
› Technology innovation
INDUSTRIAL ENGINEERED PRODUCTS SEGMENT: GREAT LAKES SOLUTIONS53

Bromine: Global Availability and Demand
CHEMTURA CORPORATION INVESTOR DAY - FEBRUARY 5, 2015
Demand Assumptions:
› Conservative growth in traditional industries served
‒ Reduction in furniture foam applications
› Gradual Macroeconomic Recovery
› Emerging new bromine application in Mercury Control
The global supply-demand balance has been challenged in recent years, but improvements are ahead
Bromine Availability Assumptions:
› All supply based upon nameplate capacity
› Chinese bromine estimated at approx. 90 KMT in 2014
› Chemtura bromine availability from South Arkansas production and flexible long term strategic sourcing agreements with ICL and ALB
'08 '09 '10 '11 '12 '13 '14 '15 '16 '17 '18
Global Supply Global Demand Baseline
2015 – 2018 Volume based on Company Estimates
INDUSTRIAL ENGINEERED PRODUCTS SEGMENT: GREAT LAKES SOLUTIONS54

Global Bromine Sources
CHEMTURA CORPORATION INVESTOR DAY - FEBRUARY 5, 2015
GLOBAL BROMINE SOURCES1:
GREAT LAKES SOLUTIONS BROMINE FRANCHISE:
Bromine Source
Great Lakes Solutions SourceIsrael, Dead Sea, Jordan……………………...………6,000-12,000 ppm
South Arkansas/ US………………………………….. 4,000-6,000 ppm
India…………………………………………………….. 1,000-3,000 ppm
China……………………………………………...……. 200 ppm
U.S.: Investment of >$150 million and Long Term Strategic Sourcing ArrangementDead Sea: Long Term Strategic Sourcing ArrangementsISO fleet: Expanded by 200% since 2009 to serve faster growing regions
1 Based on internal estimates.INDUSTRIAL ENGINEERED PRODUCTS SEGMENT: GREAT LAKES SOLUTIONS55

Continuing Industry Diversification
CHEMTURA CORPORATION INVESTOR DAY - FEBRUARY 5, 2015
Diversified industry segments drive significant growth 2014-2018
› Electronics: Less dependent on cyclicality of demand
› Insulation: Grow in energy efficient flame resistant thermal insulation
› Fine Chemicals: Grow in agricultural and pharmaceutical intermediates
› Oil & Gas: Grow international demand to reduce dependence on Gulf of Mexico
› Utilities: Mercury Control to reduce emissions from coal fired power stations
Electrical & Electronics Fine Chem/Pharma
Building & Construction Energy
Biocides Fumigants
Auto
Electrical & Electronics Fine Chem/Pharma
Building & Construction Energy
Biocides Fumigants
Auto
GLS - 2007 Margin Distribution GLS – 2014 Margin Distribution GLS – 2018 Margin Distribution
Electrical & Electronics Fine Chem/PharmaBuilding & Construction EnergyBiocides FumigantsAuto Industrial
INDUSTRIAL ENGINEERED PRODUCTS SEGMENT: GREAT LAKES SOLUTIONS56

Industry Diversification – Electronics
CHEMTURA CORPORATION INVESTOR DAY - FEBRUARY 5, 2015
Flame retardant cyclicality dampened through sub-segment focused innovation and flexible sourcing model
– New Innovation for Connectors and High Performance electronics
Electronics Long-Term Fundamentals Remain Favorable‒ Automotive Electronic Systems projected to grow from $157Bn to $240Bn by 2020
‒ BFRs to grow at 4.1% CAGR through 2018, especially those in E&E segments. Phosphorus Flame Retardants into plastics growing at 9.7% (BCC Research)
Electrical ConnectorsComputers & Peripherals; Industrial; Transportation & Auto; Telecom all growing 7-9% through 2019 with Business Equipment at 4.3%
Printed Wire BoardsStabilizing demand for business computing, combined with a persistent growth in the Internet, smart devices, wearable technology as well as new applications in LED lighting, support GDP or better growth for circuit boards business
Electronic EnclosuresTV growth is returning—both in number of units & screen size—IHS projects 7% 2015 vs. 2014
INDUSTRIAL ENGINEERED PRODUCTS SEGMENT: GREAT LAKES SOLUTIONS57

Industry Diversification - Insulation
Great Lakes Solutions is first to market with a sustainable alternative for energy efficient insulation foams: Emerald Innovation™ 3000. Vast majority of EPS/XPS customers in EU converted to Emerald Innovation 3000™ in 2014
› Insulation market: 2000 – 2010 average growth = 3% / yr
› Rigid Board Insulation 2012 – 2018 = 4% / yr
› Europe’s growth driven by rigorous insulation requirements for buildings
› Chinese thermal insulation market growth driven by improvement in energy conservation and emissions reduction
› 2013 – 2018 growth focused on APAC with average growth estimated at 5% / yr
› Central and South America lead by Mexico and Brazil will stimulate housing construction in urban areas and thus insulation consumption
CHEMTURA CORPORATION INVESTOR DAY - FEBRUARY 5, 2015
Smithers Apex Information Ltd 2013
INDUSTRIAL ENGINEERED PRODUCTS SEGMENT: GREAT LAKES SOLUTIONS58
Industry Diversification – Fine Chemicals
CHEMTURA CORPORATION INVESTOR DAY - FEBRUARY 5, 2015
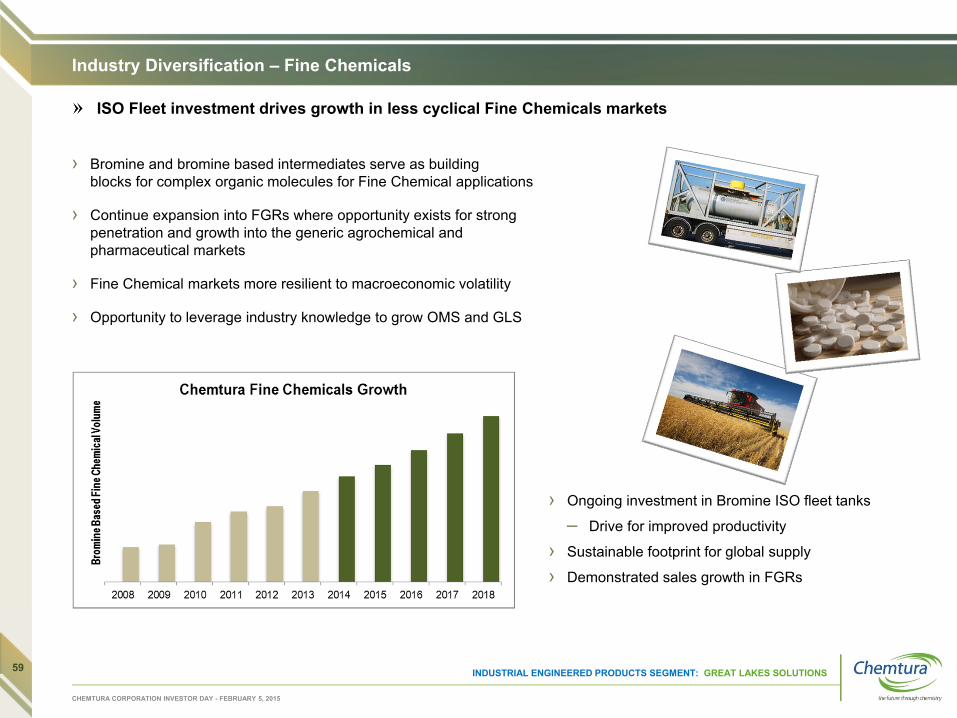
ISO Fleet investment drives growth in less cyclical Fine Chemicals markets
› Bromine and bromine based intermediates serve as building blocks for complex organic molecules for Fine Chemical applications
› Continue expansion into FGRs where opportunity exists for strong penetration and growth into the generic agrochemical and pharmaceutical markets
› Fine Chemical markets more resilient to macroeconomic volatility
› Opportunity to leverage industry knowledge to grow OMS and GLS
› Ongoing investment in Bromine ISO fleet tanks
‒ Drive for improved productivity
› Sustainable footprint for global supply
› Demonstrated sales growth in FGRs
INDUSTRIAL ENGINEERED PRODUCTS SEGMENT: GREAT LAKES SOLUTIONS59

Industry Diversification – Oil and Gas
CHEMTURA CORPORATION INVESTOR DAY - FEBRUARY 5, 2015
International growth opportunity reduces Gulf of Mexico dependence
Growth Drivers:
› Deep-water Completion / Fracking Fluids
› Shale Oil and Natural Gas
› Work-over Fluids
› Overall Global Growth 4 - 6%
› Deep-water / Ultra-Deep-water up to 10 - 12%
› Current Oil Market Price - offshore activity impacts with supply/demand balance
Source: IHS Petrodata RigBase
INDUSTRIAL ENGINEERED PRODUCTS SEGMENT: GREAT LAKES SOLUTIONS60
Industry Diversification – Utilities
CHEMTURA CORPORATION INVESTOR DAY - FEBRUARY 5, 2015
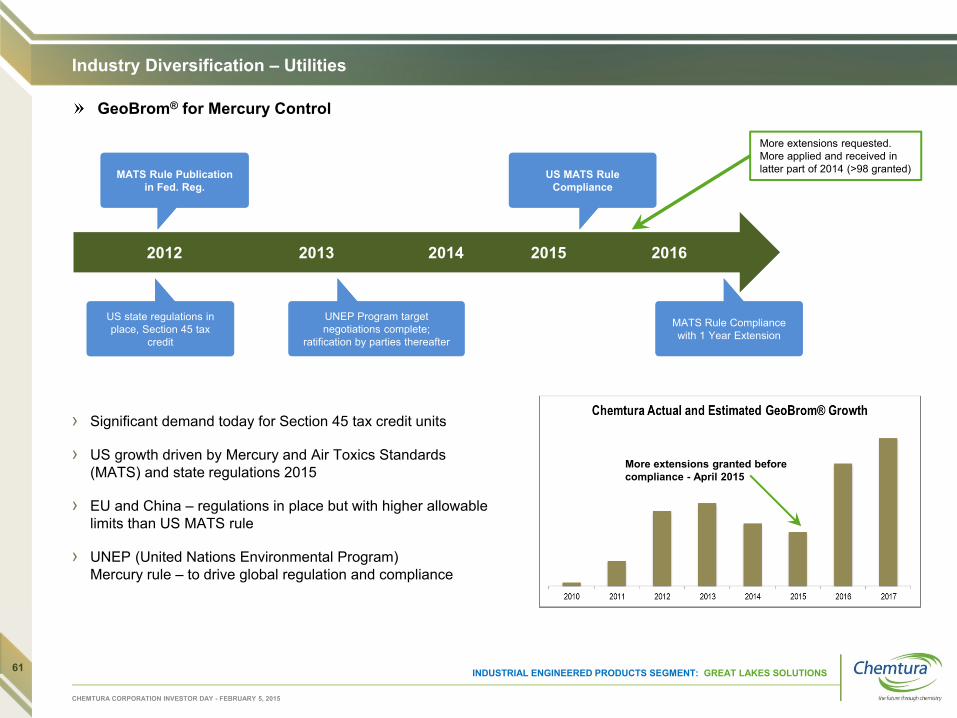
GeoBrom® for Mercury Control
› Significant demand today for Section 45 tax credit units
› US growth driven by Mercury and Air Toxics Standards (MATS) and state regulations 2015
› EU and China – regulations in place but with higher allowable limits than US MATS rule
› UNEP (United Nations Environmental Program) Mercury rule – to drive global regulation and compliance
2012 2013 2014 2015 2016
MATS Rule Publication in Fed. Reg.
MATS Rule Compliance with 1 Year Extension
US MATS Rule Compliance
UNEP Program target negotiations complete;
ratification by parties thereafter
US state regulations in place, Section 45 tax
credit
More extensions granted before compliance - April 2015
More extensions requested.More applied and received in latter part of 2014 (>98 granted)
INDUSTRIAL ENGINEERED PRODUCTS SEGMENT: GREAT LAKES SOLUTIONS61
Mercury Control Estimated Total Bromine Demand
CHEMTURA CORPORATION INVESTOR DAY - FEBRUARY 5, 2015
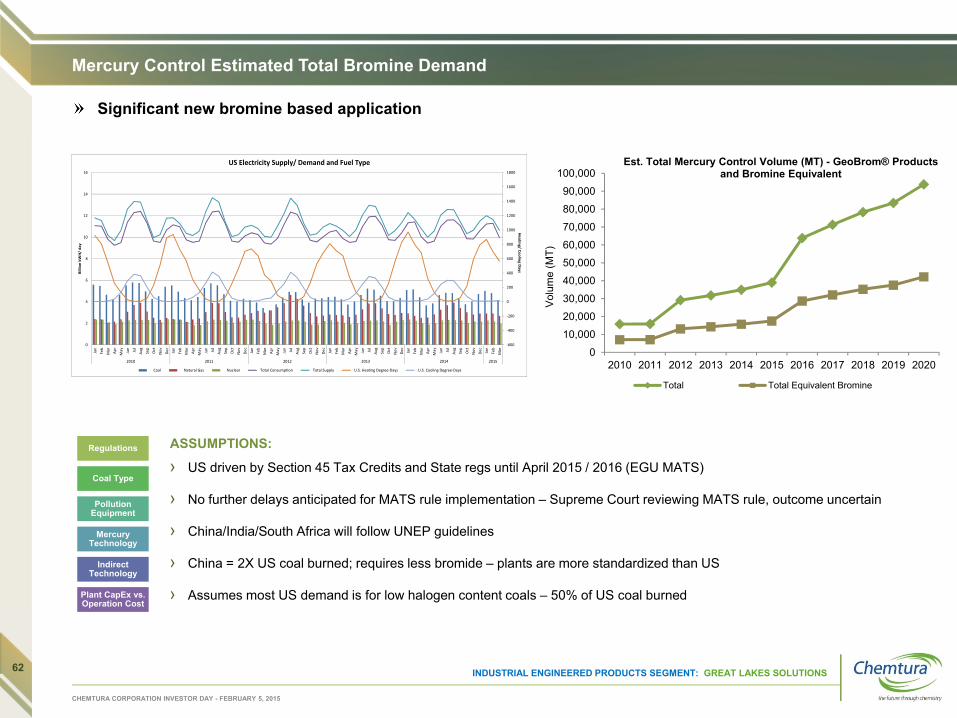
Significant new bromine based application
Regulations
Coal Type
Pollution Equipment
Mercury Technology
Indirect Technology
Plant CapEx vs. Operation Cost
0
10,000
20,000
30,000
40,000
50,000
60,000
70,000
80,000
90,000
100,000
2010 2011 2012 2013 2014 2015 2016 2017 2018 2019 2020
Vol
ume
(MT)
Est. Total Mercury Control Volume (MT) - GeoBrom® Products and Bromine Equivalent
Total Total Equivalent Bromine
ASSUMPTIONS:
› US driven by Section 45 Tax Credits and State regs until April 2015 / 2016 (EGU MATS)
› No further delays anticipated for MATS rule implementation – Supreme Court reviewing MATS rule, outcome uncertain
› China/India/South Africa will follow UNEP guidelines
› China = 2X US coal burned; requires less bromide – plants are more standardized than US
› Assumes most US demand is for low halogen content coals – 50% of US coal burned
‐600
‐400
‐200
0
200
400
600
800
1000
1200
1400
1600
1800
0
2
4
6
8
10
12
14
16
Jan
Feb
Mar
Apr
May Jun Jul
Aug
Sep
Oct
Nov Dec Jan
Feb
Mar
Apr
May Jun Jul
Aug
Sep
Oct
Nov Dec Jan
Feb
Mar
Apr
May Jun Jul
Aug
Sep
Oct
Nov Dec Jan
Feb
Mar
Apr
May Jun Jul
Aug
Sep
Oct
Nov Dec Jan
Feb
Mar
Apr
May Jun Jul
Aug
Sep
Oct
Nov Dec Jan
Feb
Mar
2010 2011 2012 2013 2014 2015
Heating/ Cooling D
ays
Billion
kWH/ da
y
US Electricity Supply/ Demand and Fuel Type
Coal Natural Gas Nuclear Total Consumption Total Supply U.S. Heating Degree‐Days U.S. Cooling Degree‐Days
INDUSTRIAL ENGINEERED PRODUCTS SEGMENT: GREAT LAKES SOLUTIONS62

Innovation
CHEMTURA CORPORATION INVESTOR DAY - FEBRUARY 5, 2015
Proactive innovation continues to drive a stronger, more sustainable flame retardant portfolio
Emerald Innovation™ 3000› U.S. EPA DfE “…safer substitute”› Successful launch into growing EPS and XPS
insulation market ahead of formal regulations › Continued process improvements for capacity and
efficiency
Next Generation for Flexible Foam› Reactive solution for flexible PU foam› Non-emissive, non-scorching additive › Compliant with TB117-2013 and SB-1019 rules in
California
Next Generation for Connectors› Product platform for PBT and polyamide› Halogen free in response to market demands› Highest performance for thin walled parts
INDUSTRIAL ENGINEERED PRODUCTS SEGMENT: GREAT LAKES SOLUTIONS63

Fire Safety and Flame Retardant Advocacy
CHEMTURA CORPORATION INVESTOR DAY - FEBRUARY 5, 2015
Dispelling myths on flame retardants and participating in fire safety policy developments
› Potential backslide in CA has motivated NFPA and CPSC to act on furniture.
› Activity at a state level on school bus fire safety development
ABICHAMA supporting regulators, fire service officials on new standards for B&C and furniture
› Implementation of new national standard, now includes insulation foam
› Supporting officials in TV and bus standards
New group established to educate officials and industry
EFRA and “The Fire Safety Platform” working with stakeholders on furniture and TV fire safety
High Fire Safety Regulation
Little or No Fire Safety Regulation
Positive Recent Trends
Moderate Safety Regulation
Fire Safety Standards are Essential to Modern Life!
Flame retardants are an effective, reliable and economical way to meet fire safety codes
Flame Retardants Work!
Over a decade of innovation has led to a sound, sustainable portfolio of products
Flame Retardants Are Extensively Tested!
INDUSTRIAL ENGINEERED PRODUCTS SEGMENT: GREAT LAKES SOLUTIONS64

Leveraging Capabilities Across Chemtura
CHEMTURA CORPORATION INVESTOR DAY - FEBRUARY 5, 2015
Differentiated growth strategy
Marketing-led and value-based innovation
Excellence in global supply chain capability
Footprint optimization
Reduced operational complexity and cost
Customer segmentation and
business rules
Optimized working capital
Margin management process
Using Chemtura’s scale as an advantage – connecting and capturing synergy value
Application diversification
Participation in growth trends
Integrated business approach
Operational excellence
Commercial excellence
Integrated Chemtura approach
Global footprint optimization
Managing for Value focus
Consolidated business team
Customer segmentation
Sales channel management
Differentiated business rules
The New Chemtura
Global Technology Center
Dedicated marketing
Connected organization
Leverage Chemtura approach
Process optimization
Tools and capabilities
Synergy value capture
Leverage Chemtura talents
Career development
Disruptive innovation
Implementation discipline
Strategy Process and PeopleStructure
Bromine & Derivatives Global Business Unit
Local market coverage with global connectivity
Differentiated sales channel management
Connected technology centers of excellence
INDUSTRIAL ENGINEERED PRODUCTS SEGMENT: GREAT LAKES SOLUTIONS65

Phase I: 2009 - 2011› US Footprint Restructure to
reduce capital intensity
› >$150M to upgrade bromine and brine infrastructure.
› Flexible sourcing deal for cyclical FR products
› ISO Fleet Expansion
Phase II : 2011-2013› Investment in less cyclical new
product assets
› Flexible Clear Brine Fluid Sourcing Deal
› Further ISO fleet expansion
› Acquisition of ISO maintenance capability
› Cost-out
Phase III : 2013 - 2018› Reducing capital intensity
› Responsible sustaining capital investment
› Continuous Cost Reduction Focus
› Supply Chain Optimization
› Footprint Optimization
› Portfolio leadership with Emerald InnovationTM 3000
Operational Excellence
CHEMTURA CORPORATION INVESTOR DAY - FEBRUARY 5, 2015
Focus on reduced capital intensity, fixed costs reduction and flexible and reliable supply
SUSTAIN GROW DIVERSIFY
INDUSTRIAL ENGINEERED PRODUCTS SEGMENT: GREAT LAKES SOLUTIONS66
Commercial Excellence
CHEMTURA CORPORATION INVESTOR DAY - FEBRUARY 5, 2015
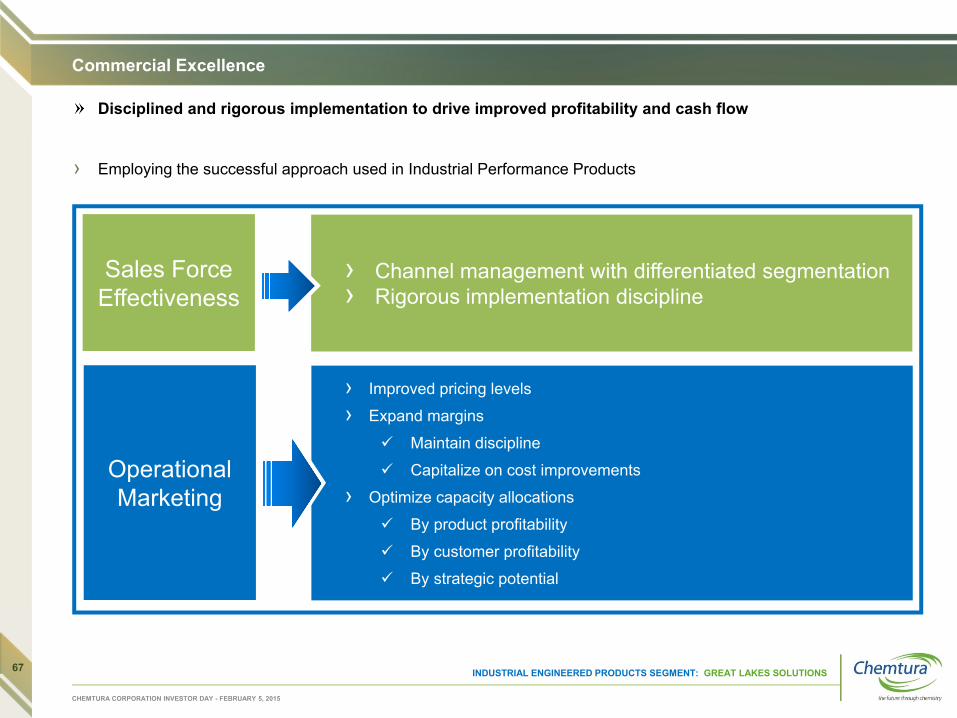
Disciplined and rigorous implementation to drive improved profitability and cash flow
Sales Force Effectiveness
Operational Marketing
› Channel management with differentiated segmentation› Rigorous implementation discipline
› Improved pricing levels
› Expand margins
Maintain discipline
Capitalize on cost improvements
› Optimize capacity allocations
By product profitability
By customer profitability
By strategic potential
› Employing the successful approach used in Industrial Performance Products
INDUSTRIAL ENGINEERED PRODUCTS SEGMENT: GREAT LAKES SOLUTIONS67
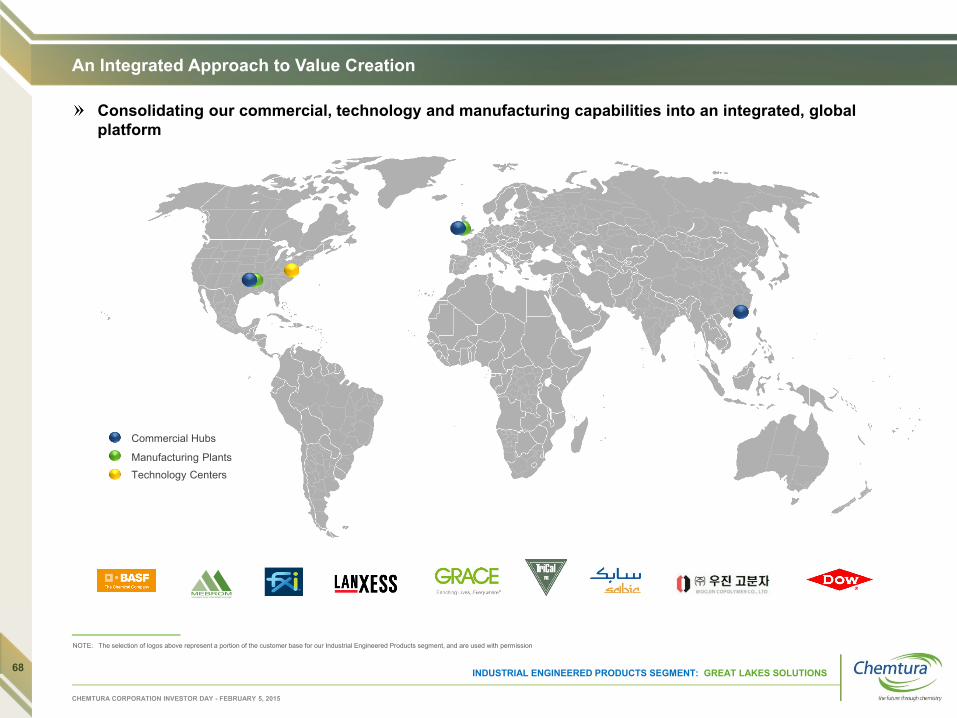
An Integrated Approach to Value Creation
CHEMTURA CORPORATION INVESTOR DAY - FEBRUARY 5, 2015
Consolidating our commercial, technology and manufacturing capabilities into an integrated, global platform
Commercial Hubs
Manufacturing PlantsTechnology Centers
NOTE: The selection of logos above represent a portion of the customer base for our Industrial Engineered Products segment, and are used with permission
INDUSTRIAL ENGINEERED PRODUCTS SEGMENT: GREAT LAKES SOLUTIONS68

Industrial Engineered Products Strategic Plan
CHEMTURA CORPORATION INVESTOR DAY - FEBRUARY 5, 2015
Growth at sustainable profitability levels
INDUSTRIAL ENGINEERED SEGMENT
2014 A Price Vol / Mix Cost -COGS
Cost -SG&A
FX / Other 2015 B Price Vol / Mix Cost -COGS
Cost -SG&A
2018 LRF
› Cost improvement actions underpin the path to our 2015 projections › The 2015 pricing environment is cautiously optimistic
Preliminary2018
Note: 2014 is preliminary and unaudited69

Chet CrossExecutive Vice President, Supply Chain and Operations
Operational Cost-Out Update
70

Safety Performance
OPERATIONAL COST-OUT UPDATE
CHEMTURA CORPORATION INVESTOR DAY - FEBRUARY 5, 2015
Safety by the Numbers
Safety performance ranked in the top 25% of similar-sized member companies of the American Chemistry Council®
Twelve facilities received 2014 Responsible Care® Certificate of Excellence Awards
Fords, Perth Amboy and East Hanover facilities received the 2014 New Jersey Governor’s Award for no lost time injuries
East Hanover and Fords facilities received the 2014 Environmental Stewardship Award by the New Jersey Department of Environmental Protection
Perth Amboy facility received the 2014 ACC RC14001 Facility Safety Award
Rio Claro, Brazil facility celebrated 15 years without a recordable injury
Gastonia facility received the 2014 Gold Award for Safety Performance by North Carolina Department of Labor
71

Organization Design – Streamlined and Efficient
CHEMTURA CORPORATION INVESTOR DAY - FEBRUARY 5, 2015
Supply Chain & Operations
ManufacturingEurasia
ManufacturingAmericas
Procurement Americas
Procurement Eurasia
Engineering/ Capital/Facilities
Supply ChainGlobal
Regulatory Global
EH&S Global
OPERATIONAL COST-OUT UPDATE72
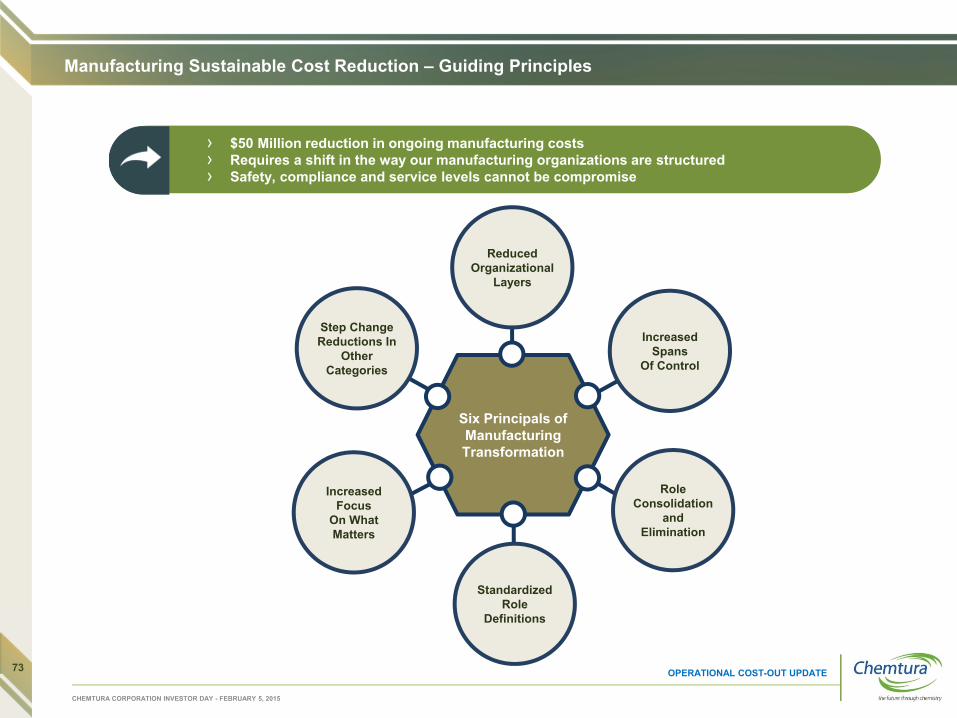
Six Principals of Manufacturing Transformation
Manufacturing Sustainable Cost Reduction – Guiding Principles
CHEMTURA CORPORATION INVESTOR DAY - FEBRUARY 5, 2015
› $50 Million reduction in ongoing manufacturing costs› Requires a shift in the way our manufacturing organizations are structured› Safety, compliance and service levels cannot be compromise
Increased Spans
Of Control
ReducedOrganizational
Layers
Role Consolidation
and Elimination
Standardized Role
Definitions
Increased Focus
On What Matters
Step Change Reductions In
Other Categories
OPERATIONAL COST-OUT UPDATE73

Manufacturing Sustainable Cost Reductions: Cost-Out Schedule 2015
CHEMTURA CORPORATION INVESTOR DAY - FEBRUARY 5, 2015
Manufacturing Costs
$50M Cost-Out
Q4Q3Q2Q1
Cadence of expected $50M Cost Reductions
2015
COST SAVING INITIATIVES WELL UNDERWAY AND WILL ACCELERATE AS WE MOVE THROUGH 2015
OPERATIONAL COST-OUT UPDATE74

Manufacturing Sustainable Cost Reduction – The Process – Where We Are
Define Targets and Operating Guidelines
Achieve $50MM actual bottom line run rate savings by 4Q 2015 ($40MM minimum in 2015)
All savings efforts must be transparent, trackable, verified and directly tied to EBITDA growth.
Gain Alignment within Organization
Establish alignment on savings areas of focus
Work through an established process for the organizational changes
Compile global summary of external contractor data and challenge status quo
Execute our Transformation
Plant-by-plant COGS targets rolling up to $50MM has been cascaded and included in the overall business plans.
Weekly performance reviews between manufacturing directors and sites will ensure delivery of the commitments.
Yield savings initiatives will be formally documented & reviewed post-implementation to ensure targeted benefits are realized and tracked on a monthly basis.
Continuous improvement plans with savings identified.
We will take the appropriate action to meet sustainable cost reductions.
CHEMTURA CORPORATION INVESTOR DAY - FEBRUARY 5, 2015
OPERATIONAL COST-OUT UPDATE75

Facility Reductions Since 2009
CHEMTURA CORPORATION INVESTOR DAY - FEBRUARY 5, 2015
OPERATIONAL COST-OUT UPDATE
-
5
10
15
20
25
30
35
40
45
50
2009 New Facilities PVC AO/UV Consumer ChemturaAgroSolutions
Other FacilityClosures
PlannedClosures
2016
Num
ber o
f Fac
ilitie
s
RATIONALIZING GLOBAL MANUFACTURING FOOTPRINT RESULTS IN SUSTAINABLE COST SAVINGS
76

Procurement Initiatives
Procurement “Cost-Out Acceleration Initiative” is yielding results
July Aug Oct Nov Dec 2015
Wave 3 savingsCapability Implementation
2015 Focus Remains Razor Sharp
› Capitalizing on momentum started in 2014 with aggressive 2015 targets that exceed chemical industry benchmark as percentage of total spend
› Executing on expanded portfolio of cost-out opportunities across a range of categories
› Enhancing capabilities of the organization through skillset development
› Driving both consumption control and unit cost savings
› Implementing progressive contract structures that deliver year-over-year savings
› Institutionalizing use of new tools such as e-catalog platform
Wave 2 savingsWave 1 savings
Sep Feb
CHEMTURA CORPORATION INVESTOR DAY - FEBRUARY 5, 2015
OPERATIONAL COST-OUT UPDATE77

Stephen ForsythExecutive Vice President and Chief Financial Officer
Financial Performance and Outlook
78

Financial Performance Summary (Managed Basis)
Financial results “as reported” – 2014 are unaudited preliminary data
Adjusted EBITDA(1)Net Sales
Capital Expenditures Adjusted EBITDA less CapEx
( $ in Millions ) ( $ in Millions and % of Net Sales )
( $ in Millions ) ( $ in Millions )
(1) See reconciliation to GAAP and Preliminary in appendix for components of Adjusted EBITDA. (Excluding expenses incurred in the Chemtura AgroSolutions sale process)
For details, see GAAP Reconciliation in Appendix and press release issued on February 4, 2015
CHEMTURA CORPORATION INVESTOR DAY - FEBRUARY 5, 2015
$2,196 $2,231 $2,184
$1,600
$1,800
$2,000
$2,200
$2,400
2012 2013 2014 Preliminary
149$170
$113
$0
$50
$100
$150
$200
2012 2013 2014 Preliminary
$313 $281 $262
14.3%12.6% 12.0%
$0
$100
$200
$300
$400
$500
$600
2012 2013 2014 Preliminary
$164
$111
$149
$0
$50
$100
$150
$200
2012 2013 2014 Preliminary
FINANCIAL PERFORMANCE AND OUTLOOK79

$107
$173 $185
$99
$63
14.7%
19.9% 20.6%
12.3%
7.9%
2010 2011 2012 2013 2014Preliminary
$134 $145
$129 $140 $141
16.0% 15.4% 14.5% 14.3% 14.3%
2010 2011 2012 2013 2014Preliminary
2010 - 2014 Managed Basis Segment Adjusted EBITDA(1) Trend
Industrial Performance Products
$ in millions and % of Net Sales
Industrial Engineered Products
Petroleum Additives and Urethanes› The relatively flat performance trend masks (due to investing in change
and higher fixed costs associated with capital projects) the transformation the business has undertaken in the last two years
› Have invested in the business team, business processes and execution skills to lay the foundation for revenue and margin growth
› Significant capacity expansion in HVPAO, Inhibitors and in China supports increasing customer demand
› The secular trends of the substitution of traditional lubricants with synthetics and regulation driving lower emissions and higher MPG remain robust
Great Lakes Solutions and Organometallics› Excess industry capacity in bromine and organometallic
polymerization catalysts has depressed selling prices and performance in 2013 and 2014 – we are not relying on a recovery in 2015
› Substantial benefit in 2015 from manufacturing and SG&A cost reductions
› Great Lakes Solutions continuing diversification from electronics through growth from insulation foam, mercury control and intermediates applications
› Organometallics expects growth from all applications except TEA
CHEMTURA CORPORATION INVESTOR DAY - FEBRUARY 5, 2015
FINANCIAL PERFORMANCE AND OUTLOOK
(1) See reconciliation to GAAP and Preliminary in appendix for components of Adjusted EBITDA
2014 Adjusted EBITDA computed from unaudited, preliminary data
EXPECT TO START TO REVERSE THESE TRENDS IN 2015 LED BY COST REDUCTION
80

Adjusted Financial Performance Summary (Managed Basis)
Financial results adjusted to exclude Chemtura AgroSolutions, Platform Specialty Products Supply Agreements (2014 only) and expenses incurred in the process to divest the business. 2014 based on preliminary and unaudited data
Adjusted EBITDA(1)Net Sales
Capital Expenditures(2) Adjusted EBITDA less CapEx
( $ in Millions ) ( $ in Millions and % of Net Sales )
( $ in Millions ) ( $ in Millions )
(1) See reconciliation to GAAP, Preliminary and Adjusted in appendix for components of Adjusted EBITDA(2) Excludes capital expenditures of Antioxidants business, Consumer Products and Chemtura AgroSolutions segments
CHEMTURA CORPORATION INVESTOR DAY - FEBRUARY 5, 2015
$1,787 $1,782 $1,787
$1,200
$1,400
$1,600
$1,800
$2,000
2012 2013 2014 Preliminary
$131 $150
$109
$0
$50
$100
$150
$200
2012 2013 2014 Preliminary
$234 $180 $173
13.1%
10.1% 9.7%
$0
$100
$200
$300
$400
2012 2013 2014 Preliminary
$103
$30
$64
$0
$50
$100
$150
2012 2013 2014 Preliminary
FINANCIAL PERFORMANCE AND OUTLOOK81

Managed Basis General Corporate Expense
A deeper dive – data extracted from tables provided in press release dated February 4, 2015
Corporate Expense› Corporate Expenses consists of stewardship (public company cost and
corporate management) and legacy costs (pension expense and OPEBexpense, environmental oversight for former sites, etc.)
› Q4 14 expense lower than trend due to non-recurring income
› In 2014, included $18 million of expenses related to the process to divest theChemtura AgroSolutions business. Assume $2 million of expense in 2015
› All but $1 million of stranded costs associated with the former ConsumerProduct business had been eliminated prior to the start of 2014. Theremaining cost was eliminated by the end of Q1 2014
› As Chemtura AgroSolutions was not treated as a discontinued operation, theapproximately $15 million of annual stranded costs have not been reclassifiedto Corporate Expense. Plans being implemented that should eliminate thesecosts by the end of Q1 2015. Stranded costs incurred in Q1 2015 estimatedat $2 million
› The component if non-cash Stock Based Compensation incurred in CorporateExpense will be approximately $10 million in 2015. The first quarter expenseis always higher than the expense in the remaining quarters
2015 Outlook› Due to the lower discount rates used in the actuarial computation pension and OPEB liabilities as of December 31, 2014 compared to the
prior year and the adoption of the updated mortality tables, pension expense in 2015 will increase by approximately $6 million. Cash fundingof pension and OPEB obligations will continue to trend down in 2015 despite the change in the actuarial assumptions and book expense
› Reflecting this increased expense and eliminating a non-recurring gain in 2014, Corporate Expense in 2015 on an Adjusted EBITDA basiswill be in the order of $40 million and $65 million on an Operating Income basis
$ Millions Prelim.2014 FY
Adjusted 2014 FY
Expense (Adjusted EBITDA basis) excluding sale process expenses
$31 $31
Chemtura AgroSolutions saleprocess expenses 18 -
Expense (Adjusted EBITDA) $49 $31
Depreciation & Amortization 16 16
Non-Cash Stock Based Compensation 11 11
Expense (Operating Income) $76 $58
CHEMTURA CORPORATION INVESTOR DAY - FEBRUARY 5, 2015
FINANCIAL PERFORMANCE AND OUTLOOK
Note: 2014 is preliminary and unaudited
82
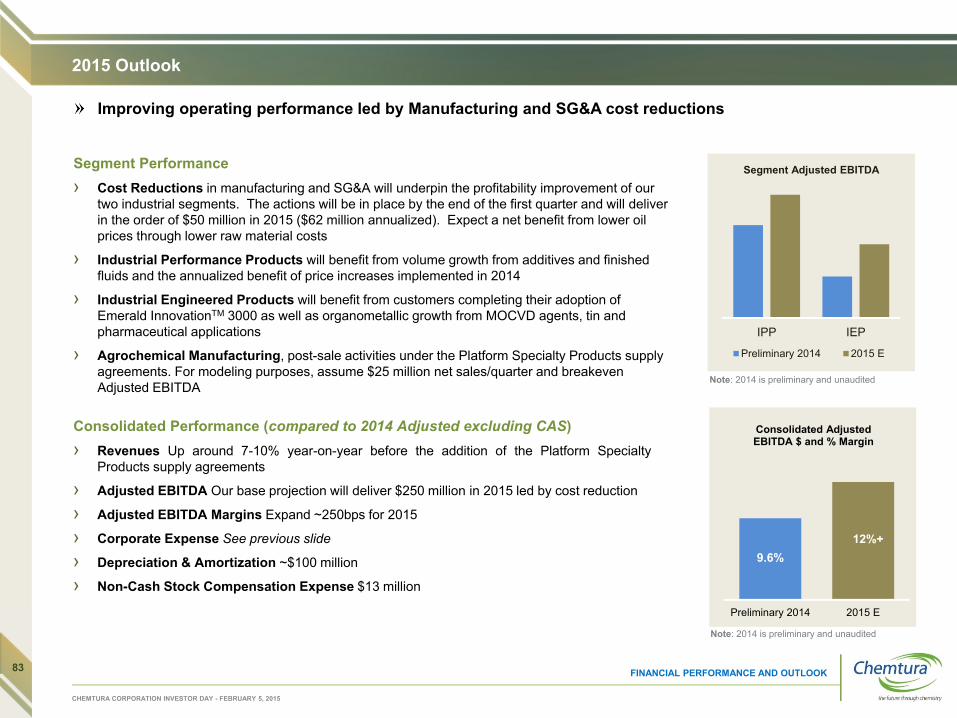
2015 Outlook
Improving operating performance led by Manufacturing and SG&A cost reductions
Segment Performance› Cost Reductions in manufacturing and SG&A will underpin the profitability improvement of our
two industrial segments. The actions will be in place by the end of the first quarter and will deliver in the order of $50 million in 2015 ($62 million annualized). Expect a net benefit from lower oil prices through lower raw material costs
› Industrial Performance Products will benefit from volume growth from additives and finished fluids and the annualized benefit of price increases implemented in 2014
› Industrial Engineered Products will benefit from customers completing their adoption of Emerald InnovationTM 3000 as well as organometallic growth from MOCVD agents, tin and pharmaceutical applications
› Agrochemical Manufacturing, post-sale activities under the Platform Specialty Products supply agreements. For modeling purposes, assume $25 million net sales/quarter and breakeven Adjusted EBITDA
IPP IEP
Segment Adjusted EBITDA
Preliminary 2014 2015 E
9.6%12%+
Preliminary 2014 2015 E
Consolidated Adjusted EBITDA $ and % Margin
Consolidated Performance (compared to 2014 Adjusted excluding CAS)› Revenues Up around 7-10% year-on-year before the addition of the Platform Specialty
Products supply agreements
› Adjusted EBITDA Our base projection will deliver $250 million in 2015 led by cost reduction
› Adjusted EBITDA Margins Expand ~250bps for 2015
› Corporate Expense See previous slide
› Depreciation & Amortization ~$100 million
› Non-Cash Stock Compensation Expense $13 million
CHEMTURA CORPORATION INVESTOR DAY - FEBRUARY 5, 2015
FINANCIAL PERFORMANCE AND OUTLOOK
Note: 2014 is preliminary and unaudited
83
Note: 2014 is preliminary and unaudited

Improving Free Cash Flow
Reduction in uses of cash continues
Annual Cash Expenditures
› Cash interest expense has declined due to the 2013 re-financing together with the call of the stub of the 2018 Notes and the repayment of debt made from divestiture net proceeds
› Growth capital project spending has declined as major projects completed and we drive for returns from what we have invested
› Requirements for cash contributions to pension plans is declining as funding levels rise
$ Millions 2011 2012 2013Prelim2014 2015 E
Low High
Cash Interest 57 58 57 46 30 34
Capital Expenditures 154 149 170 113 85 95
Pension & OPEB Cash Contributions 94 91 57 49 40 45
CHEMTURA CORPORATION INVESTOR DAY - FEBRUARY 5, 2015
FINANCIAL PERFORMANCE AND OUTLOOK
CASH SPENDING ON THESE ITEMS HAS REDUCED SIGNIFICANTLY IN 2014 AND WILL CONTINUE TO DECLINE IN 2015, AIDING OUR DELIVERY OF FREE CASH FLOW IN THE YEAR
Note: 2014 is preliminary and unaudited
84

Maintaining a Strong Balance Sheet
HAVE LOWERED COST OF DEBT AND INCREASED FINANCIAL FLEXIBILITY
$0
$200
$400
$600
$800
$1,000
2012 2013 2014 2015E$0
$20
$40
$60
$80
2012 2013 2014 2015E$0
$100
$200
$300
$400
$500
2016 2018 2021
Outstanding Debt Interest Expense Maturity Profile
$82M Senior Secured Term
Loan
$250M ABL(Undrawn)
$450M 5.75% Senior Notes
CHEMTURA CORPORATION INVESTOR DAY - FEBRUARY 5, 2015
› Long term gross leverage target remains 2X Adjusted EBITDA – will move back to these levels as Industrial Engineered Products Adjusted EBITDA recovers
› Over $500 million of available liquidity including undrawn $250 million Asset Based Revolver
› Flexible debt covenants and full access to Capital Markets
NOTE: 2014 is preliminary and unaudited
FINANCIAL PERFORMANCE AND OUTLOOK85
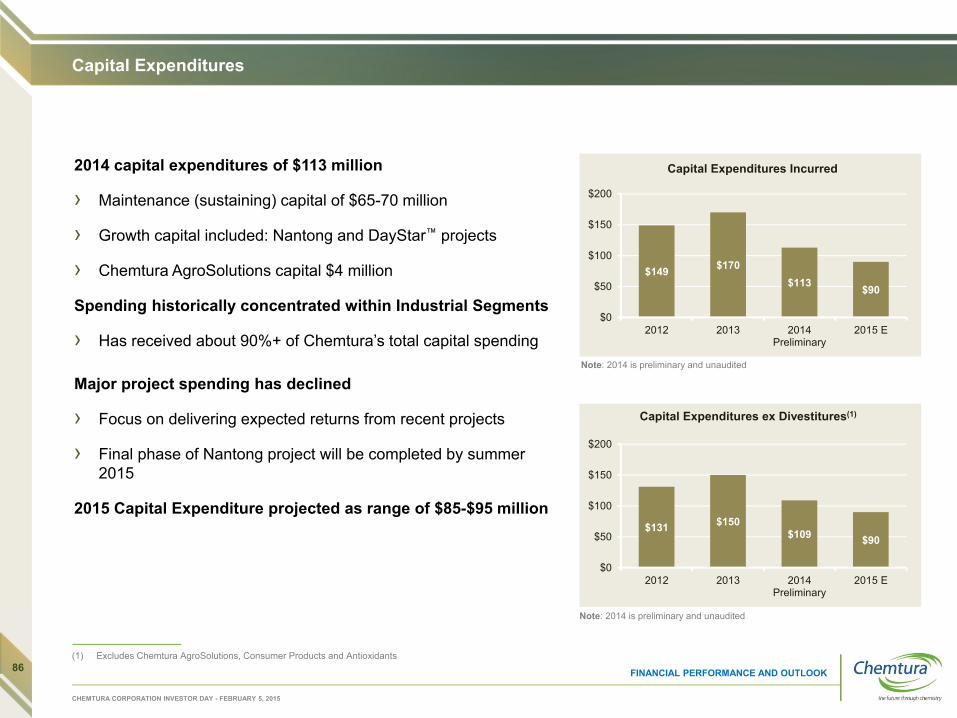
Capital Expenditures
2014 capital expenditures of $113 million
› Maintenance (sustaining) capital of $65-70 million
› Growth capital included: Nantong and DayStar™ projects
› Chemtura AgroSolutions capital $4 million
Spending historically concentrated within Industrial Segments
› Has received about 90%+ of Chemtura’s total capital spending
Major project spending has declined
› Focus on delivering expected returns from recent projects
› Final phase of Nantong project will be completed by summer 2015
2015 Capital Expenditure projected as range of $85-$95 million
$149 $170$113 $90
$0
$50
$100
$150
$200
2012 2013 2014Preliminary
2015 E
Capital Expenditures Incurred
$131 $150$109 $90
$0
$50
$100
$150
$200
2012 2013 2014Preliminary
2015 E
Capital Expenditures ex Divestitures(1)
CHEMTURA CORPORATION INVESTOR DAY - FEBRUARY 5, 2015
FINANCIAL PERFORMANCE AND OUTLOOK
(1) Excludes Chemtura AgroSolutions, Consumer Products and Antioxidants
Note: 2014 is preliminary and unaudited
Note: 2014 is preliminary and unaudited
86

Pension Liability Management
› Decrease in interest rates in 2014 is driving discount rates lower, increasing liability
› U.S. liabilities reflect an 8% increase due to new mortality assumptions released by the Society of Actuaries
› Assets delivered returns in excess of expected rate of return assumptions
› U.S. Terminated Vested Lump Sum program was successful at eliminating $52 million of PBO
› Approximately $90 million of net Pension liabilities has been transferred with divestitures
› Unfunded Pension / OPEB as % of market capitalization expected to decrease from ~30% (2011) to ~14% in 2014
› Annual Pension / OPEB cash contributions expected to be $40 to $45 million in 2015
$464 $479
$235$277
$0
$200
$400
$600
2011 2012 2013 2014Preliminary
Pension and OPEB Liability
CHEMTURA CORPORATION INVESTOR DAY - FEBRUARY 5, 2015
FINANCIAL PERFORMANCE AND OUTLOOK
$94 $91
$57 $49 $42
$0
$20
$40
$60
$80
$100
2011 2012 2013 2014Preliminary
2015 E
Pension and OPEB Cash Contributions
LIABILITY DRIVEN ASSET MANAGEMENT REDUCES VOLATILITY AS FUNDING LEVELS IMPROVE
Note: 2014 is preliminary and unaudited Note: 2014 is preliminary and unaudited
87
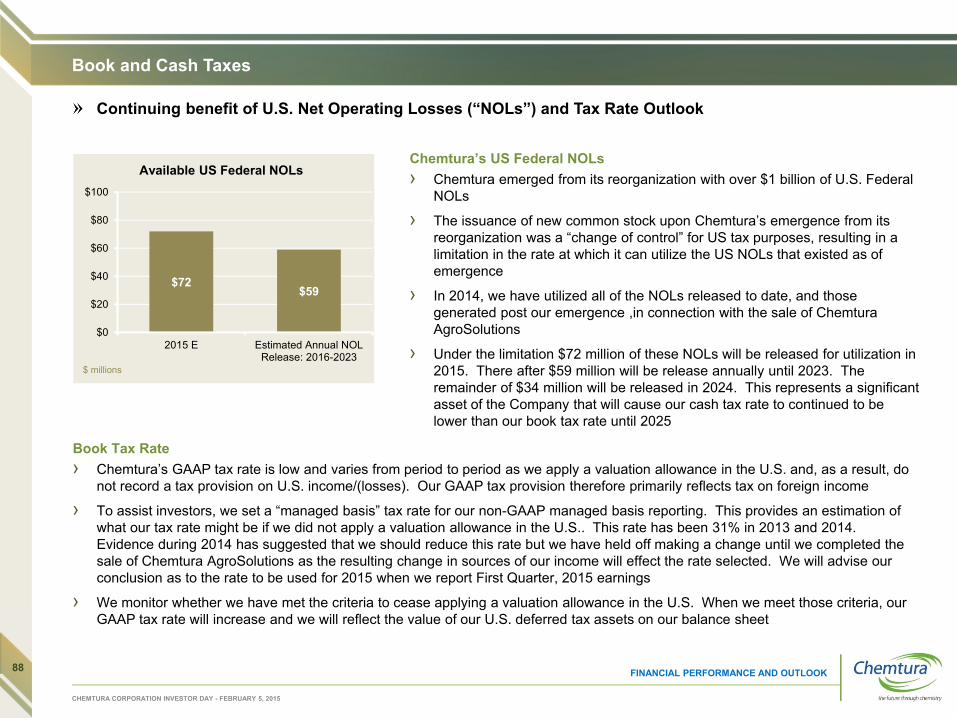
Book and Cash Taxes
Chemtura’s US Federal NOLs› Chemtura emerged from its reorganization with over $1 billion of U.S. Federal
NOLs
› The issuance of new common stock upon Chemtura’s emergence from its reorganization was a “change of control” for US tax purposes, resulting in a limitation in the rate at which it can utilize the US NOLs that existed as of emergence
› In 2014, we have utilized all of the NOLs released to date, and those generated post our emergence ,in connection with the sale of Chemtura AgroSolutions
› Under the limitation $72 million of these NOLs will be released for utilization in 2015. There after $59 million will be release annually until 2023. The remainder of $34 million will be released in 2024. This represents a significant asset of the Company that will cause our cash tax rate to continued to be lower than our book tax rate until 2025
$72$59
$0
$20
$40
$60
$80
$100
2015 E Estimated Annual NOLRelease: 2016-2023
Available US Federal NOLs
CHEMTURA CORPORATION INVESTOR DAY - FEBRUARY 5, 2015
Continuing benefit of U.S. Net Operating Losses (“NOLs”) and Tax Rate Outlook
FINANCIAL PERFORMANCE AND OUTLOOK
$ millions
Book Tax Rate› Chemtura’s GAAP tax rate is low and varies from period to period as we apply a valuation allowance in the U.S. and, as a result, do
not record a tax provision on U.S. income/(losses). Our GAAP tax provision therefore primarily reflects tax on foreign income
› To assist investors, we set a “managed basis” tax rate for our non-GAAP managed basis reporting. This provides an estimation ofwhat our tax rate might be if we did not apply a valuation allowance in the U.S.. This rate has been 31% in 2013 and 2014. Evidence during 2014 has suggested that we should reduce this rate but we have held off making a change until we completed the sale of Chemtura AgroSolutions as the resulting change in sources of our income will effect the rate selected. We will advise our conclusion as to the rate to be used for 2015 when we report First Quarter, 2015 earnings
› We monitor whether we have met the criteria to cease applying a valuation allowance in the U.S. When we meet those criteria, our GAAP tax rate will increase and we will reflect the value of our U.S. deferred tax assets on our balance sheet
88
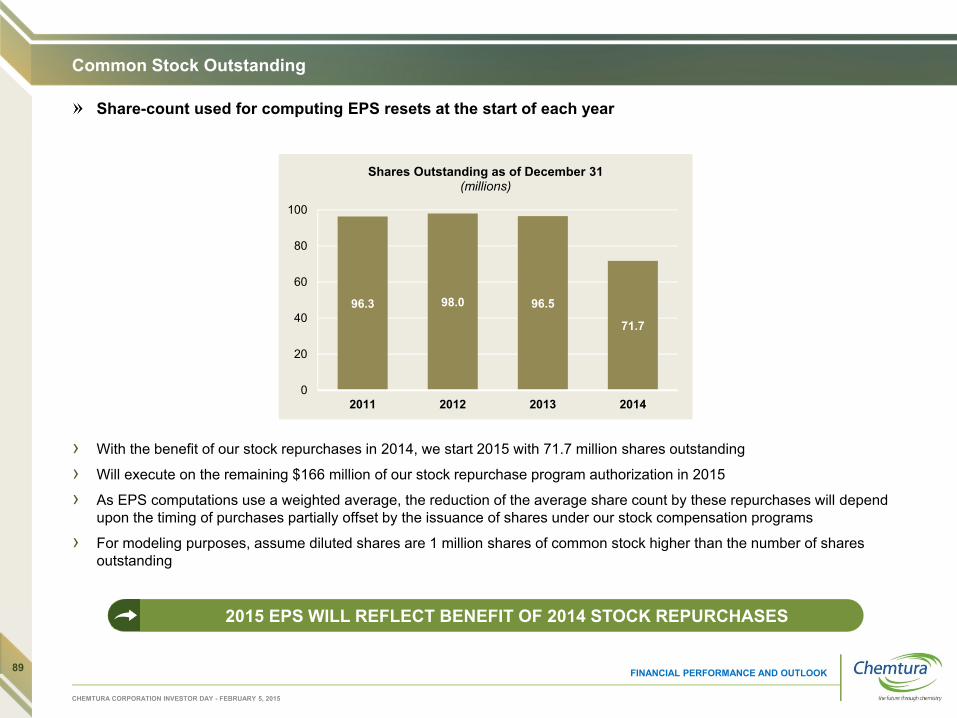
Common Stock Outstanding
96.3 98.0 96.5
71.7
0
20
40
60
80
100
2011 2012 2013 2014
Shares Outstanding as of December 31(millions)
2015 EPS WILL REFLECT BENEFIT OF 2014 STOCK REPURCHASES
CHEMTURA CORPORATION INVESTOR DAY - FEBRUARY 5, 2015
FINANCIAL PERFORMANCE AND OUTLOOK
Share-count used for computing EPS resets at the start of each year
› With the benefit of our stock repurchases in 2014, we start 2015 with 71.7 million shares outstanding
› Will execute on the remaining $166 million of our stock repurchase program authorization in 2015
› As EPS computations use a weighted average, the reduction of the average share count by these repurchases will depend upon the timing of purchases partially offset by the issuance of shares under our stock compensation programs
› For modeling purposes, assume diluted shares are 1 million shares of common stock higher than the number of shares outstanding
89

Summary and Investment Thesis
Financial Outlook for “Pure Play” Industrial Portfolio
$1.8$2.5
0.0
1.0
2.0
3.0
2012 2018
Revenue Growth Target in $ Billions
13%
2012 2018
Adjusted EBITDA Margin Targets
Approaching20%
› A sharper, more focused, specialty chemicals company
› Leading positions in portfolio of global specialty chemicals businesses serving diverse end-markets
› Each segment benefits from strong secular growth trends that they can address through their technologies
› Driving growth and differentiation through product and application innovation
› Emphasis on driving meeting our long standing goals for margin expansion and building free cash flow
› Focus on continuous improvement
› Experienced management team
CHEMTURA CORPORATION INVESTOR DAY - FEBRUARY 5, 2015
FINANCIAL PERFORMANCE AND OUTLOOK90

Craig A. RogersonChairman, President and Chief Executive Officer
Summary and Q&A
91
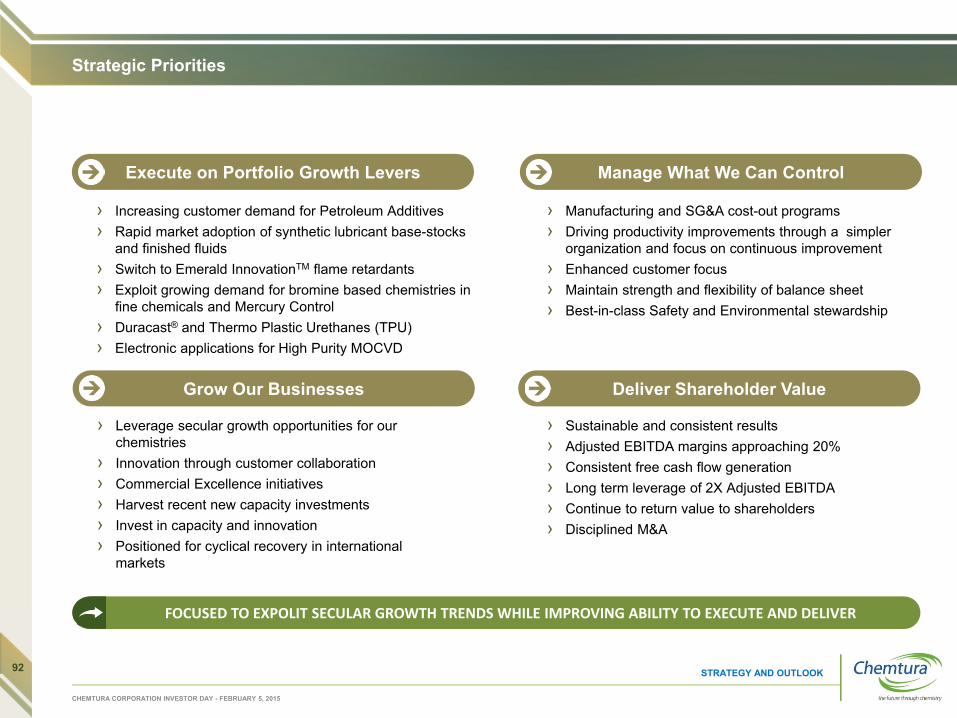
Execute on Portfolio Growth Levers
Strategic Priorities
› Increasing customer demand for Petroleum Additives › Rapid market adoption of synthetic lubricant base-stocks
and finished fluids› Switch to Emerald InnovationTM flame retardants› Exploit growing demand for bromine based chemistries in
fine chemicals and Mercury Control› Duracast® and Thermo Plastic Urethanes (TPU)› Electronic applications for High Purity MOCVD
FOCUSED TO EXPOLIT SECULAR GROWTH TRENDS WHILE IMPROVING ABILITY TO EXECUTE AND DELIVER
STRATEGY AND OUTLOOK
› Manufacturing and SG&A cost-out programs› Driving productivity improvements through a simpler
organization and focus on continuous improvement› Enhanced customer focus› Maintain strength and flexibility of balance sheet› Best-in-class Safety and Environmental stewardship
› Leverage secular growth opportunities for our chemistries
› Innovation through customer collaboration› Commercial Excellence initiatives› Harvest recent new capacity investments› Invest in capacity and innovation › Positioned for cyclical recovery in international
markets
› Sustainable and consistent results› Adjusted EBITDA margins approaching 20%› Consistent free cash flow generation› Long term leverage of 2X Adjusted EBITDA› Continue to return value to shareholders› Disciplined M&A
Grow Our Businesses
Manage What We Can Control
Deliver Shareholder Value
CHEMTURA CORPORATION INVESTOR DAY - FEBRUARY 5, 2015
92

Long Range Projections
2014 2015 2016 2017 2018
REVENUE GROWTH
2014 2015 2016 2017 2018
ADJUSTED EBITDA GROWTH
EXECUTION OF STRATEGIC PRIORITIES TO DRIVE SIGNIFICANT ADJUSTED EBITDA AND MARGIN GROWTH
2014 2015 2016 2017 2018
ADJUSTED EBITDA MARGIN GROWTH
CHEMTURA CORPORATION INVESTOR DAY - FEBRUARY 5, 2015
(1) 2014 data is preliminary and unaudited. it has been adjusted to exclude Chemtura AgroSolutions and expenses incurred in the process to sell the business93
Appendix
› Pro-Forma Capital Expenditures
› Pro-Forma Adjusted EBITDA
› GAAP Reconciliation
› GAAP Reconciliation by Segment
94

Computation of Capital Expenditures
Computation to exclude capital expenditure of the divested businesses and then for Chemtura AgroSolutions
APPENDIX
CHEMTURA CORPORATION INVESTOR DAY - FEBRUARY 5, 2015
Preliminary
($ in Millions) 2014 2013 2012 2011
Capital Expenditure 113$ 170$ 149 154 Less Capital Expenditure related to:Antioxidants Business - 4 7 6 Consumer Products Segement - 7 6 6
Capital Expenditure related to Continuing Operations 113$ 159$ 136$ 142$ Less:Chemtura AgroSolutions Capital Expenditures 6 7 5 6
Capital Expenditure related to Continuing Operations less Chemtura AgroSoltuions 107$ 152$ 131$ 136$
Year Ended December 31,
95

GAAP Reconciliation - Segments
Reconciliation of Segment Operating Income to Adjusted EBITDA
NOTE: 2014 preliminary and unaudited
APPENDIX
CHEMTURA CORPORATION INVESTOR DAY - FEBRUARY 5, 2015
Preliminary($ in Millions) 2014 2013 2012INDUSTRIAL PERFORMANCE PRODUCTSSegment Operating Income 106$ 109$ 102$ Depreciation and amortization 34 28 25 Stock-based compensation expense 1 1 2 Other Operating Adjustments - 2
Adjusted EBITDA 141$ 140$ 129$
INDUSTRIAL ENGINEERED PRODUCTSSegment Operating Income 16$ 55$ 140$ Depreciation and amortization 44 43 43 Stock-based compensation expense 1 1 2 Other Operating Adjustments 2 Adjusted EBITDA 63$ 99$ 185$
CHEMTURA AGROSOLUTIONS/AGROCHEMICAL MANUFACTURINGSegment Operating Income 80$ 88$ 65$ Depreciation and amortization 8 12 13 Stock-based compensation expense 1 1 1 Other Operating Adjustments -Adjusted EBITDA 89$ 101$ 79$
Year Ended
96

Reconciliation of Managed Basis Adjusted for CAS
Reconciliation of Managed Basis Adjusted for CAS to Managed Basis Segment Presentation
APPENDIX
CHEMTURA CORPORATION INVESTOR DAY - FEBRUARY 5, 2015
Year ended December 31, 2014 Year ended December 31, 2013 Year ended December 31, 2012Managed CAS Managed Basis Managed CAS Managed Basis Managed CAS Managed Basis
Basis Adjustments Adjusted for CAS Basis Adjustments Adjusted for CAS Basis Adjustments Adjusted for CAS
NET SALESIndustrial Performance Products 987$ -$ 987$ 979$ -$ 979$ 891$ -$ 891$ Industrial Engineered Products 800 - 800 803 - 803 896 - 896 Chemtura AgroSolutions 381 (381) - 449 (449) - 409 (409) - Agrochemical Manufacturing (1) 16 (16) - - - - - - -
Total net sales 2,184$ (397)$ 1,787$ 2,231$ (449)$ 1,782$ 2,196$ (409)$ 1,787$
OPERATING INCOMEIndustrial Performance Products 110$ -$ 110$ 111$ - 111$ 102 - 102 Industrial Engineered Products 18 - 18 55 - 55 140 - 140 Chemtura AgroSolutions 80 (80) - 88 (88) - 65 (65) -
Segment operating income 208$ (80)$ 128$ 254$ (88)$ 166$ 307$ (65)$ 242$
General corporate expense, including amortization (2) & (3) (75) 18 (57) (92) 8 (84) (116) 2 (114)
Total operating income 133$ (62)$ 71$ 162$ (80)$ 82$ 191$ (63)$ 128$
DEPRECIATION AND AMORTIZATIONIndustrial Performance Products 30$ -$ 30$ 28$ -$ 28$ 25$ -$ 25$ Industrial Engineered Products 44 - 44 43 - 43 43 - 43 Chemtura AgroSolutions 8 (8) - 12 (12) - 13 (13) - General corporate expense (2) 16 - 16 17 (2) 15 19 (2) 17 Total depreciation and amortization 98$ (8)$ 90$ 100$ (14)$ 86$ 100$ (15)$ 85$
NON-CASH STOCK-BASED COMPENSATION EXPENSEIndustrial Performance Products 1$ -$ 1$ 1$ -$ 1$ 2$ -$ 2$ Industrial Engineered Products 1 - 1 1 - 1 2 - 2 Chemtura AgroSolutions 1 (1) - 1 (1) - 1 (1) - General corporate expense 11 - 11 10 - 10 17 - 17 Total non-cash stock-based compensation expense 14$ (1)$ 13$ 13$ (1)$ 12$ 22$ (1)$ 21$
Adjusted EBITDA by Segment:Industrial Performance Products 141$ -$ 141$ 140$ -$ 140$ 129$ -$ 129$ Industrial Engineered Products 63 - 63 99 - 99 185 - 185 Chemtura AgroSolutions 89 (89) - 101 (101) - 79 (79) - General corporate expense (3) (48) 18 (30) (65) 6 (59) (80) - (80) Adjusted EBITDA 245$ (71)$ 174$ 275$ (95)$ 180$ 313$ (79)$ 234$
Notes:(1) Does not reflect the effect of the continuing product supply agreements to Platform Specialty Products or actual sales under these agreements(2) Excludes amortization expense related to the Chemtura AgroSolutions business(3) Excludes expenses incurred in the process to sell the Chemtura AgroSolutions business(4) Stranded costs related to the CAS business have not been added back in the presentation. Expect to have eliminated these costs in 2015
except for $2 million of expense in Q1 2015
97

Investor Relations
IR CONTACTS:
Matthew Sokol, Director, Investor RelationsDaniel Murray, Senior Investor Relations Analyst
Investor Relations Tel: 1.203.573.2153
http://investor.chemtura.com, or
http://www.chemtura.com
NYSE / EURONEXT: CHMT
CHEMTURA CORPORATION INVESTOR DAY - FEBRUARY 5, 2015
98