2014 salt lake city tact public awareness evaluation report
DESCRIPTION
Salt Lake City Corporation developed and implemented a high-visibility public awareness campaign in Salt Lake City. The campaign focused on unsafe, aggressive or distracted driving of passenger vehicles near and around commercial motor vehicles (CMVs) that are over 10,000 pounds. The goal of the campaign was to induce motorists to drive safely, thereby reducing traffic accidents and injuries. It additionally sought to raise the public awareness of potential dangers of driving near CMVs on Salt Lake City roadways, including the risk of a citation and serious personal injury.Phase II research was intended to measure the effectiveness of this campaign by asking drivers in the campaign target area if they had seen the campaign, what message(s) they heard and remember, and if they believed it made any impact on themselves and other drivers in Salt Lake City. A total of 301 Salt Lake City drivers were surveyed for this Phase II research.TRANSCRIPT

Staples Marketing I Staples Marketing – Salt Lake City Phase II Research Report I 05.13.14
1
Salt Lake City TACT Campaign
Post-Implementation Online Surveys - Conducted in May, 2014
I. BACKGROUND AND PURPOSE
Salt Lake City Corporation developed and implemented a high-visibility public awareness campaign
in Salt Lake City. The campaign focused on unsafe, aggressive or distracted driving of passenger
vehicles near and around commercial motor vehicles (CMVs) that are over 10,000 pounds. The
goal of the campaign was to induce motorists to drive safely, thereby reducing traffic accidents
and injuries. It additionally sought to raise the public awareness of potential dangers of driving
near CMVs on Salt Lake City roadways, including the risk of a citation and serious personal injury.
Phase II research was intended to measure the effectiveness of this campaign by asking drivers in
the campaign target area if they had seen the campaign, what message(s) they heard and
remember, and if they believed it made any impact on themselves and other drivers in Salt Lake
City. A total of 301 Salt Lake City drivers were surveyed for this Phase II research.
II. EXECUTIVE SUMMARY
1. The campaign achieved significant awareness given the very short period of time the
campaign ran. 45% of drivers surveyed were aware of the campaign.
2. Compared to the pre-campaign survey, there was a statistically significant increase in the
number of drivers saying they saw aggressive driving “often” when they were out driving.
This would suggest either aggressive driving has increased or, more likely, awareness of
aggressive driving has increased.
3. Compared to the pre-campaign survey, there was a statistically significant increase in the
number of drivers reporting they observed “following too closely”, “speeding”, and “failure
to yield the right of way”.
4. The most noted aggressive driving behavior was “following too closely” – which showed a
statistically significant increase over the pre-campaign survey.
5. It was also interesting to note that drivers reported that they personally speed and follow
too closely at a statistically significantly higher rate in the post-campaign survey, following
the “it’s not a race” and “trucks need space” themes.
6. Similarly, there was an increase in the number of drivers reporting that “rushing/late” or
“trying to get around trucks” was the number one reason for aggressive driving. A lack of
understanding of the room trucks need also showed a statistically significant increase in
the number of drivers reporting it as a cause of aggressive driving.
N28W23050 Roundy Drive
Suite 100
Pewaukee, WI 53072
T / 262.650.9900
F / 262.650.3160
staplesmarketing.com

Staples Marketing I Staples Marketing – Salt Lake City Phase II Research Report I 05.13.14
2
7. Two-thirds of drivers believe aggressive driving is a problem that should be addressed.
8. Drivers clearly heard the campaign messages. When asked what they remembered about
messages they had seen or heard, drivers were able to recall the themes and content of the
campaign.
9. Over 90% of drivers said the campaign was “somewhat” to “very” effective in impacting their
personal driving habits.
10. Over 70% of drivers said the campaign was “somewhat” to “very” effective in impacting the
driving habits of other drivers.
III. DETAILED REPORT
DEMOGRAPHICS
Phase I Phase II
GENDER: Percent Count n=608 Percent Count n=301
Male 44% 265 40% 120
Female 56% 343 60% 181
AGE: Count n=606 Count n=301
18 – 20 1% 3 0% 0
21 – 34 17% 104 22% 67
35 – 44 20% 121 20% 60
45 – 54 18% 109 21% 62
55 – 64 30% 180 37% 112
65 or over 14% 89 0% 0
DRIVER TYPE: Count n=608 Count n=301
Passenger 98% 597 99% 299
Commercial 2% 11 1% 2
ETHNICITY: Count n=598 Count n=301
White/Caucasian 94% 565 92% 276
Hispanic/Latino 3% 15 4% 11
Black/African American 1% 4 1% 2
Asian/Pacific Islander 2% 9 3% 9
Multi-Racial 1% 3 1% 3

Staples Marketing I Staples Marketing – Salt Lake City Phase II Research Report I 05.13.14
3
1. FREQUENCY OF OBSERVED UNSAFE OR AGGRESSIVE DRIVING BEHAVIOR
Drivers were asked how often they observed unsafe or aggressive driving behaviors between
passenger vehicles and commercial motor vehicles on the streets in Salt Lake City. They were
given a 5 point scale where 1=”Every time I drive” and 5=”Never”.
Only 20% of drivers said “almost never” or “never”. A total of 37% of drivers saw aggressive or
unsafe driving between passenger vehicles and commercial vehicles “often” or “every time” they
were out driving, compared to 31% in the Phase I study. This difference is statistically significant
at the 90% confidence level and suggests that either actual aggressive driving has increased or,
more likely, drivers are more aware of aggressive driving after the campaign.
Phase I Phase II
How Often: Percent Count n=608 Percent Count n=301
Every time I am driving 9% 57 9% 28
Often when I am driving 22% 136 28% 85
Sometimes 44% 268 43% 128
Almost Never 21% 130 19% 58
Never 3% 17 1% 2

Staples Marketing I Staples Marketing – Salt Lake City Phase II Research Report I 05.13.14
4
2. TYPE OF UNSAFE OR AGGRESSIVE DRIVING BEHAVIOR OBSERVED
Drivers were asked what types of unsafe or aggressive driving behaviors they have observed
between passenger vehicles and commercial motor vehicles on the streets in Salt Lake City.
Drivers were offered a list of the types of violations most concerning according to research
previously conducted and included in the research proposal. In addition, drivers were allowed to
submit “other” behaviors. Most commonly mentioned were distracted driving (such as texting),
and cutting trucks off.
There was a statistically significant increase (at the 99% confidence interval) in those drivers
reporting that they observed others “following too closely”. There were also statistically significant
increases in the number of drivers reporting they observed “speeding” (at the 95% confidence
interval) and “failing to yield the right of way” (at the 90% confidence interval). Thus, it would
appear that either aggressive driving has increased or, more likely, drivers are more aware of
aggressive behavior based on the public awareness campaign.
Phase I Phase II
Type of Behavior Observed: Percent Count n=608 Percent Count n=301
Following too closely 73% 442 82% 247
Speeding 57% 347 65% 197
Failure to yield right of way 52% 318 58% 175
Failure to obey Sign or Signal 38% 233 36% 107
Improper Turn 33% 202 27% 80
Other 17% 101 10% 30

Staples Marketing I Staples Marketing – Salt Lake City Phase II Research Report I 05.13.14
5
3. TYPE OF UNSAFE OR AGGRESSIVE DRIVING BEHAVIOR OBSERVED MOST OFTEN
Drivers were asked what types of unsafe or aggressive driving behaviors they have observed most
often between passenger vehicles and commercial motor vehicles on the streets in Salt Lake City.
There was a statistically significant increase in the number of drivers reporting that they saw
drivers “following too closely” (at the 99% confidence interval). This would suggest that the “trucks
need space” campaign raised awareness among drivers in Salt Lake City.
Drivers were also allowed to submit “other” behaviors. Most commonly mentioned were distracted
driving (such as texting), and cutting trucks off.
Phase I Phase II
Type Most Often Observed: Percent Count n=608 Percent Count n=301
Following too closely 40% 240 52% 155
Speeding 23% 139 22% 66
Failure to yield right of way 17% 103 14% 42
Failure to obey Sign or Signal 10% 63 9% 27
Improper Turn 4% 23 4% 11
Other 9% 52 4% 11
Staples Marketing I Staples Marketing – Salt Lake City Phase II Research Report I 05.13.14
6
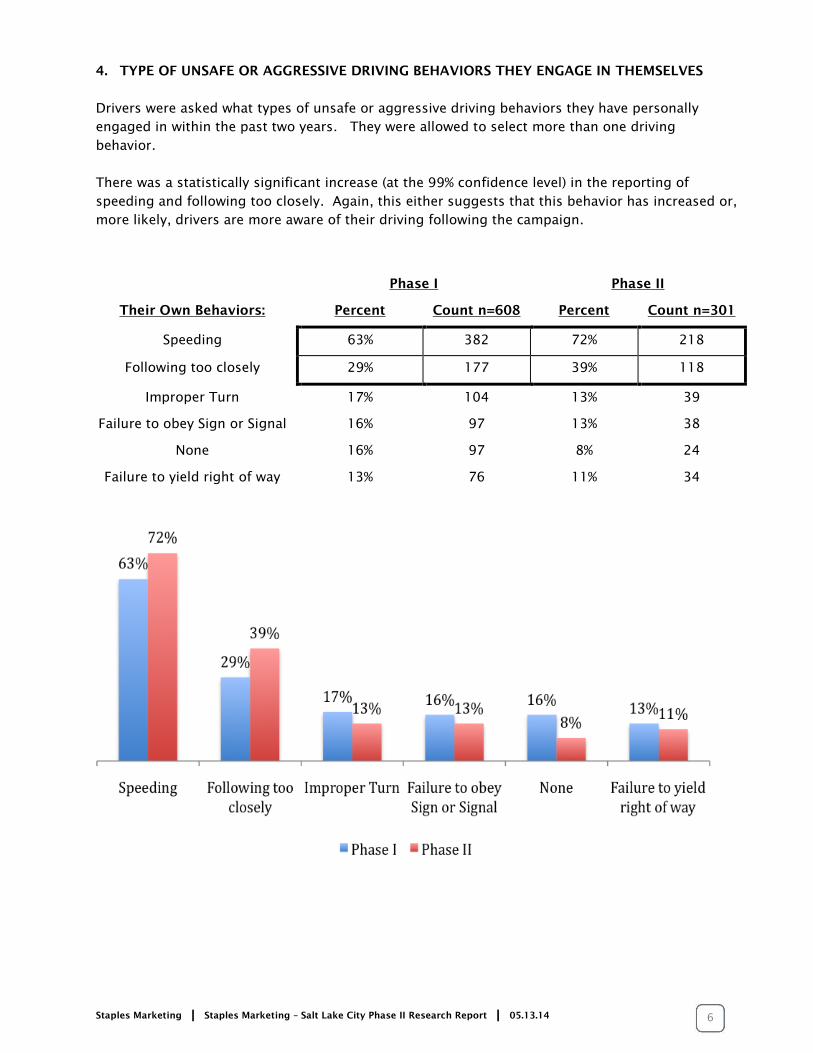
4. TYPE OF UNSAFE OR AGGRESSIVE DRIVING BEHAVIORS THEY ENGAGE IN THEMSELVES
Drivers were asked what types of unsafe or aggressive driving behaviors they have personally
engaged in within the past two years. They were allowed to select more than one driving
behavior.
There was a statistically significant increase (at the 99% confidence level) in the reporting of
speeding and following too closely. Again, this either suggests that this behavior has increased or,
more likely, drivers are more aware of their driving following the campaign.
Phase I Phase II
Their Own Behaviors: Percent Count n=608 Percent Count n=301
Speeding 63% 382 72% 218
Following too closely 29% 177 39% 118
Improper Turn 17% 104 13% 39
Failure to obey Sign or Signal 16% 97 13% 38
None 16% 97 8% 24
Failure to yield right of way 13% 76 11% 34

Staples Marketing I Staples Marketing – Salt Lake City Phase II Research Report I 05.13.14
7
5. IS UNSAFE OR AGGRESSIVE DRIVING BETWEEN PASSENGER AND COMMERCIAL VEHICLES A
PROBLEM?
Drivers were asked: “Do you believe that unsafe or aggressive driving between passenger vehicles
and commercial trucks on Salt Lake City roads is a problem that should be addressed?” The
overwhelming answer was yes. This was true to a larger degree after the campaign, though it was
not a statistically significant difference.
Phase I Phase II
Is It A Problem: Percent Count n=608 Percent Count n=301
Yes 63% 383 66% 200
No 37% 225 34% 101
Staples Marketing I Staples Marketing – Salt Lake City Phase II Research Report I 05.13.14
8
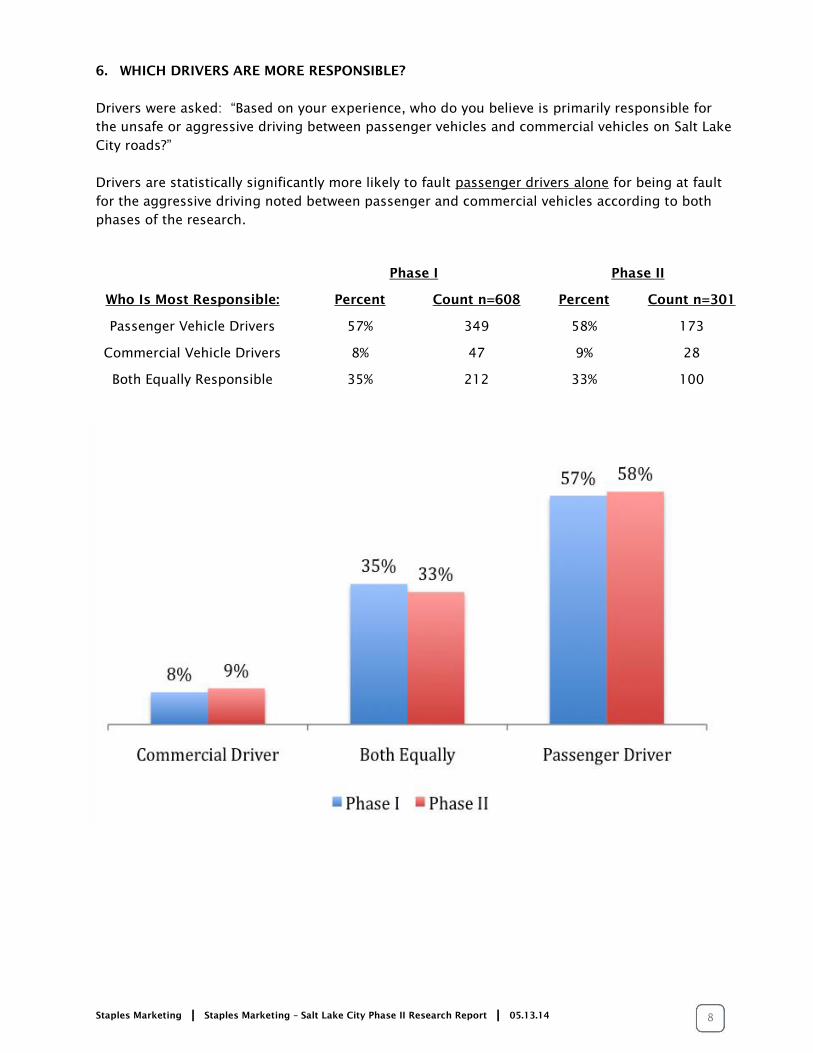
6. WHICH DRIVERS ARE MORE RESPONSIBLE?
Drivers were asked: “Based on your experience, who do you believe is primarily responsible for
the unsafe or aggressive driving between passenger vehicles and commercial vehicles on Salt Lake
City roads?”
Drivers are statistically significantly more likely to fault passenger drivers alone for being at fault
for the aggressive driving noted between passenger and commercial vehicles according to both
phases of the research.
Phase I Phase II
Who Is Most Responsible: Percent Count n=608 Percent Count n=301
Passenger Vehicle Drivers 57% 349 58% 173
Commercial Vehicle Drivers 8% 47 9% 28
Both Equally Responsible 35% 212 33% 100

Staples Marketing I Staples Marketing – Salt Lake City Phase II Research Report I 05.13.14
9
7. REASONS PASSENGER DRIVERS ENGAGE IN UNSAFE DRIVING
Drivers are significantly more likely to cite rushing/running late than any other cause. Not liking
to be behind trucks because they are slow is statistically equal to a lack of understanding of the
room a truck needs. Not liking following trucks because they are slow is mentioned significantly
more often than because they block a driver’s view. Thus, speed issues around slower moving
trucks seem to be the paramount issue cited by most drivers.
When it came to specifying truck driver behavior that was not appropriate, the common themes
were parking in the middle of the street or blocking the street, driving slowly, or using their size to
intimidate passenger vehicles or take more than one lane.
After the campaign drivers were statistically significantly more likely to cite “rushing/late” and
“lack of understanding of the room trucks need” as reasons for unsafe/aggressive driving (at the
95% confidence interval). This would strongly suggest that the campaign had an impact on drivers
in the target area.
Phase I Phase II
Reasons Why: Percent Count n=608 Percent Count n=301
Rushing / late – trying to get
around trucks because trucks
are slow.
72%
437
80%
240
Do not like driving behind
trucks because they are slow.
61%
368
66%
199
Lack of understanding of the
room trucks need to turn,
stop, accelerate, etc.
57%
348
65%
195
Do not like driving behind
trucks because they block a
driver’s view.
54%
326
55%
166
Truck drivers are not driving
appropriately on city streets.
11%
68 7% 21
Staples Marketing I Staples Marketing – Salt Lake City Phase II Research Report I 05.13.14
10
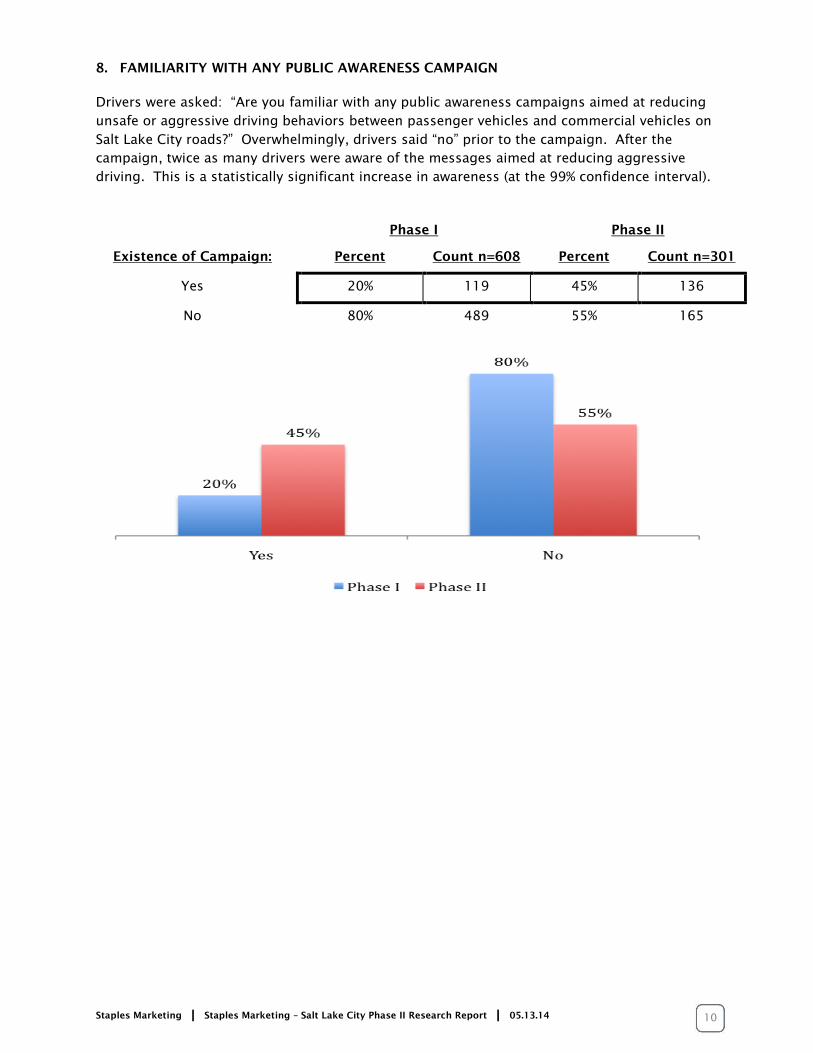
8. FAMILIARITY WITH ANY PUBLIC AWARENESS CAMPAIGN
Drivers were asked: “Are you familiar with any public awareness campaigns aimed at reducing
unsafe or aggressive driving behaviors between passenger vehicles and commercial vehicles on
Salt Lake City roads?” Overwhelmingly, drivers said “no” prior to the campaign. After the
campaign, twice as many drivers were aware of the messages aimed at reducing aggressive
driving. This is a statistically significant increase in awareness (at the 99% confidence interval).
Phase I Phase II
Existence of Campaign: Percent Count n=608 Percent Count n=301
Yes 20% 119 45% 136
No 80% 489 55% 165
Staples Marketing I Staples Marketing – Salt Lake City Phase II Research Report I 05.13.14
11
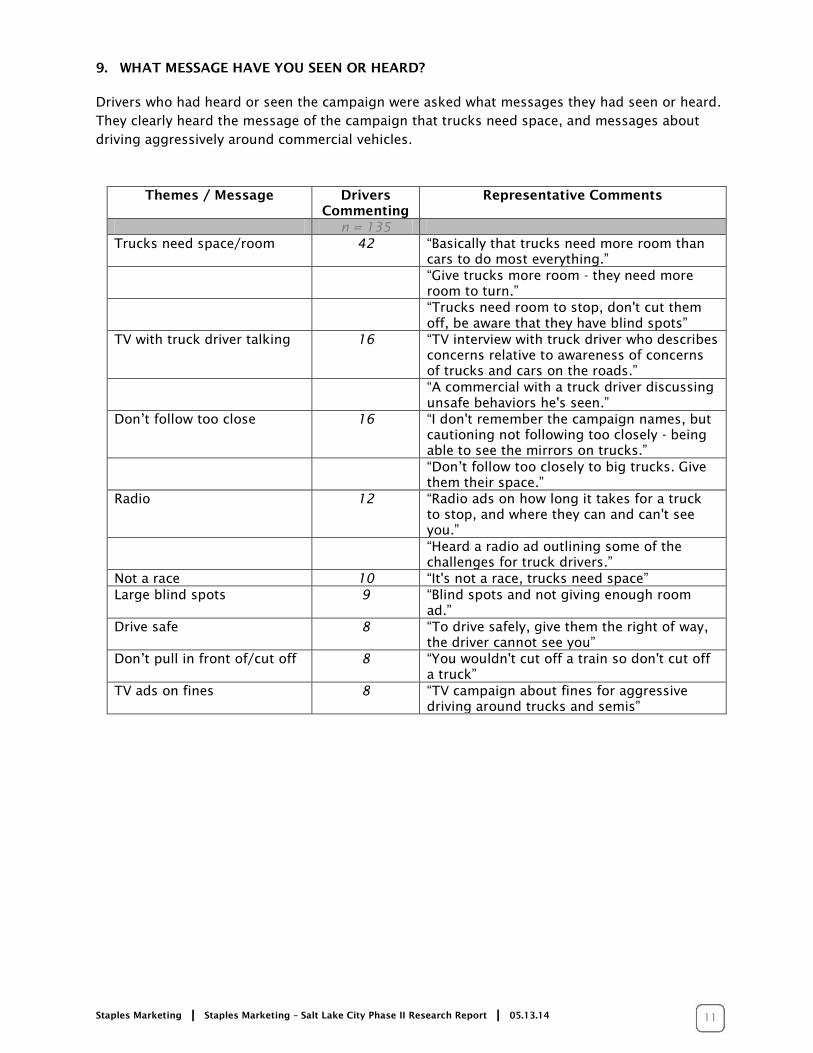
9. WHAT MESSAGE HAVE YOU SEEN OR HEARD?
Drivers who had heard or seen the campaign were asked what messages they had seen or heard.
They clearly heard the message of the campaign that trucks need space, and messages about
driving aggressively around commercial vehicles.
Themes / Message Drivers
Commenting
Representative Comments
n = 135
Trucks need space/room 42 “Basically that trucks need more room than
cars to do most everything.”
“Give trucks more room - they need more
room to turn.”
“Trucks need room to stop, don't cut them
off, be aware that they have blind spots”
TV with truck driver talking 16 “TV interview with truck driver who describes
concerns relative to awareness of concerns
of trucks and cars on the roads.”
“A commercial with a truck driver discussing
unsafe behaviors he's seen.”
Don’t follow too close 16 “I don't remember the campaign names, but
cautioning not following too closely - being
able to see the mirrors on trucks.”
“Don’t follow too closely to big trucks. Give
them their space.”
Radio 12 “Radio ads on how long it takes for a truck
to stop, and where they can and can't see
you.”
“Heard a radio ad outlining some of the
challenges for truck drivers.”
Not a race 10 “It's not a race, trucks need space”
Large blind spots 9 “Blind spots and not giving enough room
ad.”
Drive safe 8 “To drive safely, give them the right of way,
the driver cannot see you”
Don’t pull in front of/cut off 8 “You wouldn't cut off a train so don't cut off
a truck”
TV ads on fines 8 “TV campaign about fines for aggressive
driving around trucks and semis”

Staples Marketing I Staples Marketing – Salt Lake City Phase II Research Report I 05.13.14
12
10. WHERE THEY SAW OR HEARD THE MESSAGE
Drivers saw and heard the campaign material mostly on television and radio and billboards.

Staples Marketing I Staples Marketing – Salt Lake City Phase II Research Report I 05.13.14
13
11. EFFECTIVENESS OF CAMPAIGN ON PERSONAL DRIVING HABITS
Drivers were asked to comment on the effectiveness of the campaign on their personal driving
habits. Specifically, drivers were asked: “How effective do you think the campaign is in making
you more aware of your driving around commercial trucks?” Over 90% of drivers said the
campaign was “somewhat” to “very” effective in making them more aware of their driving around
commercial vehicles. A total of 50% said the campaign was moderately to very effective.
Staples Marketing I Staples Marketing – Salt Lake City Phase II Research Report I 05.13.14
14
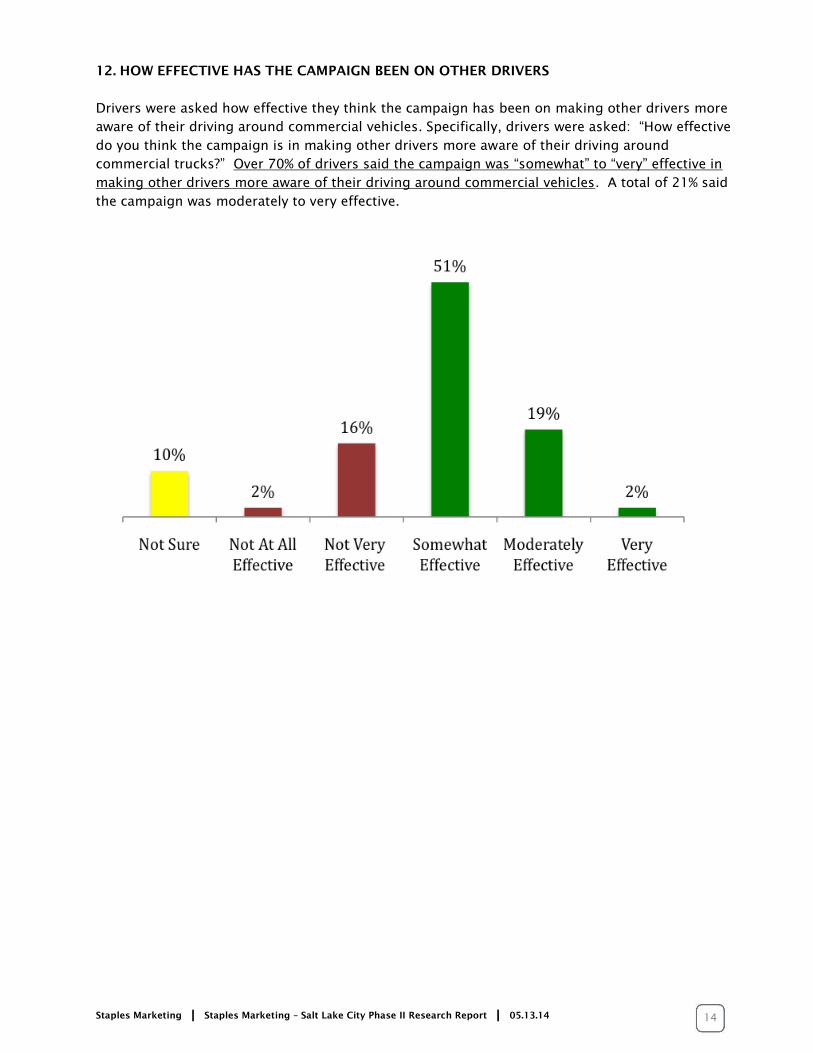
12. HOW EFFECTIVE HAS THE CAMPAIGN BEEN ON OTHER DRIVERS
Drivers were asked how effective they think the campaign has been on making other drivers more
aware of their driving around commercial vehicles. Specifically, drivers were asked: “How effective
do you think the campaign is in making other drivers more aware of their driving around
commercial trucks?” Over 70% of drivers said the campaign was “somewhat” to “very” effective in
making other drivers more aware of their driving around commercial vehicles. A total of 21% said
the campaign was moderately to very effective.
Staples Marketing I Staples Marketing – Salt Lake City Phase II Research Report I 05.13.14
15
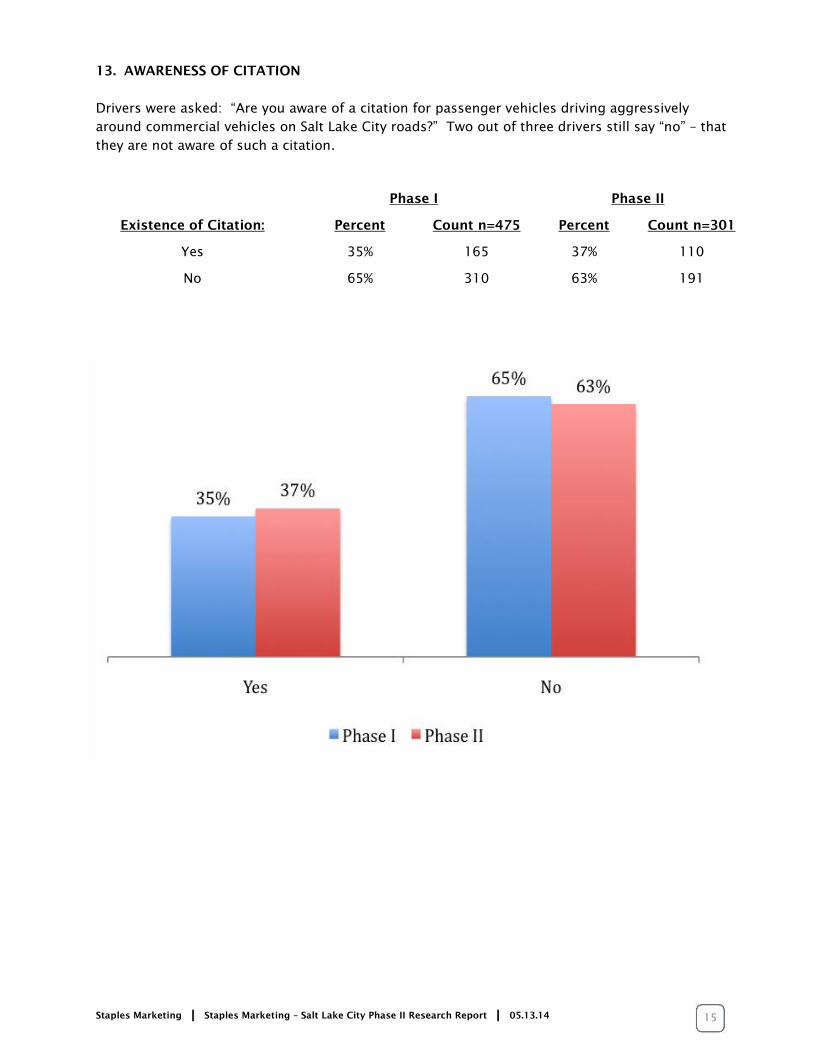
13. AWARENESS OF CITATION
Drivers were asked: “Are you aware of a citation for passenger vehicles driving aggressively
around commercial vehicles on Salt Lake City roads?” Two out of three drivers still say “no” – that
they are not aware of such a citation.
Phase I Phase II
Existence of Citation: Percent Count n=475 Percent Count n=301
Yes 35% 165 37% 110
No 65% 310 63% 191
Staples Marketing I Staples Marketing – Salt Lake City Phase II Research Report I 05.13.14
16
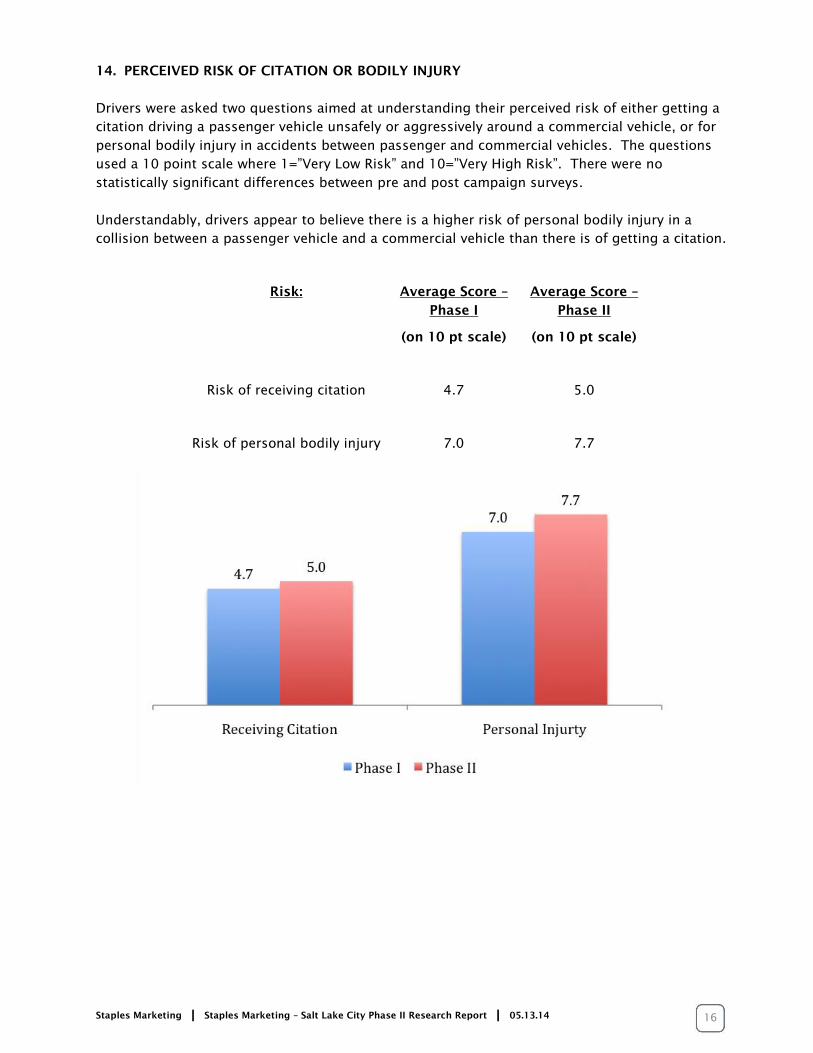
14. PERCEIVED RISK OF CITATION OR BODILY INJURY
Drivers were asked two questions aimed at understanding their perceived risk of either getting a
citation driving a passenger vehicle unsafely or aggressively around a commercial vehicle, or for
personal bodily injury in accidents between passenger and commercial vehicles. The questions
used a 10 point scale where 1=”Very Low Risk” and 10=”Very High Risk”. There were no
statistically significant differences between pre and post campaign surveys.
Understandably, drivers appear to believe there is a higher risk of personal bodily injury in a
collision between a passenger vehicle and a commercial vehicle than there is of getting a citation.
Risk: Average Score –
Phase I
(on 10 pt scale)
Average Score –
Phase II
(on 10 pt scale)
Risk of receiving citation
4.7
5.0
Risk of personal bodily injury
7.0
7.7