2014 farm bill and global rice market presentation...
TRANSCRIPT

U.S. 2014 Farm Bill Overview andProjections of the Global Rice Market
Professor Eric J. WailesDepartment of Agricultural Economics and Agribusiness
University of Arkansas Division of Agriculture
Presentation to International SeminarGlobal Japonica Rice Competitiveness
Miyazaki, JapanFebruary 13, 2015
1

Outline
• Overview
• Title I commodity provisions
– Provisions and programs
– New options for farmers
• Title XI Crop Insurance
– Provisions an programs
– New options for producers
2

Disclaimer and Acknowledgement
• Information is based on our reading of the bill anddiscussion with Congressional Staff and othereconomists
• There will likely be difference in our interpretationand the final rules and regulations
• Information is intended to be for educationalpurposes only
• This work is funded by the Arkansas riceindustry through rice check-off fundsadministered by the Arkansas Rice Research andPromotion Board.
3

The farm bill
• Agricultural Act of 2014 changes the natureand level of support
• Key features:
– Eliminates many existing programs:
• Direct payments, CCP and ACRE
• Dairy price and MILC payments
– Reduces SNAP (food stamp) spending
– Limits conservation reserve program
– Reallocates “savings” to risk management
4

“Mandatory” spendingCBO estimates, FY 2014-23 totals, billion dollars
Pre 2014 farm bill With 2014 farm bill Change with 2014
Commodityprograms 58.8 44.5 -14.3
Crop Insurance 84.1 89.8 +5.7
Sub-total 142.9 134.3 -8.6
Conservation 61.6 57.6 -4.0
Nutrition (SNAP) 764.4 756.4 -8.0
Everything else* 4.0 8.1 +4.0
Total 972.9 956.4 -16.6
• Includes research, energy, horticulture, rural development, trade, and more• Source: CBO publication 45049
5

“Mandatory” spendingCBO estimates, FY 2014-23 totals, billion dollars
6.0%
8.6%
6.3%
78.6%
0.4%
($972 bil.)
Commodities Crop Ins. Conservation
Nutrition Other
2014 Farm Bill Policies
4.6%
9.4%
6.0%
79.1%
0.8%
($956 bil.)
Commodities Crop Ins. Conservation
Nutrition Other
Pre-2014 Policies Continued
6

CCC farm program spending undernew bill
7
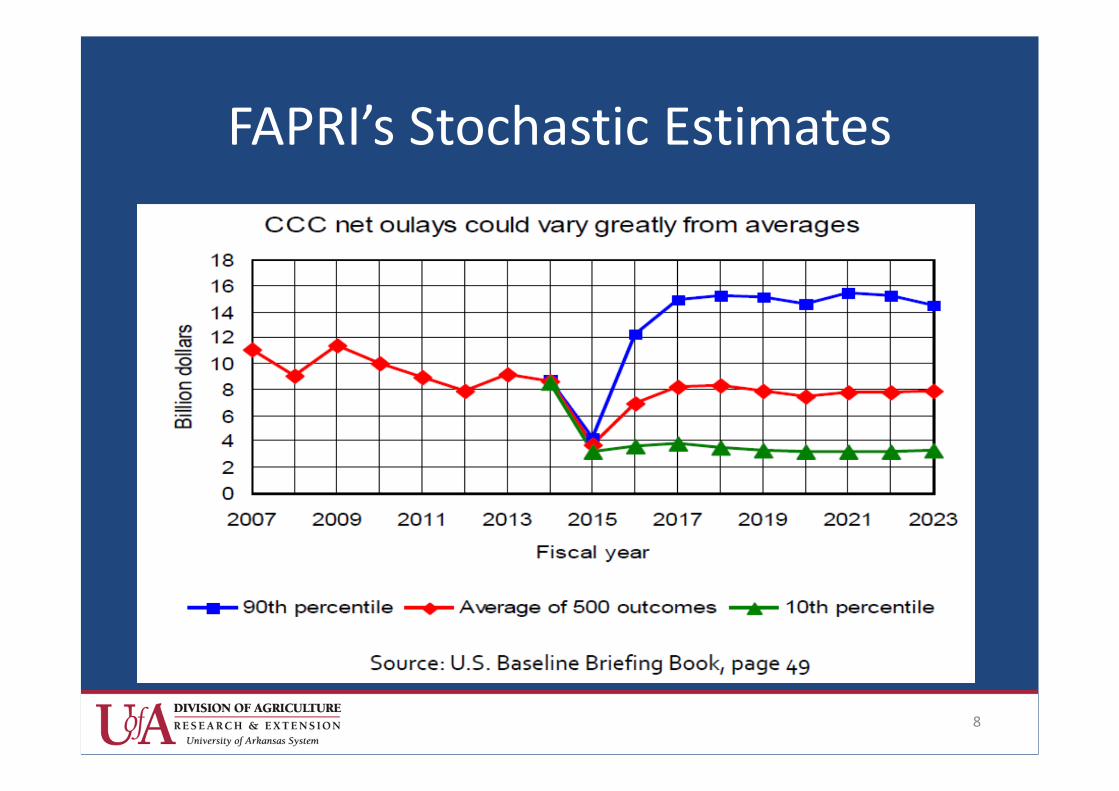
FAPRI’s Stochastic Estimates
8

Title 1 Commodities
• Price Loss Coverage (PLC) or Agricultural RiskCoverage (ARC) – one time, irrevocable choice
– ARC has county level or farm level option
• Crop by crop and farm by farm choice ofprograms (except farm level ARC is wholefarm/all crops on farm)
• If no choice is made in 2014, no payments for2014, and remainder of years automatically inPLC
9

Title 1 Commodity programProvisions and Producer choices
• Base reallocation
• Yield update
• Price Loss Coverage (PLC)
• Agriculture Risk Coverage (ARC)
• Payment limits and AGI
• Choices to be made and when
• Decision aid/tools
10
Choose ARC
Choose PLC
County
Can choose toUpdate
Payment Yield
Base ReallocationDecision
Choice BetweenARC and PLC
Individual
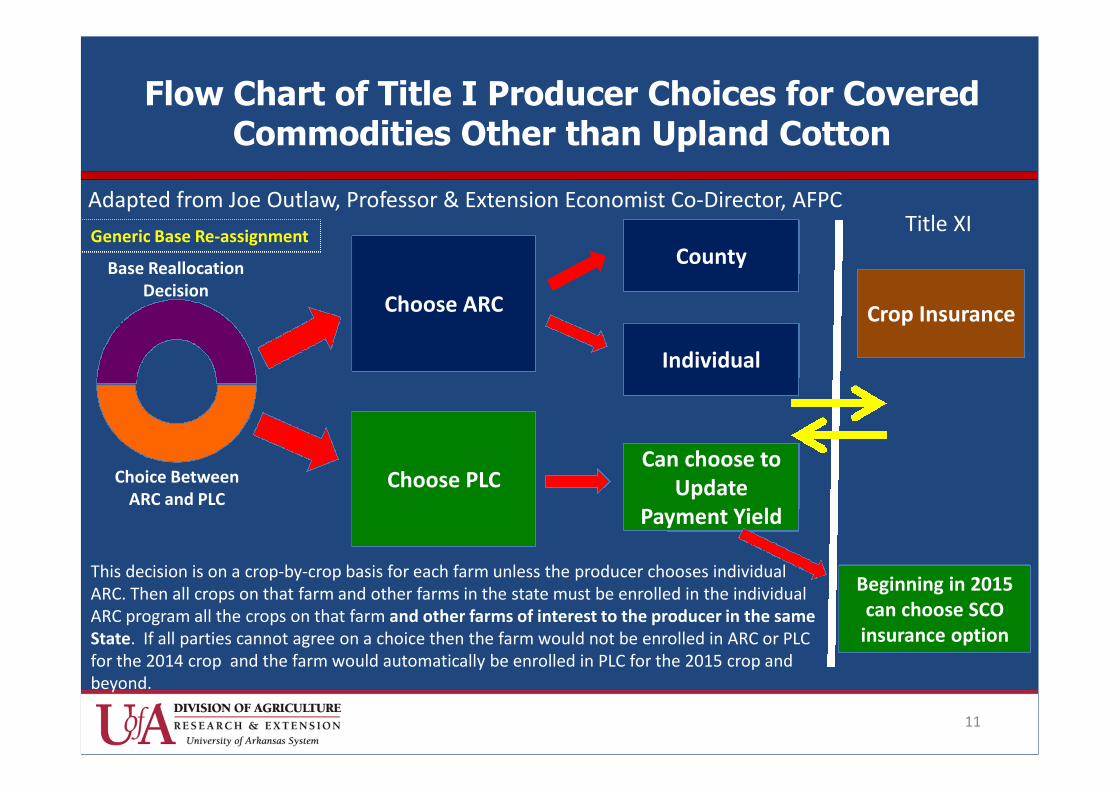
Flow Chart of Title I Producer Choices for CoveredCommodities Other than Upland Cotton
This decision is on a crop-by-crop basis for each farm unless the producer chooses individualARC. Then all crops on that farm and other farms in the state must be enrolled in the individualARC program all the crops on that farm and other farms of interest to the producer in the sameState. If all parties cannot agree on a choice then the farm would not be enrolled in ARC or PLCfor the 2014 crop and the farm would automatically be enrolled in PLC for the 2015 crop andbeyond.
Crop Insurance
Title XIAdapted from Joe Outlaw, Professor & Extension Economist Co-Director, AFPC
Generic Base Re-assignment
Beginning in 2015can choose SCO
insurance option
11

Base reallocation
• One time decision by land owner
• Decision is made on each FSA farm unit
• Two choices
– Retain existing base acres
– Reallocate based on 2009-12 planted crop shares
• Cannot add base acres to a farm
• Cotton base acres become generic base andcannot be reallocated but can be reassignedeach year based on planted covered crop acres
12

Base Reallocation – Generic Base
• All cotton base on a farm is renamed GenericBase
– Cotton no longer receives Title 1 program benefitsexcept for the marketing loan program
– Will receive transition payments in 2014 andpossibly 2015
• Cotton will only receive income supportthrough purchased insurance products
– Traditional and Stacked income protection (STAX)
13
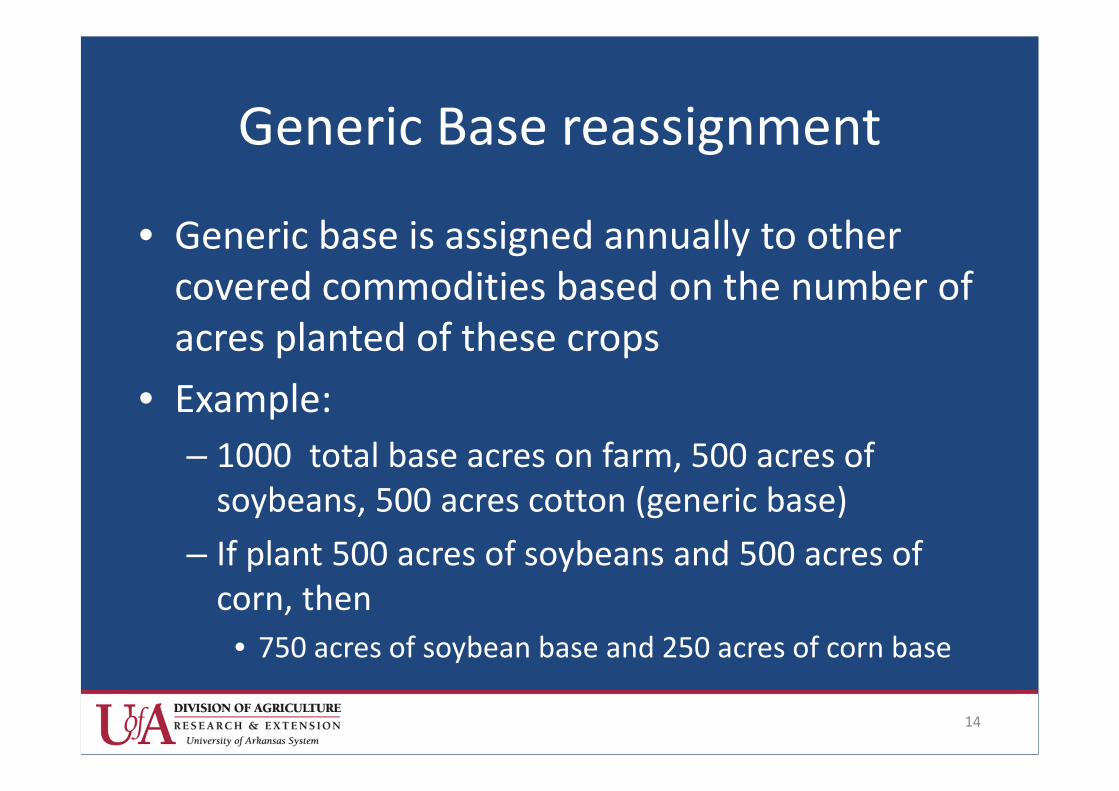
Generic Base reassignment
• Generic base is assigned annually to othercovered commodities based on the number ofacres planted of these crops
• Example:
– 1000 total base acres on farm, 500 acres ofsoybeans, 500 acres cotton (generic base)
– If plant 500 acres of soybeans and 500 acres ofcorn, then
• 750 acres of soybean base and 250 acres of corn base
14
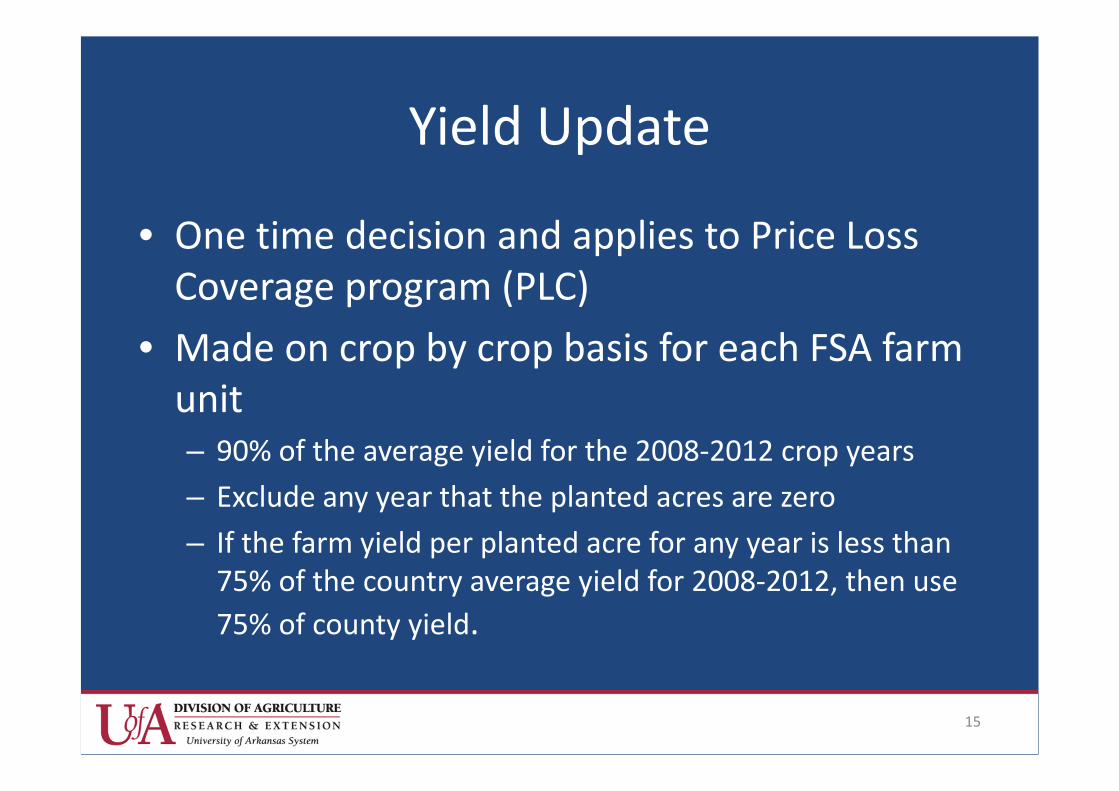
Yield Update
• One time decision and applies to Price LossCoverage program (PLC)
• Made on crop by crop basis for each FSA farmunit– 90% of the average yield for the 2008-2012 crop years
– Exclude any year that the planted acres are zero
– If the farm yield per planted acre for any year is less than75% of the country average yield for 2008-2012, then use
75% of county yield.
15
Safety Net Program Options
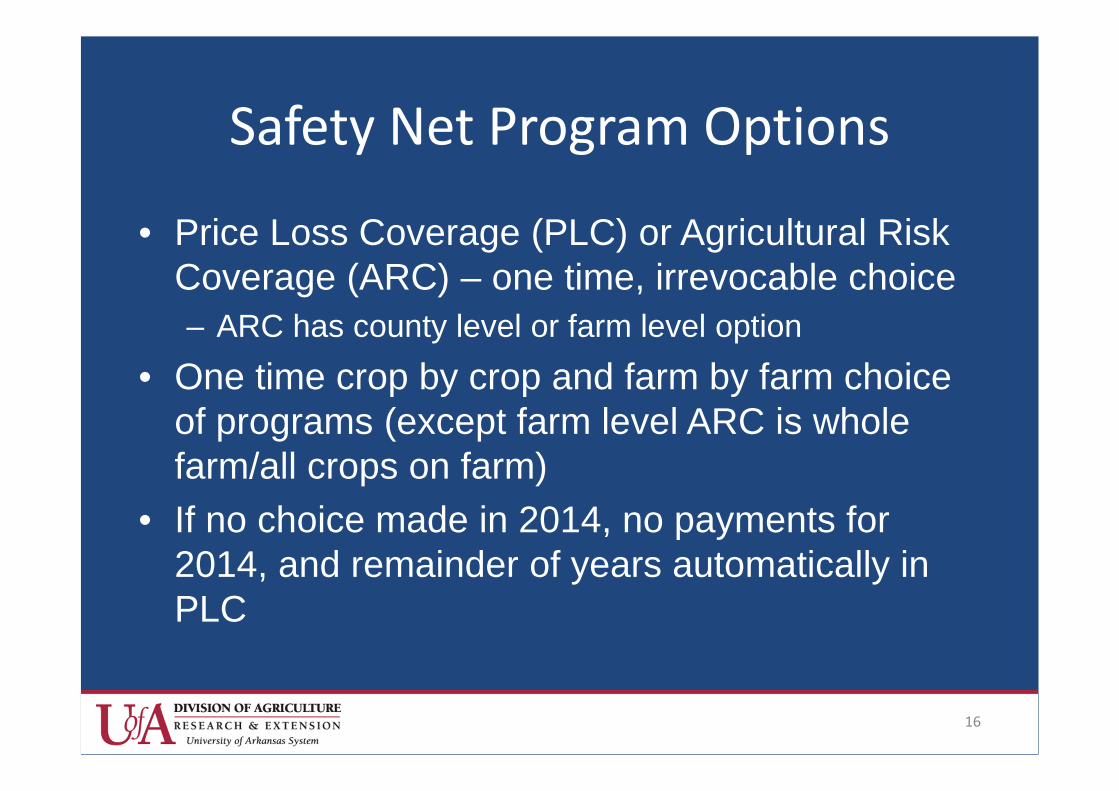
• Price Loss Coverage (PLC) or Agricultural RiskCoverage (ARC) – one time, irrevocable choice
– ARC has county level or farm level option
• One time crop by crop and farm by farm choiceof programs (except farm level ARC is wholefarm/all crops on farm)
• If no choice made in 2014, no payments for2014, and remainder of years automatically inPLC
16

Program Options
• Both PLC and ARC programs are decoupled(paid on base acres, not planted acres – excepton generic base partially tied to covered cropplanted each years)
• Must designate PLC or ARC for all crops thatcould be planted on generic base during the2014-2018 period
• SCO can only be purchased in conjunction withPLC
17
PLC program
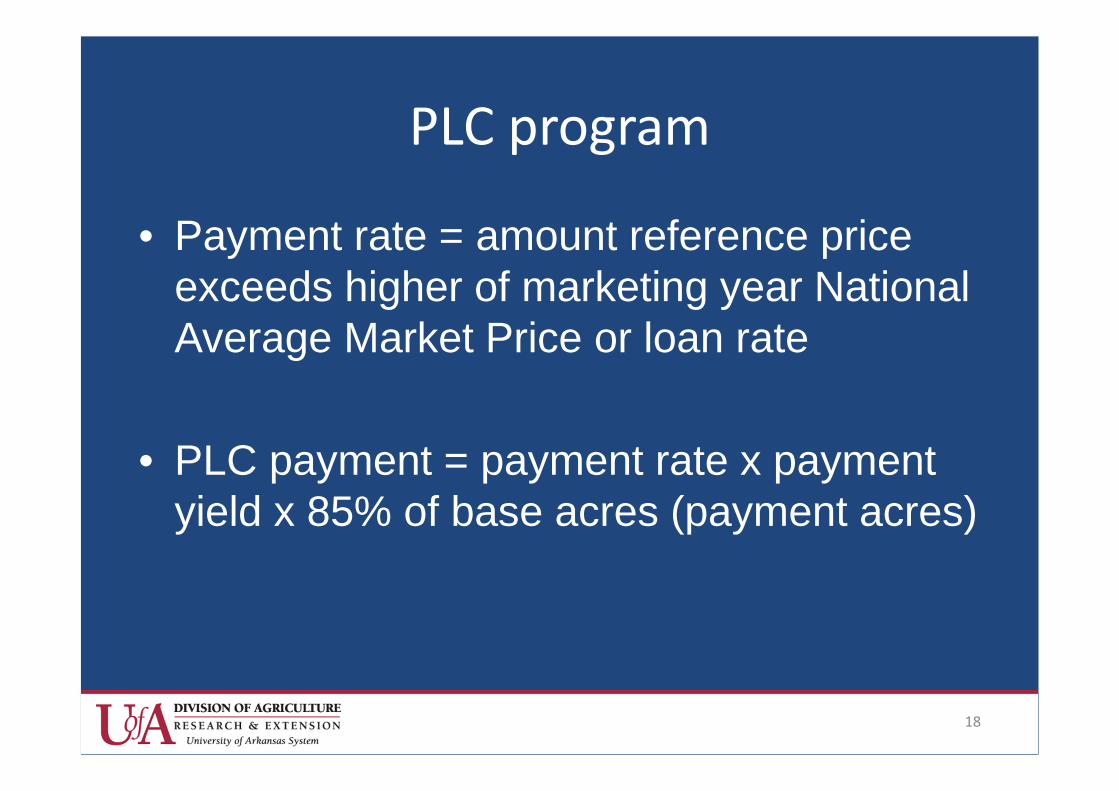
• Payment rate = amount reference priceexceeds higher of marketing year NationalAverage Market Price or loan rate
• PLC payment = payment rate x paymentyield x 85% of base acres (payment acres)
18

Reference Prices compared toprevious target prices
2008 Farm BillTarget Prices
2014 Farm BillReference Prices
Long grain rice/cwt. $10.50 $14.00
Medium grain rice/cwt. $10.50 $14.00
Medium grain (japonica)/cwt. $10.50 $16.10
Corn/bu. $2.63 $3.70
Soybeans/bu. $6.00 $8.40
Wheat/bu. $4.17 $5.50
Upland cotton/lb. 71.25 cents None*
*Upland cotton is not eligible for PLC or ARC benefits under the 2014 farm bill.However, it has a special crop insurance program, STAX.
19

Market Receipts
PLC
MLG/LDP
Revenue per cwt
ReferencePrice – $14.00
LoanRate – $6.50
Paid on base acres x .85
Market Price
Illustration of Government Support forRice Under PLC
Crop insurance coverage
Supplemental Coverage Option
Crop Insurance
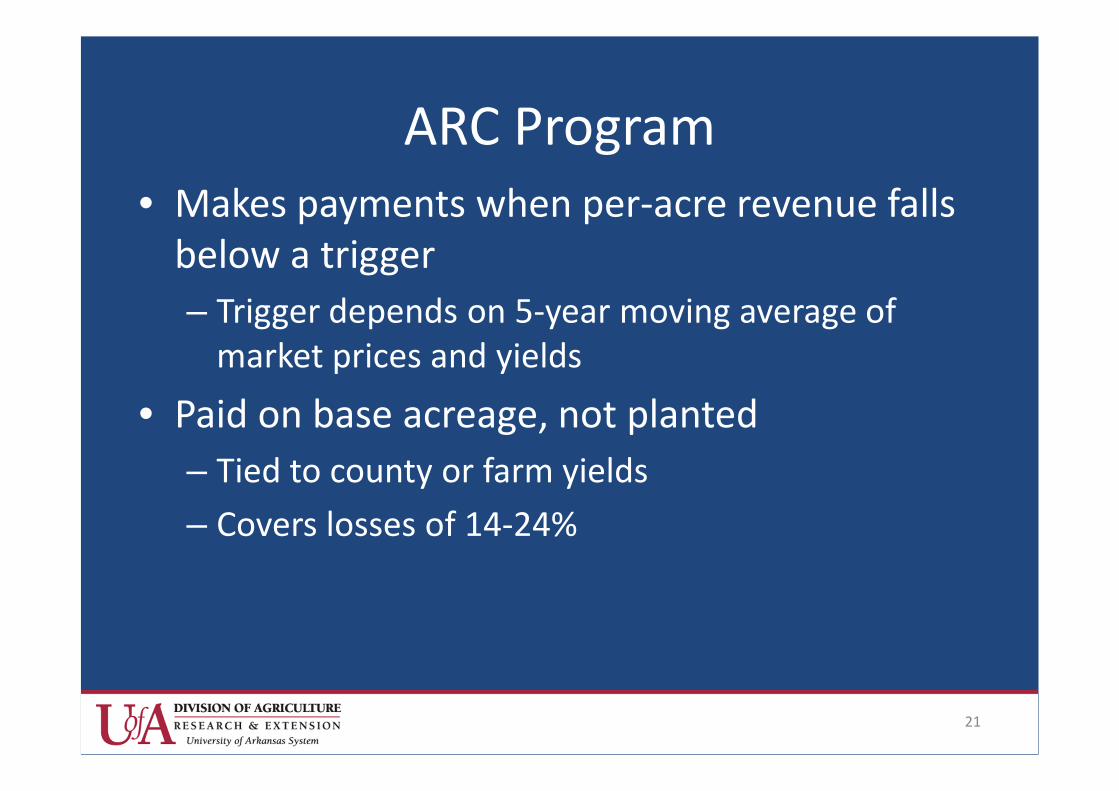
ARC Program• Makes payments when per-acre revenue falls
below a trigger
– Trigger depends on 5-year moving average ofmarket prices and yields
• Paid on base acreage, not planted
– Tied to county or farm yields
– Covers losses of 14-24%
21
ARC Payments
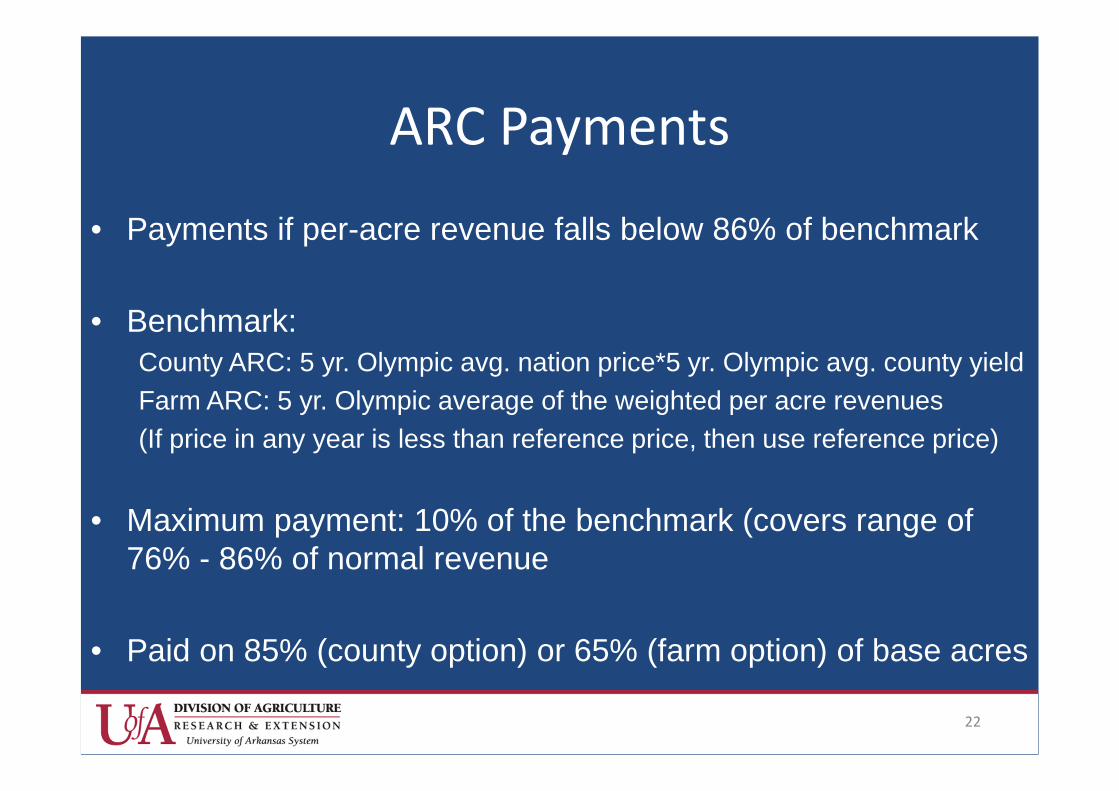
• Payments if per-acre revenue falls below 86% of benchmark
• Benchmark:County ARC: 5 yr. Olympic avg. nation price*5 yr. Olympic avg. county yield
Farm ARC: 5 yr. Olympic average of the weighted per acre revenues
(If price in any year is less than reference price, then use reference price)
• Maximum payment: 10% of the benchmark (covers range of76% - 86% of normal revenue
• Paid on 85% (county option) or 65% (farm option) of base acres
22

Market Receipts
MLG
Revenue per cwt
LoanRate – $6.50
Market Price
Revenue Benchmark
Crop insurance coverage
86%
76%
Illustration of Government Support forRice Under ARC-County
[paid on base acresx .65 (individual) or
.85 (county)]
Revenue Guarantee
Crop Insurance

Payment Limits and AGI
• Overall payment limit per person – $125,000combined for PLC, ARC, Loan DeficiencyPayments and Marketing Loan Gains
– Separate limit for peanuts
• No change to the spousal rule
• No limit on marketing loan forfeitures
• Adjusted Gross Income (AGI) test – 3 yearaverage of $900,000 or less for commodity andconservation program eligibility
• AGI does not apply to crop insurance
24

Actively Engaged Provisions
• USDA Secretary required to publish rule todefine term “significant contribution ofactive personal management”
• USDA Secretary authorized, if appropriate,to establish limits for various types farmingoperations on number of individuals whocan be considered actively engaged infarming when provision of management isthe basis used to qualify
25

Actively Engaged Provisions
• In rulemaking USDA shall consider:
– Size, nature, and management requirements of eachtype of farming operation
– Changing nature of active personal management dueto advancements of farming operations
– Degree to which the regulations will adversely impactthe long-term viability of the farming operation
26
Actively Engaged Provisions
• None of the actively engaged provisionsas a result of the rulemakings shall impactor apply to individuals or entitiescomprised solely of family members
• Any changes apply beginning with the2015 crop year
27

Crop Insurance
• Individual policies
– Yield protection
– Revenue protection with harvest price exlusion
– Revenue protection
• Area policies
– Area yield protection
– Area revenue protection with harvest priceexclusion
– Area revenue protection
28
Crop Insurance Provisions 2015
• SCO policy allows for county yield or revenuecoverage up to 86%
• Premium subsidy of 65%
• Requires underlying policy
– Buy-up or CAT (catastrophic)
– Both policies of same type (i.e. yield/yield orrevenue/revenue)
• Requires RMA to offer margin protection policyfor rice
29
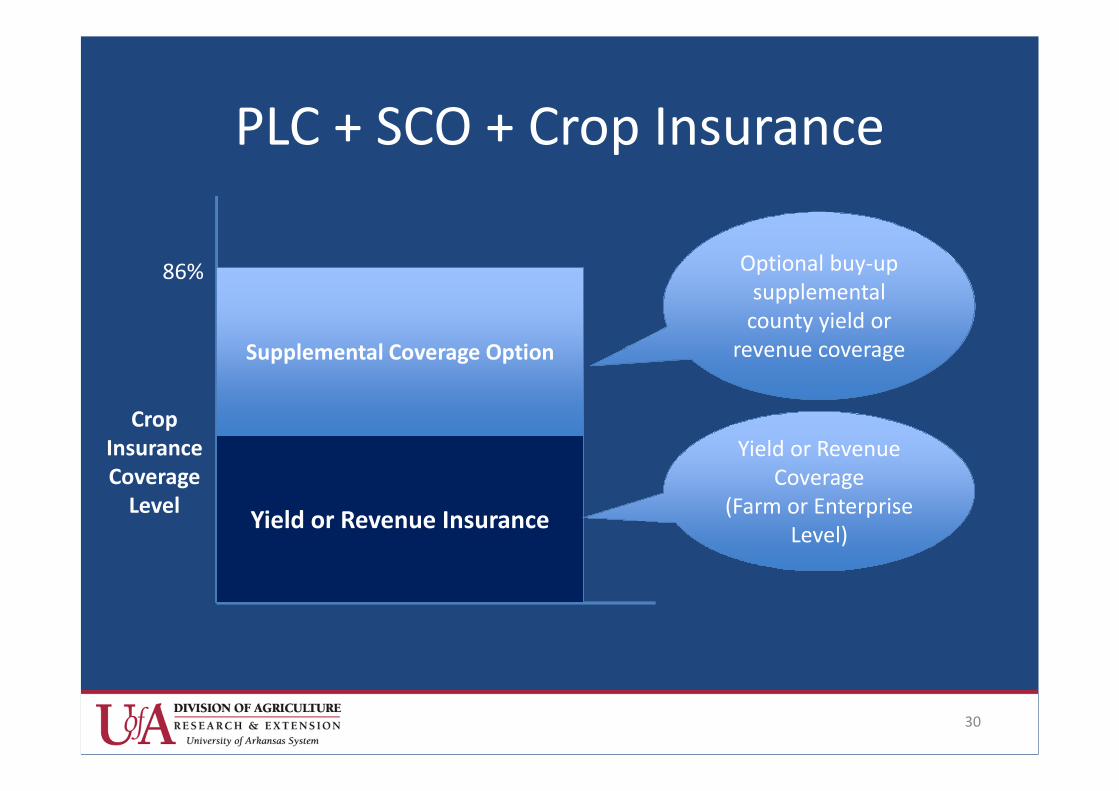
PLC + SCO + Crop Insurance
Yield or Revenue Insurance
Supplemental Coverage Option
86%
CropInsuranceCoverage
Level
Optional buy-upsupplemental
county yield orrevenue coverage
Yield or RevenueCoverage
(Farm or EnterpriseLevel)
30

InsuranceGuarantee
Deductible40%
Deductible40%
SCOIndemnity
26%
SCOIndemnity
26%
ActualPrice
XActualYield
Example:60%
coverage
Loss 14%Loss 14%
Ind. CoverageIndemnity
Ind. CoverageIndemnity
Insu
ran
ceP
rice
X1
0Ye
arA
vera
ge(A
PH
)Y
ield
Example ofPrice LossCoverage
(PLC)PlusSCO
CropInsuranceExpectedRevenue
+Any PLCBenefits

Choices to be made• Sign-up
– Starting this fall and ending sometime in 2014 accordingto Sec. Vilsack
• Exclusive for each FSA farm unit
• Base acres and ARC farm made for whole unit
• PLC, ARC county and Yield update on a crop-by-crop
• If payments are triggered in 2014 producers willreceive them in October 2015
• All choices are for the life of the farm bill
32

Long-Term International RiceBaseline Projections: 2014-2024
Arkansas Global Rice Economics ProgramArkansas Global Rice Model
Department of Agricultural Economics and AgribusinessUniversity of Arkansas Division of Agriculture
February 2015

A. Overview of the international rice story
B. Recent global rice market drivers
C. Uncertainties in the global rice markets
D. Long-term baseline projections
Presentation Outline

• Steady growth in global trade
- Export expansion in Vietnam, Thailand, Myanmar, and Cambodia
- Import growth in Nigeria, other ECOWAS, and the Middle East
• Production growth– yield growth; marginal increases in area harvested
• Consumption growth– population growth driver; slight decline per capita use
• Abundant global rice supplies keep price growthreasonably steady
Overall International Rice Story

• Thailand resumes active market participation
• China remains major rice importer
• Myanmar and Cambodia become important riceexporters
• Growing segmentation in trade flows and pricesof long and medium grain markets
Key Global Rice Market Drivers

• Timing and ability of Thailand to dispose ricestocks
• India export capacity with expanded PDS
• High margins between Western Hemisphere andAsian prices
• Growth in African import markets
Uncertainties in the Global Rice Market

• Self-sufficiency drive by SE Asian importers
• Growth in government subsidies– Massive payments in China– Indonesia– Philippines– Thailand
Uncertainties in the Global Rice Market

• Macroeconomic data : IHS Global Insight
• Average weather conditions
• Continuation of existing policies
• Liquidation Thailand’s PPP excess rice stocks
Basic Assumptions

• Separation between Thai price and other Asian prices under PPP
• Recent PPP suspension made Thai price more competitiveSource: USDA-ERS Rice Outlook, January 2015.
Milled Rice Export Prices, Thailand vs. Vietnam(2010/2011 Average-January 2015)
-100
0
100
200
300
400
500
600
700
Thai 100%B Viet 5% Thai-Viet Margin
USD/MT
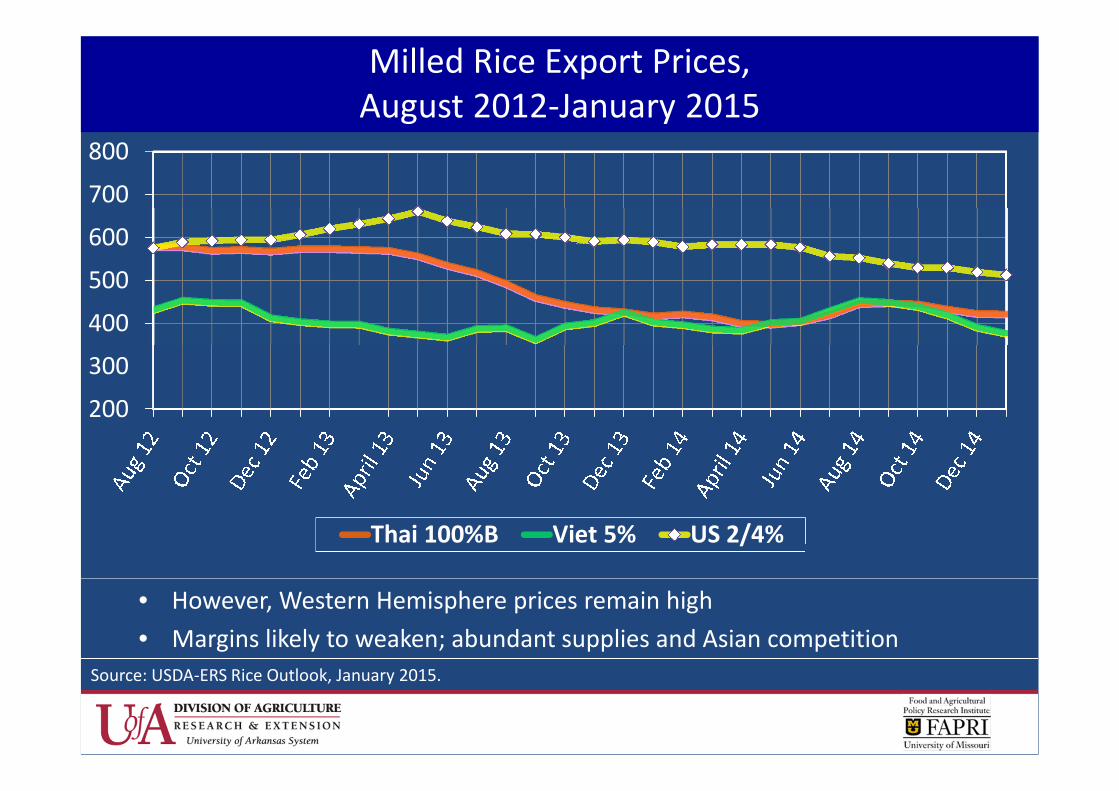
• However, Western Hemisphere prices remain high
• Margins likely to weaken; abundant supplies and Asian competition
Source: USDA-ERS Rice Outlook, January 2015.
Milled Rice Export Prices,August 2012-January 2015
200
300
400
500
600
700
800
Thai 100%B Viet 5% US 2/4%

• Under PPP, rice exports plunged; and stockpiles increased sharply
• With suspension of PPP, Thailand regains leadership in global tradeSource: USDA-ERS Rice Outlook, January 2015.
0
4
8
12
16
20
Stocks
Exports
Thailand Rice Exports and Stocks, 2000-2015

• International reference price range: $426- 485
• Nominal Thai price converges with international reference price
• Real Thai price declines below $300/mt
Source: USDA-ERS Rice Outlook and AGRM projections, January 2015.
LG International Reference Price vs. Thai Price,
2006-2024
100
200
300
400
500
600
700
06/07 08/09 10/11 12/13 14/15 16/17 18/19 20/21 22/23 24/25
International Rice Reference Price, LG Nominal Thai 100 Real Thai100
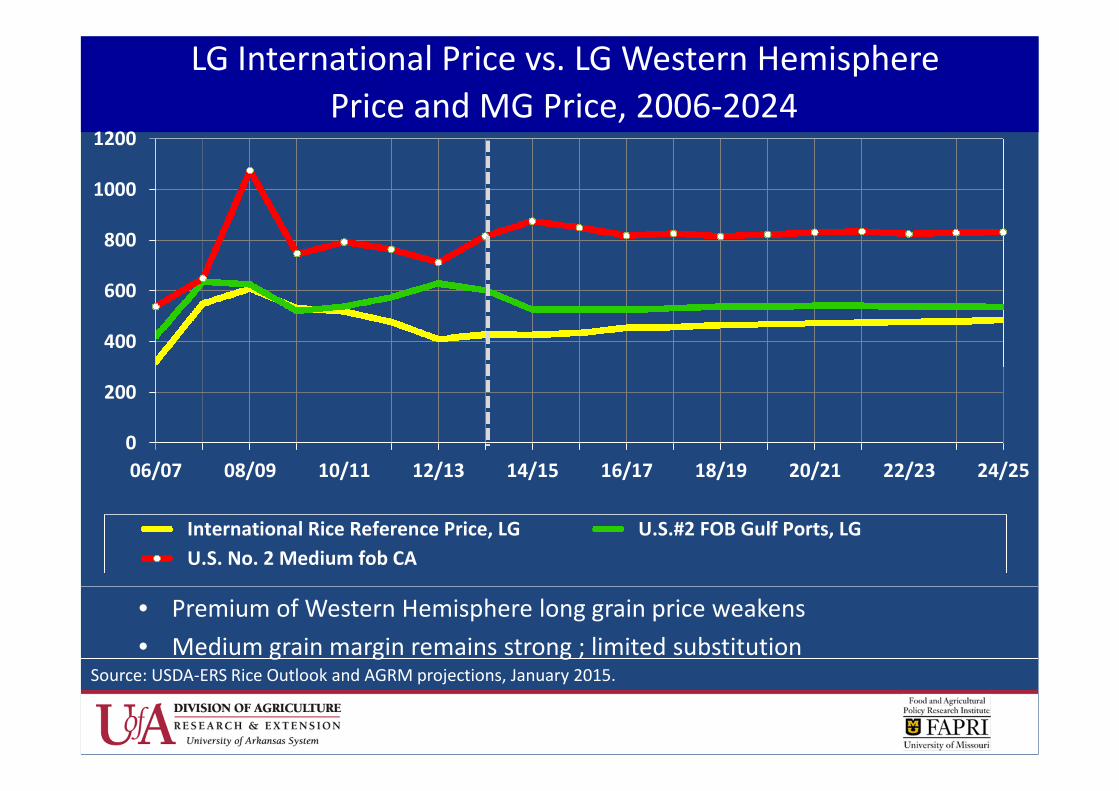
• Premium of Western Hemisphere long grain price weakens
• Medium grain margin remains strong ; limited substitutionSource: USDA-ERS Rice Outlook and AGRM projections, January 2015.
LG International Price vs. LG Western Hemisphere
Price and MG Price, 2006-2024
0
200
400
600
800
1000
1200
06/07 08/09 10/11 12/13 14/15 16/17 18/19 20/21 22/23 24/25
International Rice Reference Price, LG U.S.#2 FOB Gulf Ports, LG
U.S. No. 2 Medium fob CA

• U.S. price 10th percentile converges with International price mean
• International price 90th percentile lies above U.S. price meanSource: USDA-ERS Rice Outlook and AGRM projections, January 2015.
Stochastic Projection Comparisons of International Reference
and U.S. Long Grain Rice Export Prices, 2013-2024
300
340
380
420
460
500
540
580
620
660
700
2013 2014 2015 2016 2017 2018 2019 2020 2021 2022 2023 2024
US_10th percentile US_90th percentile US_mean (200 outcomes)
IRP_10th percentile IRP_90th percentile IRP_mean (200 outcomes)
US$ per MT

0
1
2
3
4
5
2010 2011 2012 2013 2014 2015 2016 2017 2018 2019 2020 2021 2022 2023 2024
LG Rice/Corn LG Rice/Soybean LG Rice/Wheat
U.S. Relative Export Prices, Rice vs. Other Crops
• Rice price increases relative to corn in 2014, then declines and stabilizes
• Relative to wheat, rice price declines in 2014, increases in 2015, then stabilizes
• Relative to soybeans, rice price increases in 2015, then stabilizes
•Source: FAPRI-MU and AGRM projections, January 2015.

Global Rice Trade Balance, % Share by Region, 2011-2024
Origins (Exporters) Destinations (Importers)
• Most exports and export growth come from Asia
• Decreasing rice surplus from the Americas
• Most rice imports go to Asia and Africa; with growth to Africa
0
10
20
30
40
50
60
70
80
90
100
11/
12
12/
13
13/
14
14/
15
15/
16
16/
17
17/
18
18/
19
19/
20
20/
21
21/
22
22/
23
23/
24
24/
25
Africa Americas Asia Europe/Oceania
0
10
20
30
40
50
60
70
80
90
100
11/
12
12/
13
13/
14
14/
15
15/
16
16/
17
17/
18
18/
19
19/
20
20/
21
21/
22
22/
23
23/
24
24/
25
Africa Americas Asia Europe/Oceania

Top World Rice Exporting Countries, 2002-2024
Million MT
Source: AGRM Projections, January 2015.
-5
0
5
10
15
20
25
30
35
40
45
02/03 04/05 06/07 08/09 10/11 12/13 14/15 16/17 18/19 20/21 22/23 24/25
Cambodia
Myanmar(Burma)
United States
Pakistan
Vietnam
India
Thailand

Top World Rice Importing Countries, 2002-2024
Million MT
Source: AGRM Projections, January 2015.
-4
0
4
8
12
16
20
02/03 04/05 06/07 08/09 10/11 12/13 14/15 16/17 18/19 20/21 22/23 24/25
Senegal
Indonesia
Philippines
Saudi Arabia
Iraq
Iran
People's Republicof China
Nigeria

World Medium/Short Rice Exports, 2002-2024
Thousand MT
Source: AGRM Projections, January 2015.
0
500
1000
1500
2000
2500
3000
3500
40002
00
2
20
03
20
04
20
05
20
06
20
07
20
08
20
09
20
10
20
11
20
12
20
13
20
14
20
15
20
16
20
17
20
18
20
19
20
20
20
21
20
22
20
23
20
24
United States Australia Egypt European Union 28 Japan China

World Medium/Short Rice Imports, 2002-2024
Thousand MT
Source: AGRM Projections, January 2015.
0
500
1000
1500
2000
2500
3000
3500
40002
00
2
20
03
20
04
20
05
20
06
20
07
20
08
20
09
20
10
20
11
20
12
20
13
20
14
20
15
20
16
20
17
20
18
20
19
20
20
20
21
20
22
20
23
20
24
United States Turkey Japan South Korea
Taiwan European Union 28 Australia Others (residual)
Baseline Story for Medium/ShortJaponica Rice
• Important market segmentation
• Base driven by WTO commitments by Japan,S. Korea, and Taiwan.
• Growth in demand by Middle East,Mediterranean, and Africa.
• Supply constraints in leading exporters onland and water.
• Price margin strength over long grain prices.

Thailand Rice Exports, MMT
• After 2 years of weakness, Thailand re-captures leadership in global trade
• Average production (2014-24) exceeds consumption by 101.5% (surplus)Source: USDA-PSD and AGRM projections, January 2015.
4
6
8
10
12
14
16
18
20
2000 2002 2004 2006 2008 2010 2012 2014 2016 2018 2020 2022 2024
2014: 10.72024: 13.6

• India’s exports decline and stabilize around 7-8 MMT
• PDS program expanded; recent decline in Basmati exports
• Average production (2014-24) exceeds consumption by 7.3% (surplus)
India Rice Exports, MMT
0
3
6
9
12
15
18
2000 2002 2004 2006 2008 2010 2012 2014 2016 2018 2020 2022 2024
2014: 8.62024: 8.1
Source: USDA-PSD and AGRM projections, January 2015.

• Vietnam focuses more on quality than quantity; aims to improvecompetitiveness in the export market
• Average production (2014-24) exceeds consumption by 31.6% (surplus)
Vietnam Rice Exports, MMT
0
3
6
9
12
15
2000 2002 2004 2006 2008 2010 2012 2014 2016 2018 2020 2022 2024
2014: 6.62024: 7.8
Source: USDA-PSD and AGRM projections, January 2015.

• Rice is not a staple food in Pakistan
• Average production (2014-24) exceeds consumption by 136.1% (surplus)
0
1
2
3
4
5
6
7
8
2000 2002 2004 2006 2008 2010 2012 2014 2016 2018 2020 2022 2024
2014: 4.02024: 4.2
Pakistan Rice Exports, MMT
Source: USDA-PSD and AGRM projections, January 2015.

• Increasing investments will support expanded exports from these twocountries
• Average production (2014-24) exceeds consumption by 25.1% (surplus)
Cambodia and Myanmar Rice Exports, MMT
0
1
2
3
4
5
2000 2002 2004 2006 2008 2010 2012 2014 2016 2018 2020 2022 2024
Myanmar Cambodia
Year Cambodia Myanmar2014: 1.2 1.52024: 2.4 2.7
Source: USDA-PSD and AGRM projections, January 2015.

• PRC to remain a major importer; population grows 0.4%, per capita use -0.5%
• Dependent on extent of government supports; TRQ implementation
• On average, production (2014-24) lags consumption by 0.6% (deficit)
People’s Republic of China Rice Imports, MMT
0
1
2
3
4
5
6
2000 2002 2004 2006 2008 2010 2012 2014 2016 2018 2020 2022 2024
2014: 4.02024: 3.8
Source: USDA-PSD and AGRM projections, January 2015.

• Indonesia to remain a major exporter despite self-sufficiency goal
• Population grows 1.0%; per capita use declines 0.3% per year
• Average production (2014-24) lags consumption by 3.8% (deficit)
Indonesia Rice Imports, MMT
0
1
2
3
4
5
2000 2002 2004 2006 2008 2010 2012 2014 2016 2018 2020 2022 2024
2014: 1.42024: 1.3
Source: USDA-PSD and AGRM projections, January 2015.

• Middle East consumption grows 2.1% annually,
• Population grows 1.6% and per capita use 0.5% per year
• Average production (2014-24) lags consumption by 71.1% (deficit)
Middle East Rice Imports, MMT
0
2
4
6
8
10
2000 2002 2004 2006 2008 2010 2012 2014 2016 2018 2020 2022 2024
Iraq Iran Saudi Arabia
2014: 4.42024: 5.7
Source: USDA-PSD and AGRM projections, January 2015.

• The Philippines will remain a substantial importer despite governmentefforts to attain self-sufficiency; population grows 1.6%; per capita use flat
• Average production (2014-24) lags consumption by 10.1% (deficit)
Philippine Rice Imports, MMT
0
1
2
3
4
5
2000 2002 2004 2006 2008 2010 2012 2014 2016 2018 2020 2022 2024
2014: 1.52024: 2.0
Source: USDA-PSD and AGRM projections, January 2015.

• Nigeria emerges as the top importer over the baseline
• Consumption expands as population grows 2.7% and per capita use 1.5%
• Average production (2014-24) lags consumption by 51.5% (deficit)
0
2
4
6
8
10
2000 2002 2004 2006 2008 2010 2012 2014 2016 2018 2020 2022 2024
2014: 3.32024: 4.8
Nigeria Rice Imports, MMT
Source: USDA-PSD and AGRM projections, January 2015.

• ECOWAS-14 population grows 2.3%; per capita use 1.0%
• Average production (2014-24) lags consumption by 43.6% (deficit)
0
2
4
6
8
10
2000 2002 2004 2006 2008 2010 2012 2014 2016 2018 2020 2022 2024
2014: 5.12024: 6.6
ECOWAS-14 Rice Imports, MMT(excluding Nigeria)
Source: USDA-PSD and AGRM projections, January 2015.
Thank You!
Comments/Questions?