2014-15 - princeton university - office of finance … · 2014-15. princeton university highlights...
TRANSCRIPT

Report of the Treasurer
2014-15

Princeton University HighlightsFiscal years ended June 30
F i n a n c i a l(dollars in thousands) 2 0 1 5 2 0 1 4
Principal sources of revenues
Tuition and fees (net) $ 112,060 $ 107,840Government grants and contracts 274,973 272,280Private gifts, grants, and contracts 88,023 83,873Investment earnings, including unrealized gains or losses 2,519,131 3,395,428
Principal purposes of expenditures
Educational and general 1,317,959 1,239,678Auxiliary 79,709 130,123
Summary of financial position
Assets 27,891,414 25,796,425Liabilities 4,555,439 4,288,237Net assets 23,335,975 21,508,188
net assets
Unrestricted/designated 9,928,976 8,354,141Temporarily restricted 11,535,371 11,334,911Permanently restricted 1,871,628 1,819,136
Total $ 23,335,975 $ 21,508,188
S T u d e n T Senrollment
Undergraduate students 5,275 5,244Graduate students 2,697 2,666
degrees conferred
Bachelor degrees 1,282 1,267Advanced and all other degrees 885 996
annual tuition rate
Undergraduate $ 41,820 $ 40,170 Graduate 41,820 40,170
Fac u lT yFull-time equivalent 1,032 1,004

1
“Questions about energy, the environment, and sustainability are among the most important that the world faces….We must all find ways to reduce the damage that we cause to the environment—and that is why the University, which shares in this ethical obligation, seeks to reduce damage to the environment from its campus and other activities under its control.”—President christopher l. eisgruber ’83

2
am proud to share the report of the treasurer for fiscal year 2015. This year’s report is focused on the concept
of sustainability—our commitment to responsibly steward our financial and environmental resources.
As you will see in the overview prepared by our controller, Ken Molinaro, the year ended with an increase of $1.8 billion in net assets over the previous year, and a revenue surplus of $79.5 million thanks to responsible stewardship, confirmed by the unqualified independent auditor’s report. This is a notable achievement given the fact that this audit was conducted after a year of operating with an entirely new chart of accounts, new tools, new systems, and new business processes. It has been a learning experience for our entire campus community, including the Office of Finance and Treasury staff, and successfully closing the books at fiscal year-end was an important milestone—signaling the start of a new era in Princeton’s financial history.
When the fiscal year ended on June 30, 2015, Princeton University had an endowment valued at $22.7 billion, an increase of $1.7 billion over the previous year. This growth includes an investment return of 12.7% which is significantly higher than that achieved by most of our peer institutions—a reflection of the outstanding leadership of Andy Golden and his team at the Princeton University Investment Company. You will find a detailed analysis of our investment strategies and results in the pages that follow.
Letter from the Treasurer
These favorable financial results are due, in part, to a focus on long-term fiscal sustainability. Princeton University has flourished for 270 years. As its stewards, we take seriously our responsibility to ensure that its resources will be available for generations to come. This requires not only a long view of our finances, but a sustainable perspective in all of our administrative and academic operations.
In this report, I have highlighted some of the distinctive programs and initiatives that our University is taking in the area of environmental sustainability. I believe we are leaders among our peers because of the highly integrated efforts that bring together scholars of many disciplines; administrators from many units of the University; and students who are researchers, activists, and leaders—all focused on the common goal of building a culture of respect for our natural and built environments, and careful conservation of our resources.
During the strategic planning process,
President Eisgruber has encouraged us to consider how this issue will impact the future of the University. In fact, many have encountered him riding his bicycle to Nassau Hall to signal his personal commitment to exploring alternative transportation strategies! Those of us in the Office of Finance and Treasury also are committed to conducting our business in increasingly environmentally responsible ways. Our recent Princeton Prime initiative has resulted in significant reductions of paper transactions in invoicing, purchase orders, and catalogs. In our offices, we have installed filtered water dispensers in place of bottled water. We use 100 percent recycled paper and engage in a recycling program for our
At Princeton, there is a broadly held commitment to the sustainability of our financial and physical assets. We can be proud of the innovative approach we have taken to support the academic and administrative initiatives, which reflect our shared commitment to the teaching and research mission.”
“

3
beverage dispensers. Our staff members share a limited number of centralized printers, rather than purchasing individual desktop printers, to encourage limited energy, paper, and ink usage. We have also partnered with our colleagues in the Office of Information Technology and the Office of University Services to hold “Sustainability Fairs,” promoting ways to reduce, reuse, and recycle.
Our faculty, staff, and students partner in a model often described as “campus as a lab,” a reference to using our facilities as living laboratories to cultivate collaborative research and operational innovation. As Professor Kelly Caylor, director of the Environmental Studies Program in the Princeton Environmental Institute, notes, “At Princeton, the sense of collegiality and cooperation is tangible. The faculty knows that the staff and facilities professionals are talented partners. We’re all focused on creating environmental citizenship for our students.”
The environmental challenges facing our planet cannot be met with- out a broad coalition of people and organizations focused on common goals. Princeton University is modeling the kind of collegiality and collaboration that will result in success. I am honored to be a leader in this effort to steward our fiscal and natural resources, and to share the good news found in this report with you.
Sincerely,
Carolyn N. AinslieVice President for Finance and Treasurer

4
to legislative staffers on Capitol Hill, Professor Carter saw the need for scientific information that would be accessible to any interested layperson. The Distillates provide reliable and timely information for interested citizens such as policymakers, corporate leaders, educators, and students.
The research and teaching at the Andlinger Center is conducted by scholars from more than30 academic disciplines. These faculty lead the educational activities of the Center, which include 32 undergraduate and graduate course offerings, summer internships, graduate fellowships, and a summer laboratory program for talented high school students. The Center sponsors two certificate programs for undergraduates—one in Sustainable Energy, and another in Technology and Society with a focus on energy, which is co-sponsored by the Keller Center.
The Andlinger Center is housed in a building designed specifically for energy and environmental research and education, and features green roofs, rain gardens, advanced lighting controls, heat recovery systems, and rainwater and condensate harvesting. It houses state-of-the-art laboratories and equipment, arranged to encourage collaboration. One of the newest and most impressive structures on campus, it was designed by the inter- nationally renowned architects, Billie Tsien
Faculty and students from many and varied academic departments are engaged in study, research, and practice on a broad range of energy and environmental issues. Most of these efforts are housed in the Andlinger Center for Energy and the Environment and the Princeton Environmental Institute.
The Andlinger Center carries out its mission “to develop solutions to ensure our energy and environmental future” under the leadership of Professor Emily Carter, its founding director, who believes that the environmental problems facing our planet are among the most complex challenges of our generation, and they require the best minds from many fields. The Center awards funds to support faculty and student research on wide-ranging topics, from batteries and biofuels to an examination of the forces shaping the future of humanity in the face of climate change.
The Andlinger Center serves the University community as well as the public sector. The “Princeton E-ffiliates Partnership” invites some of the world’s major energy providers to engage in collaborative research and technology transfer.
Another public service is the publication of a series of briefings called the “Energy Technology Distillates.” Inspired by her visits
We are working in service of society; we are working to make the world a better place. It’s very meaningful, it’s incredibly important, and it gives you a real sense of satisfaction and reward knowing you are doing something good for the rest of the world.”—emily carter, Gerhard R. andlinger Professor in energy and the environment; Professor of Mechanical and aerospace engineering and applied and computational Mathematics; director, andlinger center for energy and the environment
“
ACADEMIC INITIATIvES
PRINCETON’S COMMITMENT TO SUSTAINABILITY

5
and Tod Williams ’65 *67, and will celebrate its official opening in spring 2016 with a symposium led by distinguished experts in the field.
The Princeton Environmental Institute (PEI) was established to provide a focus for research, instruction, and outreach in environmental science, technology, and public policy that had been taking place at the University since the 1960s. PEI has more than 120 faculty member affiliates, representing over 25 academic disciplines, and its principal research centers address complex issues surrounding global change; energy and climate; biogeochemical cycles; molecular geochemistry; biodiversity; conservation; environmental science and policy; infectious diseases and global health; and sustainable development in impoverished and resource-challenged regions of the world.
Professor Kelly Caylor directs PEI’s Program in Environmental Studies, launched in 1991. Professor Caylor believes it was important for Princeton to take the time to evaluate how best to approach educational programs in this field. The result was what he calls a “trans-disciplinary” effort to engage humanists, scientists, engineers, and others in a common purpose and a common agenda. Students who earn this certificate write their senior theses by conducting in-depth studies of environmental issues related to their own disciplines.
A distinctive initiative of PEI is the Grand Challenges Program, which is led by faculty fromdifferent disciplines with postdoctoral fellows and students and examines the scientific, technical, public policy, and human dimensions of three specific areas: climate and energy; sustainable
development in Africa; and global health and infectious disease. This program provides an innovative network of activities including 35 academic courses, undergraduate internships, graduate fellowships, funding for faculty projects, and support of senior thesis research.
Both Professor Carter and Professor Caylorstrive to have students adopt sustainable behaviors and sustainable practices, on campusand in their communities.
Princeton University already has substantial work under way on a variety of energy-related and environmental problems, from both the technological and public policy perspectives. My hope in establishing this center is to bring those strengths together and focus them on ‘clean tech’ solutions to the most important problems facing our society today. The work of the center will help create a better world for our children and grandchildren, which I see as a personal as well as institutional responsibility.”—Gerhard andlinger ’52
“

6
Students, faculty, staff, and visitors to Princeton’scampus are struck by the beauty and grandeur of both the built and natural landscapes, but few are aware that its maintenance is guided by a deep commitment to sustainability. Every member of the Facilities organization is engaged in this effort, from recycling nearly 100% of its leaves and trees to create compost, to reducing stormwater run-off, and using “blue cleaning” equipment to turn tap water into electrically activated water to eliminate the need for traditional cleaners.
Several major initiatives are managed bythe Engineering and Campus Energy Department.Led by Executive Director Tom Nyquist, this team is focused on the goal of reducing the University’s carbon dioxide (CO2) emissions to 1990 levels by the year 2020. One of the team's earliest initiatives was the construction of the cogeneration plant in 1996 to produce the electricity, steam, and chilled water that heats, powers, and cools the campus, creating a “microgrid” of generation and delivery. The plant also serves as a laboratory for learning about energy efficiency and water conservation under the direction of Energy Plant Manager Ted Borer.
Recently, more than 16,500 photovoltaic panels were installed to create a 27-acre solar collector field. The site is connected to the main campus electric power distribution system and meets about 5.5% of Princeton’s annual electrical needs.
Another major effort is the lighting efficiency upgrade program, which will convert more than 100,000 fixtures to light-emitting diode (LED) technology in buildings across campus. Directed by Energy Manager
Bill Broadhurst, a milestone achievement in this project
was the recent conversion of all 839 lighting fixtures in Jadwin Gymnasium. Each fixture uses 100 to 170 fewer watts, saving 192 kw over the entire installation. The new wireless control system will bring smarter, more flexible performance; provide savings; and, more importantly, reduce the health and safety risks for employees, as they will rarely need to climb ladders for repairs and replacements. The ballasts, aluminum, and glass from the old lights will be fully recycled offsite.
There are several other projects that have low visibility but significant impact on the environment. Heat exchangers have been installed to capture and reuse the heat that would normally escape through chimneys. New technology allows for central control of over 100,000 points of automated sensors, enabling engineers to monitor optimal levels of usage and calibration. Water treatment equipment has been upgraded to reduce bothwater and chemical usage. Perhaps the most underappreciated enhancement is the replacement of thousands of steam traps. Princeton’s campus is heated by miles of underground steam pipes, many of which are inefficient. The installation of almost 9,000 newtraps will result in a decreased failure rate, less demand on the cogeneration plant, and lowered costs and risks associated with repairs.
In addition to enhancing the current facilities, Princeton has established its ownrigorous guidelines for sustainable building, ensuring that all construction and renovation projects meet campus sustainability goals.These standards require Life Cycle Cost Analysis(LCCA) of major building systems, as well as consideration of the building’s educational and research potential in sustainability problem solving. New construction and major renovations also incur an internal “carbon tax” to justify efficient technologies that may have higher up-front costs but lower system lifetime costs and other environmental benefits.
Progress toward the 2020 goal of reduced CO2 emissions, as well as assessments of other major initiatives, are monitored by the staff of the Facilities organization. Targets beyond 2020 are being determined collaboratively with faculty experts.
CAMPUS FACILITIES

7
campus dining Sustainable Practices
61% of total food is sustainable and 46% is from local sources
3,273 gallons of used fryer oil converted annually into biodiesel
CO2 offset is 26.38 tons of trash from landfill
Partnership with Sea to Table, which is committed to source under-utilized fish species from the U.S.
Coffee certified by the Rainforest Alliance
Food waste transported to AgriArk in Hopewell, NJ and is used as compost
Discount incentive for using reusable mugs for beverages
Plant-based compostable products such as cups and cutlery used for catered events
Paper goods at the Frist Campus Center made of 100% post-consumer recycled materials
“Tray-free” dining reduces food waste, water, and energy, avoids 23 metric tons of CO
2 emissions
Princeton University Campus Dining engages students through a food program focused on wellness, community, and culinary distinction. Executive Director Smitha Haneef leads her team’s efforts to procure locally
and sustainably-sourced food and to use environmentally-friendly practices. Since her arrival in 2014, Ms. Haneef has formed partnerships with faculty, students, culinary professionals, and community organizations to provide programming that expands our understanding the role food plays in our lives and in society. One such program brought Barton Seaver, renowned chef and contributor to the National Geographic blog “Ocean views,” to campus for a conversation about a more
defined path for the future of food systems and sustainability in campus dining. Related work on the use of underutilized species of fish earned Campus Dining an award from the National Association of College & University Food Services. Another educational project is the introduction of an “urban cultivator,” a hydroponic, vertical garden where organic vegetables, herbs, and microgreens can grow in a small indoor space. This pilot program will be the first of its kind in a university setting.
Campus Dining has partnered with regional community groups such as the Trenton Soup Kitchen, as well as international non-profits such as FEED, an organization founded by Lauren Bush Lauren ’06, which supports programs that are working to fight hunger and eliminate malnutrition throughout the world. By providing its core services within the broader context of social and environmental issues, Princeton University Campus Dining exemplifies the integration of academic and administrative commitments to sustainability.
In Campus Dining, we are focused not on sustainability as an end, but as part of a broader approach to overarching culinary principles.”—Smitha Haneef, executive director
“
CAMPUS DINING

8
In the early 1970s, as environmental awareness began to emerge and the first Earth Day was celebrated, then-President William Bowen established the Princeton Council on Environmental Studies to coordinate the teaching and research activities that were occurring across campus. It is unlikely that President Bowen could have predicted that 45 years later, a fully-staffed Office of Sustainability would lead a campus-wide effort to address environmental issues with 10 distinct areas of emphasis. Although the Office of Sustainability’s programs and accomplishments are practical and technically impressive, its mission is holistic—to nurture a dynamic culture of sustainability.
Under the leadership of vice President for Facilities Mike McKay, founding director Shana Weber started the office in 2006 as a centralized resource for students, faculty, staff, and community partners interested in environmental research and activity. Today, the office monitors projects including transportation, waste management, procurement of goods, and academic activities and civic engagement. Guided by the University’s Sustainability Plan, the office collaborates with campus partners to address three primary areas: greenhouse gas emissions reduction; resource conservation; and research, education, and civic engagement.
The office coordinates the Sustainability Committee, a group of students, faculty, and staff who meet monthly to monitor progress
toward sustainability goals, as well as the Sustainability Steering Council, a group of senior administrators and faculty charged with advising on strategic direction.
The Office of Sustainability frequently partners with faculty on internships and projects. Recent activities include collaboration with Forrest Meggers’s, assistant professor of Architecture and the Andlinger Center for Energy and the Environment, C.H.A.O.S. (Cooling and Heating for Architecturally Optimized Systems) lab and Postdoctoral Research Associate Sander van der Linden’s environmental decision-making lab (SED).
Communications has become a key priority for the office—an effort to build awareness of national and global challenges and the University initiatives that are addressing them. When Ms. Weber joined the Facilities organization, she realized that much of the staff was engaging in cutting-edge activity in many areas such as energy, landscape and stormwater management, and green building strategies. She encouraged her colleagues to promote the accomplishments of the Facilities departments, along with other
OFFICE OF SUSTAINABILITY

2014 Sustainability Highlights
Research & Education 20% of graduating seniors engaged academically in environmental studies and sustainability during their time at Princeton
Energy$5.7 million in annual energy savings since 2008
Buildings1.24 million square feet of new construction and major renovation projects have been built according to Princeton’s aggressive sustainability and energy conservation guidelines since 2008
Transportation520 fewer commuter cars on campus compared to 2008; 722 campus community members participate in the Transportation Demand Management program
Campus and Civic Engagement12 High Meadows fellows are currently working for environmental nonprofit organizations across the nation
Purchasing92% of general-use office paper purchased was 100% post-consumer recycled; 55% by volume of chemical cleaners and soaps purchased were Green SealTM certified
Waste Reduction43% recycling rate, an increase from 38% in 2006; 28% overall waste reduction since 2008
Landscape and Stormwater Management 40% decrease in pesticide use since 2007
Water21% overall decrease in water usage since 2006; 25% water usage decrease in residence halls since 2006
9
Shana Weber believes Princeton University is a leader in sustainable practice, and she sees the current strategic planning and campus planning processes as opportunities to place Princeton at the vanguard of this work. Impelled by the belief that the decisions we make now will affect the next 30 years, she asks provocative
questions—“Can we become a campus that eventually no longer relies on fossil fuels for energy? Can we use the campus to demonstrate an ethos of thoughtful sustainability?”—which will no doubt inspire even greater achievements in the future.
administrative departments such as Campus Dining, Transportation, Procurement, and University Services. One of the most innovative communication strategies is the creation of the GreenSpace Kiosk, an interactive space with rotating exhibits located in Frist Campus Center. This emphasis on communication is designed to build a culture of sustainability. As Ms. Weber states, “We’re trying to make the culture of sustainability at Princeton much more obvious.”
One of the Office of Sustainability’s signature projects has been the “Drink Local” initiative. Since 2009, undergraduate freshmen and new graduate students receive complimentary water bottles at the start of the academic year. They are encouraged to use the 200 filtered-water stations across campus rather than purchasing bottled water—a practice that is expensive and that perpetuates our reliance on fossil fuels.
In recent years Princeton has made a major investment in campus sustainability, from a solar farm across the lake to efficiency gains in the supply chain that supports a multibillion dollar organization. Supported by student, faculty, and alumni interest, these efforts drew upon our great strengths in science, policy, and engineering while linking research, teaching, and service to the outcomes. The result is a wonderful example of practicing what we have preached.”—carl Ferenbach iii ’64, chairman, High Meadows Foundation
“

10
Princeton students take advantage of the “campus as a lab” model to conduct research, engage in service, and participate in student groups. There are more than a dozen student-led organizations that provide leadership in areas such as organic farming, botany and horticulture, lobbying and communication, and sustainable fashion.
Greening Princeton is one of the larger organizations, composed of undergraduate and graduate students who collaborate withadministrators to influence on-campus behavior and practices. Members have worked with Campus Dining on projects including “tray-free” dining and the purchase of local, organic produce. In 2007, they launched a farmers’ market where members of the University and local communities were able to purchase fresh, locally grown produce and other goods from area farmers and businesses that use sustainable practices. In 2013, Greening Princeton, in partnership with Building Services, successfully piloted mixed recycling in select dorms, resulting in the recent switch to the new collection system campus-wide.
The Princeton Garden Project planted its first garden at Forbes College in April 2007, and now manages an additional plot near the Frist Campus Center. The group educates the campus and community about food systems and its implications for the environment, nutrition, and the future. They model sustainable food production; provide fresh, organic produce to campus chefs; and conduct outreach and education programs.
Students in these groups and many others meet regularly through the Office of Sustainability’s GreenLeaders consortium to share information and resources. Professor Kelly Caylor sees students as leaders in many academic and research projects. He notes that they are able to see the tangible evidence of their work on campus, and it inspires them and others to remain committed to these efforts. He states, “We’re giving them a model of how to behave in their lives, long after they leave the University.”
STUDENT ENGAGEMENT
Student Voice: Hannah Kraus ’17
Hannah Kraus arrived at Princeton from her home state of Vermont, where her family and friends were keenly aware of environmental issues. On campus, Hannah is the GreenLeader coordinator and manager of the Princeton Garden Project. She reflected on her early impressions of Princeton’s sustainability efforts, her current projects, and her hopes for the future.
In vermont, sustainability is deeply embedded in the culture—but I didn’t understand how important sustainability was to me until I arrived at Princeton and realized it wasn’t the norm for everyone growing up.
This motivated me to connect with the Office of Sustainability, and become involved in the Princeton Garden Project. I began working with other student leaders through our GreenLeader Consortium, which is a great way for us to share our projects.
Through my involvement, I’ve come to understand that Princeton is deeply committed to many great sustainability initiatives, but that those initiatives don’t always permeate campus culture. Things like the cogeneration plant, the solar field, the commitment to use locally sourced food in the dining halls—these are incredible achievements. I wish more students and faculty knew about them. Publicizing these achievements is a top priority in creating more of a culture of sustainability on our campus.
It’s really exciting to see that our current campus planning process is being closely aligned with a new sustainability plan. I helped initiate a seminar this semester (led by Dr. Weber, the Director of the Office of Sustainability) that was designed as one way to inform the campus planning process with student voices. The seminar explores philosophical questions about how Princeton can move forward with growth in the most sustainable and ethical manner.

11
Financial Statement OverviewLETTER fRoM ThE ConTRoLLER
iscal year 2015 was a financially strong year for Princeton University, a period in which it continued to build upon its sound financial position. Net assets for the fiscal year ended June 30, 2015, increased by $1.8 billion, or 8.5 percent, due to solid investment gains
combined with a healthy operating surplus. Total net assets of $23.3 billion at year-end set a new high-water mark for Princeton. A return of 12.7 percent from the managed investment portfolio places Princeton in the highest-performing tier of large university endowments over the long term. The University’s Endowment spending rate of 4.2 percent in 2015 was below the midpoint of the spending policy band established by its Board of Trustees, and consistent with Princeton’s conservative fiscal management track record. An operating surplus of $79.5 million, or 4.9 percent of total operating revenues, was achieved primarily through prudent management of operating expenses, as well as careful stewardship of the University’s financial resources.
F
Revenues from tuition and fees, net of scholarships and fellowships, increased 3.9 percent in fiscal 2015, although Princeton’s steadfast commitment to financial aid and affordability has held net tuition growth under 2 percent annually on a nominal basis for more than a decade. Revenues from gifts and pledges of $142 million were consistent with Princeton’s long history of successful fundraising. Annual Giving raised a record $61.5 million, a testament to the unwavering generosity of the University’s loyal alumni. Revenues from government sponsors grew 1.0 percent during the year, while the long-term trend remained flat due to constraints on federal spending.
The University successfully pursued its annual practice of issuing debt for capital expenditure and property renewal purposes. Princeton’s bonds and notes continue to attract high demand as a safe haven for conservative investors. In connection with a $187 million tax-exempt bond refunding issue and a $170 million new money issue during the fiscal year, Princeton again received the highest attainable credit ratings from both Moody’s Investors Service and Standard & Poor’s agencies, affirming
the University’s stellar credit standing.
a c c O u n T i n G P R i n c i P l e SPrinceton University’s financial statements, which follow herein, are presented in accordance with generally accepted accounting principles set forth by the Financial Accounting Standards Board (FASB) as supplemented by the American Institute of Certified Public Accountants (AICPA) audit and accounting guide for not-for-profit entities. In addition to general accounting guidance, the statements reflect the impact of specific reporting requirements of not-for-profit organizations prescribed by FASB Accounting Standards Codification (ASC) 958, Not-for-Profit Entities, on the subjects of accounting for contributions and the format of external financial statements. Compliance with AICPA guidance includes consolidating wholly owned subsidiaries and significant trusts in which the University is a beneficiary, as well as reporting tuition discounts, primarily fellowships and scholarships, as reductions of tuition revenue. The financial statements are fully comparable, including prior-year data on the consolidated statements of activities.
12
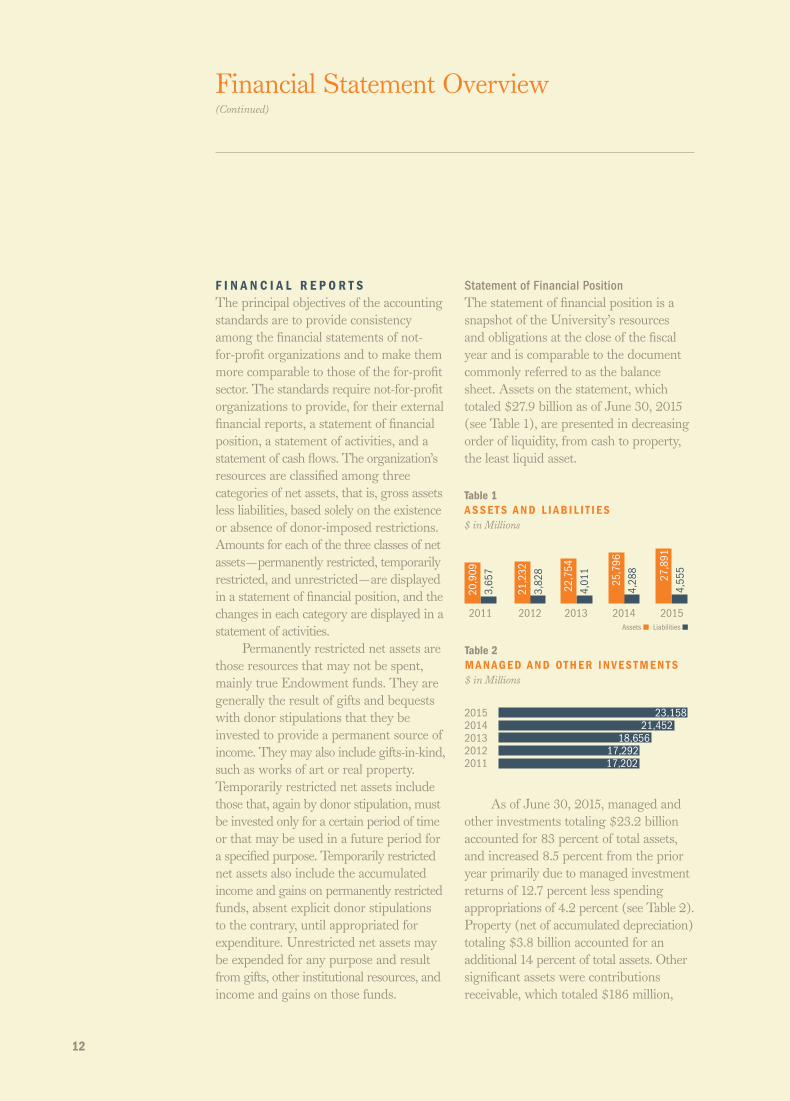
Statement of financial PositionThe statement of financial position is a snapshot of the University’s resources and obligations at the close of the fiscal year and is comparable to the document commonly referred to as the balance sheet. Assets on the statement, which totaled $27.9 billion as of June 30, 2015 (see Table 1), are presented in decreasing order of liquidity, from cash to property, the least liquid asset.
As of June 30, 2015, managed and other investments totaling $23.2 billion accounted for 83 percent of total assets, and increased 8.5 percent from the prior year primarily due to managed investment returns of 12.7 percent less spending appropriations of 4.2 percent (see Table 2). Property (net of accumulated depreciation) totaling $3.8 billion accounted for an additional 14 percent of total assets. Other significant assets were contributions receivable, which totaled $186 million,
F i n a n c i a l R e P O R T SThe principal objectives of the accounting standards are to provide consistency among the financial statements of not-for-profit organizations and to make them more comparable to those of the for-profit sector. The standards require not-for-profit organizations to provide, for their external financial reports, a statement of financial position, a statement of activities, and a statement of cash flows. The organization’s resources are classified among three categories of net assets, that is, gross assets less liabilities, based solely on the existence or absence of donor-imposed restrictions. Amounts for each of the three classes of net assets—permanently restricted, temporarily restricted, and unrestricted—are displayed in a statement of financial position, and the changes in each category are displayed in a statement of activities.
Permanently restricted net assets are those resources that may not be spent, mainly true Endowment funds. They are generally the result of gifts and bequests with donor stipulations that they be invested to provide a permanent source of income. They may also include gifts-in-kind, such as works of art or real property. Temporarily restricted net assets include those that, again by donor stipulation, must be invested only for a certain period of time or that may be used in a future period for a specified purpose. Temporarily restricted net assets also include the accumulated income and gains on permanently restricted funds, absent explicit donor stipulations to the contrary, until appropriated for expenditure. Unrestricted net assets may be expended for any purpose and result from gifts, other institutional resources, and income and gains on those funds.
Financial Statement Overview(Continued)
Table 2 M a n aG e d a n d OT H e R i n V e S T M e n T S $ in Millions
21,45223,158
17,29217,202
18,656
20152014201320122011
Table 1 a S S e T S a n d l i a b i l i T i e S $ in Millions
4,01
1
25,7
964,
288
2011 2012 2013 2014 2015
20,9
093,
657
21,2
323,
828
Assets Liabilities
4,55
5
22,7
54
27,8
91

13
and educational and mortgage loans receivable, which totaled $378 million.
Liabilities, which totaled $4.6 billion as of June 30, 2015 (see Table 1), are presented in order of anticipated time of liquidation. Indebtedness to third parties totaling $3.3 billion, which primarily includes loans to finance the construction, renovation, and maintenance of University facilities and bonds issued for working capital and general corporate purposes, accounted for 72 percent of total liabilities as of June 30, 2015. Also included are the liabilities under unitrust agreements totaling $102 million, which represent the estimated amounts payable to donors under the University’s planned giving programs. The accounting rules require donees to record a liability for the present value of the expected lifetime payments to donors, and to recognize the net amount received as a contribution in the year of receipt.
Net assets, which totaled $23.3 billion as of June 30, 2015, are calculated as total assets less total liabilities, and are classified into three categories—unrestricted, temporarily restricted, and permanently restricted, as discussed above (see Table 3). Unrestricted net assets, which totaled $9.9 billion as of June 30, 2015, include gifts and other institutional resources that are not subject to explicit donor-imposed restrictions. In accordance with the accounting rules, certain unrestricted net assets have been partially earmarked, or designated, according to their intended use by the University. Temporarily restricted net assets, which totaled $11.5 billion, include promises to give that are receivable in future years as well as donor-restricted
contributions whose purpose has not yet been fulfilled. The most significant portion of temporarily restricted net assets represents the accumulated income and gains on true Endowment assets that have been reinvested. Permanently restricted net assets, which total $1.9 billion, include Endowment gifts that cannot be spent and funds held in perpetual trust by others.
Statement of ActivitiesThe statement of activities is a summary of the income and expenses for the year, classified according to the existence or absence of the restrictions described above. Sources such as tuition, sponsored research, and auxiliary activities are normally shown as unrestricted income, whereas income from certain gifts or sponsored agreements may be includible in any of the three classes of income, depending upon the donor’s specifications. Gifts to Endowment, for example, are permanently restricted. Income from temporarily restricted sources is reclassified to unrestricted income when the circumstances of the restriction have been fulfilled. All expenditures are made from unrestricted net assets, since funds cannot be spent until all restrictions on their use have been removed.
Table 3 n e T a S S e T S $ in Millions
11,33511,535
8,3549,929
1,7238,9876,6941,667
9,7167,261
20152014201320122011
1,7661,819
1,872
8,9126,673
Unrestricted Temporarily Restricted Permanently Restricted

14
The statement of activities is presented in two sections, operating and nonoperating, which reflect the principles of the University’s operating budget. Items of income reported in the operating section, which totaled $1.6 billion for the year ended June 30, 2015, include all unrestricted receipts as well as the Endowment earnings made available for spending under the spending rule. The major components of operating revenues and their relative proportion are shown in Figure 1.
Virtually all expenses, which totaled $1.5 billion, are considered to be associated with operating activity. The major com-ponents of operating expenses and their relative proportion are shown in Figure 2.
For the year ended June 30, 2015, the University produced a surplus from operating activities in the amount of $79 million, calculated as total operating revenues less total operating expenses, as illustrated in Table 4.
Major items of income that are considered nonoperating, which amounted to $1.7 billion for the year ended June 30,
2015, include unrealized appreciation on investments and Endowment income earned in the current year to be used in the current and succeeding years, in accordance with operating budget policy. Unrestricted gift income, primarily from Annual Giving, is shown as operating income, whereas income from promises to give (pledges) is considered a nonoperating source of income.
The statement of activities concludes with a reconciliation of the change in each class of net assets for the year to the balance of net assets shown on the statement of financial position. The total change in net assets for the year ended June 30, 2015, for all classes of net assets was an increase of $1.8 billion.
Statement of Cash flowsThe statement of cash flows is intended to be the bridge from the change in net assets for the year to the change in the cash balance from one year-end to the next. Several items shown as expenses in the statement of activities, such as depreciation, do not require an outlay
Financial Statement Overview(Continued)
Government Grantsand Contracts
Private Gifts, Grants, and Contracts
Net Tuition and Fees
Auxiliary Sales and Services
O P E R AT I N G R E V E N U E SFiscal Year 2015
Figure 1
Support fromInvestments
Other Sources
54% 17%
6%
7%
5%
11%
Auxiliary Activities
Plasma Physics Laboratory
Other Student Aid
General Administration and Institutional Support
O P E R AT I N G E X P E N S E SFiscal Year 2015
StudentServices
AcademicSupport
Interest
Library
Figure 2
44%
8%
11%
9%5%
6%7%7%
Academic Departmentsand Programs
3%

15
of cash, whereas the purchase of capital assets, which does require the expenditure of cash, is added directly to assets on the statement of financial position and is reflected on the statement of activities only as depreciation expense. Other items that affect cash balances but are not required to be included in the statement of activities include the purchase and sale of investment securities, proceeds from borrowing and the repayment of loan principal, and the net change in accounts receivable and payable.
The reconciling items on the statement of cash flows are grouped into three categories. Operating activities, which used $401 million in net cash for the year ended June 30, 2015, are those items of income and expense that occur during the normal course of providing services as an educational institution. Cash flows from operating activities also include investment earnings distributions of interest and dividends. Investing activities, which provided $270 million in net cash, include the acquisition and disposal of capital assets such as buildings and equipment, and the purchase and sale of investments. Financing activities, which provided $137 million in net cash, include the proceeds from long-term borrowing to finance capital additions, renewal,
and replacement, and the repayment of principal on such indebtedness, as well as the disbursement of funds for new parent and employee loans and the collection of principal payments on such loans. Also included are contributions restricted for long-term purposes such as endowments.
c O n T R i b u T i O n SIn accordance with FASB ASC 958-310, Not-for-Profit Entities—Receivables, donors’ unconditional promises to give are required to be recorded by donees as revenue and as amounts receivable in the year received. Where collection is not expected within one year, the amount recorded is determined on a present-value basis. Conditional promises to give are recognized when they become unconditional, that is, when the conditions imposed by the donor have been substantially met.
Contributions must be classified among those that are permanently restricted, temporarily restricted, or unrestricted, as dictated solely by the donor. For the year ended June 30, 2015, contributions classified as permanently restricted totaled $66 million, those classified as temporarily restricted totaled $14 million, and those classified as unrestricted totaled $151 million. The classification of contributions is essential for the proper presentation of revenue in the statement of activities and of net assets in the statement of financial position, previously discussed.
e n d O W M e n T M a n a G e M e n T A significant portion of the operating budget is financed from Endowment earnings. Consequently, the University’s
Table 4 O P e R aT i n G ac T i V i T i e S $ in Millions
1,31
7
1,47
91,
359
2011 2012 2013 2014 2015
1,35
61,
287
Revenues Expenses
1,49
5
1,54
1
1,39
9
1,56
6
1,62
1

16
Financial Statement Overview(Continued)
investment portfolio is managed for a total return and accounted for under a consistently applied formula.
Most invested funds participate in the Primary Pool, which is operated on a market-value basis. Long-term growth of principal and increased future earnings are the University’s investment objectives for these funds. Funds participating in the Primary Pool are assigned units on a market-value basis. Funds withdrawn from the Primary Pool appreciate or depreciate based on the change in unit market value. After deducting investment management fees, the earnings are allocated on the basis of units owned by participating funds.
The University follows an Endowment spending rule that provides for an annual increase in the amount of Primary Pool earnings allocated for spending, provided that the resulting spending rate, expressed as a percentage of the market value, remains within a policy band as further discussed in the Report on Investments, which follows. For the Primary Pool’s year ended June 30, 2015, the interest and dividends per unit (net of service charges) were $66.73. The unit earnings allocated for spending were $427.78 in fiscal year 2015 and $407.41 in fiscal year 2014. The market value of a unit was $10,902.38 at June 30, 2015, and $10,099.61 at June 30, 2014.
The Balanced Fund, Income Fund, and Tiger Fund have been established for funds subject to the donor’s reservation of life income. The fiscal year-end for each pool is December 31. These pools are operated on a market-value basis in a manner similar to the operation of the Primary Pool. Earnings are distributed
quarterly to the beneficiaries. For the year ended December 31, 2014, the earnings distribution from the Balanced Fund was $99.04 per unit, and the average market value of a unit was $2,921.96; the earnings distribution from the Income Fund was $4.89 per unit, and the average market value of a unit was $139.89; the earnings distribution from the Tiger Fund was $29.15 per unit, and the average market value of a unit was $1,004.74.
The University also maintains a group of separately invested funds. Included therein are funds established from gifts of investments restricted from sale by donors, funds held in trust by others, and the University’s investments in strategic real estate.
c O n c l u S i O nPrinceton hopes that the readers of these financial statements find the presentations and explanations helpful in interpreting the financial state of the University. Princeton is blessed with significant financial resources, which it is responsible for protecting and preserving over a very long time horizon. This long-term view allows Princeton to weather any near-term financial challenge, such as the global recession experienced only a few years ago. The University is committed to utilizing its financial resources in a thoughtful, prudent, and consistent manner in support of its current educational and research programs, while preserving their value for future generations.
Kenneth MolinaroController

17
Report on InvestmentsPRinCETon UnivERSiTy invESTMEnT CoMPAny
S P e n d i n GEach year the Trustees decide upon an amount to be spent from the Endowment for the following fiscal year.3 In their deliberations, the Trustees use a spending framework that is designed to enable sizable amounts to be spent in a reasonably stable fashion, while allowing for reinvestment sufficient to preserve purchasing power in perpetuity. Until this year, the framework targeted annual spending between 4.00 percent and 5.75 percent. During 2015, the Trustees decided that based upon the continued strength of Princeton’s investment program, higher long-term average spending rates could be supported,
and indeed, that a higher average rate of spending was needed in order to achieve intergenerational equity, i.e. having Endowment spending patterns that balanced the interests of current and future students and faculty. Moreover, a higher average spend rate would likely help optimize the mix of the University’s three important types of capital—financial, physical, and human. The Trustees agreed that an important step toward the goal of higher long-term average spending was to raise the upper boundary of the spending target range to 6.25 percent. Notably, this is the second time that the Trustees have decided to raise the upper boundary
s of June 30, 2015, Princeton’s Endowment stood at $22.7 billion, an increase of approximately $1.7 billion from the year before.1 The vast majority of the Endowment, $22.3 billion, is actively managed by the Princeton University Investment Company
(“Princo”).2 While Princo maintains its own Board of Directors (the “Directors”), it is a University office operating under the final authority of the University’s Board of Trustees (the “Trustees”).
The purpose of the Endowment is to provide steady support for the University’s current and future operating needs, while preserving real value for future generations. This mission requires an expected long-term return that exceeds the sum of the annual rate of spending and University inflation. To pursue this goal, Princo maintains an equity-biased portfolio and seeks to partner with best-in-class investment management firms across diverse asset categories.
As detailed below, the portion of the Endowment actively managed by Princo generated a 12.7 percent investment return during fiscal 2015. It was a strong year, with all but one equity-oriented asset category registering gains and outperforming. Particularly striking was the exceptional absolute and relative performance across easily benchmarked categories: Domestic Equity, International Developed Equity, and Emerging Markets. (We describe these asset classes as “easily benchmarked” because, for each, there exists easily investable, passively managed investment alternatives.) Indeed, in aggregate these asset classes were up 21 percent, while the corresponding policy-weighted benchmark declined slightly. very strong performance within our venture capital portfolio further boosted results. Real Assets, however, suffered a small loss, hurt by precipitously falling commodity prices. Of course, the evaluation of our investment program should focus on the long term, and our long-term results remain strong in both absolute and relative terms. The Endowment’s annualized return over the past ten years was 10.1 percent, equating to a Higher Education Price Index (HEPI) adjusted real return of 7.2 percent, well above the amount needed to preserve purchasing power after spending. The 10.1 percent annualized nominal gain, as discussed further below, also compares favorably to all yardsticks.
A
1 Excluded from Princeton’s traditional definition of “Endowment” are working capital, planned giving investments, and proceeds from debt.
2 The pool actively managed by Princo excludes University mortgages, loans, and other assets held primarily for strategic University purposes. “Endowment net assets” as reported in the notes to the Consolidated Financial Statements in the amount of $22.1 billion as of June 30, 2015, further exclude agency funds in custody for others.
3 Excluded from these decisions are funds devoted to certain strategic purposes, such as subsidizing faculty and staff housing.

18
Report on InvestmentsPRinCETon UnivERSiTy invESTMEnT CoMPAny
(Continued)
of the spending range in the last decade, having previously moved the boundary from 5.00 to 5.75 percent in 2006.
In fiscal 2015, the Endowment spending distribution, in aggregate, equaled $875 million.4 Spending per Endowment unit equated to 4.2 percent of market value at the start of fiscal 2015.
a S S e T a l l O c a T i O nAsset allocation involves deciding what share of the portfolio should be placed in the various broad asset categories. The decisions attempt to balance the relative merits of equities versus fixed income, domestic versus foreign investments, and publicly traded versus non-marketable assets.
Princeton’s long-term asset allocation decisions are embodied in a Policy Portfolio that describes the asset categories in which Princeton will invest, a set of target weights that indicate how the portfolio will be positioned in “normal” market conditions, and a range of weightings within which exposures can be adjusted in response to mid-term opportunities arising from
significant market disequilibria or to other unusual circumstances. Figure 1 at left depicts the Policy Portfolio targets.
Readily manifest is Princo’s bias toward equities or equity-like assets—95 percent of the portfolio is allocated toward these investments. Also striking is the relatively small portion, 10 percent, of the portfolio dedicated directly to Domestic Equities. Large portions of the portfolio are allocated to other high expected-return categories. Independent Return, Private Equity, and Real Assets bear further description. Independent Return is broadly defined as consisting of investment vehicles that seek high absolute returns that are typically independent of broad market trends. Private Equity and Real Assets include investments in private companies, venture capital opportunities, real estate, and natural resources. These areas can offer attractive opportunities for skilled, patient investors.
The Policy Portfolio is diversified among asset categories for a number of reasons. Most importantly, Princo seeks return premia, in both risk-adjusted and absolute terms. In each equity asset category, Princeton has competitive advantages that create superior return potential. A broader opportunity set means that the portfolio may be capable of producing high returns more often and in a greater variety of environments. The multi-asset class approach also offers diversification benefits that help to control risk in most environments.
Princo’s Directors, working closely with Princo Staff, review the Policy Portfolio annually. As part of the most recent review, Princo reduced the policy target for Real Assets to 19 percent from
4 Investment earnings distributed in fiscal year 2015 in the amount of $881 million in the Statement of Activities is composed of Endowment spending of $875 million, plus earnings from funds held in trust by others, working capital, planned giving investments, and other non-endowment investments.
Real Assets
Private Equity
25%
19%
25%
5% 10%
6%
10%
Independent Return
International Equity—Emerging
International Equity—Developed
Domestic EquityFixed Income and Cash
P R I N C E TO N U N I V E R S I T Y P O L I C Y P O R T F O L I OFiscal Year 2016
Figure 1

19
21 percent. This was offset by increasing the Domestic Equity policy target to 10 percent from 9 percent, and increasing the Independent Return target to 25 percent from 24 percent.
The decision to reduce the Real Assets target is aimed at modestly enhancing the Endowment’s liquidity. To offset the decrease, we chose to increase the Independent Return target as we like the “all weather” characteristics of the asset category—it can generate strong returns both in periods when traditional strategies perform well, and when they do not. The recommendation to increase the Domestic Equity target is driven by bottom-up, manager-specific considerations, as well as the desire to create room to have more liquid equity exposure.
Table 1 gives a historical perspective, showing how the Policy Portfolio has evolved over two decades. Clearly evident is the long-standing practice of aggressive positioning. While non-traditional investments have grown as a share of the portfolio, this growth represents
Table 1 P R i n c e TO n u n i V e R S i T y e n d OW M e n T P O l i c y P O R T F O l i O Ta R G e T S *Every Five Years Since 1996
asset class 1996 2001 2006 2011 2016Domestic Equity 45.0 % 20.0 % 15.0 % 7.5 % 10.0 %International Equity: Developed Markets 10.0 % 7.5 % 8.5 % 6.5 % 6.0 % Emerging Markets 0 % 7.5 % 8.5 % 9.0 % 10.0 %Independent Return 0 % 25.0 % 25.0 % 25.0 % 25.0 %Private Equity 15.0 % 15.0 % 15.0 % 23.0 % 25.0 %Real Assets 10.0 % 10.0 % 18.0 % 23.0 % 19.0 %
Total Equity 80.0 % 85.0 % 90.0 % 94.0 % 95.0 %
Fixed Income and Cash 20.0 % 15.0 % 10.0 % 6.0 % 5.0 %
Total 100 % 100 % 100 % 100 % 100 % *Policy targets are pro forma based on current asset class definitions.
deliberate-paced expansion reflecting extensive consideration over multiple years.
Diversification into international investments is an important part of our multi-asset class approach. Princo believes such investments have the potential to increase long-term expected returns while helping to manage portfolio risk. Relative to the U.S., international markets tend to be less efficient, providing meaningful opportunities for adding value through active management.
An important part of Princo’s approach to international investments is an emphasis on “foreign local” managers based outside the United States. Over time we have gained more exposure to such managers in both marketable and non-marketable categories. Indeed, we have formally articulated efforts in this regard as our “Grand Unifying Theme.” This theme, while very important, is not fully visible in the Policy Portfolio because it cuts across several asset categories. On June 30, 2015, about 33 percent of the Endowment (including

20
5 A key reason for holding high quality fixed income is that it provides “insurance” against deflation and extended equity market declines. In particular, we expect yields to decline and bond prices to rise in many crisis scenarios. However, given current low yields, there is less room for further declines, reducing the insurance functionality.
uncalled commitments) was controlled by managers based outside the United States.
Table 2 compares Princo’s long-term Policy Portfolio asset allocation targets with the actual weights as of June 30, 2015. Within relatively small and pre-determined ranges, Princo’s Staff and Directors will intentionally over- or underweight more or less compelling asset categories. These deliberate allocation overlays occur most frequently in the marketable asset categories. Within Private Equity and Real Assets, deviations from Policy Portfolio targets can occur without deliberate intent, due to funding and market dynamics. When the Policy Portfolio targets for Private Equity and Real Assets were established, and when they are reviewed, it is with the understanding that allocation deviations in these categories are neither easily, nor cheaply, controlled with great precision, and therefore will often need to be offset by allocation adjustments in other categories.
That said, the large overweight in Private Equity is unintentional and deserves further comment. With hindsight, we recognize that our commitments to Private Equity funds during fiscal years 2006 through 2008 were too high. Since that time, we have reduced our
commitment pace to a sustainable steady-state rate, and are in the process of gliding gradually, over several years, back to the target allocation. Indeed, exposure to the category has declined from 38.2 percent at the end of fiscal 2011 to 32.1 percent at the end of fiscal 2015, despite the category’s very strong performance. (Private Equity has generated a 15.4 percent annualized return over the four years relative to a 10.2 percent return for the Endowment excluding Private Equity.) It will, however, take time for exposure to decline to the 25 percent policy target level.
Within Fixed Income and Cash we hold shorter than market duration bonds due to a combination of exceptionally low yields that U.S. government bonds offer, increased price risk, and decreased “insurance” functionality.5
P e R F O R M a n c eFor the fiscal year ending June 30, 2015 (see Figure 2), the Endowment produced a positive 12.7 percent return on invested assets, a strong result in absolute and relative terms. Based upon preliminary estimates of Higher Education Price Index (HEPI), our fiscal 2015 perfor-mance translated into a real return of approximately 10.4 percent. We performed well against our primary benchmark, the Policy Portfolio Index (or “PPI”), outperforming it by 6.5 percent, as well
Report on InvestmentsPRinCETon UnivERSiTy invESTMEnT CoMPAny
(Continued)
Figure 2 F i S c a l y e a R 2 0 1 5 P e R F O R M a n c e
PrincetonPolicy Portfolio
65/35 BenchmarkCambridge Associates Median
5.4 %6.2 %
12.7 %
1.8 %
Table 2 a S S e T a l l O c aT i O nJune 30, 2015 Fy 2016allocation Policy Target actualDomestic Equity 10.0 % 7.7 %International Equity Developed Markets 6.0 % 5.8 % Emerging Markets 10.0 % 9.8 %Independent Return 25.0 % 21.1 %Private Equity 25.0 % 32.1 %Real Assets 19.0 % 16.8 %Fixed Income and Cash 5.0 % 6.7 %

21
Benchmarks used:Domestic Equity: Wilshire 5000 Index; international Equity—Developed: MSCI World ex-U.S. IMI; international Equity—Emerging: MSCI Emerging Markets IMI; independent Return: HFRI Fund Weighted Composite Index + 50 basis points per annum; Private Equity: Customized Cambridge Associates benchmark; Real Assets: Blend of Cambridge Associates Real Estate benchmark, a timber component, and an energy component; fixed income and Cash: Barclays Government Bond Index.
respectively, significantly outperforming the losses posted by their respective benchmarks. In the case of International Developed Markets, results were greatly aided by the decision to hedge much of our currency exposure. Independent Return generated moderate gains and out-performed. Private Equity produced a very strong 21.8 percent, led by outstanding results within venture capital. Sharply declining commodity prices resulted in a 0.5 percent loss for Real Assets, despite solid gains in the Real Estate sub-category. The Fixed Income and Cash category eked out a 0.9 percent gain, reflecting a low-yield environment and our continuing shorter-than-market duration posture.
Generally speaking, the evaluation of our investment program should focus on the long term, and our long-term results are strong in both absolute and relative terms (see Figure 4). For the 10-year period, Princeton’s portfolio earned an annualized 10.1 percent, which represents
as our secondary benchmark—a 65/35 blend of the S&P 500 and the Barclays Government/Credit Bond Index—beating it by 7.3 percent.6 Of note, this is the first time since the global financial crisis that the PPI beat the 65/35 benchmark by a meaningful amount; finally diversification out of U.S. stocks and bonds did not come at a cost. The Endowment’s return also outpaced the median college and university endowment by 10.9 percent.7
Five out of seven asset categories generated positive returns and out-performed during the year. (Figure 3)Domestic Equity was the Endowment’s top-performing asset class, gaining 33.2 percent and outperforming by a wide margin, aided by a structural overweight to a soaring biotech sector. While a strengthening dollar was a headwind for U.S. investors in international stocks this year, our International Developed Markets and Emerging Market programs gained 12.4 percent and 15.2 percent,
6 The 65% S&P 500/35% Barclays Government/Credit Index portfolio represents what an investor would earn from a 65/35 investment in these equity and fixed income market indices, rebalanced annually. Since its inception in 1987, Princo has used this benchmark to represent the returns that might have been earned by institutional investors pursuing more traditional investment approaches.
7 Policy Portfolio returns represent a weighted average of individual benchmark returns. The median college and university endowment returns represent data compiled by Cambridge Associates for over 150 college and university endowments.
0.9 %
33.2 %
12.4 %
5.5 %
21.8 %
-0.5 %
15.2 %
2.3 %
6.7 %
-5.1 %
2.8 %
18.9 %
3.7 %
-4.4 %
Figure 3P R i n c e TO n a S S e T c l a S S R e T u R n S V S . b e n c H M a R K SFiscal Year 2015
Domestic Equity
International Equity—Developed
International Equity—Emerging
Independent Return
Private Equity
Real Assets
Fixed Income and CashPrinceton Benchmark

22
Report on InvestmentsPRinCETon UnivERSiTy invESTMEnT CoMPAny
(Continued)
a very good result within the context of a decade that included the global financial crisis, as well as lower than average inflation over the period. (For context, the HEPI—a measure of University inflation—averaged 2.7 percent over this period.) The portfolio’s gain compares favorably against the 8.9 percent return for the Policy Portfolio Index and the 7.0 percent return of the passive 65/35 benchmark. The managed investment portfolio also did very well relative to the 6.7 percent return for the median college and university endowment. Over the past 10 years, Princeton’s excess performance relative to the Policy Portfolio, 65/35 benchmark, and median college and university, has added approximately $3 billion, $6 billion, and $7 billion, respectively, to the Endowment.
Additional long-term perspective is available by looking at performance over rolling 10-year periods. Table 3 compares Princo’s investment performance over rolling 10-year periods versus that of the 65/35 benchmark. Over rolling decade-long periods the Endowment has consistently outperformed the more con- ventional, more liquid 65/35 benchmark.
Over the past 10 years, Princeton outperformed within asset categories by an average annualized margin of 2.1 percent, with five of seven asset categories outperforming their respective
Table 3 a n n ua l i z e d 1 0 - y e a R R e T u R n S
Fiscal year Princo 65/35 difference1997-2006 15.6 % 8.0% 7.6%1998-2007 16.2 % 7.1% 9.1%1999-2008 14.9 % 4.2% 10.7%2000-2009 9.7 % 1.0% 8.7%2001-2010 7.9 % 1.6% 6.3%2002-2011 9.8 % 4.2% 5.6%2003-2012 9.9 % 5.9% 4.0%2004-2013 10.2 % 6.7% 3.5%2005-2014 10.5 % 7.2% 3.3%2006-2015 10.1 % 7.0% 3.1%
benchmarks (see Figure 5). Particularly notable is the fact that even over this relatively lengthy period, the easily benchmarked equity categories (Domestic Equity, International Developed Equity, and Emerging Markets) have registered remarkable outperformance. In aggregate, these categories gained almost 14 percent annualized over the past 10 years, surpassing a policy-weighted benchmark by nearly 7 percent annualized. Emerging Markets produced the highest return of any asset category, despite suffering through a sharp decline during the 2008–2009 financial crisis. Key to performance have been actions taken by Princo to significantly reshape the Emerging Markets portfolio over the last decade.
Independent Return’s long-term performance has been strong and consistent, with meaningful outperformance over the period. Private Equity generated strong returns over 10 years and outperformed. Performance of Real Assets has been disappointing. Real Estate, which was particularly impacted by the global financial crisis, posted meager gains. The recent sharp decline in commodity prices also weighed on natural resource
Figure 4 1 0 - y e a R a n n ua l i z e d P e R F O R M a n c eEnding June 30, 2015
10.1 %
7.0 %8.9 %
6.7 %
PrincetonPolicy Portfolio
65/35 BenchmarkCambridge Associates Median

23
returns. Of note, the comparison to the benchmark is made less meaningful by the fact that Real Assets is an inherently difficult asset class to benchmark. Indeed, we have often had to select the “least bad” benchmark. As a result, a substantial amount of the long-term underperformance relates to the differences between the composition of our programs and that of their benchmarks.
Fixed Income and Cash results were slightly below expectations in absolute terms, while also trailing the benchmark. The underperformance is due to holding shorter than market duration bonds in recent years, as well as the episodic presence of significant cash balances, held transitionally during periods of portfolio-wide rebalancing.
In closing, we should note that the most core characteristic of markets is, as Mr. Rockefeller once said, that they
Benchmarks used:Domestic Equity: Wilshire 5000 Index; international Equity—Developed: MSCI World ex-U.S. Index prior to 6/30/10; MSCI World ex-U.S. IMI thereafter; international Equity—Emerging: MSCI Emerging Markets Index prior to 6/30/10; MSCI Emerging Markets IMI thereafter; independent Return: (40% Wilshire 5000 + 60% 91-day T-Bill) + 550 bps annualized until 6/30/10; 40% MSCI All Country World Index + 60%*(91-day T-Bill + 650 bps annualized) through 6/30/12; thereafter, HFRI Fund Weighted Composite Index + 50 basis points per annum; Private Equity: Customized Cambridge Associates benchmark; Real Assets: Blend of levered NCREIF Property Index, a timber component, and an energy component. Levered NCREIF Property Index changed to Cambridge Associates Real Estate benchmark at 6/30/10;fixed income and Cash: Barclays Government Bond Index.
“will fluctuate.” As will Princo’s luck. We had a very strong year, but we won’t always be this lucky. When times do get tougher—which may be happening as we write—we will say to ourselves what we are privately saying now: “This, too, shall pass.” And we will say to others what we are writing now: “Please help us focus on the long term.”
Andrew GoldenPresident, Princeton UniversityInvestment Company
Figure 5 P R i n c e TO n a S S e T c l a S S R e T u R n S V S . b e n c H M a R K STen Years Ending June 30, 2015
Domestic Equity
International Equity—Developed
International Equity—Emerging
Independent Return
Private Equity
Real Assets
Fixed Income and Cash 2.6 %
14.0 %
11.0 %
9.0 %
13.6 %
4.9 %
15.3 %
4.0 %
8.3 %
5.5 %
7.5 %
12.7 %
9.6 %
8.4 %
Princeton Benchmark

24
PricewaterhouseCoopers LLP, PricewaterhouseCoopers Center, 300 Madison Avenue, New York, NY 10017 T: (646) 471 3000, F: (813) 286 6000, www.pwc.com/us
Independent Auditor’s Report To the Trustees of Princeton University: We have audited the accompanying consolidated financial statements of Princeton University (the “University”), which comprise the consolidated statements of financial position as of June 30, 2015 and 2014 and the related consolidated statements of activities and consolidated statements of cash flows for the years then ended. Management’s Responsibility for the Consolidated Financial Statements Management is responsible for the preparation and fair presentation of the consolidated financial statements in accordance with accounting principles generally accepted in the United States of America; this includes the design, implementation and maintenance of internal control relevant to the preparation and fair presentation of consolidated financial statements that are free from material misstatement, whether due to fraud or error. Auditor’s Responsibility Our responsibility is to express an opinion on the consolidated financial statements based on our audits. We conducted our audits in accordance with auditing standards generally accepted in the United States of America. Those standards require that we plan and perform the audit to obtain reasonable assurance about whether the consolidated financial statements are free from material misstatement. An audit involves performing procedures to obtain audit evidence about the amounts and disclosures in the consolidated financial statements. The procedures selected depend on our judgment, including the assessment of the risks of material misstatement of the consolidated financial statements, whether due to fraud or error. In making those risk assessments, we consider internal control relevant to the University’s preparation and fair presentation of the consolidated financial statements in order to design audit procedures that are appropriate in the circumstances, but not for the purpose of expressing an opinion on the effectiveness of the University’s internal control. Accordingly, we express no such opinion. An audit also includes evaluating the appropriateness of accounting policies used and the reasonableness of significant accounting estimates made by management, as well as evaluating the overall presentation of the consolidated financial statements. We believe that the audit evidence we have obtained is sufficient and appropriate to provide a basis for our audit opinion. Opinion In our opinion, the consolidated financial statements referred to above present fairly, in all material respects, the financial position of Princeton University at June 30, 2015 and 2014, and the changes in their net assets and their cash flows for the years then ended in accordance with accounting principles generally accepted in the United States of America.
November 24, 2015

25
(dollars in thousands) 2015 2014
AssetsCash $ 11,544 $ 4,788Accounts receivable 98,816 84,014Receivables associated with investments 126,671 -Educational and mortgage loans receivable 378,230 366,435Contributions receivable 186,430 209,861Inventories and deferred charges 23,482 29,320Managed investments at market value 22,472,966 20,769,281Funds held in trust by others 154,163 161,027Other investments 685,436 670,156Property, net of accumulated depreciation 3,753,676 3,501,543
Total assets $ 27,891,414 $ 25,796,425
LiabilitiesAccounts payable $ 116,608 $ 99,564Liabilities associated with investments 308,367 192,920Deposits, advance receipts, and accrued liabilities 125,025 105,132Deposits held in custody for others 158,716 142,324Deferred revenues 39,520 39,900Liability under planned giving agreements 101,657 102,719Federal loan programs 8,454 6,671Indebtedness to third parties 3,314,444 3,231,753Accrued postretirement benefits 382,648 367,254
Total liabilities $ 4,555,439 $ 4,288,237
Net assetsUnrestricted $ 9,928,976 $ 8,354,141Temporarily restricted 11,535,371 11,334,911 Permanently restricted 1,871,628 1,819,136
Total net assets $ 23,335,975 $ 21,508,188
Total liabilities and net assets $ 27,891,414 $ 25,796,425
Consolidated Statements of Financial PositionJune 30, 2015 and 2014
See notes to consolidated financial statements.

26
Consolidated Statements of ActivitiesYear ended June 30, 2015
See notes to consolidated financial statements.
Temporarily Permanently (dollars in thousands) Unrestricted Restricted Restricted 2015 Total
Operating revenuesTuition and fees $ 336,826 - - $ 336,826Less scholarships and fellowships (224,766) - - (224,766) Net tuition and fees 112,060 - - 112,060
Government grants and contracts 274,973 - - 274,973Private gifts, grants, and contracts 88,023 - - 88,023Auxiliary sales and services 86,599 - - 86,599Other sources 178,281 - - 178,281Investment earnings distributed 271,793 $ 609,346 - 881,139
Operating revenues 1,011,729 609,346 - 1,621,075Net assets released from restrictions 613,214 (613,214) - -
Total operating revenues 1,624,943 (3,868) - 1,621,075
Operating expensesEducational and general: Academic departments and programs 677,927 - - 677,927 Academic support 102,014 - - 102,014 Student services 109,131 - - 109,131 Library 88,930 - - 88,930 General administration and institutional support 165,147 - - 165,147 Other student aid 55,322 - - 55,322 Plasma Physics Laboratory 119,488 - - 119,488
Total educational and general 1,317,959 - - 1,317,959Auxiliary activities 79,709 - - 79,709Interest on indebtedness 143,952 - - 143,952
Total operating expenses 1,541,620 - - 1,541,620 Results of operations 83,323 (3,868) - 79,455
Nonoperating activitiesAdjustments to planned giving agreements - (18,549) - (18,549)Decrease in value of assets held in trust by others - (4,686) $ (2,179) (6,865)Private gifts, noncurrent 62,763 13,674 65,826 142,263Net realized and unrealized appreciation on investments 1,697,880 821,251 - 2,519,131Distribution of investment earnings (271,793) (609,346) - (881,139)Reclassifications, transfers, and other nonoperating 2,662 1,984 (11,155) (6,509)
Increase from nonoperating activities 1,491,512 204,328 52,492 1,748,332
Increase in net assets 1,574,835 200,460 52,492 1,827,787 Net assets at the beginning of the year 8,354,141 11,334,911 1,819,136 21,508,188
Net assets at the end of the year $ 9,928,976 $ 11,535,371 $ 1,871,628 $ 23,335,975
27
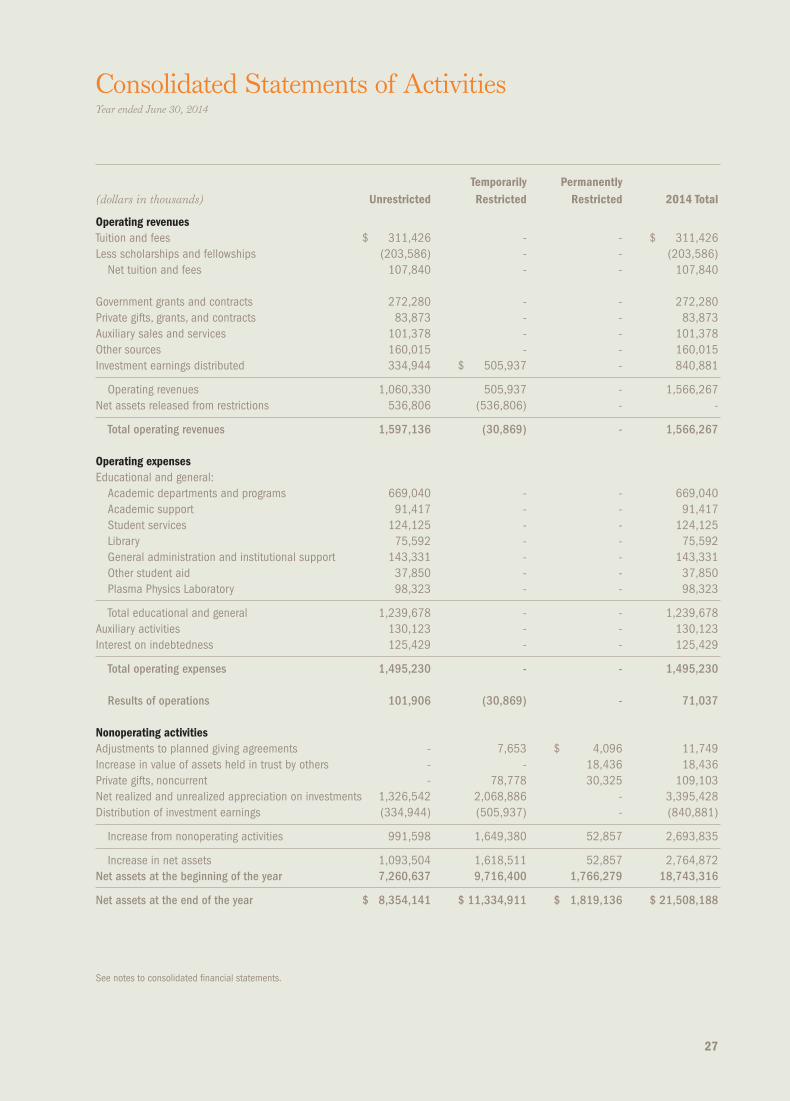
Consolidated Statements of ActivitiesYear ended June 30, 2014
See notes to consolidated financial statements.
Temporarily Permanently (dollars in thousands) Unrestricted Restricted Restricted 2014 Total
Operating revenuesTuition and fees $ 311,426 - - $ 311,426Less scholarships and fellowships (203,586) - - (203,586) Net tuition and fees 107,840 - - 107,840
Government grants and contracts 272,280 - - 272,280Private gifts, grants, and contracts 83,873 - - 83,873Auxiliary sales and services 101,378 - - 101,378Other sources 160,015 - - 160,015Investment earnings distributed 334,944 $ 505,937 - 840,881
Operating revenues 1,060,330 505,937 - 1,566,267Net assets released from restrictions 536,806 (536,806) - -
Total operating revenues 1,597,136 (30,869) - 1,566,267
Operating expensesEducational and general: Academic departments and programs 669,040 - - 669,040 Academic support 91,417 - - 91,417 Student services 124,125 - - 124,125 Library 75,592 - - 75,592 General administration and institutional support 143,331 - - 143,331 Other student aid 37,850 - - 37,850 Plasma Physics Laboratory 98,323 - - 98,323
Total educational and general 1,239,678 - - 1,239,678Auxiliary activities 130,123 - - 130,123Interest on indebtedness 125,429 - - 125,429
Total operating expenses 1,495,230 - - 1,495,230 Results of operations 101,906 (30,869) - 71,037
Nonoperating activitiesAdjustments to planned giving agreements - 7,653 $ 4,096 11,749Increase in value of assets held in trust by others - - 18,436 18,436Private gifts, noncurrent - 78,778 30,325 109,103Net realized and unrealized appreciation on investments 1,326,542 2,068,886 - 3,395,428Distribution of investment earnings (334,944) (505,937) - (840,881)
Increase from nonoperating activities 991,598 1,649,380 52,857 2,693,835
Increase in net assets 1,093,504 1,618,511 52,857 2,764,872 Net assets at the beginning of the year 7,260,637 9,716,400 1,766,279 18,743,316
Net assets at the end of the year $ 8,354,141 $ 11,334,911 $ 1,819,136 $ 21,508,188

28
Consolidated Statements of Cash FlowsYears ended June 30, 2015 and 2014
See notes to consolidated financial statements.
(dollars in thousands) 2015 2014
Cash flows from operating activitiesChange in net assets $ 1,827,787 $ 2,764,872Adjustments to reconcile change in net assets to net cash used by operating activities: Depreciation expense 138,124 127,040 Amortization of bond issuance costs and premiums (6,495) (5,100) Property gifts-in-kind (2,982) (1,384) Adjustments to planned giving agreements 18,554 (11,749) Net realized and unrealized appreciation on investments (2,373,809) (3,216,397) Loss on disposal of fixed assets 2,229 3,046 Decrease (increase) in value of assets held in trust by others 6,864 (18,436) Contributions received for long-term investment (65,826) (28,941) Changes in operating assets and liabilities: Receivables (3,166) 49,805 Inventory and deferred charges 5,838 (6,757) Accounts payable 995 (22,298) Deposits, advance receipts, and accrued liabilities 19,893 (8,252) Deposits held in custody for others 16,392 23,359 Deferred revenue (380) (344) Accrued postretirement benefits 15,394 72,444
Net cash used by operating activities (400,588) (279,092)
Cash flows from investing activities Purchases of property, plant, and equipment (379,077) (409,429) Proceeds from disposal of property, plant, and equipment 5,622 5,523 Purchases of investments (13,143,769) (4,067,703) Proceeds from maturities/sales of investments 13,787,389 4,502,638
Net cash provided by investing activities 270,165 31,029
Cash flows from financing activities Issuance of indebtedness to third parties, net of drawdowns 336,817 265,255 Payment of debt principal (247,631) (63,969) Contributions received for long-term investment 65,826 30,325 Transactions on planned giving agreements (19,616) 17,729 Net additions under federal loan programs 1,783 62
Net cash provided by financing activities 137,179 249,402
Net increase in cash 6,756 1,339Cash at the beginning of the year 4,788 3,449
Cash at the end of the year $ 11,544 $ 4,788
Supplemental disclosures Interest paid $ 147,717 $ 141,203

29
1. NaTuRe of opeRaTioNs
Princeton University (the “University”) is a privately endowed, nonsectarian institution of higher learning. When originally chartered in 1746 as the College of New Jersey, it became the fourth college in British North America. It was renamed Princeton University in 1896. First located in Elizabeth, and briefly in Newark, the school moved to Princeton in 1756.
The student body numbers approximately 5,275 undergraduates and 2,670 graduate students in more than 90 departments and programs. The University offers instruction in the liberal arts and sciences and in professional programs of the School of Architecture, the School of Engineering and Applied Science, and the Woodrow Wilson School of Public and International Affairs. The faculty numbers approximately 1,180, including visitors and part-time appointments.
2. summaRy of sigNif iCaNT aCCouNTiNg poliCies
The consolidated financial statements of Princeton University (now legally known as “The Trustees of Princeton University”) are prepared on the accrual basis and include the accounts of its wholly owned subsidiaries, foundation, and investments controlled by the University. Financial information conforms to the statements of accounting principles of the Financial Accounting Standards Board (FASB) and to the American Institute of Certified Public Accountants Audit and Accounting Guide for Not-for-Profit Entities. Relevant pronouncements include FASB Accounting Standards Codification (ASC) 958-310, Not-for-Profit Entities—Receivables, and ASC 958-205, Not-for-Profit Entities—Presentation of Financial Statements.
Unconditional promises to give are recognized as revenues in the year made, not in the year in which the cash is received. The amounts are discounted based on timing of expected collections. Amounts received from donors to planned giving programs are shown in part as a liability for the present value of annuity payments to the donor; the balance is shown as a gift of either temporarily or permanently restricted net assets.
External financial statements of not-for-profit organizations require the preparation of a statement of financial position, a statement of activities, and a statement of cash flows. The classification of the organization’s net assets and its revenues and expenses into three categories according to the existence or absence of donor-imposed restrictions—permanently restricted, temporarily restricted, or unrestricted—is also required. Changes, including reclassification and transfers, in each category are reflected in the statement of activities, certain of which are further categorized as nonoperating. Such nonoperating activities primarily reflect transactions of a long-term investment or capital nature, including contributions receivable in future periods, contributions subject to donor-imposed restrictions, and gains and losses on investments in excess of the University’s spending rule.
Other significant accounting policies are described elsewhere in these notes.The preparation of the University’s financial statements in conformity with generally
accepted accounting principles (GAAP) requires management to make estimates and assumptions that affect the reported amounts of assets and liabilities and disclosure of contingent assets and liabilities at the dates of the consolidated statements of financial position, and the reported amounts of revenue and expense included in the consolidated statements of activities. Actual results could differ from such estimates.
In May 2015, the FASB issued Accounting Standard Update (ASU) 2015-07, Fair Value Measurement (Topic 820), Disclosure for Investments in Certain Entities That Calculate Net
Notes to Consolidated Financial StatementsYears ended June 30, 2015 and 2014

30
Asset Value per Share (or its Equivalent). The ASU removes the requirement to categorize within the fair value hierarchy all investments for which fair value is measured using the practical expedient. The ASU further removes the requirement to make certain disclosures for all investments that are eligible to be measured at fair value using the practical expedient. This ASU is effective for annual periods beginning after December 15, 2015. The University is evaluating the disclosure, and it is not expected to have a material impact on the University financial statements.
Certain prior-year balances have been reclassified to conform to the current-year presentation.
3. iNvesTmeNTs
managed investmentsAll managed investments are reported at fair value. The fair value of marketable equity, debt, and certain derivative securities (which includes both domestic and foreign issues) is generally based upon a combination of published current market prices and exchange rates. The fair value of restricted securities and other investments for which published market prices are not available is based on estimated values using discounted cash flow analysis and other industry standard methodologies. Where applicable, independent appraisers and engineers assist in the valuation. The fair value of limited partnerships and similar investment vehicles is generally estimated by external investment managers, including general partners or valuation committees. These valuations necessarily involve assumptions and methods that are reviewed, evaluated, and adjusted, if necessary, by the University. Changes in assumptions could have a significant effect on the fair values of these investments. Actual results could differ from these estimates and could have a material impact on the financial statements. These investments are generally less liquid than other investments, and the values reported may differ from the values that would have been reported had a ready market for these securities existed. Securities transactions are reported on a trade-date basis.
A summary of managed investments by asset category at fair value at June 30, 2015 and 2014, is presented below. The managed investment categories are presented on a “manager-mandate” basis, that is, all of the assets and market value of the underlying funds and accounts are included in the asset class that is the primary focus of the fund or account. (Many funds and accounts have contractual flexibility to invest across more than one asset class.)
(dollars in millions) 2015 2014Managed investments: Domestic equity $ 2,191.8 $ 1,815.7 International equity 3,471.6 3,034.6 Independent return 5,535.1 5,178.2 Private equity 6,844.2 6,326.5 Real assets 3,290.5 3,499.7 Fixed income 752.5 81.5 Cash and other 387.3 833.1
gross managed investments $ 22,473.0 $ 20,769.3
Receivables (liabilities) associated with investments —net (181.7) (192.9)
Net managed investments $ 22,291.3 $ 20,576.4
The Princeton University Investment Company (Princo) manages investments for a foundation that the University controls, the Stanley J. Seeger Hellenic Fund, and deposits held in custody for
Notes to Consolidated Financial Statements(Continued)

31
others. The investment balances managed by Princo for these entities as of June 30, included in the University’s consolidated financial statements, are as follows:
(dollars in millions) 2015 2014Princeton University $ 22,270.8 $ 20,586.7Stanley J. Seeger Hellenic Fund 43.5 40.3 Deposits held in custody for others 158.7 142.3
gross managed investments $ 22,473.0 $ 20,769.3
The composition of net investment return from managed and other investments for the years ended June 30 was as follows:
(dollars in thousands) 2015 2014Net realized and unrealized gains $ 2,373,809 $ 3,216,397Interest, dividends, and other income 145,322 179,031
Total $ 2,519,131 $ 3,395,428
Princeton University investments together with the Stanley J. Seeger Hellenic Fund and deposits held in custody for others are invested in a single unitized pool. The market value of each unit was $10,902.38 and $10,099.61 at June 30, 2015 and 2014, respectively. The average value of a unit during the years ending June 30, 2015 and 2014, was $10,264.36 and $9,309.36, respectively.
The average invested market balance in the unitized pool during the years ending June 30, 2015 and 2014, was $20.899 billion and $18.856 billion, respectively.
The University follows a spending rule for its unitized investments, including funds functioning as endowment, that provides for regular increases in spending while preserving the long-term purchasing power of the endowment. Earnings available for spending are shown in operating revenue, and the balance is shown as nonoperating revenue. Amounts distributed per unit under that rule were $427.78 and $407.41 for fiscal years 2015 and 2014, respectively.
The University invests in various investment instruments. Investment securities, in general, are exposed to various risks, such as interest rate, credit, and overall market volatility. Due to the level of risk associated with certain investment securities, it is reasonably possible that changes in the values of investment securities will occur in the near term and that such changes could materially affect the amounts reported in the financial statements.
As part of its investment strategy, the University enters into transactions utilizing a variety of financial instruments and strategies, including futures, swaps, options, short sales, and forward foreign currency contracts. These financial instruments and strategies allow the University to fine-tune the asset allocation of the investment portfolio. In all cases except forward foreign currency exchange and swap contracts, these instruments are traded through securities and commodities exchanges. The forward foreign currency and swap contracts are executed with creditworthy banks and brokerage firms. These financial instruments are subject to an enforceable master netting arrangement or similar agreement, and are presented on a net basis on the consolidated statement of financial position. In January 2013, the FASB issued ASU 2013-01, Balance Sheet (Topic 210): Clarifying the Scope of Disclosures about Offsetting Assets and Liabilities, which clarifies the scope of ASU 2011-11 as it applies to derivatives accounted for in accordance with Topic 815, Derivatives and Hedging, requiring additional disclosures for derivative portfolios including disclosing the gross amounts of recognized financial assets and financial liabilities that are offset in the balance sheet and subject to an enforceable master netting arrangement. The University adopted the standard in fiscal year 2014, and disclosures pertaining to this topic have been included below.

32
At June 30, 2015, the aggregate notional value of futures contracts was $250.2 million held with one counterparty, with an aggregate unrealized gain of $2.0 million on a gross basis. At June 30, 2015, the aggregate notional value of swaps was $557.0 million held with two counterparties, with an aggregate unrealized gain of $1.7 million and unrealized loss of $31.6 million on a gross basis; $11.3 million has been pledged as collateral. No other contracts were held during the year ended June 30, 2015. At June 30, 2014, the aggregate notional value of futures contracts was $303.5 million held with one counterparty, with an aggregate unrealized gain of $0.4 million and unrealized loss of $4.8 million on a gross basis. At June 30, 2014, the aggregate notional value of swaps was $331.0 million held with two counterparties, with an aggregate unrealized gain of $31.2 million and unrealized loss of $4.2 million on a gross basis; $16.2 million had been pledged as collateral. These instruments, when recognized, are recorded at fair value and are included as either an asset or a liability depending on the rights or obligations of the contract. Realized gains or losses are recorded at the time the contract is closed.
funds Held in Trust by othersThe University is the income beneficiary of various trusts that are held and controlled by independent trustees. In addition, the University is the income beneficiary of entities that qualify as supporting organizations under Section 509(a)(3) of the U.S. Internal Revenue Code. Funds held in trust by others are recognized at the estimated fair value of the assets or the present value of the future cash flows when the irrevocable trust is established or the University is notified of its existence. Funds held in trust by others, stated at fair value, amounted to $154.2 million in 2015 and $161.0 million in 2014.
other investmentsOther investments include working capital (consisting primarily of U.S. Treasury bonds), a small number of funds that must be separately invested due to donor or legal restrictions, planned giving investments, proceeds from debt, and local real estate holdings expected to be liquidated strategically over several years. A summary of other investments at fair value at June 30, 2015 and 2014, is as follows:
(dollars in millions) 2015 2014Working capital $ 378.7 $ 342.7Planned giving investments 178.4 198.8Proceeds from debt 75.4 81.5Strategic real estate investments 47.2 46.1Other 5.7 1.0
Total $ 685.4 $ 670.1
4. fa iR value measuRemeNTs
ASC 820, Fair Value Measurements and Disclosures, defines fair value, establishes a framework for measuring fair value in GAAP, and expands disclosure about fair value measurements. Fair value is defined as the price that would be received to sell an asset or paid to transfer a liability (exit price) in an orderly transaction between market participants at the measurement date. Fair value should be based on assumptions that market participants would use when pricing an asset or liability, including assumptions about risk and the risks inherent in valuation techniques and the inputs to valuations. Fair value measurements assume that the transaction occurs in the
Notes to Consolidated Financial Statements(Continued)

33
principal market for the asset or liability (the market with the most volume and activity for the asset or liability from the perspective of the reporting entity), or in the absence of a principal market, the most advantageous market for the asset or liability (the market in which the reporting entity would be able to maximize the amount received or minimize the amount paid). The University applies fair value measurements to certain assets and liabilities, including the University’s managed investments, other investments, and funds held in trust by others, in accordance with the requirements described above.
The University maximizes the use of observable inputs and minimizes the use of unobservable inputs when measuring fair value. Fair value is based on actively quoted market prices, if available. In the absence of actively quoted market prices, price information from external sources, including broker quotes and industry publications, is used. If pricing information from external sources is not available, or if observable pricing is not indicative of fair value, judgment is required to develop the estimates of fair value using discounted cash flow and other income valuation approaches.
The University utilizes the following fair value hierarchy, which prioritizes, into three broad levels, the inputs to valuation techniques used to measure fair value:
level 1: Quoted prices (unadjusted) in active markets for identical assets and liabilities that the University has the ability to access at the measurement date. Instruments categorized in Level 1 primarily consist of a broadly traded range of equity and debt securities.
level 2: Inputs other than quoted prices included within Level 1 that are either directly or indirectly observable for the asset or liability, including quoted prices for similar assets or liabilities in active markets, quoted prices for identical or similar assets or liabilities in inactive markets, inputs other than quoted prices that are observable for the asset or liability, and inputs that are derived from observable market data by correlation or other means. Instruments categorized in Level 2 consist primarily of investments in certain entities that calculate net asset value per share (or its equivalent) and can be redeemed in the near term.
level 3: Unobservable inputs for the asset or liability, including situations where there is little, if any, market activity for the asset or liability. Instruments categorized in Level 3 consist primarily of limited partnership interests and other similar investment vehicles.
The fair value hierarchy gives the highest priority to quoted prices in active markets (Level 1) and the lowest priority to unobservable data (Level 3). In some cases, the inputs used to measure fair value might fall in different levels of the fair value hierarchy. The lowest level input that is significant to a fair value measurement in its entirety determines the applicable level in the fair value hierarchy. Assessing the significance of a particular input to the fair value measurement in its entirety requires judgment, considering factors specific to the asset or liability. Fair value measurements are categorized as Level 3 when a significant amount of price or other inputs that are considered to be unobservable are used in their valuations. Where the University has the ability to redeem its investment with the investee at net asset value per share (or its equivalent) at the measurement date, such investments have been categorized under Level 2 fair value measurements. Certain of these investments may be subject to modest holdback provisions to cover audit and other potential expenses or adjustments in the event of a complete withdrawal.
The University has various processes and controls in place to ensure investment fair value is reasonable and performs due diligence procedures on its investments, including an assessment of applicable accounting policies, a review of the valuation procedures employed, and consideration of redemption features and price transparency. The University holds direct real estate investments categorized as Level 3. Valuation for material directly held real estate investments is determined from periodic valuations prepared by independent appraisers or broker opinions.

34
The following tables present the University’s assets that are measured at fair value for each hierarchy level, at June 30, 2015 and 2014.
fair value measurements at Reporting Date using Quoted prices in active significant other significant (dollars in millions) markets for identical observable inputs unobservable 2015 Total assets (level 1) (level 2) inputs (level 3)Assets at fair valueManaged investments (gross): Domestic equity $ 2,191.8 $ (83.6) $ 87.9 $ 2,187.5 International equity 3,471.6 695.8 663.60 2,112.2 Independent return 5,535.1 - 787.6 4,747.5 Private equity 6,844.2 0.7 - 6,843.5 Real assets 3,290.5 123.8 243.3 2,923.4 Fixed income 752.5 752.5 - - Cash and other 387.3 479.6 (92.3) -Total managed investments (gross) 22,473.0 1,968.8 1,690.1 18,814.1Funds held in trust by others 154.2 - - 154.2Other investments 685.4 461.1 - 224.3
Total $ 23,312.6 $ 2,429.9 $ 1,690.1 $ 19,192.6
2014 Assets at fair valueManaged investments (gross): Domestic equity $ 1,815.7 $ (58.3) $ 254.4 $ 1,619.6 International equity 3,034.6 499.1 730.8 1,804.7 Independent return 5,178.2 - 529.3 4,648.9 Private equity 6,326.5 - - 6,326.5 Real assets 3,499.7 87.0 149.4 3,263.3 Fixed income 81.5 81.5 - - Cash and other 833.1 1,074.1 (241.4) 0.4Total managed investments (gross) 20,769.3 1,683.4 1,422.5 17,663.4Funds held in trust by others 161.0 - - 161.0Other investments 670.2 424.2 - 246.0
Total $ 21,600.5 $ 2,107.6 $ 1,422.5 $ 18,070.4
Assets and liabilities of a majority-owned investment fund have been consolidated for reporting purposes at June 30, 2015 and 2014. Managed investments, specifically the independent return asset class, includes consolidated investment fund assets of $962.5 million and $948.5 million at June 30, 2015 and 2014, respectively, and liabilities associated with investments includes consolidated investment fund liabilities of $185.7 million and $192.9 million at June 30, 2015 and 2014, respectively.
Notes to Consolidated Financial Statements(Continued)

35
The following tables present the net change in the assets measured at fair value on a recurring basis and included in the Level 3 fair value category for the years ended June 30, 2015 and 2014: fair value measurements using significant unobservable inputs (level 3) Total gains or losses included in Transfers Transfers June 30, changes in sales and into out of June 30,(dollars in millions) 2014 net assets purchases settlements level 3 level 3 2015Assets at fair valueManaged investments (gross): Domestic equity $ 1,619.6 $ 600.0 $ 73.1 $ (105.2) - - $ 2,187.5 International equity 1,804.7 273.0 1,328.5 (1,294.0) - - 2,112.2 Independent return 4,648.9 189.0 217.6 (168.3) - $ (139.7) 4,747.5 Private equity 6,326.5 1,248.1 814.4 (1,545.5) - - 6,843.5 Real assets 3,263.3 69.5 500.4 (909.8) - - 2,923.4 Fixed income - - - - - - - Cash and other 0.4 0.5 - (0.9) - - -Funds held in trust by others 161.0 (7.4) 2.1 (1.5) - - 154.2Other investments 246.0 (21.8) 5.5 (5.4) - - 224.3
Total level 3 investments $ 18,070.4 $ 2,350.9 $ 2,941.6 $ (4,030.6) - $ (139.7) $ 19,192.6
fair value measurements using significant unobservable inputs (level 3) Total gains or losses included in Transfers Transfers June 30, changes in sales and into out of June 30,(dollars in millions) 2013 net assets purchases settlements level 3 level 3 2014Assets at fair valueManaged investments (gross): Domestic equity $ 1,188.4 $ 335.6 $ 266.9 $ (171.3) - - $ 1,619.6 International equity 1,298.0 406.2 298.6 (229.3) $ 31.2 - 1,804.7 Independent return 4,090.8 461.4 455.4 (358.7) - - 4,648.9 Private equity 5,592.8 1,419.0 654.4 (1,339.7) - - 6,326.5 Real assets 3,128.6 326.2 294.6 (486.1) - - 3,263.3 Fixed income 7.8 0.1 - (7.9) - - - Cash and other 0.5 (0.1) - - - - 0.4Funds held in trust by others 130.4 17.9 - - 12.7 - 161.0Other investments 238.0 24.0 2.3 (8.8) 2.6 $ (12.1) 246.0
Total level 3 investments $ 15,675.3 $ 2,990.3 $ 1,972.2 $ (2,601.8) $ 46.5 $ (12.1) $ 18,070.4
The University assesses the valuation hierarchy for each asset or liability measured on an annual basis. From time to time, assets or liabilities will be transferred within hierarchy levels as a result of changes in valuation methodologies, liquidity, and/or redemption terms. In the year ended June 30, 2015, four managed investments transferred from Level 3 to Level 2. In the year ended June 30, 2014, one managed investment transferred from Level 2 to Level 3. The University’s policy is to recognize transfers at the beginning of the reporting period.
Realized gains of $1,836.3 million and $1,202.6 million related to Level 3 investments and unrealized gains of $514.6 million and $1,787.7 million related to Level 3 investments are included in net realized and unrealized appreciation on investments in the consolidated statements of activities for the years ended June 30, 2015 and 2014, respectively.

36
The following tables and disclosures set forth the significant terms of the agreements with investment managers or funds by major category at June 30, 2015 and 2014. The information is presented on a “manager-mandate” basis.
June 30 unfunded Redemption frequency Redemption (dollars in millions) fair value Commitments (if Currently eligible) Notice period2015Managed investments (gross)Domestic equity (a) $ 2,191.8 $ 181.2 daily—annually 4–90 daysInternational equity—developed (b) 1,076.9 - daily—annually 7–90 daysInternational equity—emerging (c) 2,394.7 136.0 daily—annually 7–90 daysIndependent return (d) 5,535.1 306.2 monthly—annually 30–90 daysFixed income (e) 752.5 - daily 1 dayCash and other (e) 387.3 - daily 1 day
marketable asset classes $ 12,338.3 $ 623.4
Private equity (f) 6,844.2 2,172.3Real assets (g) 3290.5 1,523.0
Nonmarketable asset classes $ 10,134.7 $ 3,695.3
Total gross investments $ 22,473.0 $ 4,318.7 2014
Managed investments (gross)Domestic equity (a) $ 1,815.7 $ 82.5 daily—annually 4–90 daysInternational equity—developed (b) 1,018.1 - daily—annually 7–90 daysInternational equity—emerging (c) 2,016.5 177.3 daily—annually 7–90 daysIndependent return (d) 5,178.2 296.8 monthly—annually 30–90 daysFixed income (e) 81.5 - daily same dayCash and other (e) 833.1 - daily same day
marketable asset classes $ 10,943.1 $ 556.6
Private equity (f) 6,326.5 2,301.2Real assets (g) 3,499.7 1,551.2
Nonmarketable asset classes $ 9,826.2 $ 3,852.4
Total gross investments $ 20,769.3 $ 4,409.0
(a) Domestic equity: This asset class includes funds and accounts primarily invested in equities traded on domestic exchanges or in domestic over-the-counter markets. The fair values of the investments in this asset class have been estimated using the net asset value per share of the investee funds, or, in the case of custodied accounts, the fair value of the securities held. Investments representing approximately 4 percent of the market value of this asset class are invested in nonredeemable assets.(b) international equity—Developed: This asset class includes funds primarily invested in public equity and debt securities traded in countries with developed economies other than the United States. The fair values of the investments in this asset class have been estimated using the net asset value per share of the investee funds. Investments representing approximately 7 percent of the market value of this asset class are invested in nonredeemable assets.
Notes to Consolidated Financial Statements(Continued)
37
(c) international equity—emerging: This asset class includes funds primarily invested in public equity and debt securities traded in countries with emerging economies. The fair values of the investments in this asset class have been estimated using the net asset value per share of the investee funds or, in the case of custodied accounts, the fair value of the securities held, at prevailing exchange rates. Investments representing approximately 5 percent of the market value of this asset class are invested in nonredeemable assets.(d) independent Return: This asset class includes funds invested in equity and debt securities and financial instruments such as options, swaps, futures, and other derivatives. Funds in this asset class may hold both long and short positions in any of these instruments and pursue a variety of investment strategies based upon the fund’s investment mandate and the current opportunity set. In general terms, approximately 33 percent of market value is invested in funds principally focused on long/short equity investments, 24 percent is invested in event-driven/arbitrage strategies, and 43 percent is invested in funds that opportunistically engage in both strategies. Investments representing approximately 20 percent of the market value of this asset class are invested in nonredeemable assets.(e) fixed income and Cash: On a combined basis, these asset classes include primarily U.S. government and U.S. government–guaranteed securities held in separate accounts at the custodial bank. Virtually all of the investments in these asset classes can be liquidated on a daily basis.(f) private equity: This asset class includes funds invested primarily in buyouts or venture capital. The fair values of the investments in this asset class have generally been estimated using partners’ capital statements issued by the funds, which reflect the University’s ownership interest. Generally, investments in this asset class are not redeemable. Distributions from investee funds in the portfolio are received as the underlying investments of the funds are liquidated.(g) Real assets: This asset class includes funds invested primarily in real estate, energy, and timber. The fair values of the investments in this asset class have been estimated using partners’ capital statements issued by the funds, which reflect the University’s ownership interest. Generally, investments in this asset class are not redeemable. However, a small portion, $196.2 million at June 30, 2015, and $194.6 million at June 30, 2014, was invested in redeemable funds. More broadly, distributions from investee funds are received as the underlying investments of the funds are liquidated.
Investments in the marketable asset classes are generally redeemable, made in entities that allow the University to request withdrawals in specified circumstances. However, approximately $1.3 billion of the marketable asset classes are invested in “nonredeemable assets,” which are not eligible for redemption by the University. Nonredeemable assets are specific investments within a fund designated by the fund manager as ineligible for withdrawal. Due to the illiquid nature of nonredeemable assets, it is impossible for the University to predict when these assets will liquidate and the proceeds be distributed to investors.
In addition to nonredeemable assets, the University may be limited in its ability to effect a withdrawal if a fund manager invokes a “gate” provision restricting redemptions from its fund. Gates are generally triggered when aggregate fund withdrawal requests exceed a contractually predetermined threshold. No withdrawal requests were impacted by a gate in the year ended June 30, 2015.
The University is obligated under certain agreements to fund capital calls periodically up to specified commitment amounts. At June 30, 2015, the University had unfunded commitments of $4.3 billion. Such commitments are generally called over periods of up to 10 years and contain fixed expiration dates or other termination clauses.
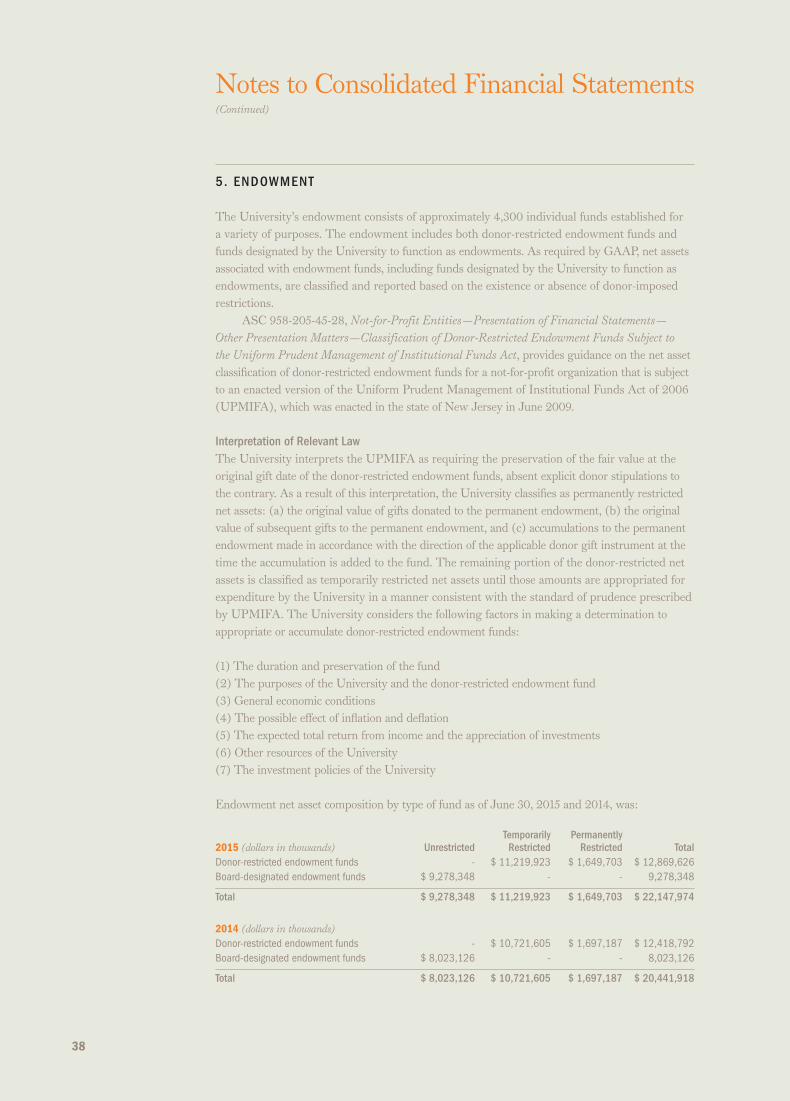
38
5. eNDowmeNT
The University’s endowment consists of approximately 4,300 individual funds established for a variety of purposes. The endowment includes both donor-restricted endowment funds and funds designated by the University to function as endowments. As required by GAAP, net assets associated with endowment funds, including funds designated by the University to function as endowments, are classified and reported based on the existence or absence of donor-imposed restrictions.
ASC 958-205-45-28, Not-for-Profit Entities—Presentation of Financial Statements— Other Presentation Matters—Classification of Donor-Restricted Endowment Funds Subject to the Uniform Prudent Management of Institutional Funds Act, provides guidance on the net asset classification of donor-restricted endowment funds for a not-for-profit organization that is subject to an enacted version of the Uniform Prudent Management of Institutional Funds Act of 2006 (UPMIFA), which was enacted in the state of New Jersey in June 2009.
interpretation of Relevant law The University interprets the UPMIFA as requiring the preservation of the fair value at the original gift date of the donor-restricted endowment funds, absent explicit donor stipulations to the contrary. As a result of this interpretation, the University classifies as permanently restricted net assets: (a) the original value of gifts donated to the permanent endowment, (b) the original value of subsequent gifts to the permanent endowment, and (c) accumulations to the permanent endowment made in accordance with the direction of the applicable donor gift instrument at the time the accumulation is added to the fund. The remaining portion of the donor-restricted net assets is classified as temporarily restricted net assets until those amounts are appropriated for expenditure by the University in a manner consistent with the standard of prudence prescribed by UPMIFA. The University considers the following factors in making a determination to appropriate or accumulate donor-restricted endowment funds:
(1) The duration and preservation of the fund(2) The purposes of the University and the donor-restricted endowment fund(3) General economic conditions(4) The possible effect of inflation and deflation(5) The expected total return from income and the appreciation of investments(6) Other resources of the University(7) The investment policies of the University
Endowment net asset composition by type of fund as of June 30, 2015 and 2014, was:
Temporarily permanently 2015 (dollars in thousands) unrestricted Restricted Restricted TotalDonor-restricted endowment funds - $ 11,219,923 $ 1,649,703 $ 12,869,626Board-designated endowment funds $ 9,278,348 - - 9,278,348
Total $ 9,278,348 $ 11,219,923 $ 1,649,703 $ 22,147,974
2014 (dollars in thousands) Donor-restricted endowment funds - $ 10,721,605 $ 1,697,187 $ 12,418,792Board-designated endowment funds $ 8,023,126 - - 8,023,126
Total $ 8,023,126 $ 10,721,605 $ 1,697,187 $ 20,441,918
Notes to Consolidated Financial Statements(Continued)

39
Changes in endowment net assets for the years ended June 30, 2015 and 2014, were:
Temporarily permanently 2015 (dollars in thousands) unrestricted Restricted Restricted 2015 TotalEndowment net assets, beginning of the year $ 8,023,126 $ 10,721,605 $ 1,697,187 $ 20,441,918Investment return: Net realized and unrealized appreciation 1,574,425 821,251 - 2,395,676 Contributions 14,616 1,460 72,608 88,684Appropriation of endowment assets for expenditure (262,253) (602,799) - (865,052)Reclassifications, transfers, and board designations (71,566) 278,406 (120,092) 86,748
endowment net assets, end of the year $ 9,278,348 $ 11,219,923 $ 1,649,703 $ 22,147,974
Temporarily permanently 2014 (dollars in thousands) unrestricted Restricted Restricted 2014 TotalEndowment net assets, beginning of the year $ 6,838,057 $ 9,209,214 $ 1,632,818 $ 17,680,089Investment return: Net realized and unrealized appreciation 1,304,881 2,068,948 - 3,373,829 Reclassification for funds with deficiencies 62 (62) - -
Total investment return 1,304,943 2,068,886 - 3,373,829
Contributions - - 30,325 30,325Appropriation of endowment assets for expenditure (318,084) (504,337) - (822,421)Reclassifications, transfers, and board designations 198,210 (52,158) 34,044 180,096
endowment net assets, end of the year $ 8,023,126 $ 10,721,605 $ 1,697,187 $ 20,441,918
funds with DeficienciesFrom time to time, the fair value of assets associated with individual donor-restricted endowment funds may fall below the level that the donor or UPMIFA requires the University to retain as a fund of perpetual duration. Deficiencies of this nature are reported in unrestricted net assets, although there were no funds with deficiencies at June 30, 2015 or 2014. Deficiencies can result from unfavorable market fluctuations that occur shortly after the investment of new permanently restricted contributions while continued appropriations are deemed prudent by the Board of Trustees.
In accordance with the terms of donor gift instruments, the University is permitted to reduce the balance of restricted endowments below the original amount of the gift. Subsequent investment gains are then used to restore the balance up to the fair market value of the original amount of the gift. Subsequent gains above that amount are recorded in temporarily restricted net assets.
Return objectives and Risk parametersThe University has adopted investment and spending policies for endowment assets that attempt to support the University’s current and future operating needs, while preserving intergenerational equity. Endowment assets include those assets of donor-restricted funds that the University must hold in perpetuity or for donor-specified periods as well as University-designated funds. Under these policies, the endowment assets are invested in a manner that is intended to produce returns that exceed both the annual rate of spending and university inflation.
strategies employed for achieving objectivesThe vast majority of the endowment assets are actively managed by Princo, which is structured as a University office, but maintains its own Board of Directors, and operates under the final authority of the University’s Board of Trustees (the “Trustees”).

40
In pursuit of the investment return objectives, Princo maintains an equity-biased portfolio and seeks to partner with best-in-class investment management firms across diverse asset categories.
spending policy and How the investment objectives Relate to spending policyEach year the Trustees decide upon an amount to be spent from the endowment for the following fiscal year. In their deliberations, the Trustees use a spending framework that is designed to enable sizable amounts to be spent in a reasonably stable fashion, while allowing for reinvestment sufficient to preserve purchasing power in perpetuity. The framework targets annual spending rates of between 4.0 percent and 6.25 percent.
The endowment must seek investment returns sufficient to meet spending policy targets as well as to maintain future purchasing power without deterioration of corpus resulting from university inflation.
6. eDuCaTioNal aND moRTgage loaNs
Educational loans include donor-restricted and federally sponsored educational loans that bear mandated interest rates and repayment terms, and are subject to significant restrictions on their transfer and disposition. These loans totaled $64.8 million and $68.3 million at June 30, 2015 and 2014, respectively. Determination of the fair value of educational loans receivable could not be made without incurring excessive costs.
Through a program designed to attract and retain excellent faculty and senior staff, the University provides home acquisition and financing assistance on residential properties in the area surrounding the University. Notes receivable from faculty and staff and co-ownership interests in the properties are included in mortgage loans and are collateralized by mortgages on those properties. These loans and interests totaled $313.7 million and $299.0 million at June 30, 2015 and 2014, respectively.
allowance for Doubtful loans Management assesses the adequacy of the allowance for doubtful loans by performing evaluations of the loan portfolio, including such factors as the differing economic risks associated with each loan category, the financial condition of borrowers, the economic environment, the level of delinquent loans, and the value of any collateral associated with the loans. In addition to general economic conditions and other factors described above, a detailed review of the aging of loans receivable is considered in management’s assessment. The level of the allowance is adjusted according to the results of management’s analysis.
Loans less than 120 days delinquent are deemed to have a minimal delay in payment and are generally not written off. Loans delinquent by 120 days or more are subject to standard collection practices, including litigation. Only loans that are deemed uncollectible are written off, and this occurs only after several unsuccessful collection attempts, including placement at an external collection agency. Considering the other factors discussed herein, management considers the allowance for doubtful loans at June 30, 2015 and 2014, to be prudent and reasonable.
Educational and mortgage loans receivable at June 30, 2015 and 2014, are reported net of allowances for doubtful loans of $0.3 million and $0.9 million, respectively.
Notes to Consolidated Financial Statements(Continued)

41
7. pRomises To giveAt June 30, 2015 and 2014, the University had received from donors unconditional promises to give contributions of amounts receivable in the following periods:
(dollars in thousands) 2015 2014Less than one year $ 89,043 $ 95,907One to five years 94,525 103,885More than five years 14,319 22,501
Total 197,887 222,293
Less unamortized discount and reserve 11,457 12,432
Net amount $ 186,430 $ 209,861
The amounts promised have been recorded after discounting the future cash flows to the present value. Current-year promises are included in revenue as additions to temporarily or permanently restricted net assets, as determined by the donors, and are included in contributions receivable at fair value based on observable ASC 820 Level 2 inputs.
In addition, at June 30, 2015, the University had received from donors promises to give totaling $11.4 million, conditioned upon the raising of matching gifts from other sources and other criteria. These amounts will be recognized as income in the periods in which the conditions have been fulfilled.
8. pRopeRTy
Land additions are reported at estimated market value at the date of gift, or on a cost basis. Buildings and improvements are stated at cost. Expenditures for operation and maintenance of physical plant are expensed as incurred.
Items classified as property at June 30, 2015 and 2014, consisted of the following:
(dollars in thousands) 2015 2014Land $ 113,891 $ 108,910Buildings and improvements 3,815,443 3,513,322Construction in progress 353,023 364,110Equipment and systems 342,446 295,228Rare books 98,878 94,610Library books, periodicals, and bindings 281,844 275,488Fine art objects 126,805 118,079
Total property 5,132,330 4,769,747
Accumulated depreciation (1,378,654) (1,268,204)
Total $ 3,753,676 $ 3,501,543
Equipment, library books, periodicals, and bindings are stated at cost net of accumulated depreciation. Equipment includes items purchased with federal government funds; an indeterminate portion of those items are expected to be transferred to the University at the termination of the respective grant or contract.
In addition to making purchases with University funds, the University, since its inception, has received a substantial number of fine art objects and rare books from individual gifts and bequests. Art objects and rare books acquired through June 30, 1973, are carried at insurable values at that date because it is not practicable to determine the historical cost or market value at

42
the date of gift. Art objects and rare books acquired subsequent to June 30, 1973, are recorded at cost or fair value at the date of gift. Works of art, literary works, historical treasures, and artifacts that are part of a collection are protected, preserved, and held for public exhibition, education, and research in furtherance of public service. Collections are not capitalized, and contributed collection items are not recognized as revenues in the University’s financial statements.
The University uses componentized depreciation for buildings and building improvements used for research. The costs of research facilities are separated into building shell, service system, and fixed equipment components that are separately depreciated.
Annual depreciation is calculated on the straight-line method over useful lives ranging from 15 to 50 years for buildings and improvements, 30 years for library books, and 10 and 15 years for equipment. Art objects and rare books having cultural, aesthetic, or historical value are not depreciated.
9. CoNDiT ioNal asseT ReT iRemeNT obligaT ioNs
Under ASC 410-20, Asset Retirement and Environmental Obligations—Asset Retirement Obligations, companies must accrue costs related to legal obligations to perform certain activities in connection with the retirement, disposal, or abandonment of assets. The obligation to perform the asset retirement activity is not conditional even though the timing or method may be conditional.
The University has identified asbestos abatement as a conditional asset retirement obligation. Asbestos abatement was estimated using site-specific surveys where available and a per-square-foot estimate based on historical cost where surveys were unavailable. The estimate is recorded as a liability and as an increase to the asset, and the capitalized portion is depreciated over the remaining useful life of the asset. The asset retirement obligation included in accrued liabilities was $12.8 million and $14.8 million at June 30, 2015 and 2014, respectively, and accretion expense on the asset retirement obligation was $0.4 million and $0.5 million for the years ended June 30, 2015 and 2014, respectively.
10. iNCome Taxes
ASC 740, Income Taxes, prescribes the minimum recognition threshold a tax position must meet in connection with accounting for uncertainties in income tax positions taken or expected to be taken by an entity before being measured and recognized in the financial statements. The University continues to evaluate its tax positions pursuant to the principles of ASC 740, and has determined that there is no material impact on the University’s financial statements.
The University is a not-for-profit organization as described in Section 501(c)(3) of the Internal Revenue Code and is exempt from income taxes on related income. The University files U.S. federal and various state and local tax returns. The statute of limitations on the University’s U.S. federal tax returns remains open for the years ended June 30, 2012, through the present.
11. DefeRReD ReveNues
Deferred revenues primarily represent advance receipts relating to the University’s real estate leasing activities. Such amounts are amortized over the term of the related leases.
Notes to Consolidated Financial Statements(Continued)

43
12. iNDebTeDNess To THiRD paRTies
At June 30, 2015 and 2014, the University’s debt consisted of taxable bonds, taxable notes, loans through the New Jersey Educational Facilities Authority (NJEFA), commercial paper, various parent loans, and a note as follows: (dollars in thousands) 2015 2014
Taxable Revenue Bonds
2009 Series A, 4.95% and 5.70%, due March 2019 and March 2039, net of unamortized
discount of $2,636 and $2,746 $ 997,364 $ 997,254
Taxable Notes
2012, 3.372%, due July 2042 170,000 170,000
2013, 4.72%, due July 2044 75,000 75,000
NJEFA Revenue Bonds
2003 Series D, 3.73%, due July 2019, including unamortized premium of $2,739 and $3,424 45,119 55,349
2005 Series A, 4.40%, due July 2030, including unamortized premium of $0 and $2,138 - 125,188
2005 Series B, 4.24% due July 2035, including unamortized premium of $0 and $1,271 - 70,076
2006 Series D, 4.39%, due July 2031, including unamortized premium of $603 and $641 58,258 60,745
2006 Series E, 4.50%, due July 2027, including unamortized premium of $57 and $62 91,727 91,887
2007 Series E, 4.53%, due July 2037, including unamortized premium of $3,781 and $3,953 278,866 286,103
2007 Series F, 4.39%, due July 2030, including unamortized premium of $599 and $639 67,354 67,529
2008 Series J, 4.39%, due July 2038, including unamortized premium of $3,620 and $3,778 224,355 229,883
2008 Series K, 4.36%, due July 2023, including unamortized premium of $3,961 and $4,456 124,766 139,616
2010 Series B, 4.03%, due July 2040, including unamortized premium of $10,137 and $10,543 241,207 246,558
2011 Series B, 4.09%, due July 2041, including unamortized premium of $14,179 and $14,724 250,929 256,094
2014 Series A, 3.77%, due July 2044, including unamortized premium of $18,613 and $19,255 218,613 219,255
2015 Series A, 2.32% due July 2035, including unamortized premium of $30,293 187,083 -
2015 Series D, 3.40% due July 2045, including unamortized premium of $19,793 169,793 -
NJEFA Dormitory Safety Trust Fund Bonds
2001 Series A, due January 2016 832 1,664
NJEFA Capital Improvement Fund Bonds
2005 Series A, 4.12%, 2000 Series A, 5.72%, due September 2020 702 823
2006 Series A, 4.42%, 2000 Series A, 5.72%, due September 2020 166 166
2014 Series B, 3.67%, due September 2033, including unamortized premium of $211 and $222 3,215 3,226
Commercial Paper
Taxable, .12% and .08% with maturities up to one year 5,700 65,200
Tax-exempt (NJEFA), .08% and .04% with maturities up to one year 59,000 24,500
Parent Loans, 0.5% to 5.4% with maturities up to nine years 43,489 44,562
Notes 906 1,075
Total $ 3,314,444 $ 3,231,753
The proceeds of NJEFA loans are used primarily to finance the costs of acquisition, construction, renovation, and installation of capital assets of the University.
In May 2015, the University issued the 2015 Series A Bonds and the 2015 Series D Bonds. The 2015 Series A Bonds were issued for the purpose of the current refunding and defeasance of the 2005 Series A and 2005 Series B Bonds. The 2015 Series D Bonds were issued for the purpose of funding new construction and renovations, and for the refunding of portions of the taxable and

44
tax-exempt commercial papers notes. The University is authorized by the Trustees to issue new debt up to $350 million annually. The University intends to issue additional debt in the future.
The full faith and credit of the University is pledged in all loan agreements with the NJEFA.In fiscal 1999, the University entered into a loan facility with a national bank to fund its
parent loan program, which is currently authorized by the Trustees up to $100 million. Fixed or variable rates may be selected on a pass-through basis to the borrowers; terms may be as long as 14 years.
In fiscal year 1998, a commercial paper program was authorized as an initial step of financing to provide construction funds for approved capital projects. The commercial paper proceeds are primarily used to finance construction expenditures until permanent financing from gifts or other sources is made available. The program is currently authorized to a maximum level of $300 million.
Principal payments for each of the next five years and thereafter on debt outstanding at June 30, 2015, excluding commercial paper, are as follows:
(dollars in thousands) principal payments2016 $ 67,9812017 96,2882018 83,3682019 583,1512020 85,272Thereafter 2,227,733
subtotal 3,143,793
Unamortized premium 105,951
Net long-term debt $ 3,249,744
The fair value of the University’s long-term debt is estimated based on current notes offered for the same or similar issues with similar security, terms, and maturities. At June 30, 2015, the carrying value and the estimated fair value of the University’s long-term debt, excluding commercial paper, were $3,249.7 million and $3,602.5 million, respectively. At June 30, 2014, the carrying value and the estimated fair value of the University’s long-term debt, excluding commercial paper, were $3,142.1 million and $3,509.5 million, respectively.
The University has committed bank lines of credit totaling $250 million, under which the University may borrow on an unsecured basis at agreed-upon rates. There were $16.9 million and $15.5 million in letters of credit outstanding under these credit facilities at June 30, 2015 and 2014, respectively.
13. employee beNefiT plaNs
All faculty and staff who meet specific employment requirements participate in a defined contribution plan, which invests in the Teachers Insurance and Annuity Association and College Retirement Equities Fund and Vanguard Fiduciary Trust Funds. The University’s contributions were $53.5 million and $53.3 million for the years ended June 30, 2015 and 2014, respectively.
postretirement benefits other Than pensionsASC 715, Compensation—Retirement Benefits, requires the recognition of a defined benefit postretirement plan’s funded status as either an asset or a liability on the statement of financial
Notes to Consolidated Financial Statements(Continued)

45
position. Actuarial gains or losses and prior service costs or credits that arise during the period must be recognized as a component of unrestricted net assets. The University calculates its Accumulated Postretirement Benefit Obligation (APBO) in accordance with ASC 715, which was initially elected in 1993 and amortized over 20 years. The University continues to recognize the cost of providing postretirement benefits for employees over the period of their working years.
The University provides single-coverage health insurance to its retirees who meet certain eligibility requirements. Participants may purchase additional dependent or premium coverage. The accounting for the plan anticipates future cost-sharing changes to the written plan that are consistent with the University’s expressed intent to increase retiree contributions in line with medical costs.
The benefit costs for the years ended June 30, 2015 and 2014, consisted of the following:
(dollars in thousands) 2015 2014Service cost $ 17,479 $ 13,270Interest cost 15,416 13,803
Total $ 32,895 $ 27,073
The APBO at June 30, 2015 and 2014, consisted of actuarially determined obligations to the following categories of employees:
(dollars in thousands) 2015 2014Retirees $ 130,175 $ 125,046Active employees eligible to retire 98,822 95,279Other active participants 153,651 146,929
Total $ 382,648 $ 367,254
As of June 30, 2015 and 2014, the APBO was unfunded.An assumed discount rate of 4.5 percent and 4.25 percent was used to calculate the APBO
at June 30, 2015 and 2014, respectively. The assumed health care cost trend rate used to calculate the APBO at June 30, 2015 was 6.5 percent, declining by 0.3 percent per year until the long-term trend rate of 5.0 percent is reached for medical drug claims. For prescription drug claims, the assumed health care cost trend rate used to calculate the APBO at June 30, 2015 was 7.75 percent, declining by 0.55 percent per year until the long-term trend rate of 5.0 percent is reached. The assumed health care cost trend rate used to calculate the APBO at June 30, 2014 was 7.0 percent, declining by 0.4 percent per year until the long-term trend rate of 5.0 percent is reached, for both medical and prescription drug claims. An increase of 1 percent in the cost trend rate would raise the APBO to $465.8 million and $443.0 million and cause the service and interest cost components of the net periodic cost to be increased by $9.4 million and $6.7 million for the years ended June 30, 2015 and 2014, respectively. A decrease of 1 percent in the cost trend rate would decrease the APBO to $318.8 million and $308.6 million and cause the service and interest cost components of the net periodic cost to be decreased by $7.0 million and $5.0 million for the years ended June 30, 2015 and 2014, respectively.
Postretirement plan benefit payments for fiscal years 2016 through 2020 are expected to range from $8.8 million to $11.8 million per year, with aggregate expected payments of $73.5 million for fiscal years 2021 through 2025. These amounts reflect the total benefits expected to be paid from the plan, net of the participants’ share of the cost and federal subsidies. Expected benefit payments are based on the same assumptions used to measure the benefit obligations and

46
Notes to Consolidated Financial Statements(Continued)
include estimated future employee service.The University provides Medicare retiree drug coverage through an employer group waiver
plan (EGWP). Under EGWP, the cost of drug coverage is offset through direct federal subsidies, brand-name drug discounts, and reinsurance reimbursements. The net effect of these subsidies has been recognized in the calculation of the University’s postretirement benefit obligation as of June 30, 2015 and 2014.
14. NeT asseTs
Net assets are categorized as unrestricted, temporarily restricted, and permanently restricted. Unrestricted net assets are derived from gifts and other institutional resources that are not subject to explicit donor-imposed restrictions. The unrestricted category also includes income and gains on these funds. Included in the total is the net investment in plant and equipment. Certain net assets classified as unrestricted for external reporting purposes are designated for specific purposes or uses under the internal operating budget practices of the University. Restricted net assets are generally established by donors in support of schools or departments of the University, often for specific purposes such as professorships, research, faculty support, scholarships and fellowships, athletics, the library, the art museum, building construction, and other specific purposes. Temporarily restricted net assets include gifts, pledges, trusts and remainder interests, and income and gains that can be expended but for which restrictions have not yet been met. Such restrictions include purpose restrictions and time restrictions imposed by donors or implied by the nature of the gift, or by the interpretations of law. Temporary restrictions are normally released upon the passage of time or the incurrence of expenditures that fulfill the donor-specified purpose. Permanently restricted net assets include gifts, pledges, trusts and remainder interests, and income and gains that are required by donor-imposed restrictions to be permanently retained. Investment earnings are spent for general or specific purposes in accordance with donor wishes, based on the University’s endowment spending rule.
15. NaTuRal Classif iCaT ioN of expeNses
Operating expenses incurred for the years ended June 30 were as follows:
(dollars in thousands) 2015 2014Salaries and wages $ 625,757 $ 583,475Employee benefits 180,712 223,713Purchased services 172,604 146,104Supplies and materials 107,843 64,467Space and occupancy 73,495 85,661Sub-recipient agreements 25,333 33,988Other expenses 17,765 67,503Other student aid 55,321 37,850Depreciation 138,838 127,040Interest 143,952 125,429
Total $ 1,541,620 $ 1,495,230
Certain prior-year balances have been reclassified to conform to the current-year presentation.

47
16. CommiTmeNTs aND CoNTiNgeNCies
At June 30, 2015, the University had authorized major renovation and capital construction projects for more than $1,300.6 million. Of the total, approximately $491.1 million had not yet been expended.
Minimum operating lease commitments at June 30, 2015, for space and e quipment were as follows:
(dollars in thousands) lease payments2016 $ 6,5252017 6,5252018 6,5252019 6,5252020 6,765Thereafter 19,142
Total $ 52,007
The University has entered into certain agreements to guarantee the debt of others. Under these agreements, if the principal obligor defaults on the debt, the University may be required to satisfy all or part of the remaining obligation. The total amount of these guarantees was $21.9 million at June 30, 2015.
The University is subject to certain legal claims that have arisen in the normal course of operations. In the opinion of management, the ultimate outcome of these actions will not have a material effect on the University’s financial position, statement of activities, or cash flows.
17. subseQueNT eveNTs
The University has evaluated subsequent events through November 24, 2015, and determined that there were no subsequent events requiring adjustment or disclosure in the consolidated financial statements.

48
E x O F F I C I OPresident Christopher L. Eisgruber ’83Governor Christopher J. Christie
T R U S T E E SFlyinfoluwa Akinlawon ’15 (2019)Jaime I. Ayala ’84 (2016)A. Scott Berg ’71 (2021)Victoria B. Bjorklund ’73 (2017)Katherine B. Bradley ’86 (2021)Denny Chin ’75 (2017)John D. Diekman ’65 (2018)Laura L. Forese ’83 (2023)Lori D. Fouché ’91 (2019)Arminio Fraga *85 (2019)Heather K. Gerken ’91 (2018)Yvonne Gonzalez Rogers ’87 (2018)C. Kim Goodwin ’81 (2022)Angela A. Groves ’12 (2016)Paul G. Haaga, Jr. ’70 (2022)Kathryn A. Hall ’80 (2019)Brent L. Henry ’69 (2020)Robert J. Hugin ’76 (2020)Lisa P. Jackson *86 (2018)Mitchell R. Julis ’77 (2018)Steven D. Leach ’82 (2017)Anthony H. P. Lee ’79 (2018)Paul A. Maeder ’75 (2019)Kanwal Matharu ’13 (2017)Laurence C. Morse *80 (2016)Robert S. Murley ’72 (2016)Brian M. Reilly ’14 (2018)Margarita Rosa ’74 (2017)Louise S. Sams ’79 (2023)Anne C. Sherrerd *87 (2019)Ruth J. Simmons (2016)Bradford L. Smith ’81 (2018)Doris L. Sohmen-Pao ’93 (2019)Peter C. Wendell ’72 (2020)Sheryl WuDunn *88 (2017)John O. Wynne ’67 (2016)C. James Yeh ’87 (2023)
Trustees of the University 1 Officers of the University 2
P R E S I D E N TChristopher L. Eisgruber ’83
A C A D E M I C O F F I C E R Sprovost David S. Lee *99
Dean of the facultyDeborah A. Prentice
Dean of the graduate schoolSanjeev Kulkarni
Dean of the CollegeJill S. Dolan
Dean for ResearchPablo G. Debenedetti
Dean of the school of engineering and applied scienceH. Vincent Poor *77
Dean of the woodrow wilson school of public and international affairsCecilia E. Rouse
Dean of the school of architectureMonica Ponce de Leon
O F F I C E R S O F T h E C O R P O R A T I O N
provostDavid S. Lee *99
vice president and secretaryRobert K. Durkee ’69
executive vice presidentTreby Williams ’84
vice president for finance and TreasurerCarolyn N. Ainslie
vice president for DevelopmentElizabeth Boluch Wood
vice president for Campus lifeW. Rochelle Calhoun
vice president for facilitiesMichael E. McKay
vice president for information Technology and Chief information officerJay Dominick
vice president for Human ResourcesLianne C. Sullivan-Crowley
vice president for university servicesChad L. Klaus
general CounselRamona E. Romero
president of the princeton university investment CompanyAndrew K. Golden
Chief audit and Compliance officerNilufer K. Shroff
1 As of 1/1/16. The years in parentheses refer to the end of the term as trustee. An asterisk indicates a graduate degree.
2 As of 1/1/16. An asterisk indicates a graduate degree.

18393-11
Additional copies of this report may be requested from:Office of the ControllerPrinceton University701 Carnegie Center, Princeton, NJ 08540
Published by the Office of the Controller Narrative Text on Sustainability by Margaret Fox-TullyProduction Director Brandon Gaines Design by ChingFoster
Special Thanks to the Office of Sustainability, Andlinger Center for Energy and the Environment, Princeton Environmental Institute, Campus Dining, Facilities, Office of Engineering and Campus Energy, and Office of DevelopmentPhotographs provided by the Office of Communications, Office of Development Communications, and Princeton Environmental InstitutePhotographs by Sharon Adarlo, Christopher Lillja, and Jon RoemerPrinted by Allied Printing Services
Copyright ©2016 by The Trustees of Princeton University
In the Nation’s Service and in the Service of All Nations

Office of Finance and Treasury princeton university701 Carnegie Center • Princeton, NJ 08540http://finance.princeton.edu