2014-07-16_esv downgrade - d. gacicia
TRANSCRIPT
People. Ideas. Success.
Guggenheim Securities, LLC Oilfield Services, Offshore Contract Drillers & Capital Equipment
July 16, 2014
Top Ten Reasons to Fear the Jackup Market; Downgrading ESV to Neutral
Darren Gacicia
(212) 293-3054
GUGGENHEIM SECURITIES, LLC See pages 33 - 34 for analyst certification and important disclosures.
This report is intended for Darren.G
acicia@guggenheim
partners.com at G
uggenheim. U
nauthorized distribution of this report is prohibited.
Concerns for the Jackup Market Leave Us Looking for Floater Leverage Rains in Floater Market Mask a Brewing Storm for Jackups. Investors’ focus on the near-term floater market woes distract them from bearish factors brewing in the
jackup market. In our view, the market has yet to discount jackup market risks, unlike floater market overhangs. We may prove early, but we see the potential risk to
jackup-levered shares to underperform, as negative scenarios play out. As a result, we would look to limit jackup exposure (especially older fleets) and increase exposure to
the floater market, where risks are better understood and “second derivatives” show signs of improvement. (See “Second Derivative” Leads Drivers, Despite Near-Term
Headwinds, 6/2/14). Based on our analysis (pgs. 5-6), ESV, RDC, HERO, and NE screen poorly for jackup exposure. Albeit, the Paragon transaction cleanses NE’s fleet.
Downgrading ESV to NEUTRAL from BUY; Lowering Our Price Target to $58. Given that ESV derives 30-35% of its estimated fleet value and 2015E EBITDA from a
jackup fleet that averages 25+ years old, we see a potential overhang for the shares under a negative scenario for shallow water assets (pgs. 5-6). In our view, rig-on-rig
competition presents the greatest threat to older, less capable assets. Since we feel forces are aligning against the jackup market (see below), we see potential EPS risk
outweighing a favorable payout strategy and solid execution track record. As a result, we look to group ESV with other jackup-weighted, Neutral-rated offshore drillers,
RDC (Neutral, $31.71) and HERO (Neutral, $4.04). We are lowering our price target for ESV to $58 from $64 to reflect our revised, risk-weighted NAV.
Lowering HERO PT to $4.50. To reflect our view toward increased risk to the near-term jackup market, we are lowering our HERO price target to $4.50 from $5.00.
Prefer Floater Exposure, Where Negatives Are Identified & Light at the End of the Tunnel Looks Clearer. Floater-levered stocks have generally stopped declining on
bad news, but negative floater contract optics may leave offshore driller shares range-bound in the near term. We would use volatility as an additional opportunity to buy
floater-levered names, where forecasts and shares already acknowledge bearish scenarios. For exposure to floater-centric names with minimal exposure to legacy
jackups, we prefer SDRL (BUY, $38.38) and RIG (BUY, $43.61) within large caps, and ATW (BUY, $50.66) and PACD (BUY, $9.99) among small/mid caps.
Negative Indicators Leave Concerns for the Jackup Market:
1) Overhang of Uncontracted Newbuilds Threatens Market Psychology (pg. 7). Even if rig additions enter the market in an orderly fashion, the market must adjust
for risks of negative scenarios. Thus, ESV, RDC, and HERO may prove laggards. With uncontracted newbuilds representing 20% of the 2016 jackup fleet and only
40% of newbuilds sponsored by established players, the market may be poised for a disruptive rig absorption period, in our view.
2) Shorter Contract Durations Mimic Floater Downturn (pg. 8). Jackup contract durations have been shortening, akin to the floater market before dayrates became
choppy. In our view, IOCs may be signaling a desire for more optionality in front of newbuild arrivals, a negative market indicator.
3) Future Jackup Demand Even Less Visible Than the Floater Market (pgs. 9-10). The lack of demand visibility for the jackup market leaves it more prone to
negative shifts in sentiment if the market gets “spooked” by the prospects of new rig arrivals, negative fixtures, or cautious guidance.
4) Lower End Jackups Shows Signs of Fading Strength (pg. 11). Standard and commodity jackups are starting to show some utilization weakness, despite
positive trends in dayrates. More idle rigs, without clarity on fleet retirements, may put pressure on market balances.
5) Market & Company Contract Coverage Remains a Concern (pgs. 12-13). Broader market and company jackup contract coverage remains traditionally lower
than the floater market, below 50% for 2015. Less coverage leaves EPS at greater risk to dayrate variance, especially for older units.
6) Lower Dayrates Baked Into Forecast, but Market Shift May Prove More Extreme Than Our Forecast (pg. 14). We are expecting a gradual fade in jackup
dayrates, down 30-40% through 2016. More extreme or accelerated dayrate volatility may put our EPS estimates at risk.
7) Continued Dayrate Strength Leaves Market Poised for Negative Surprises (pgs. 15-16). Concerns about the floater market continue to dominate the spotlight
and jackup dayrate trends and guidance remains relatively benign. Current complacency toward changes in the jackup market, which catches investors off guard in
the event of a downturn, may amplify moves to the downside.
8) Fleet Replacement Cycle May Prove Sloppy (pgs. 17-19). Upcoming surveys may foreshadow retirements for older jackups, but the potential number of
retirements to match incoming uncontracted supply may prove too daunting to maintain an orderly marker, as rig-on-rig competition from drillers looking to
maximize cash flows likely leads jackup dayrates lower.
9) HERO: “Canary in the Coal Mine”? (pg. 20). HERO is the marginal player with the oldest jackup assets. The shares have been cut in half since the fall of 2013
(OSX up ~12%). In our view, the shares may be sending an early warning sign for the jackup market that greater rig-on-rig competition looms.
10) Shallow Water May Show Slower Activity Growth (pg. 21). A trend toward more complex plays and greater rig spec. requirements has fueled the rig replacement
cycle, not growth in the jackup market. Therefore, rig attrition, with all of the frictional factors discussed above, not market growth, must allow for new rig absorption.
Guggenheim Securities, LLC | 972-638-5502 | guggenheimsecurities.com
Top Ten Reasons to Fear the Jackup Market; Downgrading ESV to Neutral PAGE 2
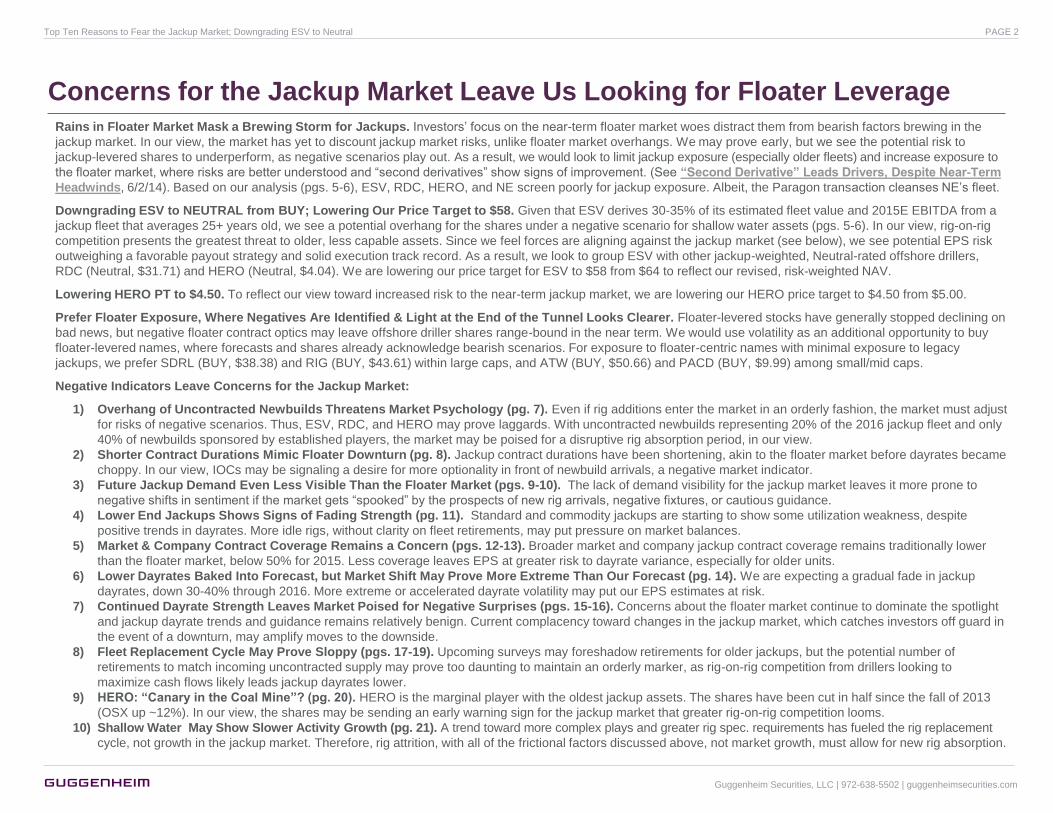
Positive Leverage for Shares: Asset Concentration, Quality & Capital Strategies
Leveraged to a Turn in Fundamentals
SDRL – BUY – PT $50: Delivery of newbuilds &
accretive financing from SDLP (NC, $32.22) offers
upside leverage to distributions and yield-based
valuations. The recent SDLP unit issuance near 6-7%
yields & NADL/Rosneft deal remain positive indicators.
RIG – BUY – PT $55: Meaningful discount to NAV
leaves hope that activist involvement and reformulated
Board of Directors, with renewed dividend policy and
MLP plans, may lead to a transformation of the
company
ATW – BUY – PT $62: Attractive growth profile, solid
execution, and potential for future payout-friendly bias.
PACD – BUY – PT $14: Good management, pure-play
ultra-deepwater assets, recent favorable refinancing,
and longer-term dividend bias offer meaningful upside
potential.
DO – BUY – PT $65: Overly slighted for its older fleet,
we like DO’s high payout strategy. We see a more
positive outlook for the rig markets removing the
overhang created by risks to DO’s older fleet.
NE – BUY – PT $42: Potential for further upside on
spin-off of older asset, as investors give the company a
“fresh look” as the transaction provides a positive
catalyst.
Trapped in Multiple Compression
ESV – NEUTRAL – PT $58: We are concerned that
jackup exposure may overhang shares. There
remains an opportunity for upside with an emerging
track record for its distribution policy, which may
include dividends and share repurchases.
RDC – NEUTRAL – PT $36: Trading closer to NAV,
we see potential for continued multiple compression
as investors infer higher capital budgeting risk , with
the need for scale in its floater fleet or a payout
strategy to give better leverage to its cash flow
profile. Meanwhile, leverage to the jackup market
may create downside for the shares.
HERO – NEUTRAL – PT $4.50: Peak-cycle
economics and stretched balance sheet create a
challenging risk/reward, despite solid execution on
recent newbuilds and a good management team.
ATW & PACD: Attractive fleets and
cash flow profiles may see offsets in
slowed growth plans and more distant
term payout strategies.
NE: As we size the opportunities for
NE, post-spin, we will need to assess
jackup risk to the premium asset
company that remains.
ORIG: Concerns about unconventional
ownership and corporate structure may
challenge the story for the shares.
SDRL: Investors remain concerned about the
dividend amidst the downturn in dayrates.
Special Situations – Transaction/Catalyst-Driven
ORIG – BUY – PT $28: The need for cash and ORIG
shares as a source of funding at DRYS should prompt
a dividend strategy from ORIG and efforts to re-rate the
shares on yield-based metrics.
Guggenheim Securities, LLC | 972-638-5502 | guggenheimsecurities.com
Top Ten Reasons to Fear the Jackup Market; Downgrading ESV to Neutral PAGE 3

Large Cap Services 8.9 x
Large Cap Equipment 9.9 x
Small/Mid Cap Svcs &
Equipment 10.5 x
Offshore Drilling 7.3 xOnshore Drilling
6.7 x
Engineering & Construction 8.1x
5.0 x
6.0 x
7.0 x
8.0 x
9.0 x
10.0 x
11.0 x
0% 5% 10% 15% 20% 25%
EV
/EB
ITD
A '14E
EBITDA Growth, '14E vs. '13E
Large Cap Services 8.9 x
Large Cap Equipment 9.9 x
Small/Mid Cap Svcs &
Equipment 10.5 x
Offshore Drilling 7.3 x
Onshore Drilling 6.7 x
Engineering & Construction 8.7
x
5.5 x
6.5 x
7.5 x
8.5 x
9.5 x
10.5 x
11.5 x
10.0 x 12.0 x 14.0 x 16.0 x 18.0 x 20.0 x 22.0 x
EV
/EB
ITD
A '14E
Price/Earnings '14E
NAVs & Relative Valuation Leave Offshore Driller Shares Screening Attractively
Source: IHS Inc. Thomson Reuters, Guggenheim
Securities, LLC
Implied Growth for Equipment and E&C names
not translating for Offshore Drillers, despite
common drivers.
Offshore Drillers Least Expensive Sub-Sector Drillers Screen Cheap vs. Growth
PX NAV-B/U NAV-R P/NAV-B/U P/NAV-R
Company Rating 7/15 Target PX
Rtn to
Target
2014
PE
2015
PE
2014
EV/EBITDA
2015
EV/EBITDA
EV/EBITDA
'14
EV/EBITDA
'15 2014E 2014E 2014E 2014E
ATW Buy 50.66$ $62 22% 12.9x 8.9x 10.6x 7.3x 7.8x 5.6x 61 69 83% 73%
DO Buy 49.34$ $65 32% 16.3x 11.6x 12.3x 8.8x 5.4x 4.0x 59 60 84% 82%
ESV Neutral 54.56$ $58 6% 10.6x 9.7x 10.0x 9.1x 7.1x 6.3x 58 64 94% 85%
HERO Neutral 4.04$ $4.50 11% 9.8x 90.0x 8.8x 80.8x 5.0x 6.3x 4.5 5 90% 81%
NE Buy 32.28$ $42 30% 11.4x 10.8x 8.7x 8.3x 5.4x 5.0x 42 42 77% 77%
ORIG Buy 18.39$ $28 52% 14.0x 10.0x 9.2x 6.6x 7.0x 6.1x 27 28 68% 66%
PACD Buy 10.42$ $14 34% 14.7x 11.2x 11.0x 8.3x 8.1x 5.9x 14 14 74% 74%
RDC Neutral 31.71$ $36 14% 13.8x 7.6x 12.2x 6.7x 7.1x 4.8x 35 42 91% 75%
RIG Buy 43.61$ $55 26% 11.7x 13.6x 9.3x 10.8x 6.2x 6.7x 55 55 79% 79%
SDRL Buy 38.38$ $50 30% 15.9x 16.1x 12.2x 12.4x 9.5x 9.1x 28 33 137% 116%
Averages 10.4x 15.9x 6.9x 6.0x 88% 81%
Target Current
Guggenheim Securities, LLC | 972-638-5502 | guggenheimsecurities.com
Top Ten Reasons to Fear the Jackup Market; Downgrading ESV to Neutral PAGE 4

Wary of Fleet Value & Cash Flow at Risk From Jackup Exposure
Source: IHS Inc. Thomson Reuters, Guggenheim
Securities, LLC
Offshore drillers trade at a significant discount to NAV, suggesting a favorable
risk/reward
Gross Fleet Value Breakdown Estimated EBITDA Breakdown, 2015
We are gravitating away from offshore drillers that
derive too much cash flow and marked-to-market fleet
value from jackups in an effort to avoid potential
volatility.
Ticker Jackups 2G 3G 4G 5G 6G Other
ATW 15% 0% 1% 9% 0% 75% 0%
DO 4% 5% 6% 16% 17% 53% 0%
ESV 34% 0% 1% 10% 20% 35% 1%
HERO 75% 0% 0% 0% 0% 0% 25%
NE 10% 0% 17% 19% 16% 37% 0%
ORIG 0% 0% 0% 0% 11% 89% 0%
PACD 0% 0% 0% 0% 0% 100% 0%
RDC 60% 0% 0% 0% 0% 40% 0%
RIG 11% 2% 6% 5% 23% 53% 0%
SDRL 24% 0% 0% 1% 3% 72% 0%
TOTAL 17% 1% 7% 9% 13% 52% 0%
Ticker Jackups 2G 3G 4G 5G 6G Other
ATW 15% 0% 3% 19% 0% 63% 0%
DO 5% 15% 18% 19% 21% 22% 0%
ESV 28% 0% 2% 14% 19% 35% 2%
HERO 69% 0% 0% 0% 0% 0% 31%
NE 38% 0% 13% 9% 11% 29% 0%
ORIG 0% 0% 0% 0% 21% 79% 0%
PACD 0% 0% 0% 0% 0% 100% 0%
RDC 64% 0% 0% 0% 0% 36% 0%
RIG 8% 3% 11% 11% 31% 36% 0%
SDRL 24% 0% 0% 3% 3% 70% 0%
TOTAL 22% 2% 6% 9% 15% 46% 1%
Guggenheim Securities, LLC | 972-638-5502 | guggenheimsecurities.com
Top Ten Reasons to Fear the Jackup Market; Downgrading ESV to Neutral PAGE 5
DOHERO
NE - Legacy
ESV
RDC
RIG
ATW
SDRL
PRGN
NE -New Co.
-
5
10
15
20
25
30
35
40
0%
5%
10
%
15
%
20
%
25
%
30
%
35
%
40
%
45
%
50
%
55
%
60
%
65
%
70
%
75
%
80
%
Ave
rage
Jac
kup
Age
Jackups - % Fleet Value
DOHERO
NE - Legacy
ESV
RDC
RIG
ATW SDRL
PRGN
NE -New Co.
-
5
10
15
20
25
30
35
40
0%
5%
10
%
15
%
20
%
25
%
30
%
35
%
40
%
45
%
50
%
55
%
60
%
65
%
70
%
75
%
80
%
85
%
Ave
rage
Jac
kup
Age
2015 EBITDA Contribution
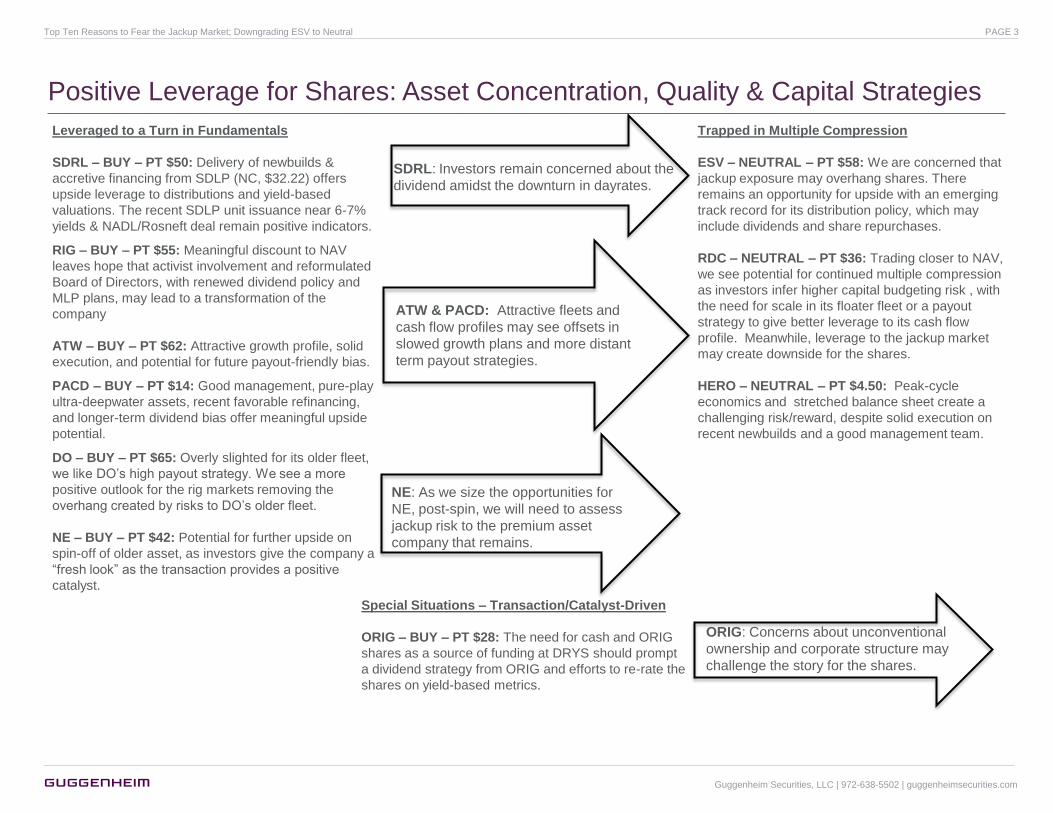
Looking to Avoid Legacy Jackup Exposure for Fleet Value & Cash Flow
Age & EBITDA Contribution
Age & Fleet Value Contribution
We see a greater concentration in older jackups as a
source of earnings risk if the sub-segment comes
under pressure from uncontracted newbuild arrivals.
The spin-off of Paragon limits NE’s exposure to older
jackups, lowering the average age and relative
exposure to the shallow water market.
Note: All estimates are by Guggenheim Securities, LLC.
Source: IHS Inc.
Guggenheim Securities, LLC | 972-638-5502 | guggenheimsecurities.com
Top Ten Reasons to Fear the Jackup Market; Downgrading ESV to Neutral PAGE 6

1) Uncontracted Jackup Deliveries Threatens Sentiment & Orderly Markets
Note: All estimates are by Guggenheim Securities, LLC.
Source: IHS Inc.
Jackup Newbuild Projections
Jackup Fleet Growth Projections
By our estimation, ~20% of the jackup
fleet that will exist (without retirements) at
the end of 2016 is represented by
uncontracted supply coming to market.
4 3 2 1 4 - - - - 2 1 1 1 - - - - - - -1
11 6 7
13
6 19 19 15
5 6 5
4 - 1 - - - - -
1
12
18
25
38
44
63
82
97 102
108 113
117 117 118 118 118 118 118 118
-
20
40
60
80
100
120
1Q
14
2Q
14
3Q
14
4Q
14
1Q
15
2Q
15
3Q
15
4Q
15
1Q
16
2Q
16
3Q
16
4Q
16
1Q
17
2Q
17
3Q
17
4Q
17
1Q
18
2Q
18
3Q
18
4Q
18
Nu
mb
er
of
Rig
s
Contracted Uncontracted Cumulative Uncontracted
95 96 96 96 96
180 181 181 181 181
173 198
243 255 257
48 53
70 82 82
496 527
590 614 616
-
100
200
300
400
500
600
700
2014E 2015E 2016E 2017E 2018E
Pro
jecte
d T
ota
l R
ig S
up
ply
Commodity Standard Premium Harsh Environment
Less than 40% of newbuid jackups
coming to market have been ordered by
traditional jackup market participants.
The presence of speculators, some from
financial players and others from
shipyards themselves, only increase the
possibility for disorderly market
absorption to fleet additions. The added
scramble for financing may only
exacerbate strains on smaller, new
market participants.
Guggenheim Securities, LLC | 972-638-5502 | guggenheimsecurities.com
Top Ten Reasons to Fear the Jackup Market; Downgrading ESV to Neutral PAGE 7
-
0.2
0.4
0.6
0.8
1.0
1.2
1.4
1.6
1.8
Jan
-03
Ju
n-0
3
No
v-0
3
Ap
r-04
Sep
-04
Feb
-05
Ju
l-05
Dec-0
5
May-0
6
Oct-
06
Mar-
07
Au
g-0
7
Jan
-08
Ju
n-0
8
No
v-0
8
Ap
r-09
Sep
-09
Feb
-10
Ju
l-10
Dec-1
0
May-1
1
Oct-
11
Mar-
12
Au
g-1
2
Jan
-13
Ju
n-1
3
No
v-1
3
Co
ntr
act
Du
raq
tio
n (
years
)
Jackup - Rolling 6-Month Avg.
-
0.5
1.0
1.5
2.0
2.5
3.0
3.5
4.0
4.5
5.0
Mar-
03
Au
g-0
3
Jan
-04
Ju
n-0
4
No
v-0
4
Ap
r-05
Sep
-05
Feb
-06
Ju
l-06
Dec-0
6
May-0
7
Oct-
07
Mar-
08
Au
g-0
8
Jan
-09
Ju
n-0
9
No
v-0
9
Ap
r-10
Sep
-10
Feb
-11
Ju
l-11
Dec-1
1
May-1
2
Oct-
12
Mar-
13
Au
g-1
3
Jan
-14
Co
ntr
act
Du
rati
on
(years
)
Drillship - Rolling 6-Month Avg.
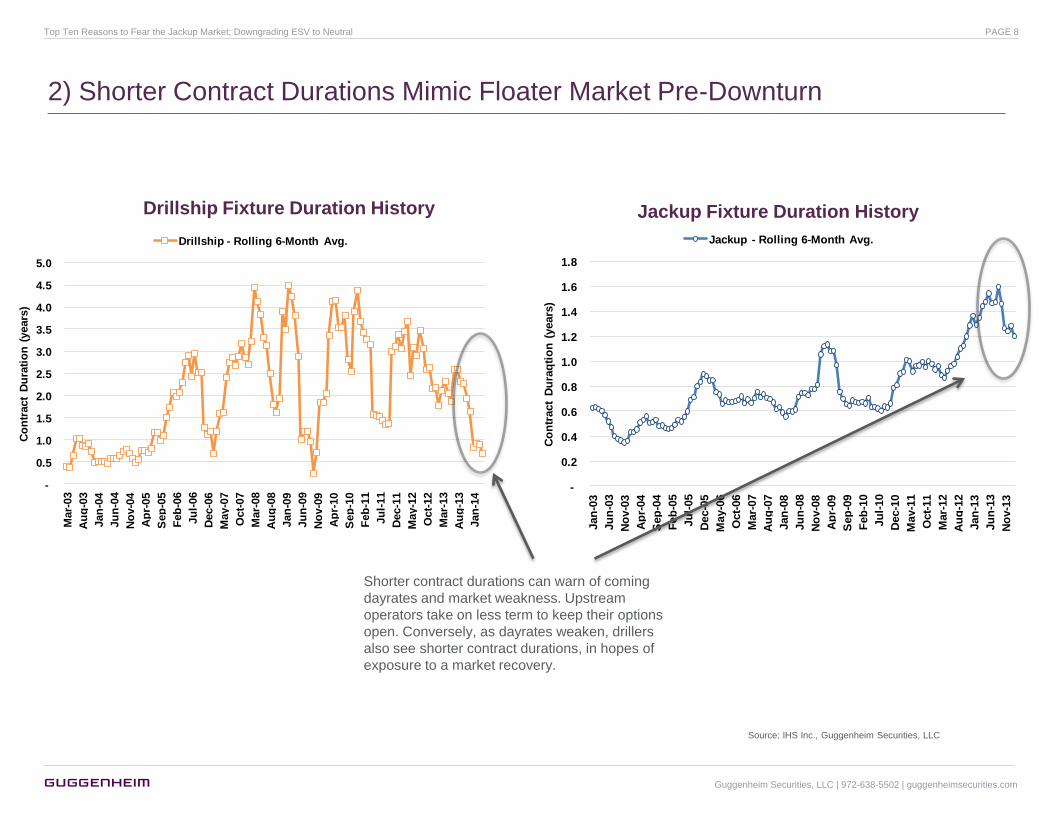
2) Shorter Contract Durations Mimic Floater Market Pre-Downturn
Drillship Fixture Duration History Jackup Fixture Duration History
Shorter contract durations can warn of coming
dayrates and market weakness. Upstream
operators take on less term to keep their options
open. Conversely, as dayrates weaken, drillers
also see shorter contract durations, in hopes of
exposure to a market recovery.
Source: IHS Inc., Guggenheim Securities, LLC
Guggenheim Securities, LLC | 972-638-5502 | guggenheimsecurities.com
Top Ten Reasons to Fear the Jackup Market; Downgrading ESV to Neutral PAGE 8

3) Jackup Tenders Provide Limited Demand Visibility Through 2015
10
34 40 45 45 45 42 38 39 36 7
18 21
26 21 22 21
18 16 13
13
23
28 24 29 33
27 27 28
24
11
31
38 35 37 33
36 35 31
28
-
20
40
60
80
100
120
140
3Q14 4Q14 1Q15 2Q15 3Q15 4Q15 1Q16 2Q16 3Q16 4Q16
Nu
mb
er
of
Rig
s
Tender Pre-tender Probable PossibleTender activity does not account for the
300+ jackups that will come available by the
end of 2015.
Source: IHS Inc., Guggenheim Securities, LLC
Guggenheim Securities, LLC | 972-638-5502 | guggenheimsecurities.com
Top Ten Reasons to Fear the Jackup Market; Downgrading ESV to Neutral PAGE 9

3) “Risked” Tenders Do Not Reflect a Tight High End of the Market
Tender Demand Segmented for High End of Jackup Market
Given that tenders target higher-end jackups, we
segmented market availability only looking at rigs
rated above 300ft water depth, 2,000 ton+ variable
deck loads, 18k+ drilling depths, 15k+ BOP psi ratings,
and hook load capacities above 1.5m lbs.
Historically, the jackup market has
operated as a “spot” market, with
tendering activity only prevalent for the
high end of the rig market.
Probability-weighted
demand looks to better
gauge actual demand from
an extensive project
inventory.
Note: All estimates are by Guggenheim Securities, LLC.
Source: IHS Inc., Guggenheim Securities, LLC
Jackups
2014E 2015E
Exploration 16 19
Appraisal 1 -
Development 16 27
Other 1 1
Tender 34 47
Exploration 7 10
Appraisal 1 -
Development 9 14
Other 1 2
Pre-Tender 18 26
Firm Demand 52 73
Exploration (25-50% Probability) 3 7
Appraisal (25-50% Probability) 1 2
Development (25-50% Probability) 3 13
Other - 1
Probable 7 23
Exploration (25% Probability) - 7
Appraisal (25% Probability) - 1
Development (25% Probability) - 5
Other 2 3
Possible 2 16
Potential Demand 9 39
Total Availability 70 131
Total Availability 70 131
Less: Firm Demand 52 73
Less: Carried Demand - -
Surplus/(Deficit), Firm & Adjusted 18 58
Adjusted Potential Demand 9 39
Surplus/(Deficit), Firm & Adjusted 9 19
Tender analysis shows a rig
surplus.
Guggenheim Securities, LLC | 972-638-5502 | guggenheimsecurities.com
Top Ten Reasons to Fear the Jackup Market; Downgrading ESV to Neutral PAGE 10
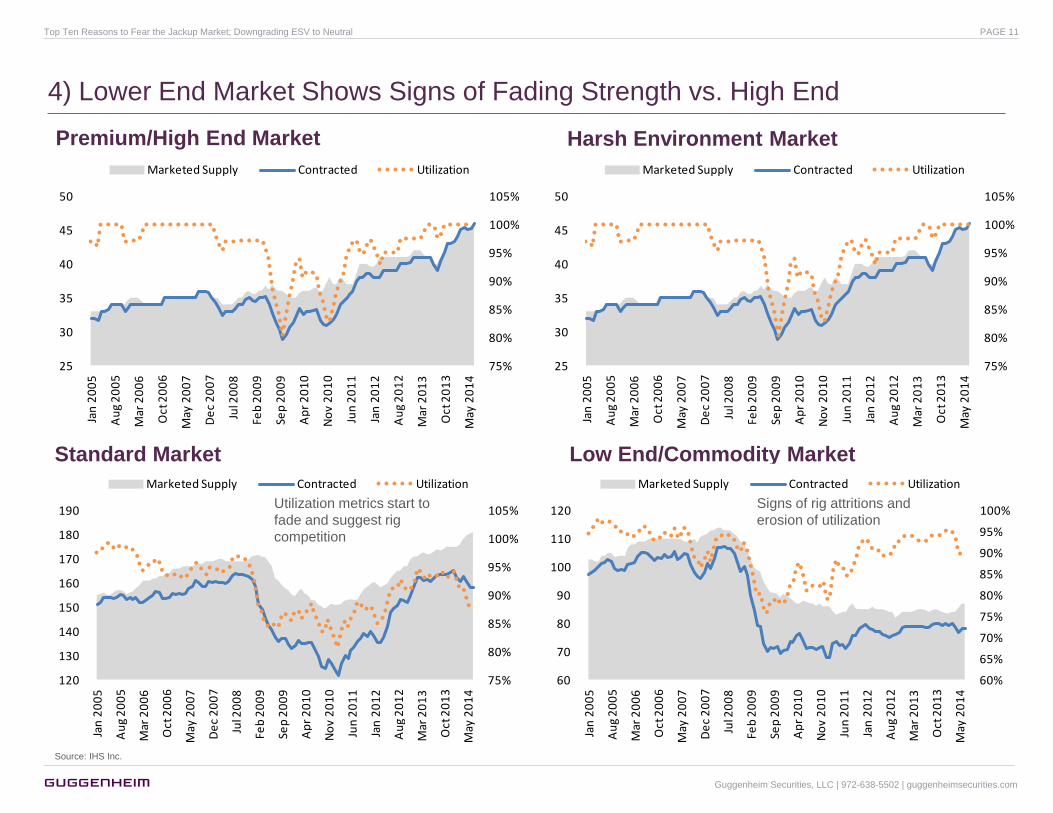
4) Lower End Market Shows Signs of Fading Strength vs. High End
75%
80%
85%
90%
95%
100%
105%
25
30
35
40
45
50
Jan
20
05
Au
g 2
00
5
Mar
20
06
Oct
20
06
May
20
07
De
c 2
00
7
Jul 2
00
8
Feb
20
09
Sep
20
09
Ap
r 2
01
0
No
v 2
01
0
Jun
20
11
Jan
20
12
Au
g 2
01
2
Mar
20
13
Oct
20
13
May
20
14
Marketed Supply Contracted Utilization
75%
80%
85%
90%
95%
100%
105%
25
30
35
40
45
50
Jan
20
05
Au
g 2
00
5
Mar
20
06
Oct
20
06
May
20
07
De
c 2
00
7
Jul 2
00
8
Feb
20
09
Sep
20
09
Ap
r 2
01
0
No
v 2
01
0
Jun
20
11
Jan
20
12
Au
g 2
01
2
Mar
20
13
Oct
20
13
May
20
14
Marketed Supply Contracted Utilization
Premium/High End Market Harsh Environment Market
Standard Market Low End/Commodity Market
60%
65%
70%
75%
80%
85%
90%
95%
100%
60
70
80
90
100
110
120
Jan
20
05
Au
g 2
00
5
Mar
20
06
Oct
20
06
May
20
07
De
c 2
00
7
Jul 2
00
8
Feb
20
09
Sep
20
09
Ap
r 2
01
0
No
v 2
01
0
Jun
20
11
Jan
20
12
Au
g 2
01
2
Mar
20
13
Oct
20
13
May
20
14
Marketed Supply Contracted Utilization
75%
80%
85%
90%
95%
100%
105%
120
130
140
150
160
170
180
190
Jan
20
05
Au
g 2
00
5
Mar
20
06
Oct
20
06
May
20
07
De
c 2
00
7
Jul 2
00
8
Feb
20
09
Sep
20
09
Ap
r 2
01
0
No
v 2
01
0
Jun
20
11
Jan
20
12
Au
g 2
01
2
Mar
20
13
Oct
20
13
May
20
14
Marketed Supply Contracted Utilization
Source: IHS Inc.
Signs of rig attritions and
erosion of utilization
Utilization metrics start to
fade and suggest rig
competition
Guggenheim Securities, LLC | 972-638-5502 | guggenheimsecurities.com
Top Ten Reasons to Fear the Jackup Market; Downgrading ESV to Neutral PAGE 11
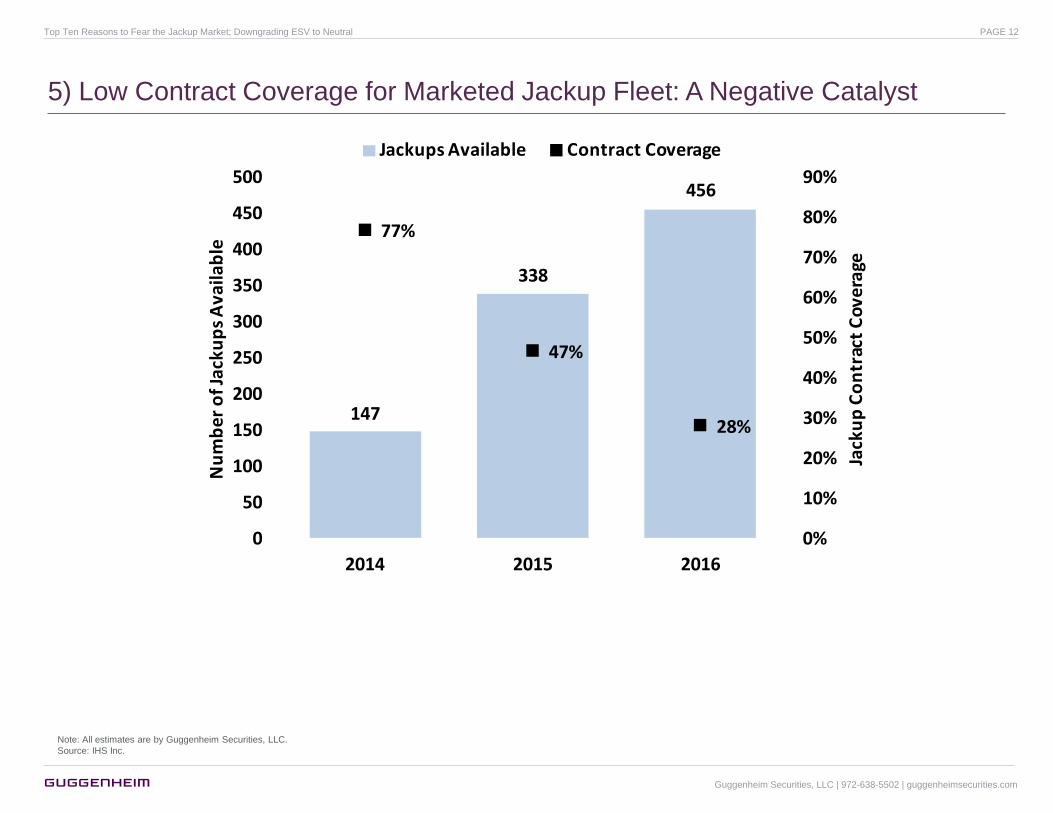
5) Low Contract Coverage for Marketed Jackup Fleet: A Negative Catalyst
147
338
456
77%
47%
28%
0%
10%
20%
30%
40%
50%
60%
70%
80%
90%
0
50
100
150
200
250
300
350
400
450
500
2014 2015 2016
Jack
up
Co
ntr
act
Cov
erag
e
Nu
mb
er o
f Jac
kup
s A
vaila
ble
Jackups Available Contract Coverage
Note: All estimates are by Guggenheim Securities, LLC.
Source: IHS Inc.
Guggenheim Securities, LLC | 972-638-5502 | guggenheimsecurities.com
Top Ten Reasons to Fear the Jackup Market; Downgrading ESV to Neutral PAGE 12
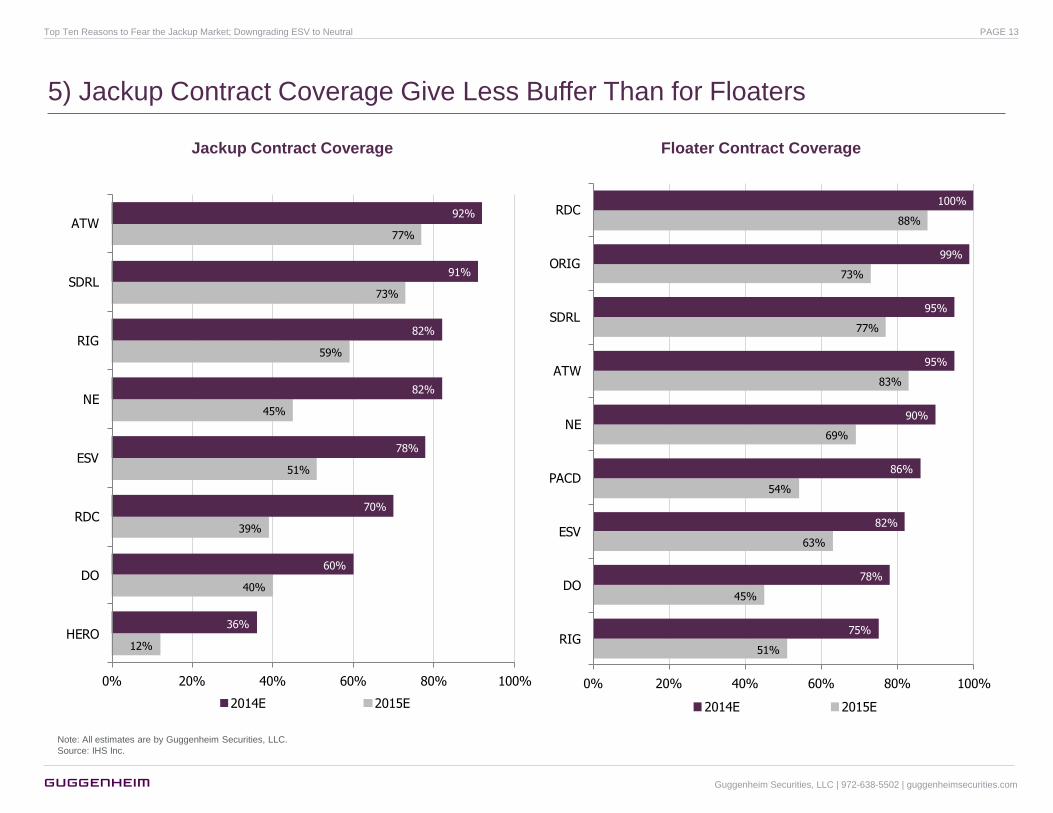
5) Jackup Contract Coverage Give Less Buffer Than for Floaters
Jackup Contract Coverage Floater Contract Coverage
12%
40%
39%
51%
45%
59%
73%
77%
36%
60%
70%
78%
82%
82%
91%
92%
0% 20% 40% 60% 80% 100%
HERO
DO
RDC
ESV
NE
RIG
SDRL
ATW
2014E 2015E
51%
45%
63%
54%
69%
83%
77%
73%
88%
75%
78%
82%
86%
90%
95%
95%
99%
100%
0% 20% 40% 60% 80% 100%
RIG
DO
ESV
PACD
NE
ATW
SDRL
ORIG
RDC
2014E 2015E
Note: All estimates are by Guggenheim Securities, LLC.
Source: IHS Inc.
Guggenheim Securities, LLC | 972-638-5502 | guggenheimsecurities.com
Top Ten Reasons to Fear the Jackup Market; Downgrading ESV to Neutral PAGE 13
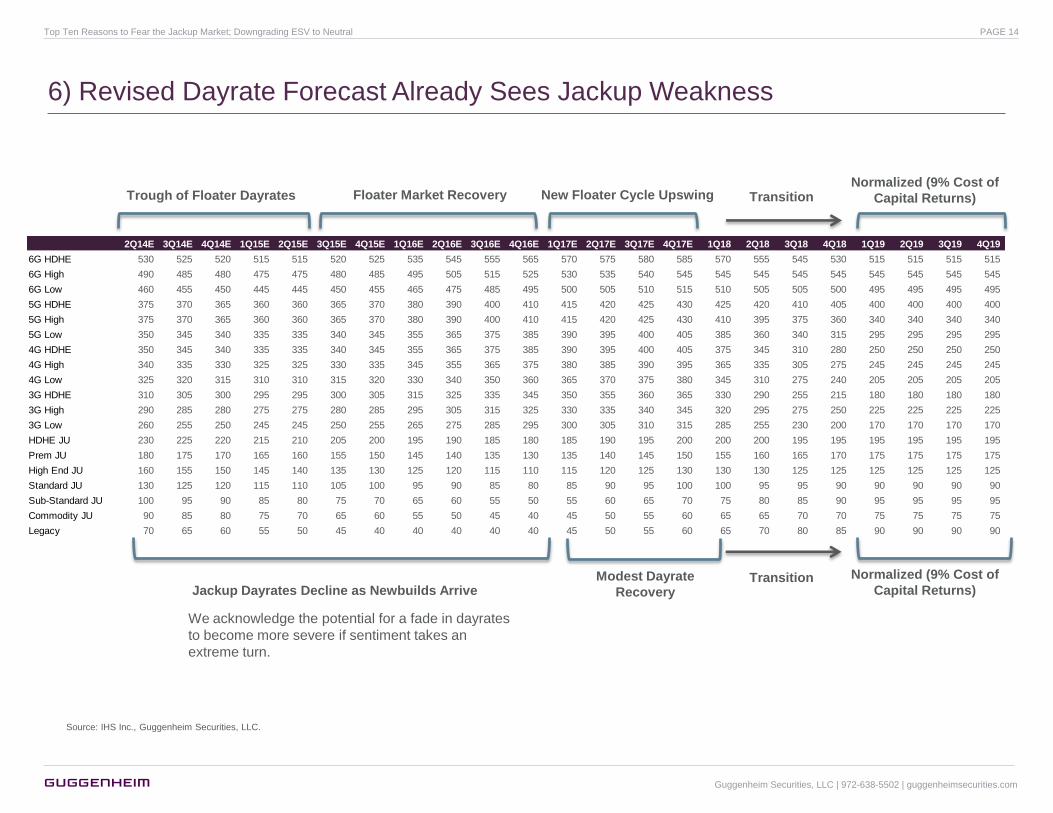
6) Revised Dayrate Forecast Already Sees Jackup Weakness
Source: IHS Inc., Guggenheim Securities, LLC.
2Q14E 3Q14E 4Q14E 1Q15E 2Q15E 3Q15E 4Q15E 1Q16E 2Q16E 3Q16E 4Q16E 1Q17E 2Q17E 3Q17E 4Q17E 1Q18 2Q18 3Q18 4Q18 1Q19 2Q19 3Q19 4Q19
6G HDHE 530 525 520 515 515 520 525 535 545 555 565 570 575 580 585 570 555 545 530 515 515 515 515
6G High 490 485 480 475 475 480 485 495 505 515 525 530 535 540 545 545 545 545 545 545 545 545 545
6G Low 460 455 450 445 445 450 455 465 475 485 495 500 505 510 515 510 505 505 500 495 495 495 495
5G HDHE 375 370 365 360 360 365 370 380 390 400 410 415 420 425 430 425 420 410 405 400 400 400 400
5G High 375 370 365 360 360 365 370 380 390 400 410 415 420 425 430 410 395 375 360 340 340 340 340
5G Low 350 345 340 335 335 340 345 355 365 375 385 390 395 400 405 385 360 340 315 295 295 295 295
4G HDHE 350 345 340 335 335 340 345 355 365 375 385 390 395 400 405 375 345 310 280 250 250 250 250
4G High 340 335 330 325 325 330 335 345 355 365 375 380 385 390 395 365 335 305 275 245 245 245 245
4G Low 325 320 315 310 310 315 320 330 340 350 360 365 370 375 380 345 310 275 240 205 205 205 205
3G HDHE 310 305 300 295 295 300 305 315 325 335 345 350 355 360 365 330 290 255 215 180 180 180 180
3G High 290 285 280 275 275 280 285 295 305 315 325 330 335 340 345 320 295 275 250 225 225 225 225
3G Low 260 255 250 245 245 250 255 265 275 285 295 300 305 310 315 285 255 230 200 170 170 170 170
HDHE JU 230 225 220 215 210 205 200 195 190 185 180 185 190 195 200 200 200 195 195 195 195 195 195
Prem JU 180 175 170 165 160 155 150 145 140 135 130 135 140 145 150 155 160 165 170 175 175 175 175
High End JU 160 155 150 145 140 135 130 125 120 115 110 115 120 125 130 130 130 125 125 125 125 125 125
Standard JU 130 125 120 115 110 105 100 95 90 85 80 85 90 95 100 100 95 95 90 90 90 90 90
Sub-Standard JU 100 95 90 85 80 75 70 65 60 55 50 55 60 65 70 75 80 85 90 95 95 95 95
Commodity JU 90 85 80 75 70 65 60 55 50 45 40 45 50 55 60 65 65 70 70 75 75 75 75
Legacy 70 65 60 55 50 45 40 40 40 40 40 45 50 55 60 65 70 80 85 90 90 90 90
Trough of Floater Dayrates Floater Market Recovery New Floater Cycle Upswing Normalized (9% Cost of
Capital Returns) Transition
Jackup Dayrates Decline as Newbuilds Arrive
Normalized (9% Cost of
Capital Returns) Transition Modest Dayrate
Recovery
We acknowledge the potential for a fade in dayrates
to become more severe if sentiment takes an
extreme turn.
Guggenheim Securities, LLC | 972-638-5502 | guggenheimsecurities.com
Top Ten Reasons to Fear the Jackup Market; Downgrading ESV to Neutral PAGE 14

20
30
40
50
60
70
80
90
100
110
120
130
140
150
160
170
180
190
200
210
20
30
40
50
60
70
80
90
100
110
120
130
140
150
160
170
180
190
200
210
Jan
-03
Ju
n-0
3
No
v-0
3
Ap
r-04
Sep
-04
Feb
-05
Ju
l-05
Dec-0
5
May-0
6
Oct-
06
Mar-
07
Au
g-0
7
Jan
-08
Ju
n-0
8
No
v-0
8
Ap
r-09
Sep
-09
Feb
-10
Ju
l-10
Dec-1
0
May-1
1
Oct-
11
Mar-
12
Au
g-1
2
Jan
-13
Ju
n-1
3
No
v-1
3
Ap
r-14
JU >300ft Avg. Dayrate JU Premium Avg. Fixture JU High End Avg. Fixture
7) Premium & Standard Jackup Fixtures May Offer False Security
Source: IHS Inc., Guggenheim Securities, LLC.
Jackup: Premium/High End Dayrate History
Jackup: Standard Dayrate History
25
50
75
100
125
150
175
200
225
25
50
75
100
125
150
175
200
225
Jan
-03
Ju
n-0
3
No
v-0
3
Ap
r-04
Sep
-04
Feb
-05
Ju
l-05
Dec-0
5
May-0
6
Oct-
06
Mar-
07
Au
g-0
7
Jan
-08
Ju
n-0
8
No
v-0
8
Ap
r-09
Sep
-09
Feb
-10
Ju
l-10
Dec-1
0
May-1
1
Oct-
11
Mar-
12
Au
g-1
2
Jan
-13
Ju
n-1
3
No
v-1
3
Ap
r-14
JU 300-IC Avg Dayrate JU Standard Avg. Fixture
Jackup fixtures continue to trend
above current dayrate averages.
Although there are few signs of
weakness, we see the optics of the
arrival of several uncontracted
newbuilds as an overhang on
dayrates in the near term. As a result,
we forecast a fade in average
dayrates over the near term.
Guggenheim Securities, LLC | 972-638-5502 | guggenheimsecurities.com
Top Ten Reasons to Fear the Jackup Market; Downgrading ESV to Neutral PAGE 15
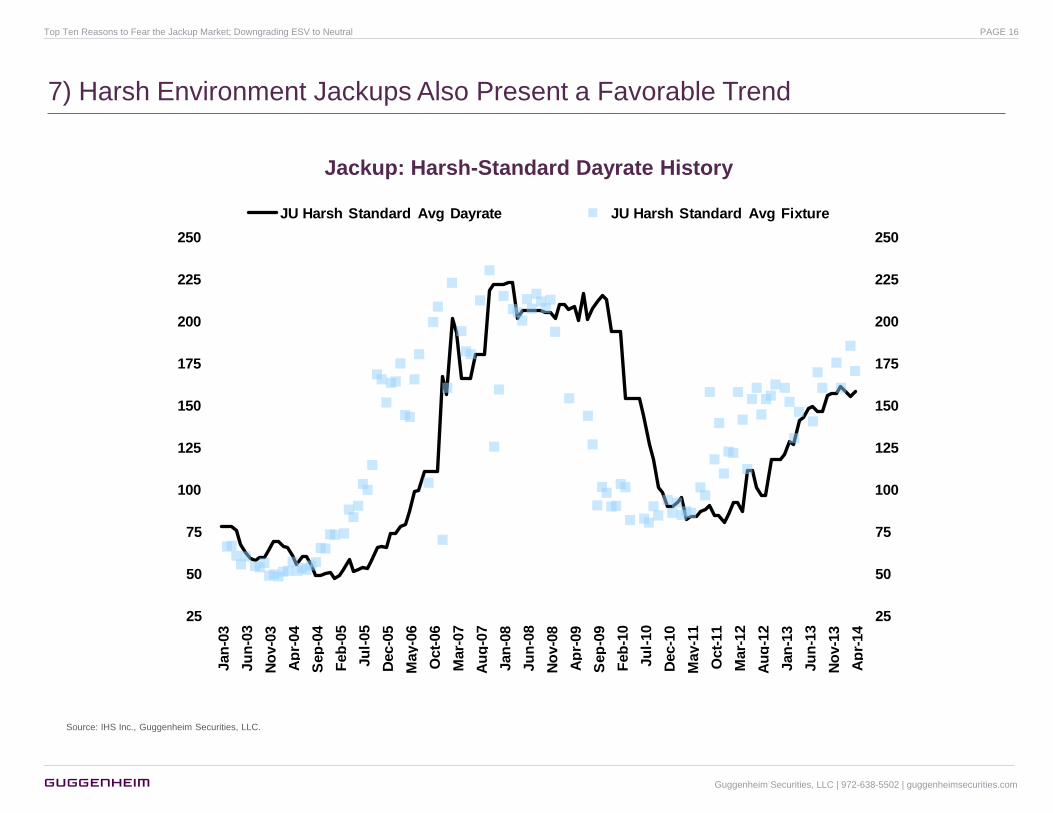
7) Harsh Environment Jackups Also Present a Favorable Trend
Source: IHS Inc., Guggenheim Securities, LLC.
Jackup: Harsh-Standard Dayrate History
25
50
75
100
125
150
175
200
225
250
25
50
75
100
125
150
175
200
225
250 Jan
-03
Ju
n-0
3
No
v-0
3
Ap
r-04
Sep
-04
Feb
-05
Ju
l-05
Dec-0
5
May-0
6
Oct-
06
Mar-
07
Au
g-0
7
Jan
-08
Ju
n-0
8
No
v-0
8
Ap
r-09
Sep
-09
Feb
-10
Ju
l-10
Dec-1
0
May-1
1
Oct-
11
Mar-
12
Au
g-1
2
Jan
-13
Ju
n-1
3
No
v-1
3
Ap
r-14
JU Harsh Standard Avg Dayrate JU Harsh Standard Avg Fixture
Guggenheim Securities, LLC | 972-638-5502 | guggenheimsecurities.com
Top Ten Reasons to Fear the Jackup Market; Downgrading ESV to Neutral PAGE 16
0
2
4
6
8
10
12
14
16
19
53
19
54
19
55
19
56
19
57
19
58
19
59
19
60
19
61
19
62
19
63
19
64
19
65
19
66
19
67
19
68
19
69
19
70
19
71
19
72
19
73
19
74
19
75
19
76
19
77
19
78
19
79
19
80
19
81
19
82
19
83
19
84
19
85
19
86
19
87
19
88
19
89
19
90
19
91
19
92
19
93
19
94
19
95
19
96
19
97
19
98
19
99
20
00
20
01
20
02
20
03
20
04
20
05
20
06
20
07
20
08
20
09
20
10
20
11
20
12
20
13
# o
f R
igs
-
10
20
30
40
50
60
70
80
90
19
58
19
59
19
60
19
61
19
62
19
63
19
64
19
65
19
66
19
67
19
68
19
69
19
70
19
71
19
72
19
73
19
74
19
75
19
76
19
77
19
78
19
79
19
80
19
81
19
82
19
83
19
84
19
85
19
86
19
87
19
88
19
89
19
90
19
91
19
92
19
93
19
94
19
95
19
96
19
97
19
98
19
99
20
00
20
01
20
02
20
03
20
04
20
05
20
06
20
07
20
08
20
09
20
10
20
11
20
12
20
13
20
14
20
15
20
16
20
17
20
18
20
19
20
20
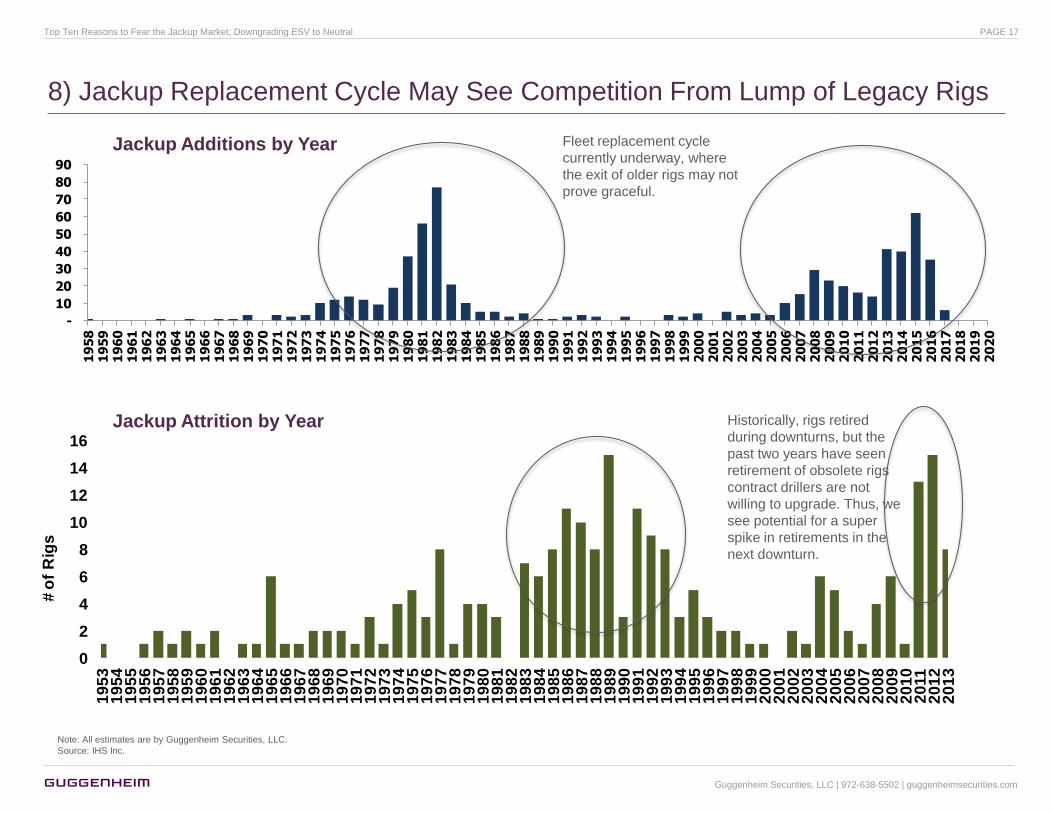
8) Jackup Replacement Cycle May See Competition From Lump of Legacy Rigs
Jackup Additions by Year
Jackup Attrition by Year
Fleet replacement cycle
currently underway, where
the exit of older rigs may not
prove graceful.
Historically, rigs retired
during downturns, but the
past two years have seen
retirement of obsolete rigs
contract drillers are not
willing to upgrade. Thus, we
see potential for a super
spike in retirements in the
next downturn.
Note: All estimates are by Guggenheim Securities, LLC.
Source: IHS Inc.
Guggenheim Securities, LLC | 972-638-5502 | guggenheimsecurities.com
Top Ten Reasons to Fear the Jackup Market; Downgrading ESV to Neutral PAGE 17
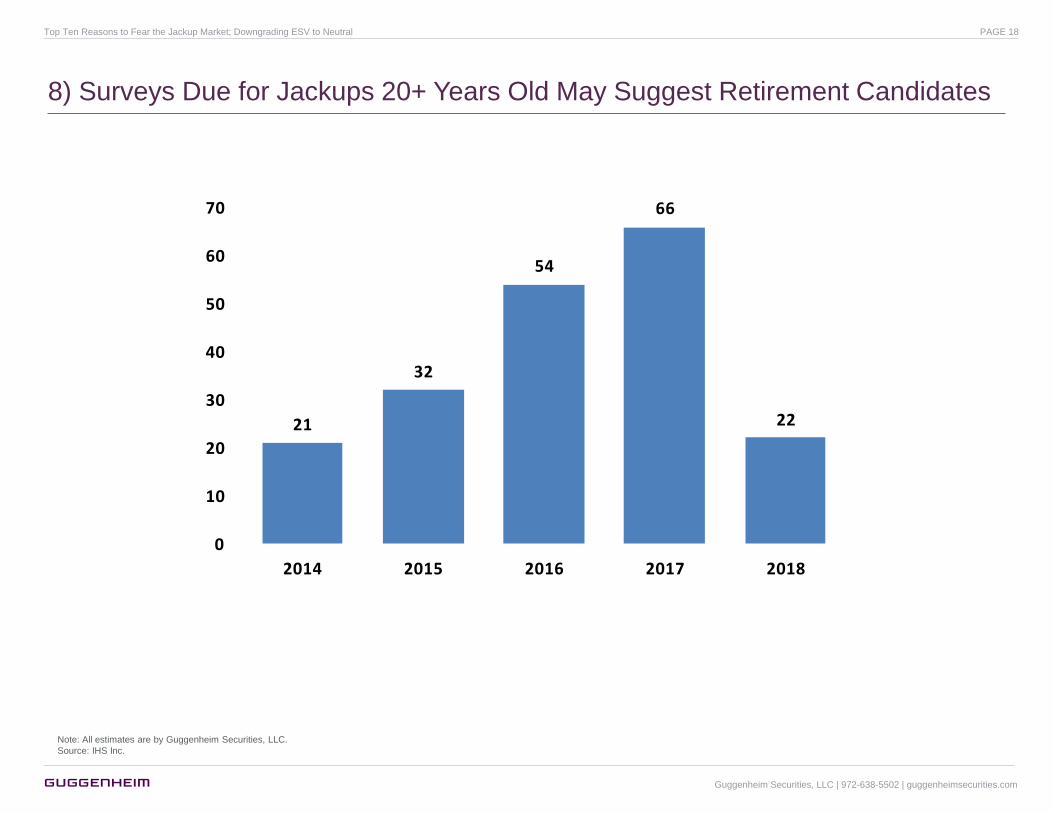
8) Surveys Due for Jackups 20+ Years Old May Suggest Retirement Candidates
21
32
54
66
22
0
10
20
30
40
50
60
70
2014 2015 2016 2017 2018
Note: All estimates are by Guggenheim Securities, LLC.
Source: IHS Inc.
Guggenheim Securities, LLC | 972-638-5502 | guggenheimsecurities.com
Top Ten Reasons to Fear the Jackup Market; Downgrading ESV to Neutral PAGE 18
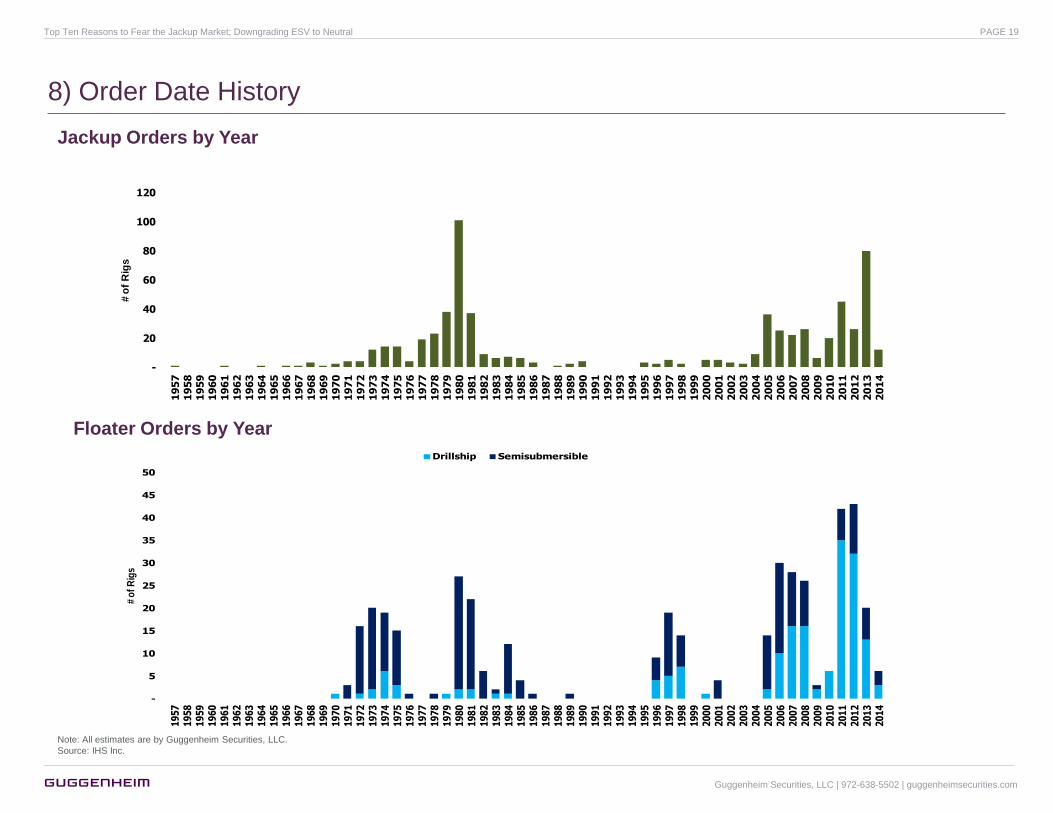
8) Order Date History
Jackup Orders by Year
Floater Orders by Year
-
20
40
60
80
100
120
19
57
19
58
19
59
19
60
19
61
19
62
19
63
19
64
19
65
19
66
19
67
19
68
19
69
19
70
19
71
19
72
19
73
19
74
19
75
19
76
19
77
19
78
19
79
19
80
19
81
19
82
19
83
19
84
19
85
19
86
19
87
19
88
19
89
19
90
19
91
19
92
19
93
19
94
19
95
19
96
19
97
19
98
19
99
20
00
20
01
20
02
20
03
20
04
20
05
20
06
20
07
20
08
20
09
20
10
20
11
20
12
20
13
20
14
# o
f R
igs
-
5
10
15
20
25
30
35
40
45
50
19
57
19
58
19
59
19
60
19
61
19
62
19
63
19
64
19
65
19
66
19
67
19
68
19
69
19
70
19
71
19
72
19
73
19
74
19
75
19
76
19
77
19
78
19
79
19
80
19
81
19
82
19
83
19
84
19
85
19
86
19
87
19
88
19
89
19
90
19
91
19
92
19
93
19
94
19
95
19
96
19
97
19
98
19
99
20
00
20
01
20
02
20
03
20
04
20
05
20
06
20
07
20
08
20
09
20
10
20
11
20
12
20
13
20
14
# o
f R
igs
Drillship Semisubmersible
Note: All estimates are by Guggenheim Securities, LLC.
Source: IHS Inc.
Guggenheim Securities, LLC | 972-638-5502 | guggenheimsecurities.com
Top Ten Reasons to Fear the Jackup Market; Downgrading ESV to Neutral PAGE 19
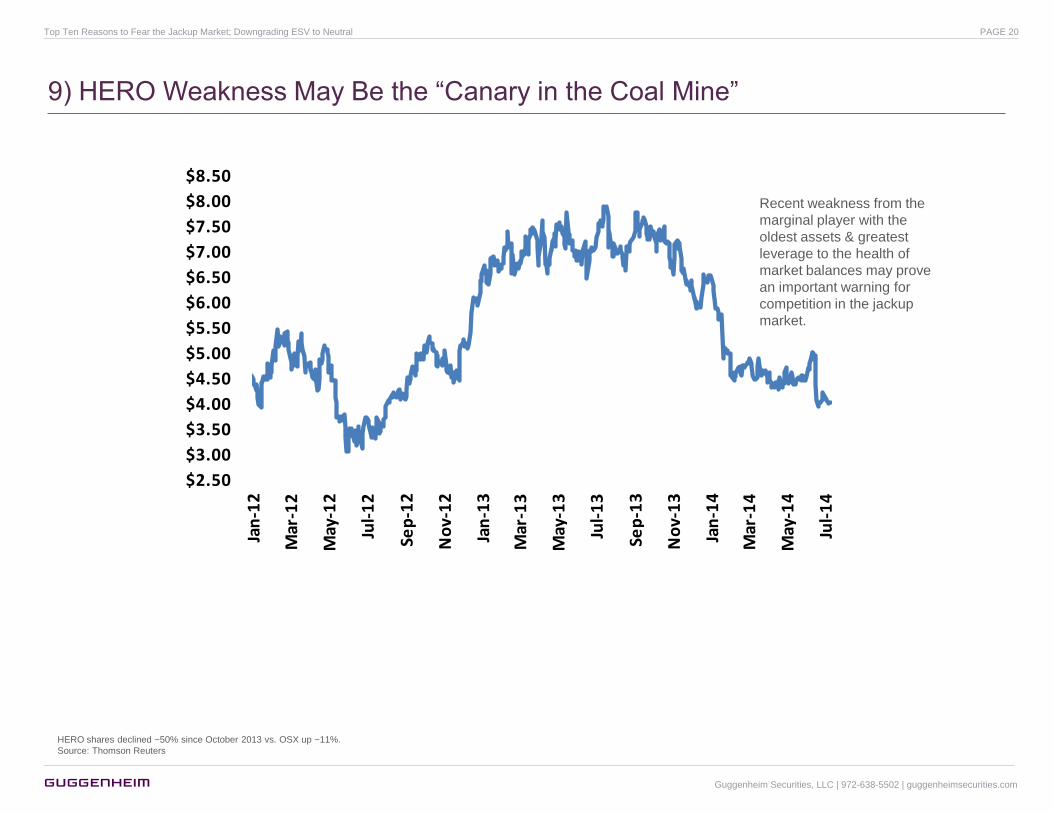
9) HERO Weakness May Be the “Canary in the Coal Mine”
$2.50
$3.00
$3.50
$4.00
$4.50
$5.00
$5.50
$6.00
$6.50
$7.00
$7.50
$8.00
$8.50
Jan
-12
Mar
-12
May
-12
Jul-
12
Sep
-12
No
v-1
2
Jan
-13
Mar
-13
May
-13
Jul-
13
Sep
-13
No
v-1
3
Jan
-14
Mar
-14
May
-14
Jul-
14
HERO shares declined ~50% since October 2013 vs. OSX up ~11%.
Source: Thomson Reuters
Recent weakness from the
marginal player with the
oldest assets & greatest
leverage to the health of
market balances may prove
an important warning for
competition in the jackup
market.
Guggenheim Securities, LLC | 972-638-5502 | guggenheimsecurities.com
Top Ten Reasons to Fear the Jackup Market; Downgrading ESV to Neutral PAGE 20
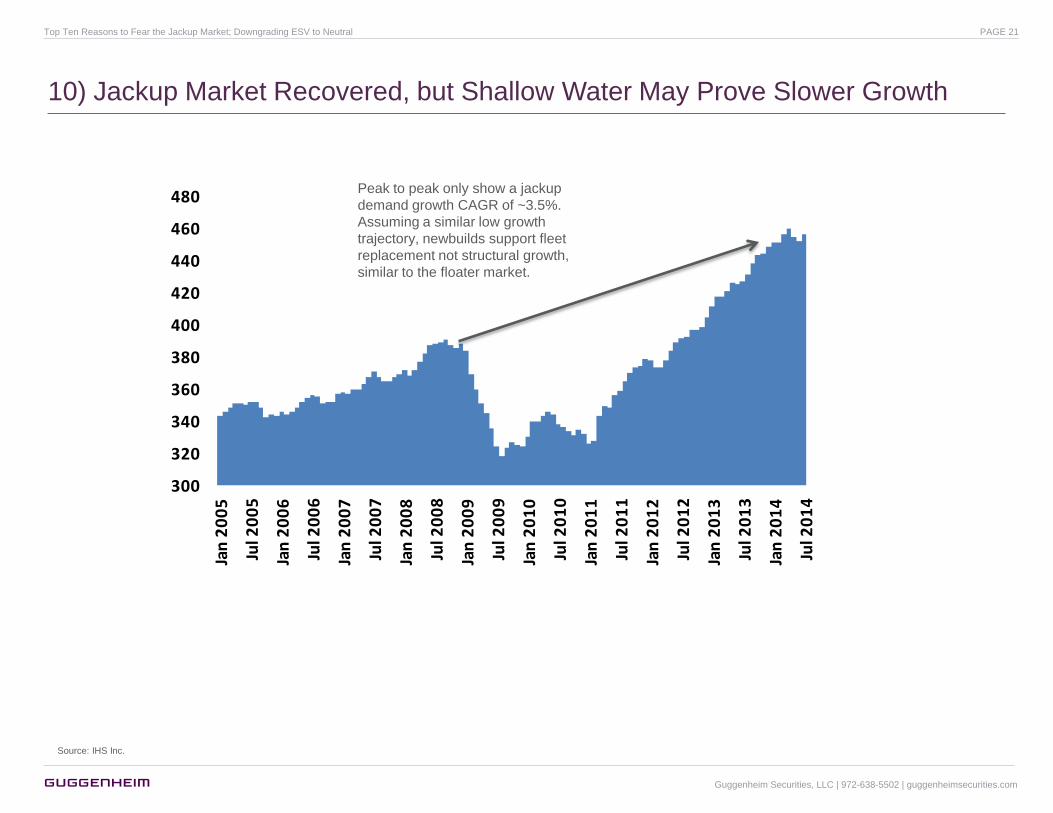
10) Jackup Market Recovered, but Shallow Water May Prove Slower Growth
300
320
340
360
380
400
420
440
460
480
Jan
20
05
Jul 2
00
5
Jan
20
06
Jul 2
00
6
Jan
20
07
Jul 2
00
7
Jan
20
08
Jul 2
00
8
Jan
20
09
Jul 2
00
9
Jan
20
10
Jul 2
01
0
Jan
20
11
Jul 2
01
1
Jan
20
12
Jul 2
01
2
Jan
20
13
Jul 2
01
3
Jan
20
14
Jul 2
01
4
Source: IHS Inc.
Peak to peak only show a jackup
demand growth CAGR of ~3.5%.
Assuming a similar low growth
trajectory, newbuilds support fleet
replacement not structural growth,
similar to the floater market.
Guggenheim Securities, LLC | 972-638-5502 | guggenheimsecurities.com
Top Ten Reasons to Fear the Jackup Market; Downgrading ESV to Neutral PAGE 21
Valuation & EPS Comp Sheets
Guggenheim Securities, LLC | 972-638-5502 | guggenheimsecurities.com
Top Ten Reasons to Fear the Jackup Market; Downgrading ESV to Neutral PAGE 22
NADL 9.2%
OII 2.5%
SDLP, 6.8%
DO, 7.1%
ESV, 5.5%
NE, 4.7%
ORIG, 4.1%
RDC, 1.3%
RIG, 6.9%
SDRL, 10.4%
CRR, 0.8%
SPN, 6.8%
0.0%
1.0%
2.0%
3.0%
4.0%
5.0%
6.0%
7.0%
8.0%
9.0%
10.0%
11.0%
12.0%
0% 10% 20% 30% 40% 50% 60% 70% 80% 90% 100%
Div
iden
d Y
ield
(L
ate
st
Qu
art
er
An
nu
ali
zed
)
DPS/CEPS 2Q14E (annulaized)
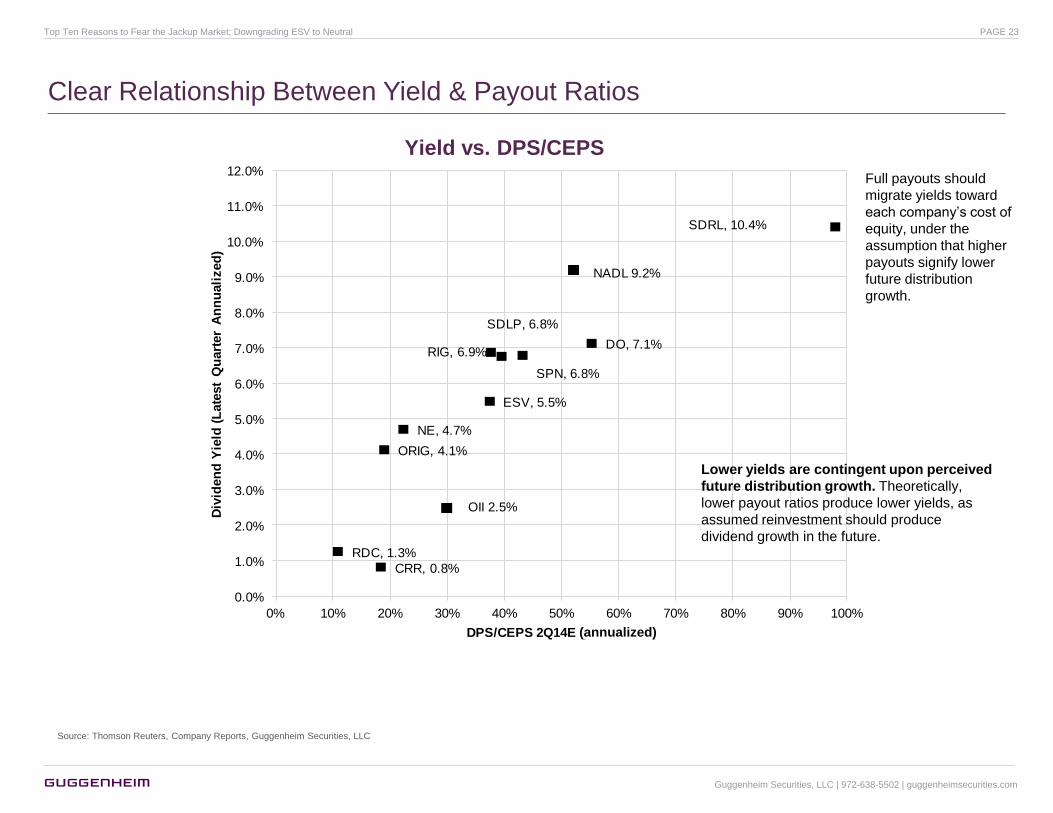
Clear Relationship Between Yield & Payout Ratios
Yield vs. DPS/CEPS
Source: Thomson Reuters, Company Reports, Guggenheim Securities, LLC
Full payouts should
migrate yields toward
each company’s cost of
equity, under the
assumption that higher
payouts signify lower
future distribution
growth.
Lower yields are contingent upon perceived
future distribution growth. Theoretically,
lower payout ratios produce lower yields, as
assumed reinvestment should produce
dividend growth in the future.
(annualized)
Guggenheim Securities, LLC | 972-638-5502 | guggenheimsecurities.com
Top Ten Reasons to Fear the Jackup Market; Downgrading ESV to Neutral PAGE 23
DO, 7.1%
ESV, 5.5%
NE, 4.7%
ORIG, 4.1%
RDC, 1.3%
RIG, 6.9%
SDRL, 10.4%
NADL, 9.2%
SDLP, 6.8%
0.0%
1.0%
2.0%
3.0%
4.0%
5.0%
6.0%
7.0%
8.0%
9.0%
10.0%
11.0%
12.0%
60% 70% 80% 90% 100% 110% 120% 130% 140%
Div
iden
d Y
ield
(L
ate
st
Qu
art
er
An
nu
ali
zed
)
P/NAV - Break-up 2013E
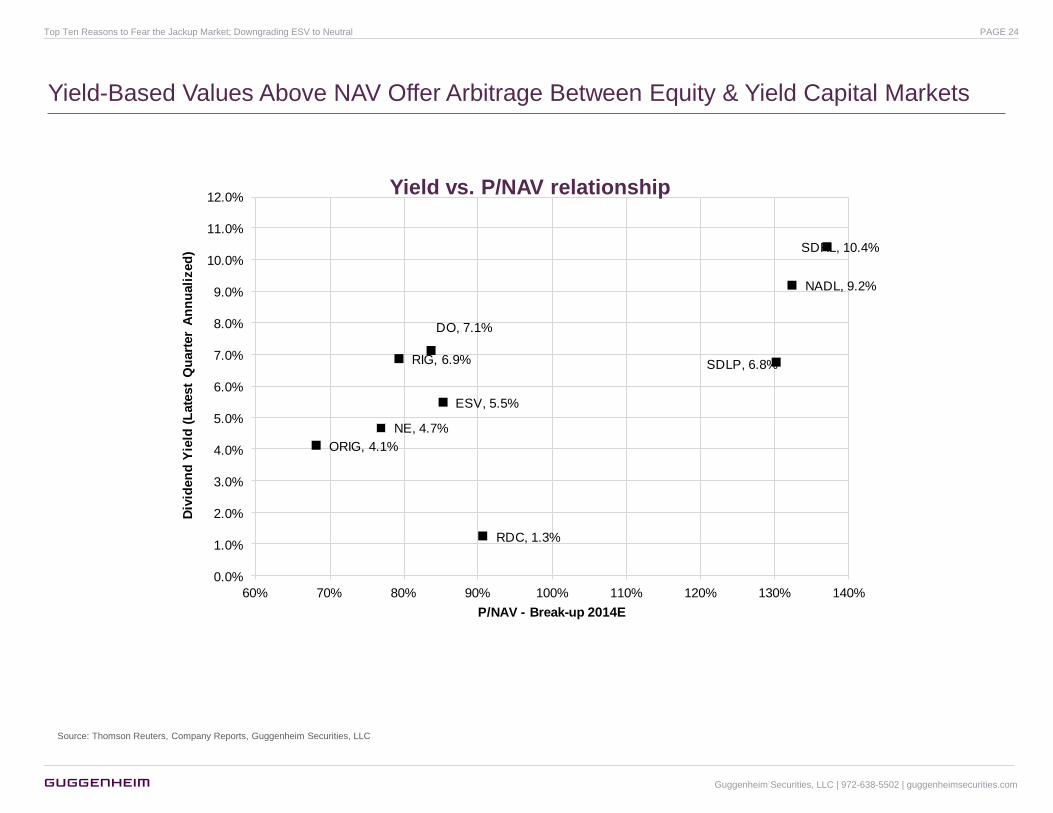
Yield-Based Values Above NAV Offer Arbitrage Between Equity & Yield Capital Markets
Yield vs. P/NAV relationship
Source: Thomson Reuters, Company Reports, Guggenheim Securities, LLC
2014E
Guggenheim Securities, LLC | 972-638-5502 | guggenheimsecurities.com
Top Ten Reasons to Fear the Jackup Market; Downgrading ESV to Neutral PAGE 24

OFS Earnings Metrics
Source: Thomson Reuters, Guggenheim Securities, LLC
Price Gugg EPS PE Consensus EPS EPS Variance
Company Ticker Rating 7/15 Target Upside P/NAV* 2Q14E 13 14E 15E 13 14E 15E 2Q14E 14E 15E 2Q14E 14E 15E
S&P 500 SPX 1,973 13.5 16.8 15.5 117.32 127.11
Large Cap Services
Baker Hughes BHI Neutral 72.82 75 3% NA 0.89 2.69 4.05 5.15 27.1 18.0 14.1 0.90 4.17 5.40 -1% -3% -5%
Halliburton HAL Neutral 70.26 75 7% NA 0.90 3.15 3.95 5.05 22.3 17.8 13.9 0.91 3.99 5.16 -2% -1% -2%
Schlumberger SLB Buy 114.46 130 14% NA 1.35 4.79 5.65 6.75 23.9 20.3 17.0 1.36 5.70 6.81 0% -1% -1%
Weatherford WFT Neutral 22.17 18 -19% NA 0.21 0.60 1.10 1.50 37.0 20.2 14.8 0.21 1.08 1.68 0% 2% -11%8.54
Mean 27.6 19.0 14.9
Large Cap Equipment
Cameron CAM Buy 68.08 75 10% NA 0.85 3.28 3.90 5.00 20.8 17.5 13.6 0.87 3.92 4.89 -3% -1% 2%
FMC Tech FTI Buy 60.28 75 24% NA 0.63 2.11 2.70 3.40 28.6 22.3 17.7 0.63 2.70 3.34 0% 0% 2%
Nat Oil Varco NOV Buy 83.88 100 19% NA 1.47 5.52 6.05 6.60 15.2 13.9 12.7 1.44 6.00 6.71 2% 1% -2%
Tenaris TS Buy 45.10 65 44% NA 0.70 2.62 2.80 4.05 17.2 16.1 11.1 0.70 2.80 3.10 -1% 0% 31%
Mean 20.4 17.4 13.8
SMid Cap Svcs & Equipment
Aker Solutions AKSO Buy kr 94.35 kr 125 32% NA kr 1.41 kr 5.25 kr 5.80 kr 7.45 18.0 16.3 12.7 1.41 kr 6.09 kr 8.09 0% -5% -8%
C&J Energy Svcs CJES Neutral 32.43 32 -1% NA 0.24 1.21 1.20 2.15 26.8 27.0 15.1 0.26 1.20 2.21 -7% 0% -3%
Core Laboratories CLB Neutral 164.82 170 3% NA 1.34 5.32 5.85 6.30 31.0 28.2 26.2 1.34 5.88 6.62 0% 0% -5%
Carbo Ceramics CRR Neutral 146.09 165 13% NA 1.06 3.70 4.40 5.65 39.5 33.2 25.9 0.97 4.36 5.82 9% 1% -3%
Dresser-Rand DRC Neutral 60.30 67 11% NA 0.39 3.00 2.70 3.35 20.1 22.3 18.0 0.39 2.64 3.17 -1% 2% 6%
Dril-Quip DRQ Neutral 104.84 110 5% NA 1.15 4.23 4.85 5.90 24.8 21.6 17.8 1.15 4.95 6.06 0% -2% -3%
Forum Energy Tech FET Neutral 35.17 32 -9% NA 0.41 1.46 0.74 0.95 24.1 19.3 37.0 0.43 1.83 2.30 -4% -59% -59%
Frank's International FI Buy 23.11 30 30% NA 0.31 1.98 1.30 1.45 11.7 17.8 15.9 0.31 1.28 1.45 0% 2% 0%
Oceaneering OII Neutral 73.17 80 9% NA 1.01 3.40 4.00 4.55 21.5 18.3 16.1 1.01 4.04 4.69 0% -1% -3%
Oil States Int'l OIS Neutral 62.41 62 -1% NA 0.95 6.18 4.15 4.05 10.1 15.0 15.4 0.86 3.69 4.14 10% 13% -2%
Superior Energy Svcs SPN Neutral 35.89 34 -5% NA 0.39 1.56 1.50 2.25 23.0 21.1 16.0 0.41 1.70 2.44 -5% -12% -8%
U.S. Silica Holdings SLCA NC 55.97 NC - NA - - - - 38.1 28.6 20.0 0.46 1.96 2.80 - - -132% 39.91
Mean 24.0 22.4 19.7
Offshore Drilling
Atwood Oceanics* ATW Buy 50.66 62 22% 82% 1.13 5.32 4.80 6.95 9.5 10.6 7.3 1.07 4.99 7.20 6% -4% -4%
Diamond DO Buy 49.34 65 32% 84% 0.75 4.77 4.00 5.60 10.3 12.3 8.8 0.57 3.46 4.34 31% 16% 29%
Ensco plc ESV Neutral 54.56 58 6% 85% 1.30 6.16 5.46 6.00 8.9 10.0 9.1 1.33 5.58 5.77 -3% -2% 4%
Hercules Offshore HERO Neutral 4.04 4.50 11% 81% 0.08 0.24 0.46 0.05 16.8 8.8 80.8 0.02 0.38 0.49 433% 21% -90%
Noble Corp NE Buy 32.28 42 30% 77% 0.70 2.89 3.70 3.90 11.2 8.7 8.3 0.67 3.48 3.68 5% 6% 6%
Ocean Rig UDW ORIG Buy 18.39 28 52% 66% 0.47 0.84 2.00 2.80 21.9 9.2 6.6 0.39 1.66 2.21 21% 20% 27%
Pacific Drilling PACD Buy 9.99 14 40% 71% 0.21 0.42 0.95 1.25 23.8 10.5 8.0 0.18 0.78 1.26 14% 22% -1%
Rowan RDC Neutral 31.71 36 14% 88% 0.29 1.96 2.60 4.75 16.2 12.2 6.7 0.26 2.27 4.20 11% 15% 13%
Transocean RIG Buy 43.61 55 26% 79% 1.21 4.12 4.70 4.05 10.6 9.3 10.8 1.13 4.33 3.52 7% 9% 15%
Seadrill SDRL Buy 38.38 50 30% 132% 0.60 3.02 3.15 3.10 12.7 12.2 12.4 0.77 3.10 3.64 -22% 1% -15%
Mean 84% 12.0 10.5 18.0
Onshore Drilling
Helm & Payne* HP Neutral 112.93 110 -3% NA 1.61 5.67 6.25 6.80 19.9 18.1 16.6 1.63 6.33 7.25 -1% -1% -6%
Nabors NBR Neutral 28.44 28 -2% NA 0.22 1.02 1.15 1.80 27.9 24.7 15.8 0.35 1.16 1.98 -36% -1% -9%
Precision Drilling PDS NC 13.40 NC - NA - - - - 21.9 16.6 12.4 (0.00) 0.81 1.08 - - -
Patterson UTI PTEN Neutral 34.54 35 1% NA 0.32 1.16 1.40 1.80 29.8 24.7 19.2 0.32 1.42 2.02 2% -2% -11%
Mean 24.9 21.0 16.0
*Quarterly EPS figures for ATW and HP reflect calendar year reporting basis. NAV figures for Offshore Drilling companies are Break-Up NAVs. PDS estimates in CAD. All units in $m except per share data.
Guggenheim Securities, LLC | 972-638-5502 | guggenheimsecurities.com
Top Ten Reasons to Fear the Jackup Market; Downgrading ESV to Neutral PAGE 25
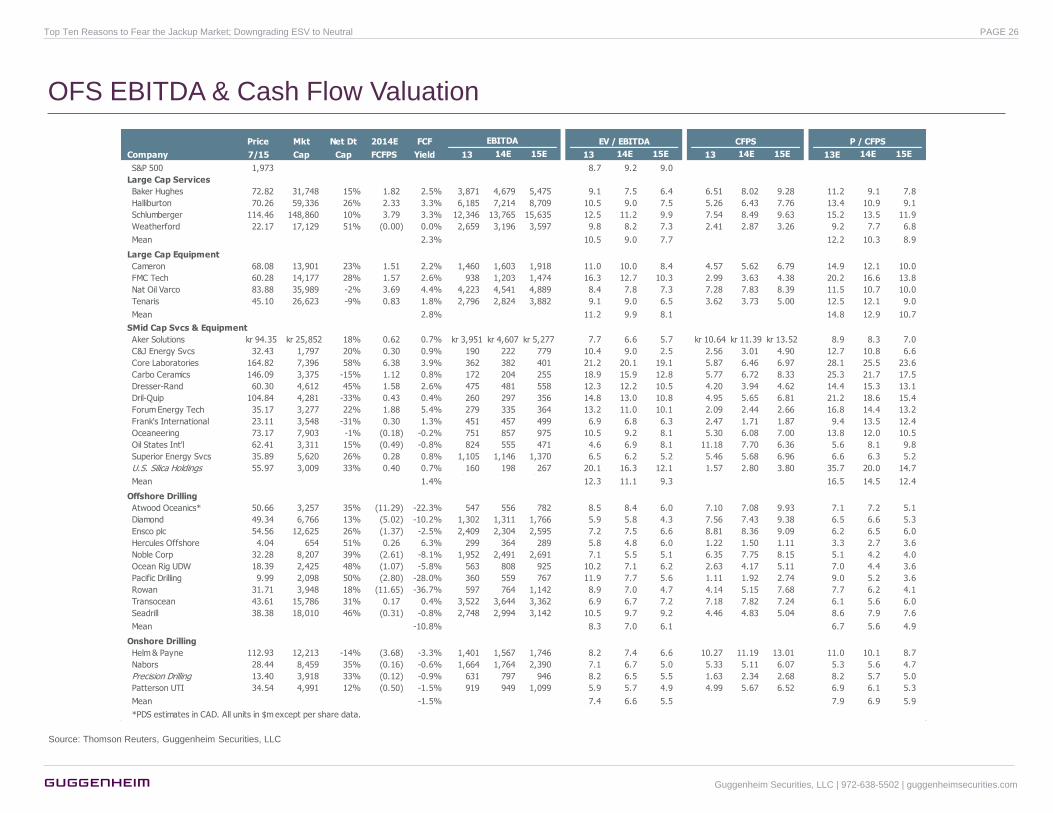
OFS EBITDA & Cash Flow Valuation
Source: Thomson Reuters, Guggenheim Securities, LLC
Price Mkt Net Dt 2014E FCF EBITDA EV / EBITDA CFPS P / CFPS
Company 7/15 Cap Cap FCFPS Yield 13 14E 15E 13 14E 15E 13 14E 15E 13E 14E 15E
S&P 500 1,973 8.7 9.2 9.0
Large Cap Services
Baker Hughes 72.82 31,748 15% 1.82 2.5% 3,871 4,679 5,475 9.1 7.5 6.4 6.51 8.02 9.28 11.2 9.1 7.8
Halliburton 70.26 59,336 26% 2.33 3.3% 6,185 7,214 8,709 10.5 9.0 7.5 5.26 6.43 7.76 13.4 10.9 9.1
Schlumberger 114.46 148,860 10% 3.79 3.3% 12,346 13,765 15,635 12.5 11.2 9.9 7.54 8.49 9.63 15.2 13.5 11.9
Weatherford 22.17 17,129 51% (0.00) 0.0% 2,659 3,196 3,597 9.8 8.2 7.3 2.41 2.87 3.26 9.2 7.7 6.8
Mean 2.3% 10.5 9.0 7.7 12.2 10.3 8.9
Large Cap Equipment
Cameron 68.08 13,901 23% 1.51 2.2% 1,460 1,603 1,918 11.0 10.0 8.4 4.57 5.62 6.79 14.9 12.1 10.0
FMC Tech 60.28 14,177 28% 1.57 2.6% 938 1,203 1,474 16.3 12.7 10.3 2.99 3.63 4.38 20.2 16.6 13.8
Nat Oil Varco 83.88 35,989 -2% 3.69 4.4% 4,223 4,541 4,889 8.4 7.8 7.3 7.28 7.83 8.39 11.5 10.7 10.0
Tenaris 45.10 26,623 -9% 0.83 1.8% 2,796 2,824 3,882 9.1 9.0 6.5 3.62 3.73 5.00 12.5 12.1 9.0
Mean 2.8% 11.2 9.9 8.1 14.8 12.9 10.7
SMid Cap Svcs & Equipment
Aker Solutions kr 94.35 kr 25,852 18% 0.62 0.7% kr 3,951 kr 4,607 kr 5,277 7.7 6.6 5.7 kr 10.64 kr 11.39 kr 13.52 8.9 8.3 7.0
C&J Energy Svcs 32.43 1,797 20% 0.30 0.9% 190 222 779 10.4 9.0 2.5 2.56 3.01 4.90 12.7 10.8 6.6
Core Laboratories 164.82 7,396 58% 6.38 3.9% 362 382 401 21.2 20.1 19.1 5.87 6.46 6.97 28.1 25.5 23.6
Carbo Ceramics 146.09 3,375 -15% 1.12 0.8% 172 204 255 18.9 15.9 12.8 5.77 6.72 8.33 25.3 21.7 17.5
Dresser-Rand 60.30 4,612 45% 1.58 2.6% 475 481 558 12.3 12.2 10.5 4.20 3.94 4.62 14.4 15.3 13.1
Dril-Quip 104.84 4,281 -33% 0.43 0.4% 260 297 356 14.8 13.0 10.8 4.95 5.65 6.81 21.2 18.6 15.4
Forum Energy Tech 35.17 3,277 22% 1.88 5.4% 279 335 364 13.2 11.0 10.1 2.09 2.44 2.66 16.8 14.4 13.2
Frank's International 23.11 3,548 -31% 0.30 1.3% 451 457 499 6.9 6.8 6.3 2.47 1.71 1.87 9.4 13.5 12.4
Oceaneering 73.17 7,903 -1% (0.18) -0.2% 751 857 975 10.5 9.2 8.1 5.30 6.08 7.00 13.8 12.0 10.5
Oil States Int'l 62.41 3,311 15% (0.49) -0.8% 824 555 471 4.6 6.9 8.1 11.18 7.70 6.36 5.6 8.1 9.8
Superior Energy Svcs 35.89 5,620 26% 0.28 0.8% 1,105 1,146 1,370 6.5 6.2 5.2 5.46 5.68 6.96 6.6 6.3 5.2
U.S. Silica Holdings 55.97 3,009 33% 0.40 0.7% 160 198 267 20.1 16.3 12.1 1.57 2.80 3.80 35.7 20.0 14.716,938 18,309 21,815 76 79 92
Mean 1.4% 12.3 11.1 9.3 16.5 14.5 12.4
Offshore Drilling
Atwood Oceanics* 50.66 3,257 35% (11.29) -22.3% 547 556 782 8.5 8.4 6.0 7.10 7.08 9.93 7.1 7.2 5.1
Diamond 49.34 6,766 13% (5.02) -10.2% 1,302 1,311 1,766 5.9 5.8 4.3 7.56 7.43 9.38 6.5 6.6 5.3
Ensco plc 54.56 12,625 26% (1.37) -2.5% 2,409 2,304 2,595 7.2 7.5 6.6 8.81 8.36 9.09 6.2 6.5 6.0
Hercules Offshore 4.04 654 51% 0.26 6.3% 299 364 289 5.8 4.8 6.0 1.22 1.50 1.11 3.3 2.7 3.6
Noble Corp 32.28 8,207 39% (2.61) -8.1% 1,952 2,491 2,691 7.1 5.5 5.1 6.35 7.75 8.15 5.1 4.2 4.0
Ocean Rig UDW 18.39 2,425 48% (1.07) -5.8% 563 808 925 10.2 7.1 6.2 2.63 4.17 5.11 7.0 4.4 3.6
Pacific Drilling 9.99 2,098 50% (2.80) -28.0% 360 559 767 11.9 7.7 5.6 1.11 1.92 2.74 9.0 5.2 3.6
Rowan 31.71 3,948 18% (11.65) -36.7% 597 764 1,142 8.9 7.0 4.7 4.14 5.15 7.68 7.7 6.2 4.1
Transocean 43.61 15,786 31% 0.17 0.4% 3,522 3,644 3,362 6.9 6.7 7.2 7.18 7.82 7.24 6.1 5.6 6.0
Seadrill 38.38 18,010 46% (0.31) -0.8% 2,748 2,994 3,142 10.5 9.7 9.2 4.46 4.83 5.04 8.6 7.9 7.6
Mean -10.8% 8.3 7.0 6.1 6.7 5.6 4.9
Onshore Drilling
Helm & Payne 112.93 12,213 -14% (3.68) -3.3% 1,401 1,567 1,746 8.2 7.4 6.6 10.27 11.19 13.01 11.0 10.1 8.7
Nabors 28.44 8,459 35% (0.16) -0.6% 1,664 1,764 2,390 7.1 6.7 5.0 5.33 5.11 6.07 5.3 5.6 4.7
Precision Drilling 13.40 3,918 33% (0.12) -0.9% 631 797 946 8.2 6.5 5.5 1.63 2.34 2.68 8.2 5.7 5.0
Patterson UTI 34.54 4,991 12% (0.50) -1.5% 919 949 1,099 5.9 5.7 4.9 4.99 5.67 6.52 6.9 6.1 5.3
Mean -1.5% 7.4 6.6 5.5 7.9 6.9 5.9
*PDS estimates in CAD. All units in $m except per share data.
Guggenheim Securities, LLC | 972-638-5502 | guggenheimsecurities.com
Top Ten Reasons to Fear the Jackup Market; Downgrading ESV to Neutral PAGE 26
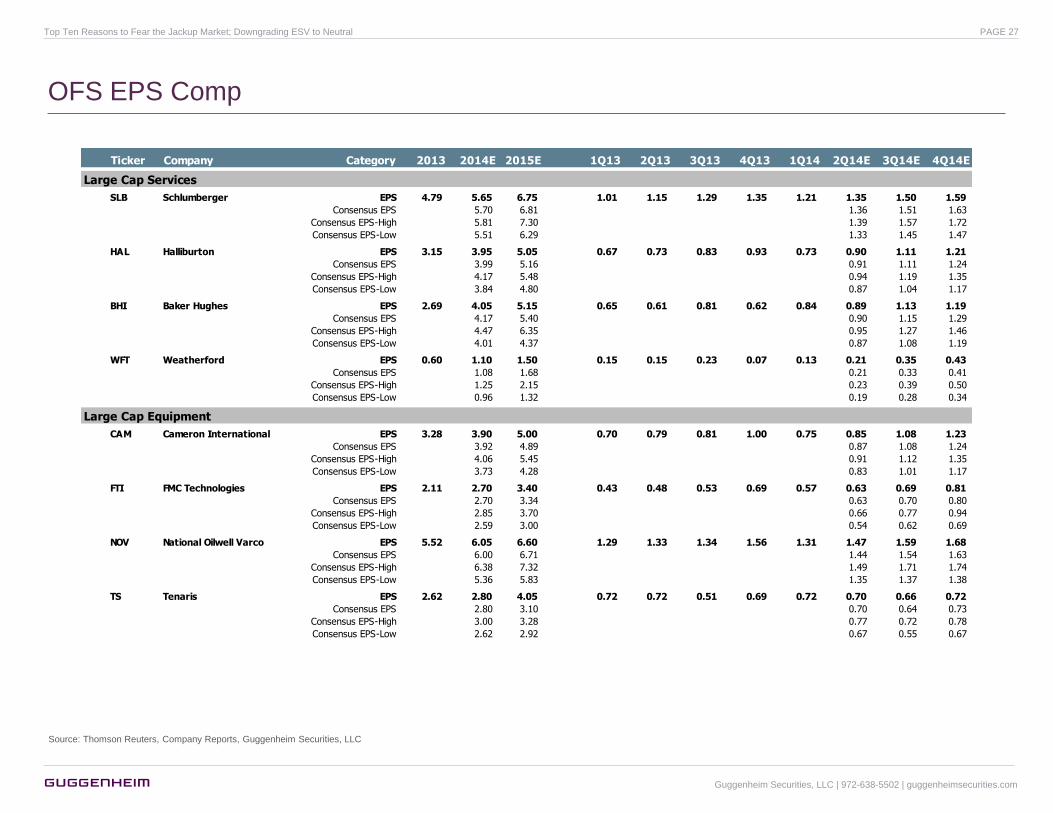
OFS EPS Comp
Source: Thomson Reuters, Company Reports, Guggenheim Securities, LLC
Ticker Company Category 2013 2014E 2015E 1Q13 2Q13 3Q13 4Q13 1Q14 2Q14E 3Q14E 4Q14E
Large Cap Services
SLB Schlumberger EPS 4.79 5.65 6.75 1.01 1.15 1.29 1.35 1.21 1.35 1.50 1.59
Consensus EPS 5.70 6.81 1.36 1.51 1.63
Consensus EPS-High 5.81 7.30 1.39 1.57 1.72
Consensus EPS-Low 5.51 6.29 1.33 1.45 1.47
HAL Halliburton EPS 3.15 3.95 5.05 0.67 0.73 0.83 0.93 0.73 0.90 1.11 1.21
Consensus EPS 3.99 5.16 0.91 1.11 1.24
Consensus EPS-High 4.17 5.48 0.94 1.19 1.35
Consensus EPS-Low 3.84 4.80 0.87 1.04 1.17
BHI Baker Hughes EPS 2.69 4.05 5.15 0.65 0.61 0.81 0.62 0.84 0.89 1.13 1.19
Consensus EPS 4.17 5.40 0.90 1.15 1.29
Consensus EPS-High 4.47 6.35 0.95 1.27 1.46
Consensus EPS-Low 4.01 4.37 0.87 1.08 1.19
WFT Weatherford EPS 0.60 1.10 1.50 0.15 0.15 0.23 0.07 0.13 0.21 0.35 0.43
Consensus EPS 1.08 1.68 0.21 0.33 0.41
Consensus EPS-High 1.25 2.15 0.23 0.39 0.50
Consensus EPS-Low 0.96 1.32 0.19 0.28 0.34
Large Cap Equipment
CAM Cameron International EPS 3.28 3.90 5.00 0.70 0.79 0.81 1.00 0.75 0.85 1.08 1.23
Consensus EPS 3.92 4.89 0.87 1.08 1.24
Consensus EPS-High 4.06 5.45 0.91 1.12 1.35
Consensus EPS-Low 3.73 4.28 0.83 1.01 1.17
FTI FMC Technologies EPS 2.11 2.70 3.40 0.43 0.48 0.53 0.69 0.57 0.63 0.69 0.81
Consensus EPS 2.70 3.34 0.63 0.70 0.80
Consensus EPS-High 2.85 3.70 0.66 0.77 0.94
Consensus EPS-Low 2.59 3.00 0.54 0.62 0.69
NOV National Oilwell Varco EPS 5.52 6.05 6.60 1.29 1.33 1.34 1.56 1.31 1.47 1.59 1.68
Consensus EPS 6.00 6.71 1.44 1.54 1.63
Consensus EPS-High 6.38 7.32 1.49 1.71 1.74
Consensus EPS-Low 5.36 5.83 1.35 1.37 1.38
TS Tenaris EPS 2.62 2.80 4.05 0.72 0.72 0.51 0.69 0.72 0.70 0.66 0.72
Consensus EPS 2.80 3.10 0.70 0.64 0.73
Consensus EPS-High 3.00 3.28 0.77 0.72 0.78
Consensus EPS-Low 2.62 2.92 0.67 0.55 0.67
Guggenheim Securities, LLC | 972-638-5502 | guggenheimsecurities.com
Top Ten Reasons to Fear the Jackup Market; Downgrading ESV to Neutral PAGE 27
OFS EPS Comp
Source: Thomson Reuters, Company Reports, Guggenheim Securities, LLC
Ticker Company Category 2013 2014E 2015E 1Q13 2Q13 3Q13 4Q13 1Q14 2Q14E 3Q14E 4Q14E
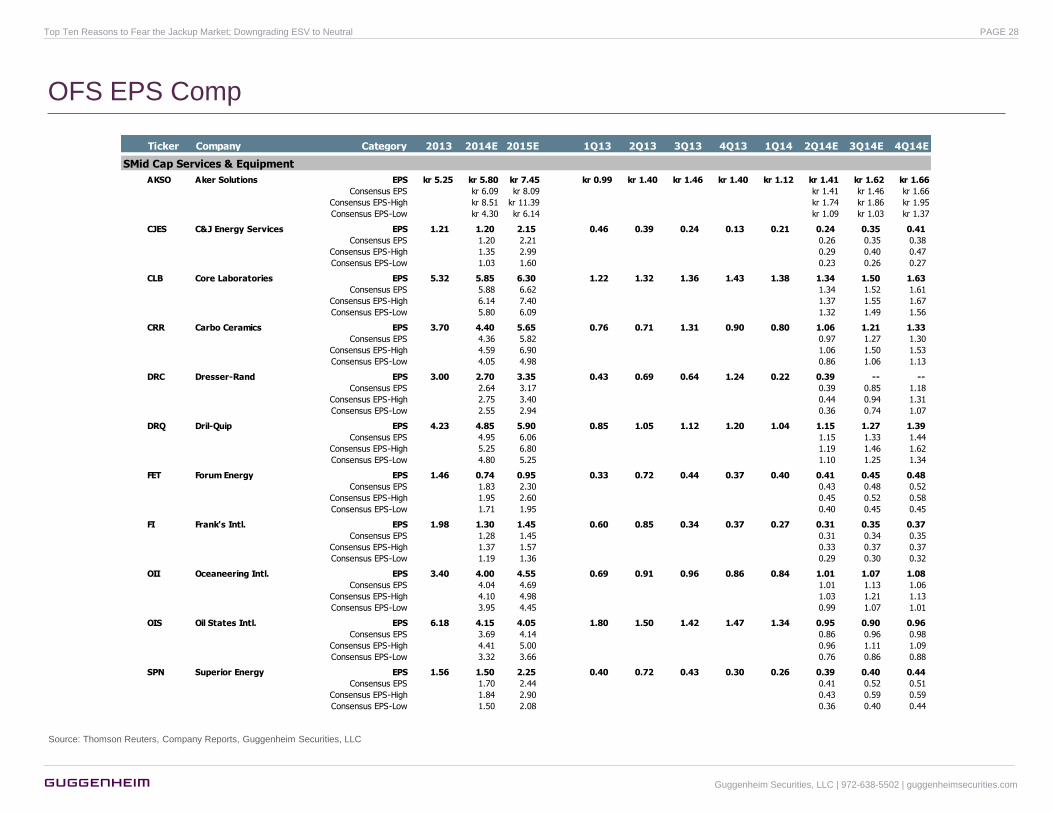
SMid Cap Services & Equipment
AKSO-NOAKSO Aker Solutions EPS kr 5.25 kr 5.80 kr 7.45 kr 0.99 kr 1.40 kr 1.46 kr 1.40 kr 1.12 kr 1.41 kr 1.62 kr 1.66
Consensus EPS kr 6.09 kr 8.09 kr 1.41 kr 1.46 kr 1.66
Consensus EPS-High kr 8.51 kr 11.39 kr 1.74 kr 1.86 kr 1.95
Consensus EPS-Low kr 4.30 kr 6.14 kr 1.09 kr 1.03 kr 1.37
CJES C&J Energy Services EPS 1.21 1.20 2.15 0.46 0.39 0.24 0.13 0.21 0.24 0.35 0.41
Consensus EPS 1.20 2.21 0.26 0.35 0.38
Consensus EPS-High 1.35 2.99 0.29 0.40 0.47
Consensus EPS-Low 1.03 1.60 0.23 0.26 0.27
CLB Core Laboratories EPS 5.32 5.85 6.30 1.22 1.32 1.36 1.43 1.38 1.34 1.50 1.63
Consensus EPS 5.88 6.62 1.34 1.52 1.61
Consensus EPS-High 6.14 7.40 1.37 1.55 1.67
Consensus EPS-Low 5.80 6.09 1.32 1.49 1.56
CRR Carbo Ceramics EPS 3.70 4.40 5.65 0.76 0.71 1.31 0.90 0.80 1.06 1.21 1.33
Consensus EPS 4.36 5.82 0.97 1.27 1.30
Consensus EPS-High 4.59 6.90 1.06 1.50 1.53
Consensus EPS-Low 4.05 4.98 0.86 1.06 1.13
DRC Dresser-Rand EPS 3.00 2.70 3.35 0.43 0.69 0.64 1.24 0.22 0.39 -- --
Consensus EPS 2.64 3.17 0.39 0.85 1.18
Consensus EPS-High 2.75 3.40 0.44 0.94 1.31
Consensus EPS-Low 2.55 2.94 0.36 0.74 1.07
DRQ Dril-Quip EPS 4.23 4.85 5.90 0.85 1.05 1.12 1.20 1.04 1.15 1.27 1.39
Consensus EPS 4.95 6.06 1.15 1.33 1.44
Consensus EPS-High 5.25 6.80 1.19 1.46 1.62
Consensus EPS-Low 4.80 5.25 1.10 1.25 1.34
FET Forum Energy EPS 1.46 0.74 0.95 0.33 0.72 0.44 0.37 0.40 0.41 0.45 0.48
Consensus EPS 1.83 2.30 0.43 0.48 0.52
Consensus EPS-High 1.95 2.60 0.45 0.52 0.58
Consensus EPS-Low 1.71 1.95 0.40 0.45 0.45
FI Frank's Intl. EPS 1.98 1.30 1.45 0.60 0.85 0.34 0.37 0.27 0.31 0.35 0.37
Consensus EPS 1.28 1.45 0.31 0.34 0.35
Consensus EPS-High 1.37 1.57 0.33 0.37 0.37
Consensus EPS-Low 1.19 1.36 0.29 0.30 0.32
OII Oceaneering Intl. EPS 3.40 4.00 4.55 0.69 0.91 0.96 0.86 0.84 1.01 1.07 1.08
Consensus EPS 4.04 4.69 1.01 1.13 1.06
Consensus EPS-High 4.10 4.98 1.03 1.21 1.13
Consensus EPS-Low 3.95 4.45 0.99 1.07 1.01
OIS Oil States Intl. EPS 6.18 4.15 4.05 1.80 1.50 1.42 1.47 1.34 0.95 0.90 0.96
Consensus EPS 3.69 4.14 0.86 0.96 0.98
Consensus EPS-High 4.41 5.00 0.96 1.11 1.09
Consensus EPS-Low 3.32 3.66 0.76 0.86 0.88
SPN Superior Energy EPS 1.56 1.50 2.25 0.40 0.72 0.43 0.30 0.26 0.39 0.40 0.44
Consensus EPS 1.70 2.44 0.41 0.52 0.51
Consensus EPS-High 1.84 2.90 0.43 0.59 0.59
Consensus EPS-Low 1.50 2.08 0.36 0.40 0.44
Guggenheim Securities, LLC | 972-638-5502 | guggenheimsecurities.com
Top Ten Reasons to Fear the Jackup Market; Downgrading ESV to Neutral PAGE 28
OFS EPS Comp
Source: Thomson Reuters, Company Reports, Guggenheim Securities, LLC
Ticker Company Category 2013 2014E 2015E 1Q13 2Q13 3Q13 4Q13 1Q14 2Q14E 3Q14E 4Q14E
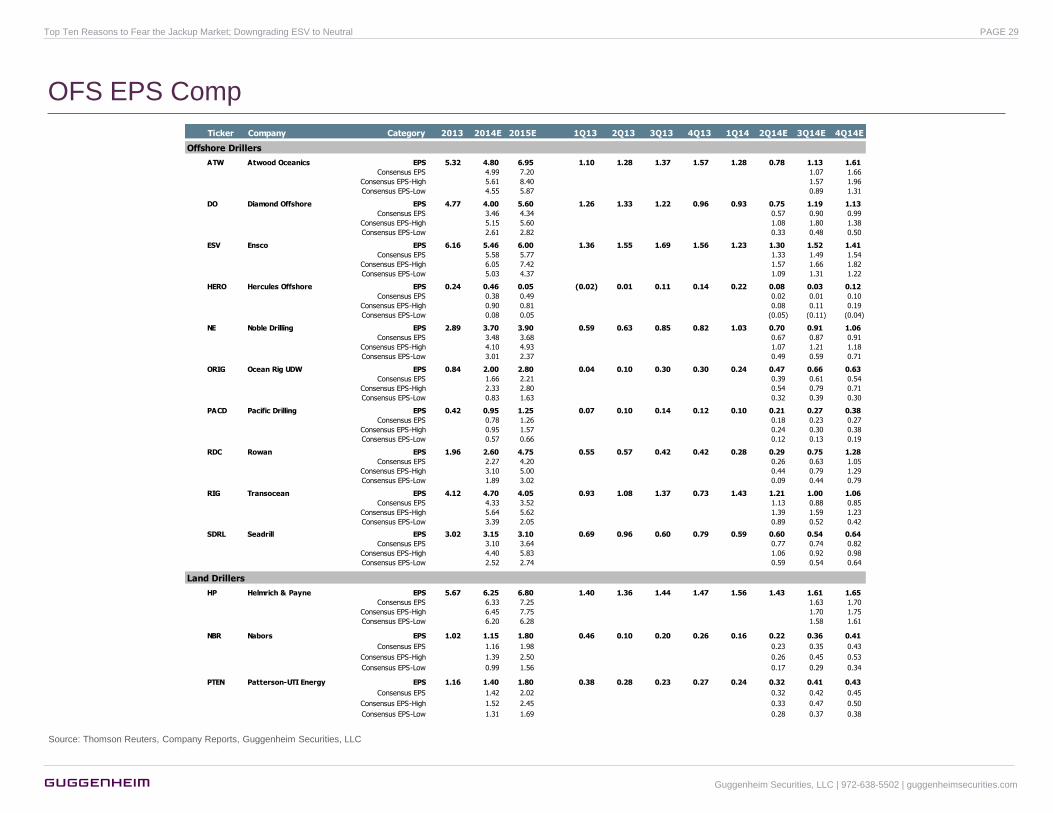
Offshore Drillers
ATW Atwood Oceanics EPS 5.32 4.80 6.95 1.10 1.28 1.37 1.57 1.28 0.78 1.13 1.61
Consensus EPS 4.99 7.20 1.07 1.66
Consensus EPS-High 5.61 8.40 1.57 1.96
Consensus EPS-Low 4.55 5.87 0.89 1.31
DO Diamond Offshore EPS 4.77 4.00 5.60 1.26 1.33 1.22 0.96 0.93 0.75 1.19 1.13
Consensus EPS 3.46 4.34 0.57 0.90 0.99
Consensus EPS-High 5.15 5.60 1.08 1.80 1.38
Consensus EPS-Low 2.61 2.82 0.33 0.48 0.50
ESV Ensco EPS 6.16 5.46 6.00 1.36 1.55 1.69 1.56 1.23 1.30 1.52 1.41
Consensus EPS 5.58 5.77 1.33 1.49 1.54
Consensus EPS-High 6.05 7.42 1.57 1.66 1.82
Consensus EPS-Low 5.03 4.37 1.09 1.31 1.22
HERO Hercules Offshore EPS 0.24 0.46 0.05 (0.02) 0.01 0.11 0.14 0.22 0.08 0.03 0.12
Consensus EPS 0.38 0.49 0.02 0.01 0.10
Consensus EPS-High 0.90 0.81 0.08 0.11 0.19
Consensus EPS-Low 0.08 0.05 (0.05) (0.11) (0.04)
NE Noble Drilling EPS 2.89 3.70 3.90 0.59 0.63 0.85 0.82 1.03 0.70 0.91 1.06
Consensus EPS 3.48 3.68 0.67 0.87 0.91
Consensus EPS-High 4.10 4.93 1.07 1.21 1.18
Consensus EPS-Low 3.01 2.37 0.49 0.59 0.71
ORIG Ocean Rig UDW EPS 0.84 2.00 2.80 0.04 0.10 0.30 0.30 0.24 0.47 0.66 0.63
Consensus EPS 1.66 2.21 0.39 0.61 0.54
Consensus EPS-High 2.33 2.80 0.54 0.79 0.71
Consensus EPS-Low 0.83 1.63 0.32 0.39 0.30
PACD Pacific Drilling EPS 0.42 0.95 1.25 0.07 0.10 0.14 0.12 0.10 0.21 0.27 0.38
Consensus EPS 0.78 1.26 0.18 0.23 0.27
Consensus EPS-High 0.95 1.57 0.24 0.30 0.38
Consensus EPS-Low 0.57 0.66 0.12 0.13 0.19
RDC Rowan EPS 1.96 2.60 4.75 0.55 0.57 0.42 0.42 0.28 0.29 0.75 1.28
Consensus EPS 2.27 4.20 0.26 0.63 1.05
Consensus EPS-High 3.10 5.00 0.44 0.79 1.29
Consensus EPS-Low 1.89 3.02 0.09 0.44 0.79
RIG Transocean EPS 4.12 4.70 4.05 0.93 1.08 1.37 0.73 1.43 1.21 1.00 1.06
Consensus EPS 4.33 3.52 1.13 0.88 0.85
Consensus EPS-High 5.64 5.62 1.39 1.59 1.23
Consensus EPS-Low 3.39 2.05 0.89 0.52 0.42
SDRL Seadrill EPS 3.02 3.15 3.10 0.69 0.96 0.60 0.79 0.59 0.60 0.54 0.64
Consensus EPS 3.10 3.64 0.77 0.74 0.82
Consensus EPS-High 4.40 5.83 1.06 0.92 0.98
Consensus EPS-Low 2.52 2.74 0.59 0.54 0.64
Land Drillers
HP Helmrich & Payne EPS 5.67 6.25 6.80 1.40 1.36 1.44 1.47 1.56 1.43 1.61 1.65
Consensus EPS 6.33 7.25 1.63 1.70
Consensus EPS-High 6.45 7.75 1.70 1.75
Consensus EPS-Low 6.20 6.28 1.58 1.61
NBR Nabors EPS 1.02 1.15 1.80 0.46 0.10 0.20 0.26 0.16 0.22 0.36 0.41
Consensus EPS 1.16 1.98 0.23 0.35 0.43
Consensus EPS-High 1.39 2.50 0.26 0.45 0.53
Consensus EPS-Low 0.99 1.56 0.17 0.29 0.34
PTEN Patterson-UTI Energy EPS 1.16 1.40 1.80 0.38 0.28 0.23 0.27 0.24 0.32 0.41 0.43
Consensus EPS 1.42 2.02 0.32 0.42 0.45
Consensus EPS-High 1.52 2.45 0.33 0.47 0.50
Consensus EPS-Low 1.31 1.69 0.28 0.37 0.38
Guggenheim Securities, LLC | 972-638-5502 | guggenheimsecurities.com
Top Ten Reasons to Fear the Jackup Market; Downgrading ESV to Neutral PAGE 29

OFS Valuations & Risks
Source: Thomson Reuters, Company Reports, Guggenheim Securities, LLC
Ticker Valuation Risks
BHI BHI currently trades at approximately 18x our 2014 EPS and 8x our 2014 EBITDA estimates. Our 12-month
price target of $75 is based on 15.0x our 2015 EPS and 6.5x our 2015 EBITDA estimates.
BHI could outperform should its asset turnover improve, w hich in turn w ould push operating margins higher. In 2013, BHI’s PPE
turnover w as 2.5x, vs. 2.7x for HAL and 3.0x for SLB. How ever, given BHI’s higher mix of product sales (i.e., manufacturing vs.
services), w e believe it should have higher PPE turnover than its peers. Should BHI execute on its current “self-help” initiatives
and deliver peer-leading turnover, our estimates w ould likely prove too conservative. Conversely, should the macro environment
encounter any disruptions due to saturation risk late in 2014, our estimates may prove too high.
HAL HAL currently trades at approximately 18x our 2014 EPS and 9x our 2014 EBITDA estimates. Our 12-month
price target of $75 is based on 15.0x our 2015 EPS and 8.0x our 2015 EBITDA estimates.
HAL’s U.S. onshore execution has been excellent, and should the company be able to demonstrate higher EPS grow th into 2015,
our estimates w ould prove to be too low . How ever, should crude saturation risk begin to w eigh on North American fundamentals
in late 2014 due to delays in condensate export approval or w eakness in Brent, our estimates may prove too high.
SLB SLB currently trades at approximately 20x our 2014 EPS and 11x our 2014 EBITDA estimates. Our 12-month
price target of $130 is based on 19.0x our 2015 EPS and 11.5x our 2015 EBITDA estimates.
Much of the investment thesis for SLB rests w ith its ability to grow market share by delivering superior services quality and tool
reliability, and reduce the cost of services delivery. To the extent that execution of this strategy takes longer than w e currently
expect, our estimates—especially margins—could prove too aggressive. Similarly, SLB’s human resources program has long been
a competitive advantage, and to the extent that the company loses key people (particularly to IOCs), its competitive positioning in
the industry could w eaken.
WFT WFT currently trades at approximately 20x our 2014 EPS and 8x our 2014 EBITDA estimates. Our 12-month
price target of $18 is based on 12.5x our forw ard 4 quarter EPS and 6.5x our forw ard 4 quarter EBITDA
estimates.
This year, WFT needs to 1) execute on both its strategic divestitures, 2) high-grade its core portfolio of businesses to focus on
higher margin projects, and 3) deliver +/-$1bn in free cash f low from higher earnings, improved w orking capital turns, and low er
capex. It’s a tall order, but should the company deliver—particularly on the free cash f low generation—its relative valuation should
begin to improve. How ever, w ith its early production facilities contracts in Iraq not likely to be completed until 3Q14, the company
remains susceptible to further cash losses associated w ith this w ork, and potential disappointments w ith respect to cash f low
generation.
CAM CAM currently trades at approximately 18x our 2014 EPS estimate and 10x our 2014 EBITDA estimate. Our
12-month price target of $75 reflects a multiple of 17.0x our forw ard 4 quarter EPS and 10.5x our forw ard 4
quarter EBITDA estimates.
Although the stock has started to act better recently, investor confidence in management’s ability to execute remains low .
Although w e believe the low level of confidence should be view ed as a low bar—and therefore easy to deliver upon—w e
acknow ledge that failure to execute could leave CAM in a value trap zip code.
FTI FTI currently trades at approximately 22x our 2014 EPS and 13x our 2014 EBITDA estimates. Our 12-month
price target of $75 reflects a multiple of 22.0x our 2015 EPS and 13.0x our 2015 EBITDA estimates.
Execution continues to be the biggest risk for FTI. In our view , management needs to deliver on its stated goal of mid-teens
margins, and overruns and delays on the current backlog to get full credit for the 30% y/y increase in revenue/tree in backlog.
NOV NOV currently trades at approximately 14x our 2014 EPS estimate and 8x our 2014 EBITDA estimate. Our 12-
month price target of $100 reflects a multiple of 15.0x our forw ard 4 quarter EPS and 8.5x our forw ard 4
quarter EBITDA estimates.
Many investors still believe that NOV only w orks as a stock w hen backlog is grow ing (i.e., book-to-bill is greater than 1x) and
margins are expanding. Whereas last year, orders w ere strong and margins w eak, the concern for 2014 is the exact opposite:
that orders w ill be w eak even as margins improve modestly q/q. In our view , this conventional approach to the stock is more
consistent w ith a philosophy of momentum investing in oil services—a philosophy that does not apply in the current slow /no
grow th environment. How ever, w ithin a more relevant framew ork of sustainable competitive advantage, low capital intensity, and
high cash return, w e believe NOV screens w ell.
TS TS currently trades at approximately 16x our 2014 EPS and 9x our 2014 EBITDA estimates. Our 12-month
price target of $65 is based on 16.0x our 2015 EPS and 9.5x our 2015 EBITDA estimates.
The deferral of line pipe projects in Brazil has been a large contributor to the decline in w elded pipe margins and volumes for
Tenaris—volumes w hich have dropped to as low as 55% of the previous peak. How ever, our thesis draw s support from our
expectation for line pipe grow th to reaccelerate over the 2015-17 time frame as PBR ramps up gas production nearly 60% over
the next 4 years. How ever, should delays or budgetary limitations slow this production grow th, orders for Brazil may not
accelerate as fast as w e now expect and there may be dow nside risk to our estimates.
Guggenheim Securities, LLC | 972-638-5502 | guggenheimsecurities.com
Top Ten Reasons to Fear the Jackup Market; Downgrading ESV to Neutral PAGE 30
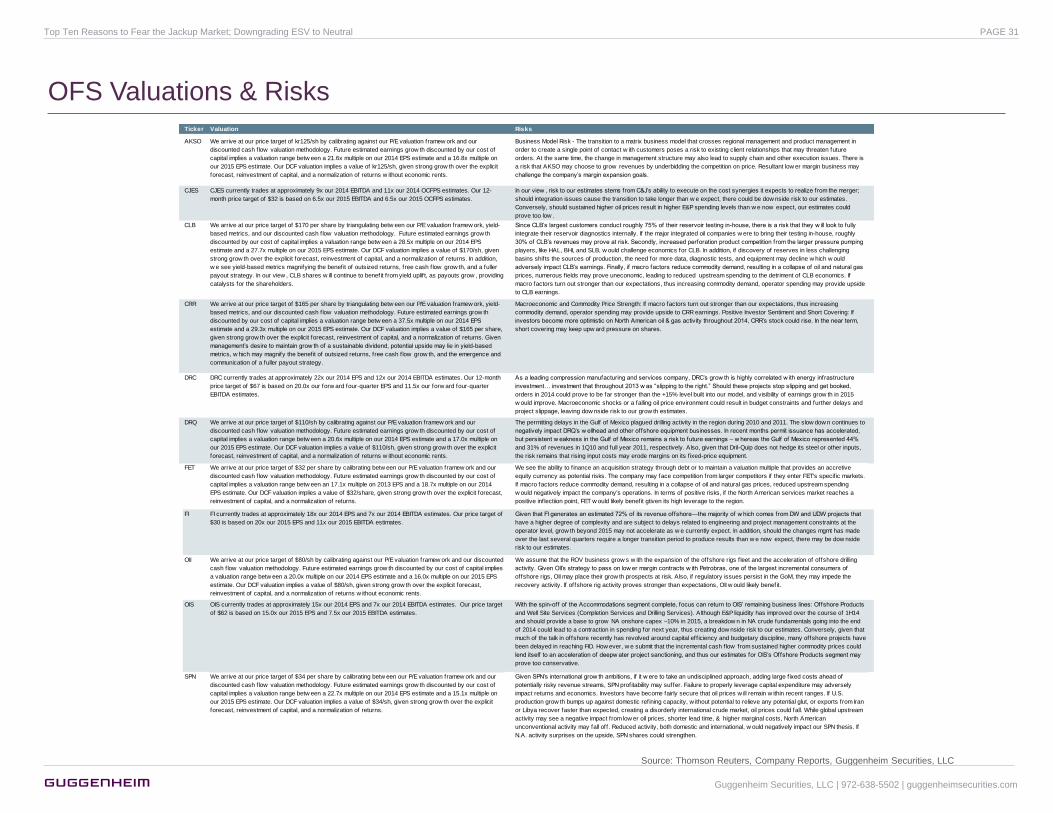
OFS Valuations & Risks
Source: Thomson Reuters, Company Reports, Guggenheim Securities, LLC
Ticker Valuation Risks
AKSO We arrive at our price target of kr125/sh by calibrating against our P/E valuation framew ork and our
discounted cash f low valuation methodology. Future estimated earnings grow th discounted by our cost of
capital implies a valuation range betw een a 21.6x multiple on our 2014 EPS estimate and a 16.8x multiple on
our 2015 EPS estimate. Our DCF valuation implies a value of kr125/sh, given strong grow th over the explicit
forecast, reinvestment of capital, and a normalization of returns w ithout economic rents.
Business Model Risk - The transition to a matrix business model that crosses regional management and product management in
order to create a single point of contact w ith customers poses a risk to existing client relationships that may threaten future
orders. At the same time, the change in management structure may also lead to supply chain and other execution issues. There is
a risk that AKSO may choose to grow revenues by underbidding the competition on price. Resultant low er margin business may
challenge the company’s margin expansion goals.
CJES CJES currently trades at approximately 9x our 2014 EBITDA and 11x our 2014 OCFPS estimates. Our 12-
month price target of $32 is based on 6.5x our 2015 EBITDA and 6.5x our 2015 OCFPS estimates.
In our view , risk to our estimates stems from C&J’s ability to execute on the cost synergies it expects to realize from the merger;
should integration issues cause the transition to take longer than w e expect, there could be dow nside risk to our estimates.
Conversely, should sustained higher oil prices result in higher E&P spending levels than w e now expect, our estimates could
prove too low .
CLB We arrive at our price target of $170 per share by triangulating betw een our P/E valuation framew ork, yield-
based metrics, and our discounted cash f low valuation methodology. Future estimated earnings grow th
discounted by our cost of capital implies a valuation range betw een a 28.5x multiple on our 2014 EPS
estimate and a 27.7x multiple on our 2015 EPS estimate. Our DCF valuation implies a value of $170/sh, given
strong grow th over the explicit forecast, reinvestment of capital, and a normalization of returns. In addition,
w e see yield-based metrics magnifying the benefit of outsized returns, free cash f low grow th, and a fuller
payout strategy. In our view , CLB shares w ill continue to benefit from yield uplif t, as payouts grow , providing
catalysts for the shareholders.
Since CLB’s largest customers conduct roughly 75% of their reservoir testing in-house, there is a risk that they w ill look to fully
integrate their reservoir diagnostics internally. If the major integrated oil companies w ere to bring their testing in-house, roughly
30% of CLB’s revenues may prove at risk. Secondly, increased perforation product competition from the larger pressure pumping
players, like HAL, BHI, and SLB, w ould challenge economics for CLB. In addition, if discovery of reserves in less challenging
basins shifts the sources of production, the need for more data, diagnostic tests, and equipment may decline w hich w ould
adversely impact CLB’s earnings. Finally, if macro factors reduce commodity demand, resulting in a collapse of oil and natural gas
prices, numerous f ields may prove uneconomic, leading to reduced upstream spending to the detriment of CLB economics. If
macro factors turn out stronger than our expectations, thus increasing commodity demand, operator spending may provide upside
to CLB earnings.
CRR We arrive at our price target of $165 per share by triangulating betw een our P/E valuation framew ork, yield-
based metrics, and our discounted cash f low valuation methodology. Future estimated earnings grow th
discounted by our cost of capital implies a valuation range betw een a 37.5x multiple on our 2014 EPS
estimate and a 29.3x multiple on our 2015 EPS estimate. Our DCF valuation implies a value of $165 per share,
given strong grow th over the explicit forecast, reinvestment of capital, and a normalization of returns. Given
management’s desire to maintain grow th of a sustainable dividend, potential upside may lie in yield-based
metrics, w hich may magnify the benefit of outsized returns, free cash f low grow th, and the emergence and
communication of a fuller payout strategy.
Macroeconomic and Commodity Price Strength: If macro factors turn out stronger than our expectations, thus increasing
commodity demand, operator spending may provide upside to CRR earnings. Positive Investor Sentiment and Short Covering: If
investors become more optimistic on North American oil & gas activity throughout 2014, CRR’s stock could rise. In the near term,
short covering may keep upw ard pressure on shares.
DRC DRC currently trades at approximately 22x our 2014 EPS and 12x our 2014 EBITDA estimates. Our 12-month
price target of $67 is based on 20.0x our forw ard four-quarter EPS and 11.5x our forw ard four-quarter
EBITDA estimates.
As a leading compression manufacturing and services company, DRC’s grow th is highly correlated w ith energy infrastructure
investment… investment that throughout 2013 w as “slipping to the right.” Should these projects stop slipping and get booked,
orders in 2014 could prove to be far stronger than the +15% level built into our model, and visibility of earnings grow th in 2015
w ould improve. Macroeconomic shocks or a falling oil price environment could result in budget constraints and further delays and
project slippage, leaving dow nside risk to our grow th estimates.
DRQ We arrive at our price target of $110/sh by calibrating against our P/E valuation framew ork and our
discounted cash f low valuation methodology. Future estimated earnings grow th discounted by our cost of
capital implies a valuation range betw een a 20.6x multiple on our 2014 EPS estimate and a 17.0x multiple on
our 2015 EPS estimate. Our DCF valuation implies a value of $110/sh, given strong grow th over the explicit
forecast, reinvestment of capital, and a normalization of returns w ithout economic rents.
The permitting delays in the Gulf of Mexico plagued drilling activity in the region during 2010 and 2011. The slow dow n continues to
negatively impact DRQ’s w ellhead and other offshore equipment businesses. In recent months permit issuance has accelerated,
but persistent w eakness in the Gulf of Mexico remains a risk to future earnings – w hereas the Gulf of Mexico represented 44%
and 31% of revenues in 1Q10 and full year 2011, respectively. Also, given that Dril-Quip does not hedge its steel or other inputs,
the risk remains that rising input costs may erode margins on its f ixed-price equipment.
FET We arrive at our price target of $32 per share by calibrating betw een our P/E valuation framew ork and our
discounted cash f low valuation methodology. Future estimated earnings grow th discounted by our cost of
capital implies a valuation range betw een an 17.1x multiple on 2013 EPS and a 18.7x multiple on our 2014
EPS estimate. Our DCF valuation implies a value of $32/share, given strong grow th over the explicit forecast,
reinvestment of capital, and a normalization of returns.
We see the ability to f inance an acquisition strategy through debt or to maintain a valuation multiple that provides an accretive
equity currency as potential risks. The company may face competition from larger competitors if they enter FET's specif ic markets.
If macro factors reduce commodity demand, resulting in a collapse of oil and natural gas prices, reduced upstream spending
w ould negatively impact the company's operations. In terms of positive risks, if the North American services market reaches a
positive inflectiion point, FET w ould likely benefit gtiven its high leverage to the region.
FI FI currently trades at approximately 18x our 2014 EPS and 7x our 2014 EBITDA estimates. Our price target of
$30 is based on 20x our 2015 EPS and 11x our 2015 EBITDA estimates.
Given that FI generates an estimated 72% of its revenue offshore—the majority of w hich comes from DW and UDW projects that
have a higher degree of complexity and are subject to delays related to engineering and project management constraints at the
operator level, grow th beyond 2015 may not accelerate as w e currently expect. In addition, should the changes mgmt has made
over the last several quarters require a longer transition period to produce results than w e now expect, there may be dow nside
risk to our estimates.
OII We arrive at our price target of $80/sh by calibrating against our P/E valuation framew ork and our discounted
cash f low valuation methodology. Future estimated earnings grow th discounted by our cost of capital implies
a valuation range betw een a 20.0x multiple on our 2014 EPS estimate and a 16.0x multiple on our 2015 EPS
estimate. Our DCF valuation implies a value of $80/sh, given strong grow th over the explicit forecast,
reinvestment of capital, and a normalization of returns w ithout economic rents.
We assume that the ROV business grow s w ith the expansion of the offshore rigs f leet and the acceleration of offshore drilling
activity. Given OII’s strategy to pass on low er margin contracts w ith Petrobras, one of the largest incremental consumers of
offshore rigs, OII may place their grow th prospects at risk. Also, if regulatory issues persist in the GoM, they may impede the
recovery activity. If offshore rig activity proves stronger than expectations, OII w ould likely benefit.
OIS OIS currently trades at approximately 15x our 2014 EPS and 7x our 2014 EBITDA estimates. Our price target
of $62 is based on 15.0x our 2015 EPS and 7.5x our 2015 EBITDA estimates.
With the spin-off of the Accommodations segment complete, focus can return to OIS’ remaining business lines: Offshore Products
and Well Site Services (Completion Services and Drilling Services). Although E&P liquidity has improved over the course of 1H14
and should provide a base to grow NA onshore capex ~10% in 2015, a breakdow n in NA crude fundamentals going into the end
of 2014 could lead to a contraction in spending for next year, thus creating dow nside risk to our estimates. Conversely, given that
much of the talk in offshore recently has revolved around capital eff iciency and budgetary discipline, many offshore projects have
been delayed in reaching FID. How ever, w e submit that the incremental cash f low from sustained higher commodity prices could
lend itself to an acceleration of deepw ater project sanctioning, and thus our estimates for OIS’s Offshore Products segment may
prove too conservative.
SPN We arrive at our price target of $34 per share by calibrating betw een our P/E valuation framew ork and our
discounted cash f low valuation methodology. Future estimated earnings grow th discounted by our cost of
capital implies a valuation range betw een a 22.7x multiple on our 2014 EPS estimate and a 15.1x multiple on
our 2015 EPS estimate. Our DCF valuation implies a value of $34/sh, given strong grow th over the explicit
forecast, reinvestment of capital, and a normalization of returns.
Given SPN’s international grow th ambitions, if it w ere to take an undisciplined approach, adding large f ixed costs ahead of
potentially risky revenue streams, SPN profitability may suffer. Failure to properly leverage capital expenditure may adversely
impact returns and economics. Investors have become fairly secure that oil prices w ill remain w ithin recent ranges. If U.S.
production grow th bumps up against domestic refining capacity, w ithout potential to relieve any potential glut, or exports from Iran
or Libya recover faster than expected, creating a disorderly international crude market, oil prices could fall. While global upstream
activity may see a negative impact from low er oil prices, shorter lead time, & higher marginal costs, North American
unconventional activity may fall off. Reduced activity, both domestic and international, w ould negatively impact our SPN thesis. If
N.A. activity surprises on the upside, SPN shares could strengthen.
Guggenheim Securities, LLC | 972-638-5502 | guggenheimsecurities.com
Top Ten Reasons to Fear the Jackup Market; Downgrading ESV to Neutral PAGE 31
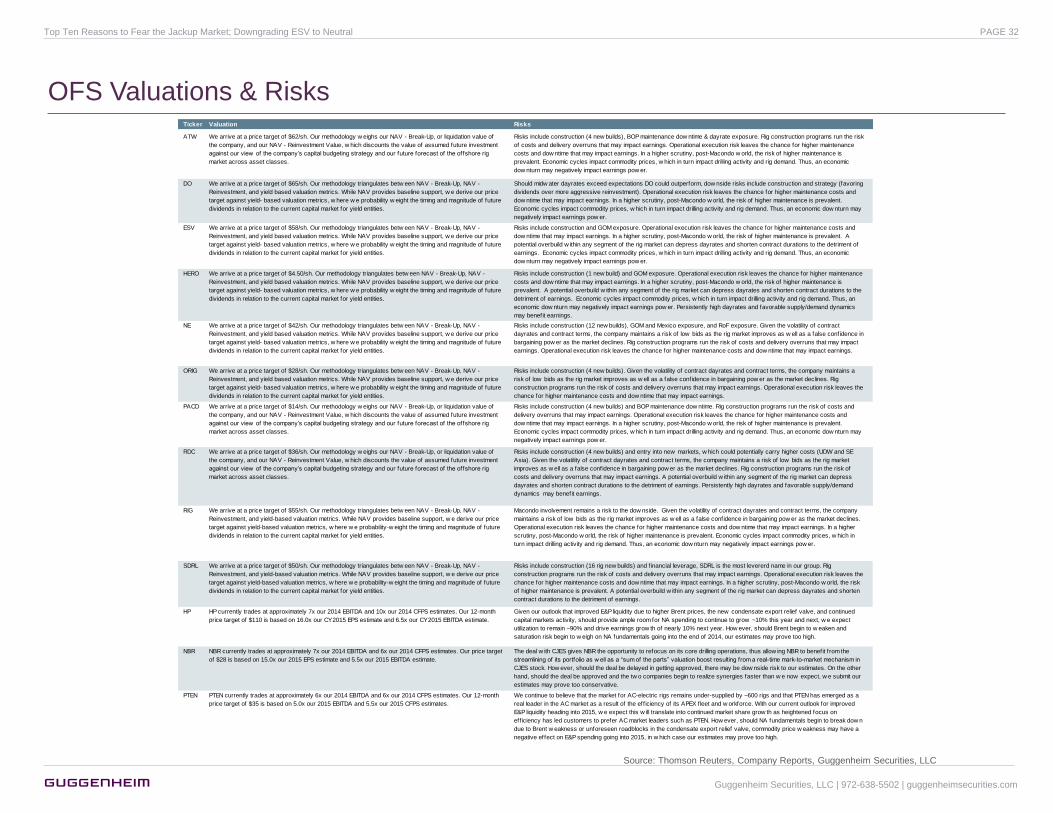
OFS Valuations & Risks
Source: Thomson Reuters, Company Reports, Guggenheim Securities, LLC
Ticker Valuation Risks
ATW We arrive at a price target of $62/sh. Our methodology w eighs our NAV - Break-Up, or liquidation value of
the company, and our NAV - Reinvestment Value, w hich discounts the value of assumed future investment
against our view of the company’s capital budgeting strategy and our future forecast of the offshore rig
market across asset classes.
Risks include construction (4 new builds), BOP maintenance dow ntime & dayrate exposure. Rig construction programs run the risk
of costs and delivery overruns that may impact earnings. Operational execution risk leaves the chance for higher maintenance
costs and dow ntime that may impact earnings. In a higher scrutiny, post-Macondo w orld, the risk of higher maintenance is
prevalent. Economic cycles impact commodity prices, w hich in turn impact drilling activity and rig demand. Thus, an economic
dow nturn may negatively impact earnings pow er.
DO We arrive at a price target of $65/sh. Our methodology triangulates betw een NAV - Break-Up, NAV -
Reinvestment, and yield based valuation metrics. While NAV provides baseline support, w e derive our price
target against yield- based valuation metrics, w here w e probability w eight the timing and magnitude of future
dividends in relation to the current capital market for yield entities.
Should midw ater dayrates exceed expectations DO could outperform, dow nside risks include construction and strategy (favoring
dividends over more aggressive reinvestment). Operational execution risk leaves the chance for higher maintenance costs and
dow ntime that may impact earnings. In a higher scrutiny, post-Macondo w orld, the risk of higher maintenance is prevalent.
Economic cycles impact commodity prices, w hich in turn impact drilling activity and rig demand. Thus, an economic dow nturn may
negatively impact earnings pow er.
ESV We arrive at a price target of $58/sh. Our methodology triangulates betw een NAV - Break-Up, NAV -
Reinvestment, and yield based valuation metrics. While NAV provides baseline support, w e derive our price
target against yield- based valuation metrics, w here w e probability w eight the timing and magnitude of future
dividends in relation to the current capital market for yield entities.
Risks include construction and GOM exposure. Operational execution risk leaves the chance for higher maintenance costs and
dow ntime that may impact earnings. In a higher scrutiny, post-Macondo w orld, the risk of higher maintenance is prevalent. A
potential overbuild w ithin any segment of the rig market can depress dayrates and shorten contract durations to the detriment of
earnings. Economic cycles impact commodity prices, w hich in turn impact drilling activity and rig demand. Thus, an economic
dow nturn may negatively impact earnings pow er.
HERO We arrive at a price target of $4.50/sh. Our methodology triangulates betw een NAV - Break-Up, NAV -
Reinvestment, and yield based valuation metrics. While NAV provides baseline support, w e derive our price
target against yield- based valuation metrics, w here w e probability w eight the timing and magnitude of future
dividends in relation to the current capital market for yield entities.
Risks include construction (1 new build) and GOM exposure. Operational execution risk leaves the chance for higher maintenance
costs and dow ntime that may impact earnings. In a higher scrutiny, post-Macondo w orld, the risk of higher maintenance is
prevalent. A potential overbuild w ithin any segment of the rig market can depress dayrates and shorten contract durations to the
detriment of earnings. Economic cycles impact commodity prices, w hich in turn impact drilling activity and rig demand. Thus, an
economic dow nturn may negatively impact earnings pow er. Persistently high dayrates and favorable supply/demand dynamics
may benefit earnings.
NE We arrive at a price target of $42/sh. Our methodology triangulates betw een NAV - Break-Up, NAV -
Reinvestment, and yield based valuation metrics. While NAV provides baseline support, w e derive our price
target against yield- based valuation metrics, w here w e probability w eight the timing and magnitude of future
dividends in relation to the current capital market for yield entities.
Risks include construction (12 new builds), GOM and Mexico exposure, and RoF exposure. Given the volatility of contract
dayrates and contract terms, the company maintains a risk of low bids as the rig market improves as w ell as a false confidence in
bargaining pow er as the market declines. Rig construction programs run the risk of costs and delivery overruns that may impact
earnings. Operational execution risk leaves the chance for higher maintenance costs and dow ntime that may impact earnings.
ORIG We arrive at a price target of $28/sh. Our methodology triangulates betw een NAV - Break-Up, NAV -
Reinvestment, and yield based valuation metrics. While NAV provides baseline support, w e derive our price
target against yield- based valuation metrics, w here w e probability w eight the timing and magnitude of future
dividends in relation to the current capital market for yield entities.
Risks include construction (4 new builds). Given the volatility of contract dayrates and contract terms, the company maintains a
risk of low bids as the rig market improves as w ell as a false confidence in bargaining pow er as the market declines. Rig
construction programs run the risk of costs and delivery overruns that may impact earnings. Operational execution risk leaves the
chance for higher maintenance costs and dow ntime that may impact earnings.
PACD We arrive at a price target of $14/sh. Our methodology w eighs our NAV - Break-Up, or liquidation value of
the company, and our NAV - Reinvestment Value, w hich discounts the value of assumed future investment
against our view of the company’s capital budgeting strategy and our future forecast of the offshore rig
market across asset classes.
Risks include construction (4 new builds) and BOP maintenance dow ntime. Rig construction programs run the risk of costs and
delivery overruns that may impact earnings. Operational execution risk leaves the chance for higher maintenance costs and
dow ntime that may impact earnings. In a higher scrutiny, post-Macondo w orld, the risk of higher maintenance is prevalent.
Economic cycles impact commodity prices, w hich in turn impact drilling activity and rig demand. Thus, an economic dow nturn may
negatively impact earnings pow er.
RDC We arrive at a price target of $36/sh. Our methodology w eighs our NAV - Break-Up, or liquidation value of
the company, and our NAV - Reinvestment Value, w hich discounts the value of assumed future investment
against our view of the company’s capital budgeting strategy and our future forecast of the offshore rig
market across asset classes.
Risks include construction (4 new builds) and entry into new markets, w hich could potentially carry higher costs (UDW and SE
Asia). Given the volatility of contract dayrates and contract terms, the company maintains a risk of low bids as the rig market
improves as w ell as a false confidence in bargaining pow er as the market declines. Rig construction programs run the risk of
costs and delivery overruns that may impact earnings. A potential overbuild w ithin any segment of the rig market can depress
dayrates and shorten contract durations to the detriment of earnings. Persistently high dayrates and favorable supply/demand
dynamics may benefit earnings.
RIG We arrive at a price target of $55/sh. Our methodology triangulates betw een NAV - Break-Up, NAV -
Reinvestment, and yield-based valuation metrics. While NAV provides baseline support, w e derive our price
target against yield-based valuation metrics, w here w e probability-w eight the timing and magnitude of future
dividends in relation to the current capital market for yield entities.
Macondo involvement remains a risk to the dow nside. Given the volatility of contract dayrates and contract terms, the company
maintains a risk of low bids as the rig market improves as w ell as a false confidence in bargaining pow er as the market declines.
Operational execution risk leaves the chance for higher maintenance costs and dow ntime that may impact earnings. In a higher
scrutiny, post-Macondo w orld, the risk of higher maintenance is prevalent. Economic cycles impact commodity prices, w hich in
turn impact drilling activity and rig demand. Thus, an economic dow nturn may negatively impact earnings pow er.
SDRL We arrive at a price target of $50/sh. Our methodology triangulates betw een NAV - Break-Up, NAV -
Reinvestment, and yield-based valuation metrics. While NAV provides baseline support, w e derive our price
target against yield-based valuation metrics, w here w e probability-w eight the timing and magnitude of future
dividends in relation to the current capital market for yield entities.
Risks include construction (16 rig new builds) and f inancial leverage, SDRL is the most levererd name in our group. Rig
construction programs run the risk of costs and delivery overruns that may impact earnings. Operational execution risk leaves the
chance for higher maintenance costs and dow ntime that may impact earnings. In a higher scrutiny, post-Macondo w orld, the risk
of higher maintenance is prevalent. A potential overbuild w ithin any segment of the rig market can depress dayrates and shorten
contract durations to the detriment of earnings.
HP HP currently trades at approximately 7x our 2014 EBITDA and 10x our 2014 CFPS estimates. Our 12-month
price target of $110 is based on 16.0x our CY2015 EPS estimate and 6.5x our CY2015 EBITDA estimate.
Given our outlook that improved E&P liquidity due to higher Brent prices, the new condensate export relief valve, and continued
capital markets activity, should provide ample room for NA spending to continue to grow ~10% this year and next, w e expect
utilization to remain ~90% and drive earnings grow th of nearly 10% next year. How ever, should Brent begin to w eaken and
saturation risk begin to w eigh on NA fundamentals going into the end of 2014, our estimates may prove too high.
NBR NBR currently trades at approximately 7x our 2014 EBITDA and 6x our 2014 CFPS estimates. Our price target
of $28 is based on 15.0x our 2015 EPS estimate and 5.5x our 2015 EBITDA estimate.
The deal w ith CJES gives NBR the opportunity to refocus on its core drilling operations, thus allow ing NBR to benefit from the
streamlining of its portfolio as w ell as a “sum of the parts” valuation boost resulting from a real-time mark-to-market mechanism in
CJES stock. How ever, should the deal be delayed in getting approved, there may be dow nside risk to our estimates. On the other
hand, should the deal be approved and the tw o companies begin to realize synergies faster than w e now expect, w e submit our
estimates may prove too conservative.
PTEN PTEN currently trades at approximately 6x our 2014 EBITDA and 6x our 2014 CFPS estimates. Our 12-month
price target of $35 is based on 5.0x our 2015 EBITDA and 5.5x our 2015 CFPS estimates.
We continue to believe that the market for AC-electric rigs remains under-supplied by ~600 rigs and that PTEN has emerged as a
real leader in the AC market as a result of the eff iciency of its APEX fleet and w orkforce. With our current outlook for improved
E&P liquidity heading into 2015, w e expect this w ill translate into continued market share grow th as heightened focus on
eff iciency has led customers to prefer AC market leaders such as PTEN. How ever, should NA fundamentals begin to break dow n
due to Brent w eakness or unforeseen roadblocks in the condensate export relief valve, commodity price w eakness may have a
negative effect on E&P spending going into 2015, in w hich case our estimates may prove too high.
Guggenheim Securities, LLC | 972-638-5502 | guggenheimsecurities.com
Top Ten Reasons to Fear the Jackup Market; Downgrading ESV to Neutral PAGE 32
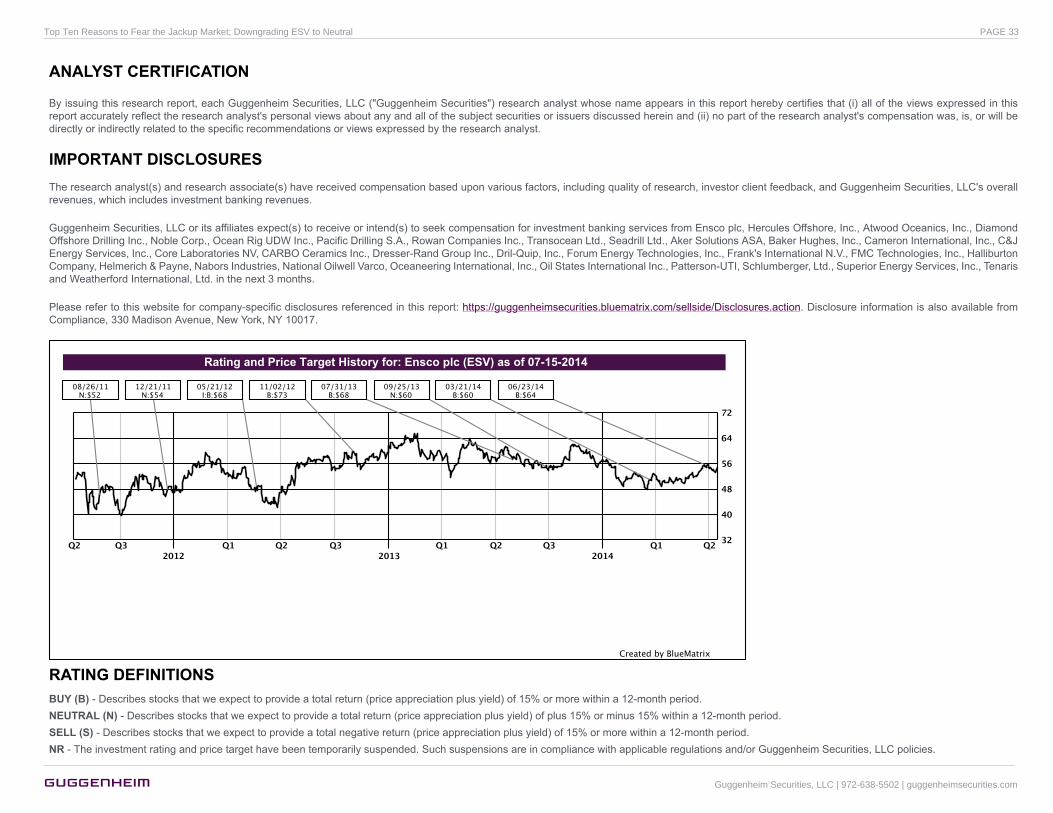
ANALYST CERTIFICATION
By issuing this research report, each Guggenheim Securities, LLC ("Guggenheim Securities") research analyst whose name appears in this report hereby certifies that (i) all of the views expressed in thisreport accurately reflect the research analyst's personal views about any and all of the subject securities or issuers discussed herein and (ii) no part of the research analyst's compensation was, is, or will bedirectly or indirectly related to the specific recommendations or views expressed by the research analyst.
IMPORTANT DISCLOSURESThe research analyst(s) and research associate(s) have received compensation based upon various factors, including quality of research, investor client feedback, and Guggenheim Securities, LLC's overallrevenues, which includes investment banking revenues.
Guggenheim Securities, LLC or its affiliates expect(s) to receive or intend(s) to seek compensation for investment banking services from Ensco plc, Hercules Offshore, Inc., Atwood Oceanics, Inc., DiamondOffshore Drilling Inc., Noble Corp., Ocean Rig UDW Inc., Pacific Drilling S.A., Rowan Companies Inc., Transocean Ltd., Seadrill Ltd., Aker Solutions ASA, Baker Hughes, Inc., Cameron International, Inc., C&JEnergy Services, Inc., Core Laboratories NV, CARBO Ceramics Inc., Dresser-Rand Group Inc., Dril-Quip, Inc., Forum Energy Technologies, Inc., Frank's International N.V., FMC Technologies, Inc., HalliburtonCompany, Helmerich & Payne, Nabors Industries, National Oilwell Varco, Oceaneering International, Inc., Oil States International Inc., Patterson-UTI, Schlumberger, Ltd., Superior Energy Services, Inc., Tenarisand Weatherford International, Ltd. in the next 3 months.
Please refer to this website for company-specific disclosures referenced in this report: https://guggenheimsecurities.bluematrix.com/sellside/Disclosures.action. Disclosure information is also available fromCompliance, 330 Madison Avenue, New York, NY 10017.
RATING DEFINITIONSBUY (B) - Describes stocks that we expect to provide a total return (price appreciation plus yield) of 15% or more within a 12-month period.NEUTRAL (N) - Describes stocks that we expect to provide a total return (price appreciation plus yield) of plus 15% or minus 15% within a 12-month period.SELL (S) - Describes stocks that we expect to provide a total negative return (price appreciation plus yield) of 15% or more within a 12-month period.NR - The investment rating and price target have been temporarily suspended. Such suspensions are in compliance with applicable regulations and/or Guggenheim Securities, LLC policies.
Guggenheim Securities, LLC | 972-638-5502 | guggenheimsecurities.com
Top Ten Reasons to Fear the Jackup Market; Downgrading ESV to Neutral PAGE 33
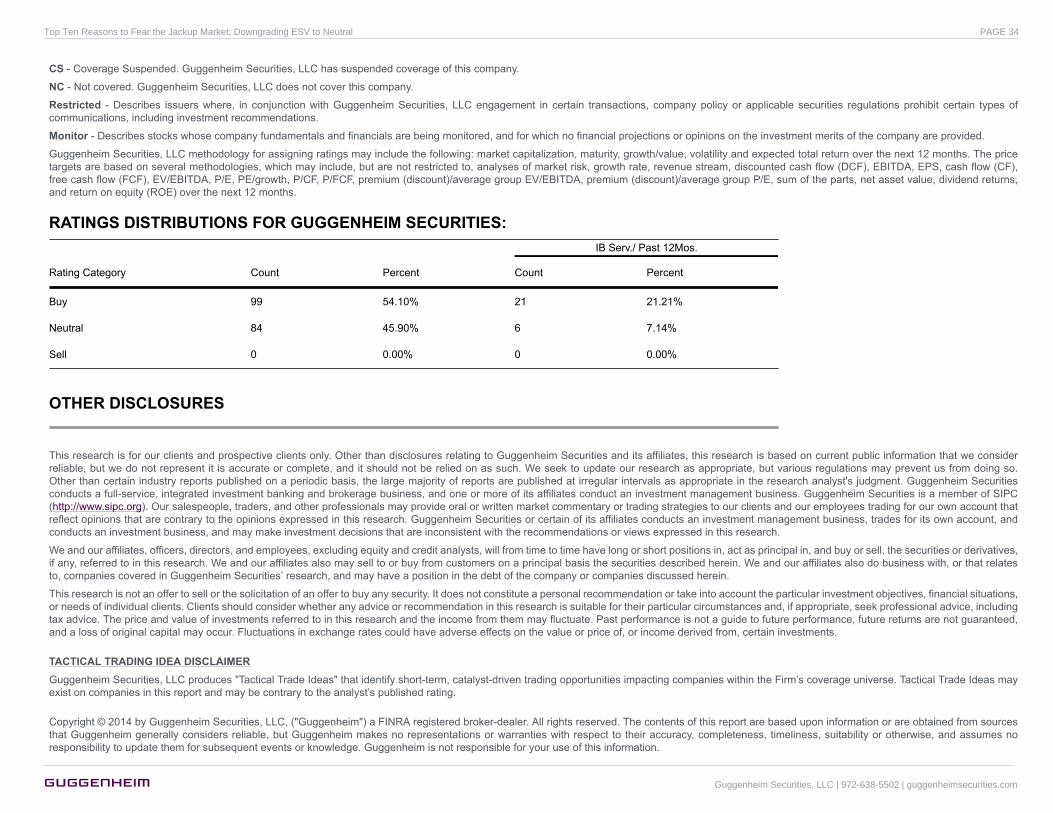
CS - Coverage Suspended. Guggenheim Securities, LLC has suspended coverage of this company.
NC - Not covered. Guggenheim Securities, LLC does not cover this company.
Restricted - Describes issuers where, in conjunction with Guggenheim Securities, LLC engagement in certain transactions, company policy or applicable securities regulations prohibit certain types ofcommunications, including investment recommendations.
Monitor - Describes stocks whose company fundamentals and financials are being monitored, and for which no financial projections or opinions on the investment merits of the company are provided.
Guggenheim Securities, LLC methodology for assigning ratings may include the following: market capitalization, maturity, growth/value, volatility and expected total return over the next 12 months. The pricetargets are based on several methodologies, which may include, but are not restricted to, analyses of market risk, growth rate, revenue stream, discounted cash flow (DCF), EBITDA, EPS, cash flow (CF),free cash flow (FCF), EV/EBITDA, P/E, PE/growth, P/CF, P/FCF, premium (discount)/average group EV/EBITDA, premium (discount)/average group P/E, sum of the parts, net asset value, dividend returns,and return on equity (ROE) over the next 12 months.
RATINGS DISTRIBUTIONS FOR GUGGENHEIM SECURITIES:IB Serv./ Past 12Mos.
Rating Category Count Percent Count Percent
Buy 99 54.10% 21 21.21%
Neutral 84 45.90% 6 7.14%
Sell 0 0.00% 0 0.00%
OTHER DISCLOSURES
This research is for our clients and prospective clients only. Other than disclosures relating to Guggenheim Securities and its affiliates, this research is based on current public information that we considerreliable, but we do not represent it is accurate or complete, and it should not be relied on as such. We seek to update our research as appropriate, but various regulations may prevent us from doing so.Other than certain industry reports published on a periodic basis, the large majority of reports are published at irregular intervals as appropriate in the research analyst's judgment. Guggenheim Securitiesconducts a full-service, integrated investment banking and brokerage business, and one or more of its affiliates conduct an investment management business. Guggenheim Securities is a member of SIPC(http://www.sipc.org). Our salespeople, traders, and other professionals may provide oral or written market commentary or trading strategies to our clients and our employees trading for our own account thatreflect opinions that are contrary to the opinions expressed in this research. Guggenheim Securities or certain of its affiliates conducts an investment management business, trades for its own account, andconducts an investment business, and may make investment decisions that are inconsistent with the recommendations or views expressed in this research.
We and our affiliates, officers, directors, and employees, excluding equity and credit analysts, will from time to time have long or short positions in, act as principal in, and buy or sell, the securities or derivatives,if any, referred to in this research. We and our affiliates also may sell to or buy from customers on a principal basis the securities described herein. We and our affiliates also do business with, or that relatesto, companies covered in Guggenheim Securities’ research, and may have a position in the debt of the company or companies discussed herein.
This research is not an offer to sell or the solicitation of an offer to buy any security. It does not constitute a personal recommendation or take into account the particular investment objectives, financial situations,or needs of individual clients. Clients should consider whether any advice or recommendation in this research is suitable for their particular circumstances and, if appropriate, seek professional advice, includingtax advice. The price and value of investments referred to in this research and the income from them may fluctuate. Past performance is not a guide to future performance, future returns are not guaranteed,and a loss of original capital may occur. Fluctuations in exchange rates could have adverse effects on the value or price of, or income derived from, certain investments.
TACTICAL TRADING IDEA DISCLAIMERGuggenheim Securities, LLC produces "Tactical Trade Ideas" that identify short-term, catalyst-driven trading opportunities impacting companies within the Firm’s coverage universe. Tactical Trade Ideas mayexist on companies in this report and may be contrary to the analyst’s published rating.
Copyright © 2014 by Guggenheim Securities, LLC, ("Guggenheim") a FINRA registered broker-dealer. All rights reserved. The contents of this report are based upon information or are obtained from sourcesthat Guggenheim generally considers reliable, but Guggenheim makes no representations or warranties with respect to their accuracy, completeness, timeliness, suitability or otherwise, and assumes noresponsibility to update them for subsequent events or knowledge. Guggenheim is not responsible for your use of this information.
Guggenheim Securities, LLC | 972-638-5502 | guggenheimsecurities.com
Top Ten Reasons to Fear the Jackup Market; Downgrading ESV to Neutral PAGE 34