2013 treatment methods for leachate impacted by …scswana.org/resources/documents/2013 treatment...
TRANSCRIPT
1
Presented by:
Scott L. Brown, PE
Ivan A. Cooper, PE, BCEE
Civil & Environmental Consultants
Charlotte, NC
Treatment Methods for Leachate Impacted by Landfill Gas Well Pumping
May 8, 2013
2013 SC SWANA Spring Conference
Overview
Leachate Concerns
Comparative Trends in leachate quality
Technologies
Passive
Active
Case Examples
Cost implications
Structured Decision Process
2
Ammonia/Nitrogen
Ammonia – aquatic toxicity issue
High nitrogen is a nutrient issue & Nitrate – drinking water issue
O2 Demand at POTW
Total Dissolved Solids (TDS)
Regulatory - direct discharge, or for some reuse strategies
Can be a toxicity issue for surface discharge (acute/chronic)
High TDS impacts biological treatment
Corrosion
COD/BOD
Potential surface water discharge issue
Basis for most pretreatment permit surcharges, Oxygen Demand
VOC; SVOC
Emerging Compounds – “Microconstituents”
Metals - Mercury is recent example – very low criteria (1.3 ng/L)
Pharmaceuticals and Personal Care Products/Endocrine Disruptors
Leachate Problem Constituents
Causes for Leachate Variability
Leachate Characteristics Vary in Volume & Concentration
Impacts of Landfill Gas Well Pumping/ Condensate Management
Causes
Vertical Conduit
Wells in use
Active v. legacy
Balancing
Landfill Age
Ambient Temperature
Rainfall
Refuse Permeability
Refuse Depth
Refuse Temperature
Refuse Composition
MSW/C&D/Industrial
3
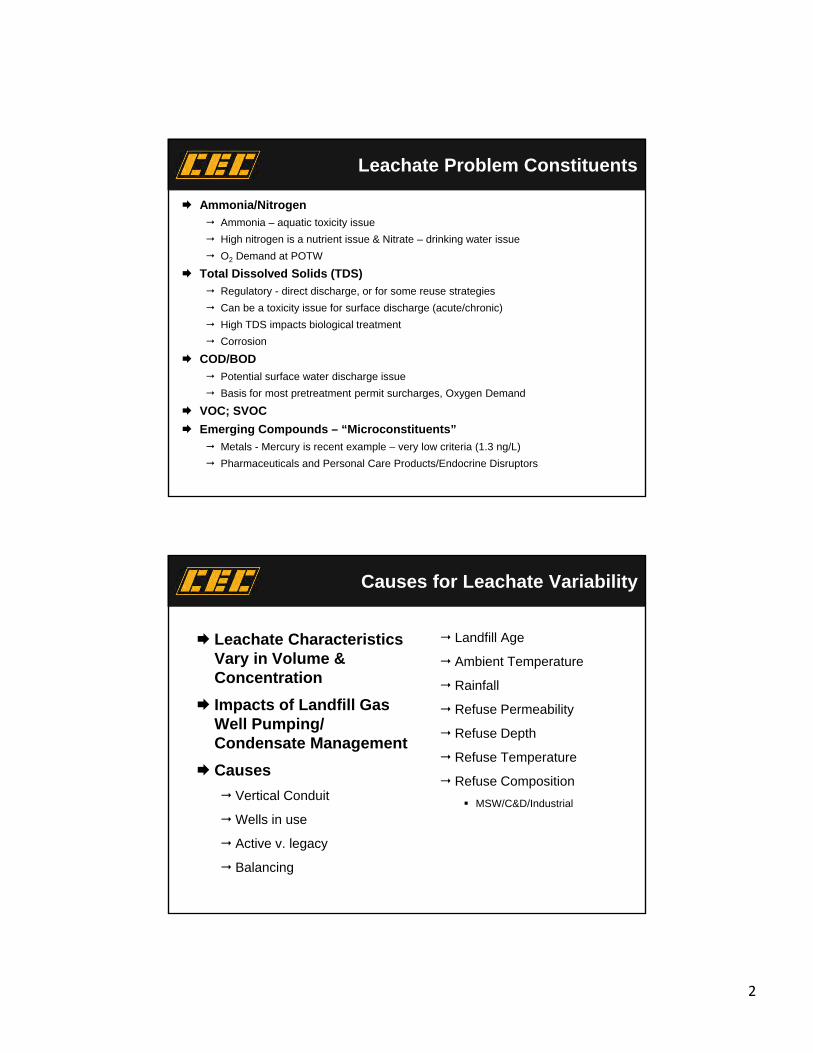
Leachate CharacteristicsCharacteristics Leachate Alone
mg/l
With Gas Well Pumping/Condensate
mg/l
BOD 100 - 500 1,000 – 5,000++
COD 250 – 1,000 750 – 15,000++
Ammonia 100 - 250 500 – 12,000++
Metals 200 – 500% Higher
VOCs 200 – 500% Higher
TDS 500 – 4,000 3,000 – 20,000++
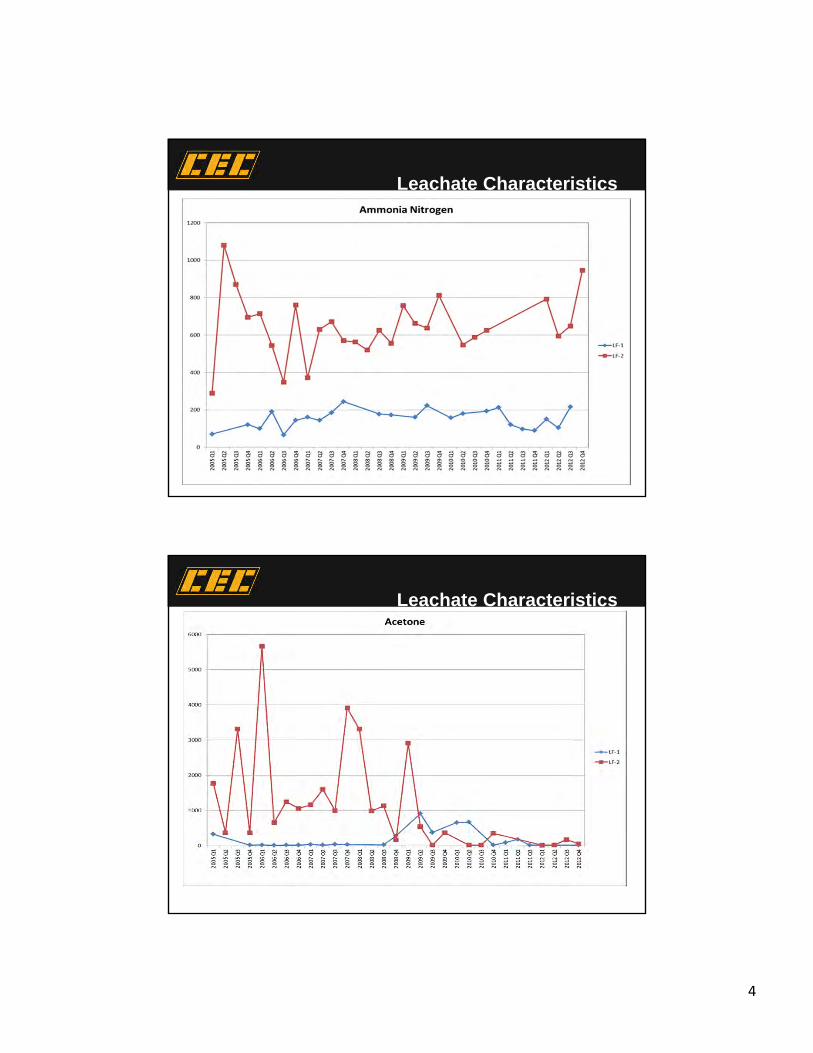
Leachate Characteristics
0
100
200
300
400
500
600
700
800
900
1000
Oct‐10
Nov‐10
Dec‐10
Jan‐11
Feb‐11
Mar‐11
Apr‐11
May‐11
Jun‐11
Jul‐11
Aug‐11
Sep‐11
Oct‐11
Nov‐11
Dec‐11
Jan‐12
Feb‐12
Mar‐12
Apr‐12
May‐12
Jun‐12
Jul‐12
Aug‐12
Sep‐12
Oct‐12
Nov‐12
Dec‐12
Jan‐13
Feb‐13
mg/L
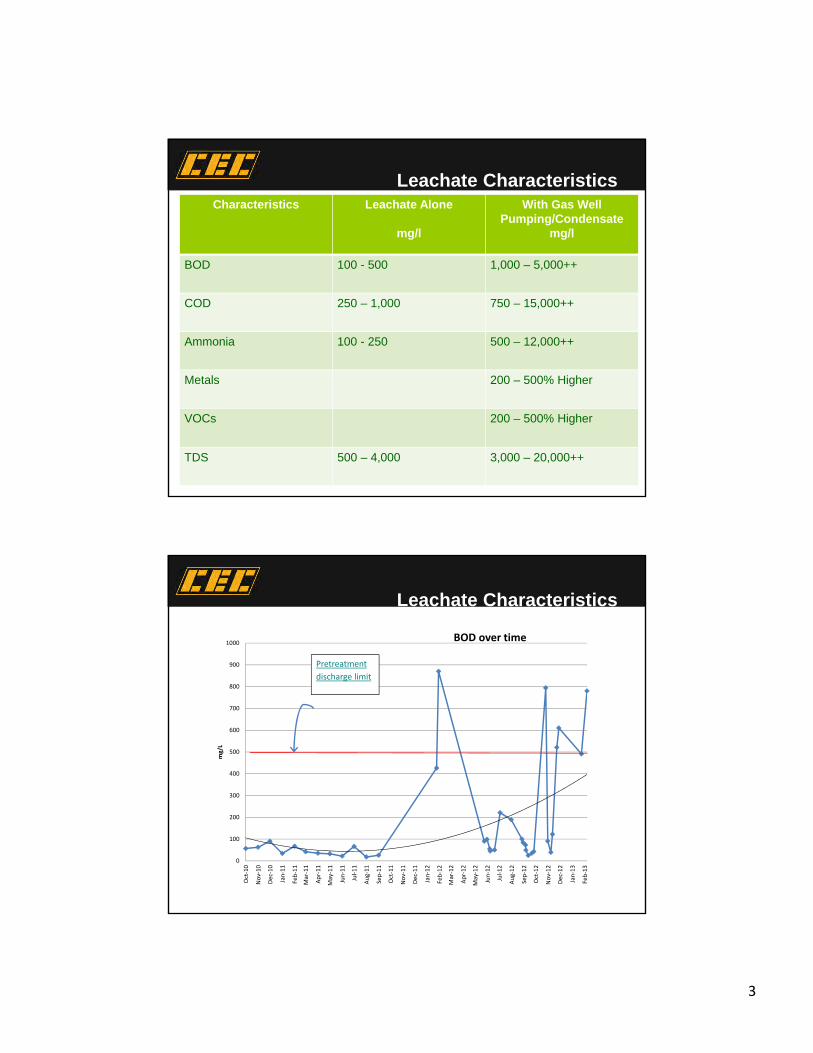
BOD over time
Pretreatment
discharge limit
4
Leachate Characteristics
Pretreatment
discharge limit
Leachate Characteristics

5
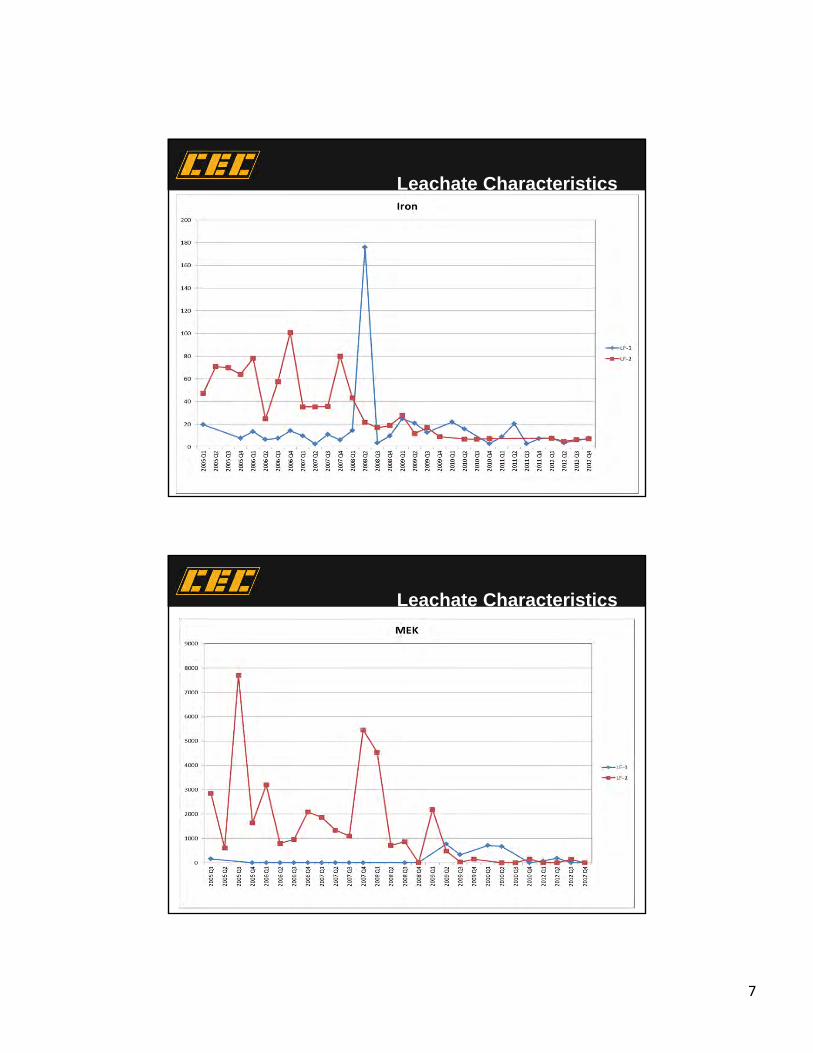
Leachate Characteristics
Leachate Characteristics

6
Leachate Characteristics
Leachate Characteristics
7
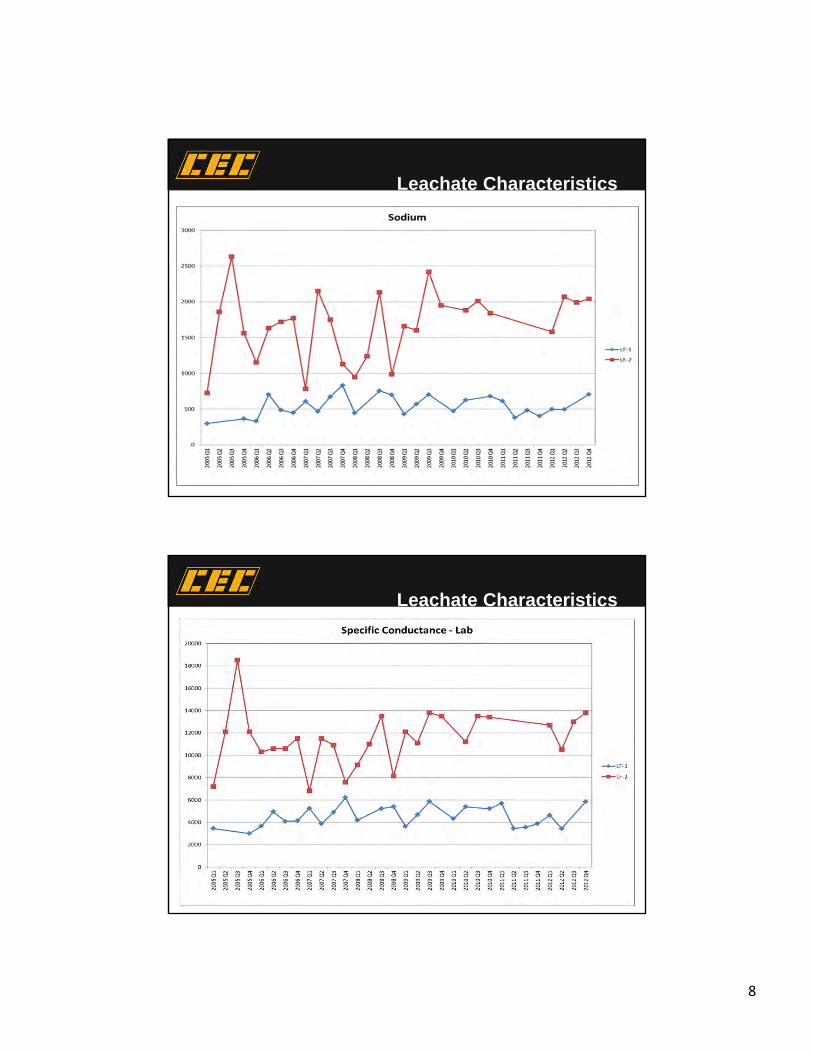
Leachate Characteristics
Leachate Characteristics
8
Leachate Characteristics
Leachate Characteristics
9
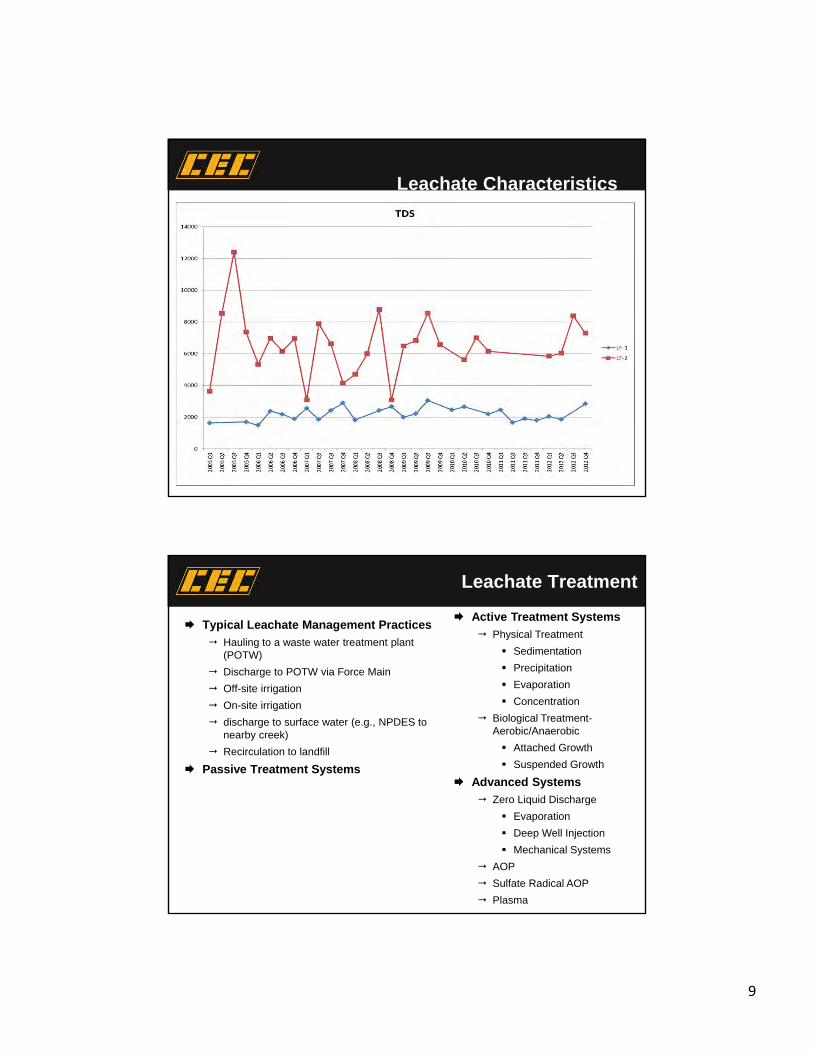
Leachate Characteristics
Typical Leachate Management Practices
Hauling to a waste water treatment plant (POTW)
Discharge to POTW via Force Main
Off-site irrigation
On-site irrigation
discharge to surface water (e.g., NPDES to nearby creek)
Recirculation to landfill
Passive Treatment Systems
Leachate Treatment
Active Treatment Systems
Physical Treatment
Sedimentation
Precipitation
Evaporation
Concentration
Biological Treatment-Aerobic/Anaerobic
Attached Growth
Suspended Growth
Advanced Systems
Zero Liquid Discharge
Evaporation
Deep Well Injection
Mechanical Systems
AOP
Sulfate Radical AOP
Plasma
10
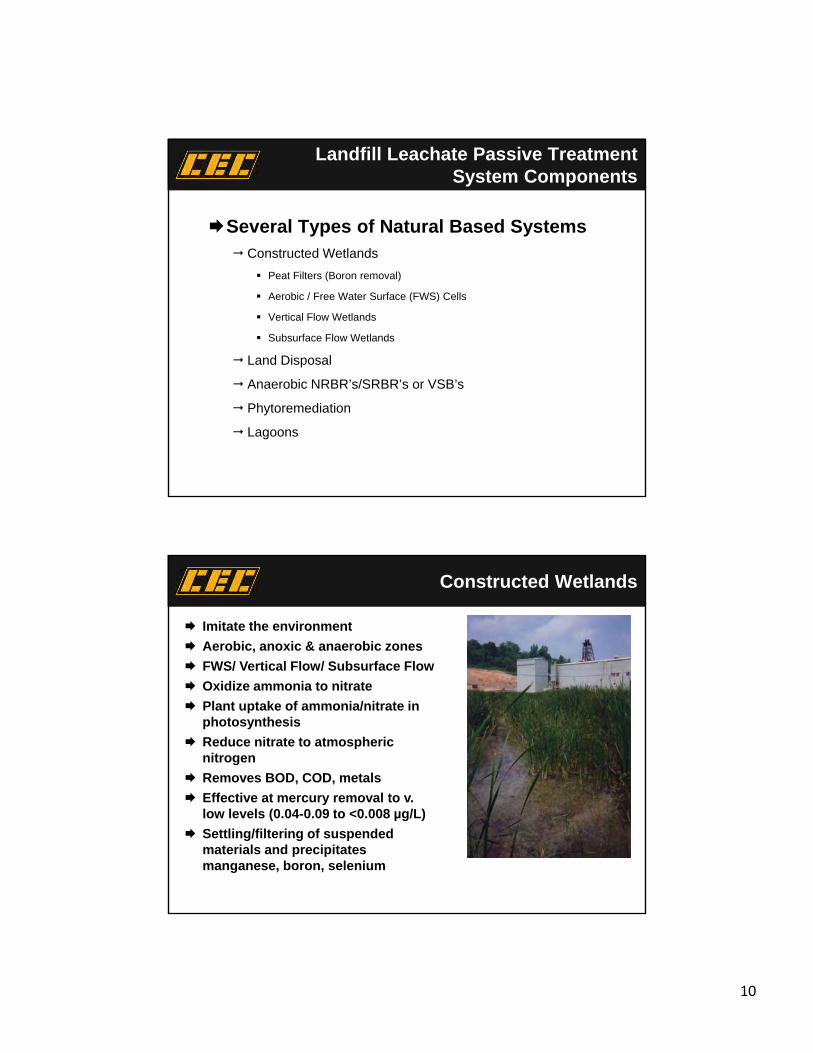
Several Types of Natural Based Systems Constructed Wetlands
Peat Filters (Boron removal)
Aerobic / Free Water Surface (FWS) Cells
Vertical Flow Wetlands
Subsurface Flow Wetlands
Land Disposal
Anaerobic NRBR’s/SRBR’s or VSB’s
Phytoremediation
Lagoons
Landfill Leachate Passive Treatment System Components
Imitate the environment
Aerobic, anoxic & anaerobic zones
FWS/ Vertical Flow/ Subsurface Flow
Oxidize ammonia to nitrate
Plant uptake of ammonia/nitrate in photosynthesis
Reduce nitrate to atmospheric nitrogen
Removes BOD, COD, metals
Effective at mercury removal to v. low levels (0.04-0.09 to <0.008 µg/L)
Settling/filtering of suspended materials and precipitates manganese, boron, selenium
Constructed Wetlands
11
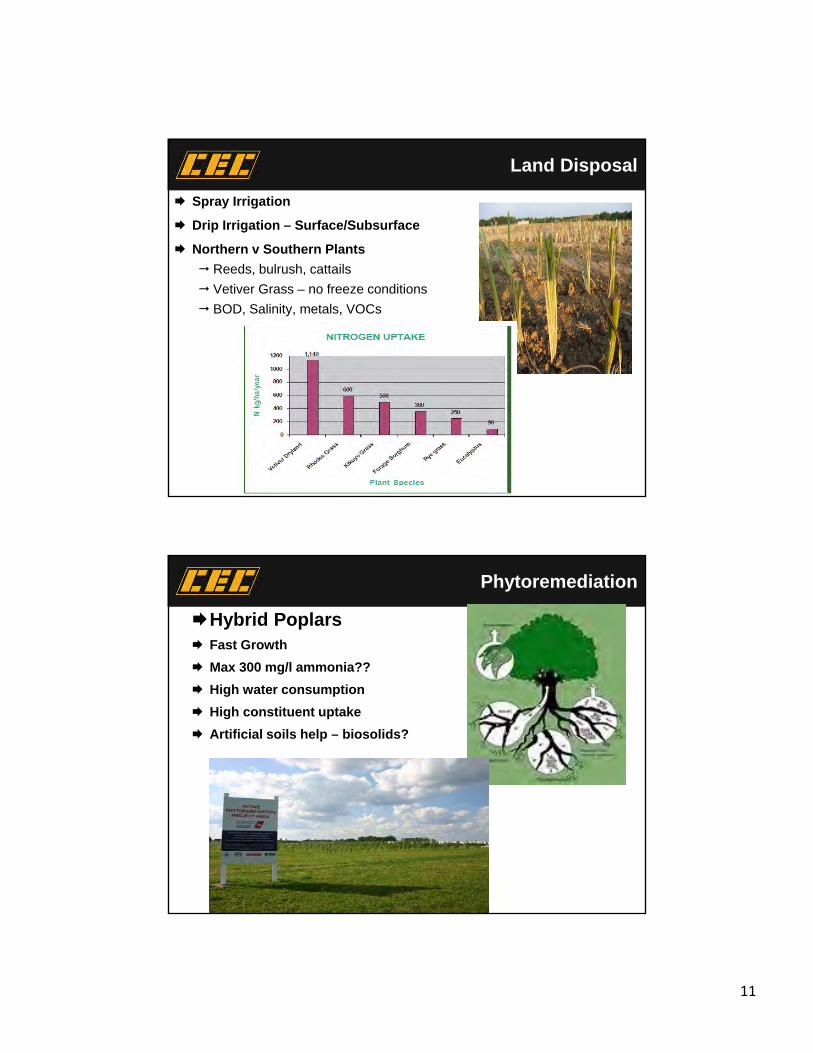
Land Disposal
Spray Irrigation
Drip Irrigation – Surface/Subsurface
Northern v Southern Plants
Reeds, bulrush, cattails
Vetiver Grass – no freeze conditions
BOD, Salinity, metals, VOCs
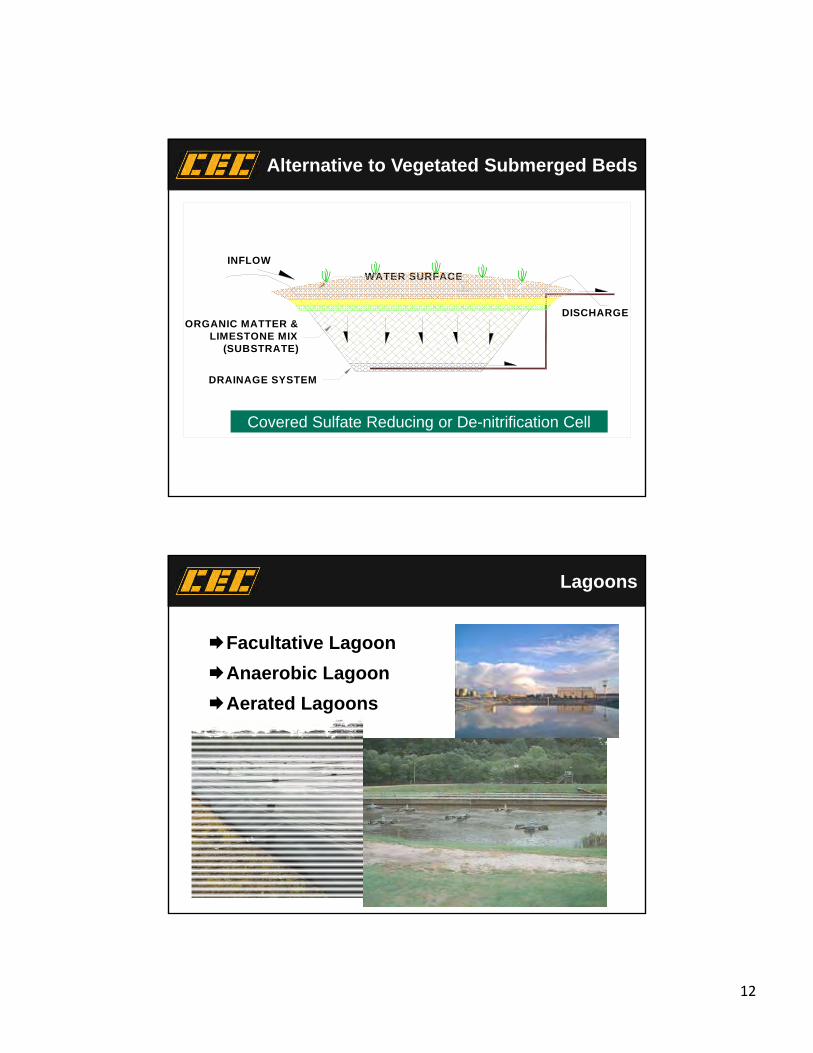
Hybrid Poplars Fast Growth
Max 300 mg/l ammonia??
High water consumption
High constituent uptake
Artificial soils help – biosolids?
Phytoremediation
12
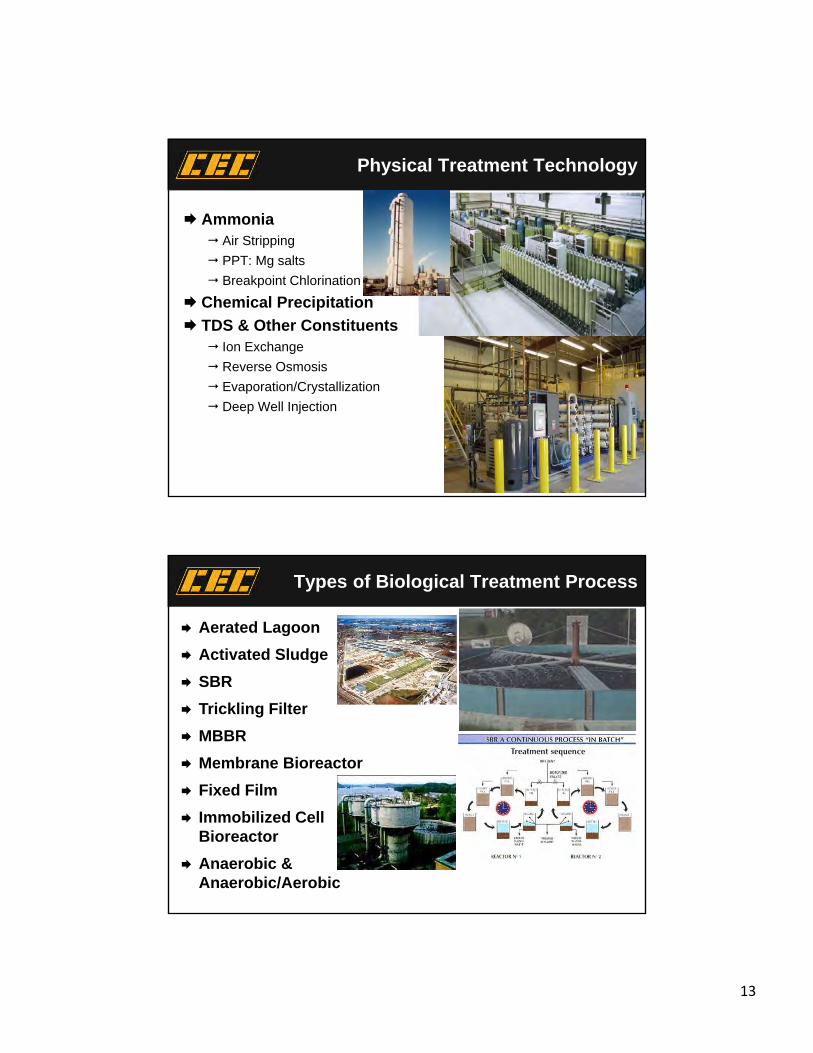
WATER SURFACE
DISCHARGE
DRAINAGE SYSTEM
ORGANIC MATTER &LIMESTONE MIX
(SUBSTRATE)
INFLOW
Covered Sulfate Reducing or De-nitrification Cell
SOIL COVER
GRAVEL LAYER
Alternative to Vegetated Submerged Beds
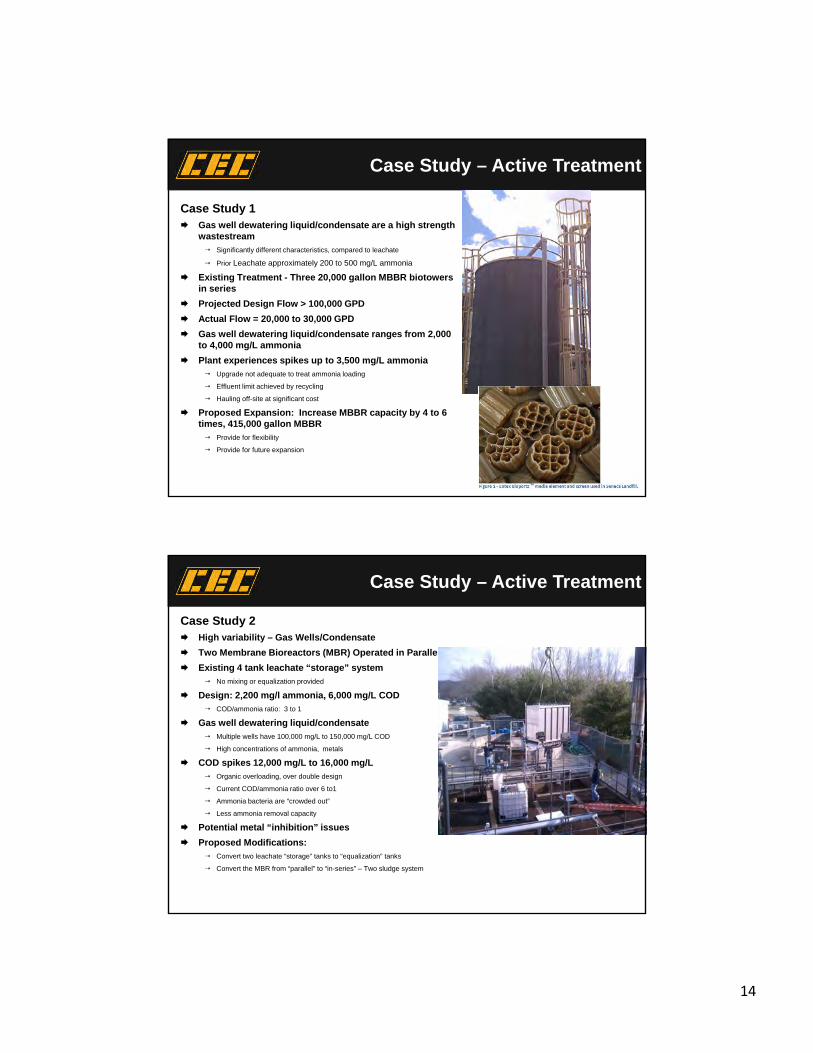
Facultative Lagoon
Anaerobic Lagoon
Aerated Lagoons
Lagoons
13
Ammonia Air Stripping
PPT: Mg salts
Breakpoint Chlorination
Chemical Precipitation
TDS & Other Constituents Ion Exchange
Reverse Osmosis
Evaporation/Crystallization
Deep Well Injection
Physical Treatment Technology
Aerated Lagoon
Activated Sludge
SBR
Trickling Filter
MBBR
Membrane Bioreactor
Fixed Film
Immobilized Cell Bioreactor
Anaerobic & Anaerobic/Aerobic
Types of Biological Treatment Process
14
Case Study – Active Treatment
Case Study 1 Gas well dewatering liquid/condensate are a high strength
wastestream Significantly different characteristics, compared to leachate
Prior Leachate approximately 200 to 500 mg/L ammonia
Existing Treatment - Three 20,000 gallon MBBR biotowersin series
Projected Design Flow > 100,000 GPD
Actual Flow = 20,000 to 30,000 GPD
Gas well dewatering liquid/condensate ranges from 2,000 to 4,000 mg/L ammonia
Plant experiences spikes up to 3,500 mg/L ammonia Upgrade not adequate to treat ammonia loading
Effluent limit achieved by recycling
Hauling off-site at significant cost
Proposed Expansion: Increase MBBR capacity by 4 to 6 times, 415,000 gallon MBBR Provide for flexibility
Provide for future expansion
Case Study – Active Treatment
Case Study 2 High variability – Gas Wells/Condensate
Two Membrane Bioreactors (MBR) Operated in Parallel
Existing 4 tank leachate “storage” system No mixing or equalization provided
Design: 2,200 mg/l ammonia, 6,000 mg/L COD COD/ammonia ratio: 3 to 1
Gas well dewatering liquid/condensate Multiple wells have 100,000 mg/L to 150,000 mg/L COD
High concentrations of ammonia, metals
COD spikes 12,000 mg/L to 16,000 mg/L Organic overloading, over double design
Current COD/ammonia ratio over 6 to1
Ammonia bacteria are “crowded out”
Less ammonia removal capacity
Potential metal “inhibition” issues
Proposed Modifications: Convert two leachate “storage” tanks to “equalization” tanks
Convert the MBR from “parallel” to “in-series” – Two sludge system
15
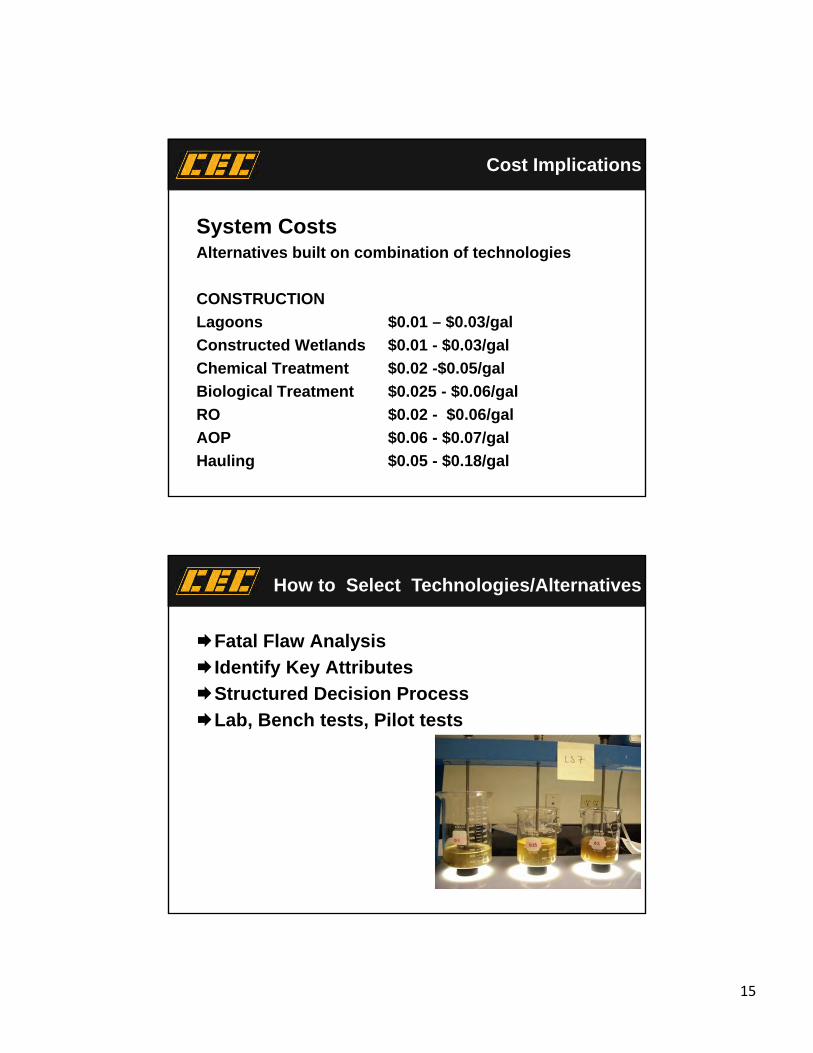
Cost Implications
System CostsAlternatives built on combination of technologies
CONSTRUCTION
Lagoons $0.01 – $0.03/gal
Constructed Wetlands $0.01 - $0.03/gal
Chemical Treatment $0.02 -$0.05/gal
Biological Treatment $0.025 - $0.06/gal
RO $0.02 - $0.06/gal
AOP $0.06 - $0.07/gal
Hauling $0.05 - $0.18/gal
How to Select Technologies/Alternatives
Fatal Flaw Analysis
Identify Key Attributes
Structured Decision Process
Lab, Bench tests, Pilot tests
16
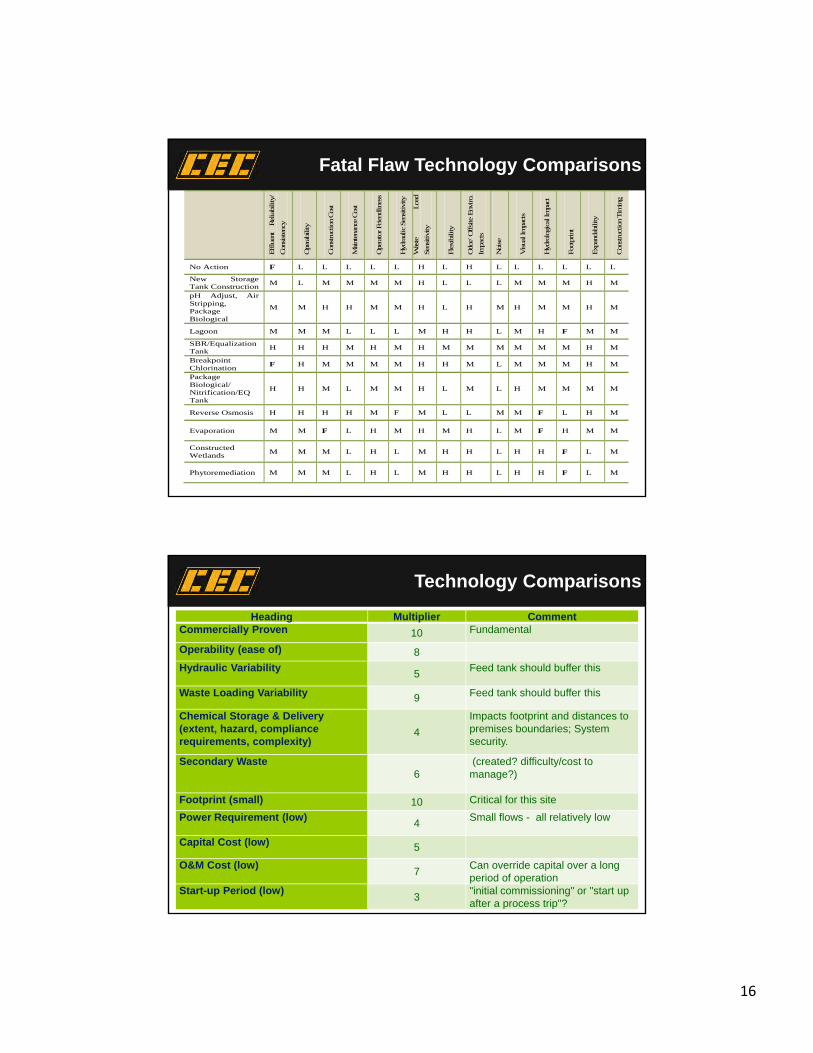
Fatal Flaw Technology Comparisons
Efflu
ent
Rel
iabi
lity
/
Con
sisten
cy
Ope
rabi
lity
Con
stru
ctio
n Cos
t
Mai
nten
ance
Cos
t
Ope
rato
r Frien
dlin
ess
Hyd
raul
ic S
ensitivi
ty
Was
te
Loa
d
Sen
sitivi
ty
Fle
xibi
lity
Odo
r/ O
ffsite
Env
iro.
Impa
cts
Noi
se
Visua
l Im
pact
s
Hyd
rolo
gica
l Im
pact
Foo
tprint
Exp
anda
bility
Con
stru
ctio
n Tim
ing
No Action F L L L L L H L H L L L L L L
New Storage Tank Construction
M L M M M M H L L L M M M H M
pH Adjust, Air Stripping, Package Biological
M M H H M M H L H M H M M H M
Lagoon M M M L L L M H H L M H F M M
SBR/Equalization Tank
H H H M H M H M M M M M M H M
Breakpoint Chlorination
F H M M M M H H M L M M M H M
Package Biological/ Nitrification/EQ Tank
H H M L M M H L M L H M M M M
Reverse Osmosis H H H H M F M L L M M F L H M
Evaporation M M F L H M H M H L M F H M M
Constructed Wetlands
M M M L H L M H H L H H F L M
Phytoremediation M M M L H L M H H L H H F L M
Technology Comparisons
Heading Multiplier CommentCommercially Proven 10 Fundamental
Operability (ease of) 8
Hydraulic Variability 5
Feed tank should buffer this
Waste Loading Variability 9 Feed tank should buffer this
Chemical Storage & Delivery (extent, hazard, compliance requirements, complexity)
4
Impacts footprint and distances to premises boundaries; System security.
Secondary Waste6
(created? difficulty/cost to manage?)
Footprint (small) 10 Critical for this site
Power Requirement (low)4
Small flows - all relatively low
Capital Cost (low) 5
O&M Cost (low)7
Can override capital over a long period of operation
Start-up Period (low)3
"initial commissioning" or "start up after a process trip"?

17
Considerations Rankings Multiplier Definition
Commercially Available
5
10
Frequently Used3 Often, but not Frequently Used
1 Infrequent, but commercially available
Operability
5
8
Moderate operator attention and expertise
3 Requires full operator attention and expertise
1 Requires full operator attention and expertise
Hydraulic Variability
5
5
Capable of handling wide flow variations
3 Moderate upset due to flow variations
1 Process unable to perform with flow variation
Waste Loading Variability
5
9
Handling large water quality variations
3 Moderate upset from water quality variations
1Process upset without large equalization to address water quality variation
Chemical Storage & Delivery
5
4
Chemical storage and delivery not required
3 Chemical storage and delivery required
1 Hazardous chemical storage and delivery
Summary of the Consideration Ranking Definitionsand Weighting Used for Technology Review
Summary of the Consideration Ranking Definitionsand Weighting Used for Technology Review (Con’t)
Considerations Rankings Multiplier Definition
Secondary Waste
5
6
Produces no waste that needs further treatment/disposal
Produces waste that needs disposal3
Produces waste that needs further treatment prior to disposal1
Footprint5
10Requires small footprint
3 Require moderate footprint1 Require large footprint
Power Requirement5
4Requires little energy
3 Requires moderate energy1 Requires high energy
Capital Cost5
5Low capital cost
3 Moderate capital cost1 High capital cost
O&M Cost5
7Low O&M cost
3 Moderate O&M cost1 High O&M cost
Start-up Period
5
3
No start-up period required
3 Moderate start-up period required
1 Long start-up period required
18
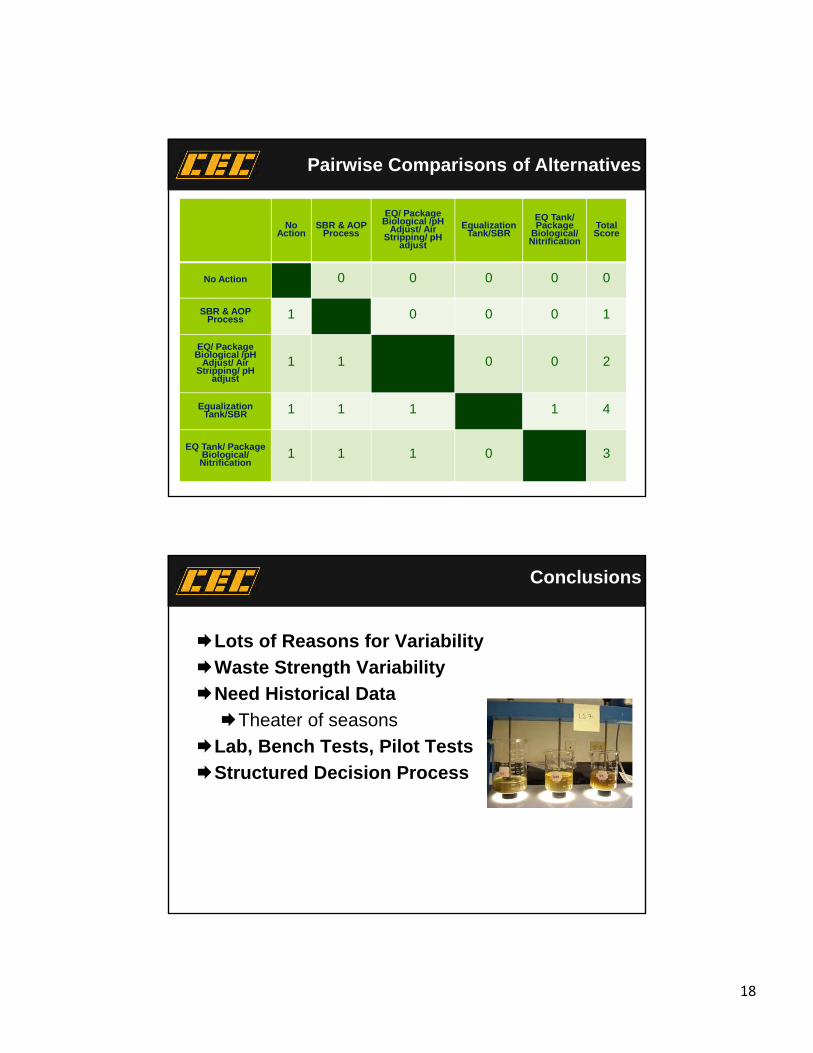
Pairwise Comparisons of Alternatives
No Action
SBR & AOP Process
EQ/ Package Biological /pH
Adjust/ Air Stripping/ pH
adjust
Equalization Tank/SBR
EQ Tank/ Package
Biological/Nitrification
Total Score
No Action 0 0 0 0 0
SBR & AOP Process 1 0 0 0 1
EQ/ Package Biological /pH
Adjust/ Air Stripping/ pH
adjust
1 1 0 0 2
Equalization Tank/SBR 1 1 1 1 4
EQ Tank/ Package Biological/Nitrification
1 1 1 0 3
Conclusions
Lots of Reasons for Variability
Waste Strength Variability
Need Historical Data
Theater of seasons
Lab, Bench Tests, Pilot Tests
Structured Decision Process
19
Questions?