2013 fungicide test summary - for your information · collection were located outside of the area...
TRANSCRIPT
Wisconsin Field Crops Pathology Fungicide
Tests Summary
2013
Damon Smith, UW Plant Pathology and
Bryan Jensen, UW IPM Program
Acknowledgements
This report is a concise summary of pesticide related research trials conducted in 2013 under the direction of the Wisconsin Field Crops Pathology program in the Department of Plant Pathology at the University of Wisconsin-Madison. We thank many summer hourlies and research interns for assisting in conducting these trials. We would also like to thank Scott Chapman, Carol Groves, John Gaska, Adam Roth, and Shawn Conley for technical support. The authors would also like to thank the following for their support in 2013: BASF Bayer Crop Sciences Cheminova DuPont Luxembourg Industries, LTD MANA Syngenta Valent Viva, LLC. Wisconsin Soybean Marketing Board
Disclaimer
Mention of specific products in this publication are for your convenience and do represent an endorsement or criticism. This by no means is a complete test of all products available. You are responsible for using pesticides according to the manufacturers current label. Follow all label instructions when using any pesticide. Remember the label is the law!
i
Table of Contents Evaluation of Fungicide for control of foliar diseases of alfalfa in Wisconsin, 2013 ........................... 1 Evaluation of fungicides for control of foliar diseases of dent corn in Wisconsin, 2013 ...................... 2 Evaluation of fungicides for control of brown spot of soybean in Wisconsin, 2013 ............................. 4 Evaluation of fungicides for control of Sclerotinia stem rot of soybean in Wisconsin, 2013 ............... 6 Evaluation of foliar fungicides for control of foliar diseases of sweet corn in Wisconsin, 2013 .......... 8 Evaluation of foliar fungicides for control of diseases of wheat in Wisconsin, 2013 ........................... 9
ii
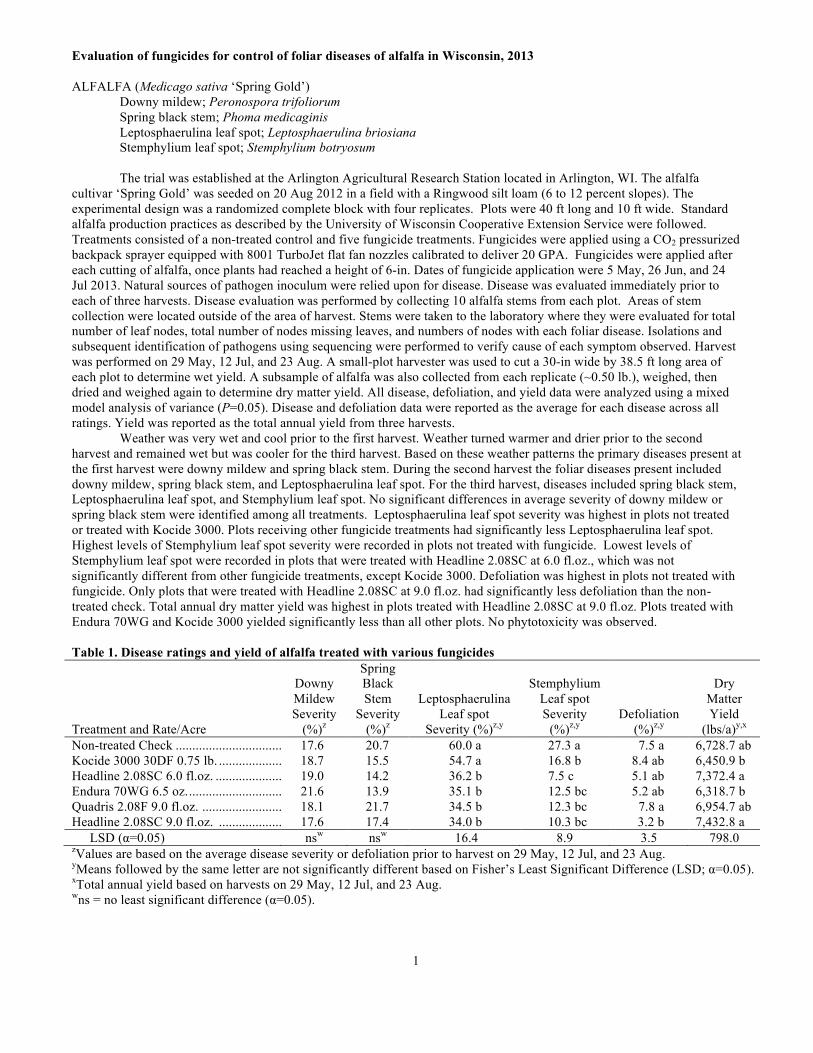
Evaluation of fungicides for control of foliar diseases of alfalfa in Wisconsin, 2013 ALFALFA (Medicago sativa ‘Spring Gold’)
Downy mildew; Peronospora trifoliorum Spring black stem; Phoma medicaginis Leptosphaerulina leaf spot; Leptosphaerulina briosiana Stemphylium leaf spot; Stemphylium botryosum The trial was established at the Arlington Agricultural Research Station located in Arlington, WI. The alfalfa cultivar ‘Spring Gold’ was seeded on 20 Aug 2012 in a field with a Ringwood silt loam (6 to 12 percent slopes). The experimental design was a randomized complete block with four replicates. Plots were 40 ft long and 10 ft wide. Standard alfalfa production practices as described by the University of Wisconsin Cooperative Extension Service were followed. Treatments consisted of a non-treated control and five fungicide treatments. Fungicides were applied using a CO2 pressurized backpack sprayer equipped with 8001 TurboJet flat fan nozzles calibrated to deliver 20 GPA. Fungicides were applied after each cutting of alfalfa, once plants had reached a height of 6-in. Dates of fungicide application were 5 May, 26 Jun, and 24 Jul 2013. Natural sources of pathogen inoculum were relied upon for disease. Disease was evaluated immediately prior to each of three harvests. Disease evaluation was performed by collecting 10 alfalfa stems from each plot. Areas of stem collection were located outside of the area of harvest. Stems were taken to the laboratory where they were evaluated for total number of leaf nodes, total number of nodes missing leaves, and numbers of nodes with each foliar disease. Isolations and subsequent identification of pathogens using sequencing were performed to verify cause of each symptom observed. Harvest was performed on 29 May, 12 Jul, and 23 Aug. A small-plot harvester was used to cut a 30-in wide by 38.5 ft long area of each plot to determine wet yield. A subsample of alfalfa was also collected from each replicate (~0.50 lb.), weighed, then dried and weighed again to determine dry matter yield. All disease, defoliation, and yield data were analyzed using a mixed model analysis of variance (P=0.05). Disease and defoliation data were reported as the average for each disease across all ratings. Yield was reported as the total annual yield from three harvests. Weather was very wet and cool prior to the first harvest. Weather turned warmer and drier prior to the second harvest and remained wet but was cooler for the third harvest. Based on these weather patterns the primary diseases present at the first harvest were downy mildew and spring black stem. During the second harvest the foliar diseases present included downy mildew, spring black stem, and Leptosphaerulina leaf spot. For the third harvest, diseases included spring black stem, Leptosphaerulina leaf spot, and Stemphylium leaf spot. No significant differences in average severity of downy mildew or spring black stem were identified among all treatments. Leptosphaerulina leaf spot severity was highest in plots not treated or treated with Kocide 3000. Plots receiving other fungicide treatments had significantly less Leptosphaerulina leaf spot. Highest levels of Stemphylium leaf spot severity were recorded in plots not treated with fungicide. Lowest levels of Stemphylium leaf spot were recorded in plots that were treated with Headline 2.08SC at 6.0 fl.oz., which was not significantly different from other fungicide treatments, except Kocide 3000. Defoliation was highest in plots not treated with fungicide. Only plots that were treated with Headline 2.08SC at 9.0 fl.oz. had significantly less defoliation than the non-treated check. Total annual dry matter yield was highest in plots treated with Headline 2.08SC at 9.0 fl.oz. Plots treated with Endura 70WG and Kocide 3000 yielded significantly less than all other plots. No phytotoxicity was observed. Table 1. Disease ratings and yield of alfalfa treated with various fungicides
Treatment and Rate/Acre
Downy Mildew Severity
(%)z
Spring Black Stem
Severity (%)z
Leptosphaerulina Leaf spot
Severity (%)z,y
Stemphylium Leaf spot Severity
(%)z,y Defoliation
(%)z,y
Dry Matter Yield
(lbs/a)y,x
Non-treated Check .............................................................................. 17.6 20.7 60.0 a 27.3 a 7.5 a 6,728.7 ab Kocide 3000 30DF 0.75 lb. ................................................................. 18.7 15.5 54.7 a 16.8 b 8.4 ab 6,450.9 b Headline 2.08SC 6.0 fl.oz. .................................................................. 19.0 14.2 36.2 b 7.5 c 5.1 ab 7,372.4 a Endura 70WG 6.5 oz. .......................................................................... 21.6 13.9 35.1 b 12.5 bc 5.2 ab 6,318.7 b Quadris 2.08F 9.0 fl.oz. ...................................................................... 18.1 21.7 34.5 b 12.3 bc 7.8 a 6,954.7 ab Headline 2.08SC 9.0 fl.oz. ................................................................. 17.6 17.4 34.0 b 10.3 bc 3.2 b 7,432.8 a
LSD (α=0.05) nsw nsw 16.4 8.9 3.5 798.0 zValues are based on the average disease severity or defoliation prior to harvest on 29 May, 12 Jul, and 23 Aug. yMeans followed by the same letter are not significantly different based on Fisher’s Least Significant Difference (LSD; α=0.05). xTotal annual yield based on harvests on 29 May, 12 Jul, and 23 Aug. wns = no least significant difference (α=0.05).
1
Evaluation of fungicides for control of foliar diseases of dent corn in Wisconsin, 2013 DENT CORN (Zea mays ‘P0115AM1’)
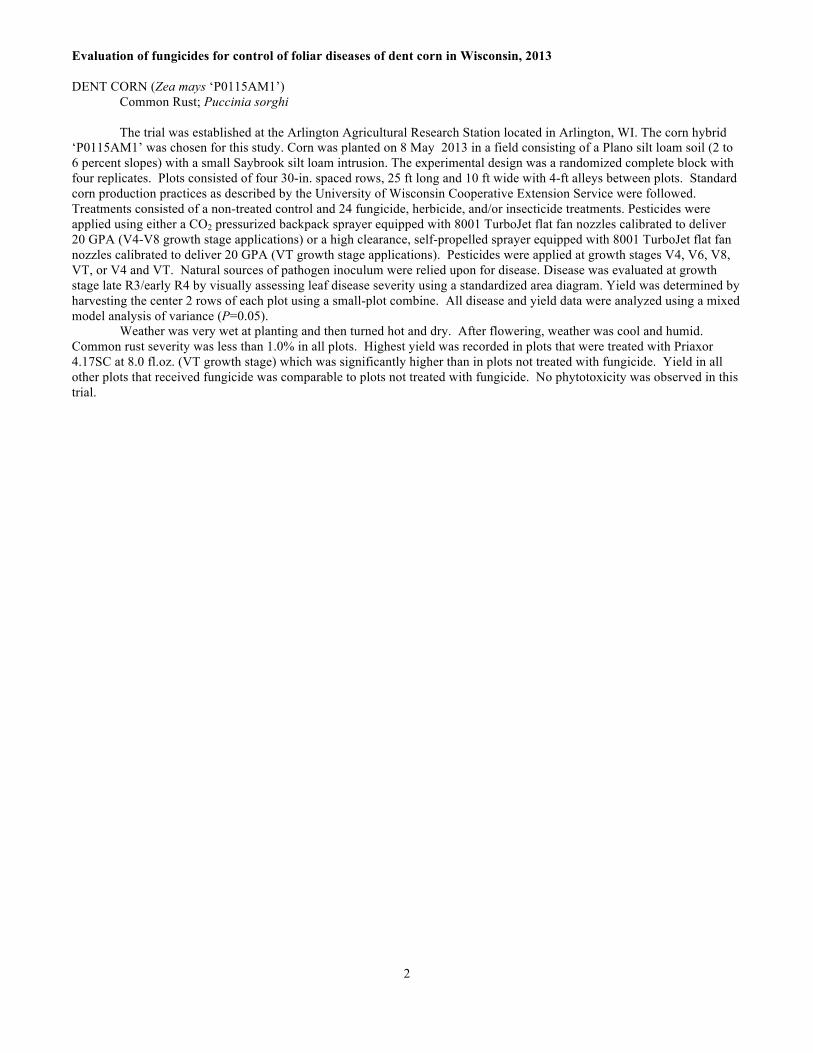
Common Rust; Puccinia sorghi The trial was established at the Arlington Agricultural Research Station located in Arlington, WI. The corn hybrid ‘P0115AM1’ was chosen for this study. Corn was planted on 8 May 2013 in a field consisting of a Plano silt loam soil (2 to 6 percent slopes) with a small Saybrook silt loam intrusion. The experimental design was a randomized complete block with four replicates. Plots consisted of four 30-in. spaced rows, 25 ft long and 10 ft wide with 4-ft alleys between plots. Standard corn production practices as described by the University of Wisconsin Cooperative Extension Service were followed. Treatments consisted of a non-treated control and 24 fungicide, herbicide, and/or insecticide treatments. Pesticides were applied using either a CO2 pressurized backpack sprayer equipped with 8001 TurboJet flat fan nozzles calibrated to deliver 20 GPA (V4-V8 growth stage applications) or a high clearance, self-propelled sprayer equipped with 8001 TurboJet flat fan nozzles calibrated to deliver 20 GPA (VT growth stage applications). Pesticides were applied at growth stages V4, V6, V8, VT, or V4 and VT. Natural sources of pathogen inoculum were relied upon for disease. Disease was evaluated at growth stage late R3/early R4 by visually assessing leaf disease severity using a standardized area diagram. Yield was determined by harvesting the center 2 rows of each plot using a small-plot combine. All disease and yield data were analyzed using a mixed model analysis of variance (P=0.05). Weather was very wet at planting and then turned hot and dry. After flowering, weather was cool and humid. Common rust severity was less than 1.0% in all plots. Highest yield was recorded in plots that were treated with Priaxor 4.17SC at 8.0 fl.oz. (VT growth stage) which was significantly higher than in plots not treated with fungicide. Yield in all other plots that received fungicide was comparable to plots not treated with fungicide. No phytotoxicity was observed in this trial.
2
Table 2. Common rust ratings and yield of dent corn treated with various pesticides
Treatment and Rate/Acre (Crop Growth Stage at Application)z Common Rust
Severityy Yield (bu/a) Quilt 1.66SC 10.5 fl.oz. (VT) ........................................................................ 0.3 194.4 dx
Headline AMP 1.68SC 10.0 fl.oz. + Glyfos X-tra 32.0 fl.oz. (V6) ............... 0.3 203.7 cd
Topguard 1.04SC 14.0 fl.oz. + Glyfos X-tra 32.0 fl.oz. (V6) ........................ 0.3 204.4 cd
Topguard 1.04SC 10.0 fl.oz. (V8) ................................................................. 0.5 205.0 cd
Stratego YLD 500SC 4.0 fl.oz. (VT) ............................................................. 0.5 205.9 cd
Headline AMP 1.68SC 10.0 fl.oz. (V8) ......................................................... 0.6 209.4 bcd
Aproach 2.08SC 6.0 fl.oz. (VT) ..................................................................... 0.6 209.8 bcd
Fortix 3.22SC 5.0 fl.oz. (V8) ......................................................................... 0.2 210.2 bcd
Headline AMP 1.68SC 10.0 fl.oz. (VT) ........................................................ 0.4 210.2 bcd
Stratego YLD 500SC 2.0 fl.oz. (V4) ............................................................. 0.2 211.5 bcd
Non-treated Check ......................................................................................... 0.9 212.6 bcd
Aproach Prima 2.34SC 5.0 fl.oz. (VT) .......................................................... 0.2 214.5 ad
Glyfos X-tra 32.0 fl.oz. (V6) .......................................................................... 0.6 214.6 ad
Aproach 2.08SC 3.0 fl.oz. (V4)
Aproach Prima 2.34SC 6.8 fl.oz. (VT) ....................................................... 0.3 218.2 ad
Quilt Xcel 2.2SE 10.5 fl.oz. (VT) .................................................................. 0.2 221.9 ac
Aproach Prima 2.34SC 5.0 fl.oz. (VT) .......................................................... 0.2 224.6 ac
Aproach Prima 2.34SC 6.8 fl.oz. + Prevathon 0.43SC 20.0 fl.oz. (VT) ........ 0.5 224.8 ac
Aproach 2.08SC 6.8 fl.oz. + Prevathon 0.43SC 20.0 fl.oz. (VT) .................. 0.3 225.2 ac
Headline 2.08SC 6.0 fl.oz. (VT) .................................................................... 0.4 228.3 ac
Topguard 1.04SC 10.0 fl.oz. (VT) ................................................................. 0.3 228.5 ac
Fortix 3.22SC 5.0 fl.oz. (VT) ......................................................................... 0.2 229.0 ac
Priaxor 4.17SC 4.0 fl.oz. (VT) ....................................................................... 0.5 233.6 ab
Fortix 3.22SC 5.0 fl.oz. + Glyfos X-tra 32.0 fl.oz (V6) ................................ 0.3 234.1 ab
Fortix 3.22SC 4.0 fl.oz. (VT) ......................................................................... 0.5 234.9 ab
Priaxor 4.17SC 8.0 fl.oz. (VT) ....................................................................... 0.2 238.9 a
LSD (α=0.05) ns 25.9 zAll treatments included the non-ionic surfactant Induce 90SL at 0.25% v/v. yCommon rust severity was assessed visually using a standard area diagram. Scale is from 0% to 100% coverage of ear leaves by common rust lesions xMeans followed by the same letter are not significantly different based on Fisher’s Least Significant Difference (LSD; α=0.05)
3
Evaluation of fungicides for control of brown spot of soybean in Wisconsin, 2013 SOYBEAN (Glycine max ‘AG2431’)
Brown spot; Septoria glycines The trial was established at the Arlington Agricultural Research Station located in Arlington, WI. The soybean cultivar ‘AG2431’ was chosen for this study. Soybeans were planted on 8 May 2013 in a field with a Joy silt loam soil (2 to 4 percent slopes). The experimental design was a randomized complete block with four replicates. Plots consisted of four 30-in. spaced rows, 21 ft long and 10 ft wide with 4-ft alleys between plots. Standard soybean production practices as described by the University of Wisconsin Cooperative Extension Service were followed. Treatments consisted of a non-treated control and 22 fungicide and/or insecticide treatments. Pesticides were applied using a CO2 pressurized backpack sprayer equipped with 8001 TurboJet flat fan nozzles calibrated to deliver 20 GPA. Pesticides were applied at growth stages R1, R3, or both. Natural sources of pathogen inoculum were relied upon for disease. Disease was evaluated at growth stage R6 by visually assessing leaf disease severity using a standardized area diagram. Yield was determined by harvesting the center 2 rows of each plot using a small-plot combine. All disease and yield data were analyzed using a mixed model analysis of variance (P=0.05). Weather was very wet at planting and then turned hot and dry. After flowering weather was cool and humid. Brown spot persisted in plots for the entire growing season. Highest levels of brown spot were in plots not treated with fungicide. Plots treated with Quilt 1.66SC at the R3 growth stage and Fortix 3.22SC at the R1 growth stage had levels of brown spot comparable to the non-treated check plots. Lowest levels of brown spot were recorded in plots that received an application of Proline 480SC at the R1 growth stage and follow-up application of Stratego YLD 500SC at the R3 growth stage. Other fungicide treatments resulted in similar levels of brown spot compared to the two-application treatments with the exception of plots that received Topguard 1.04SC + Quadris Top SB 2.72SC at the R1 growth stage and Stratego YLD 500SC at the R3 growth stage. No phytotoxicity was observed in this trial.
4
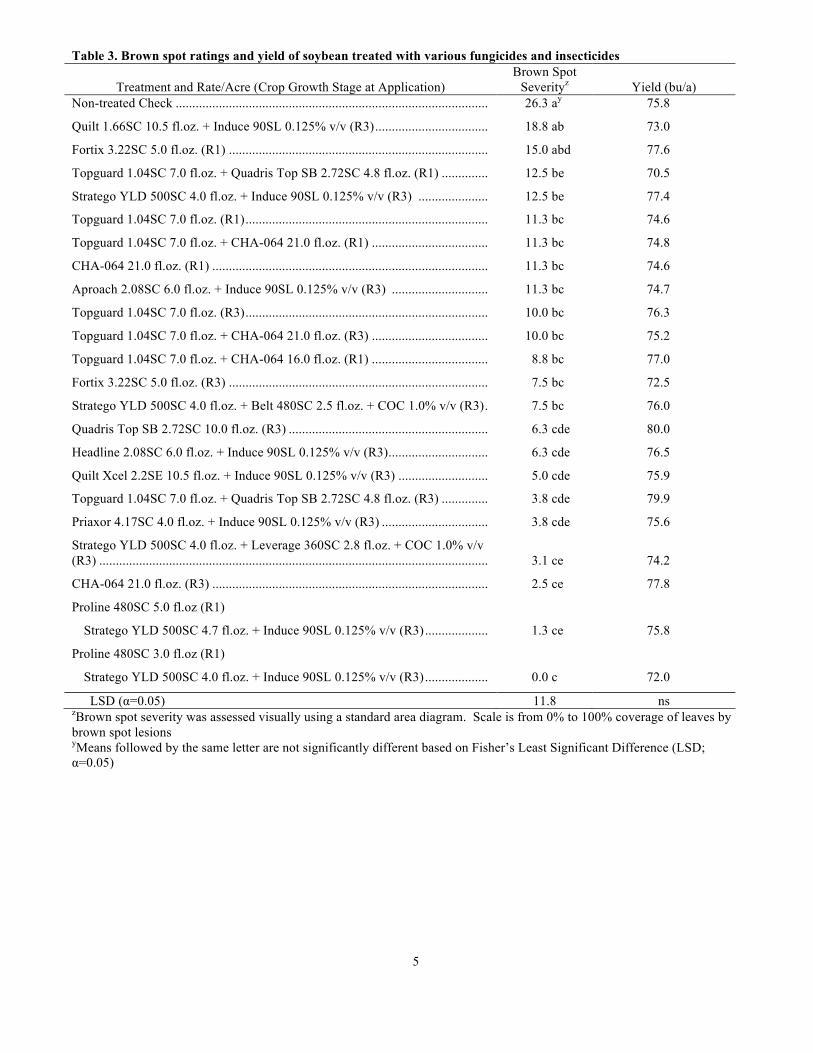
Table 3. Brown spot ratings and yield of soybean treated with various fungicides and insecticides
Treatment and Rate/Acre (Crop Growth Stage at Application) Brown Spot
Severityz Yield (bu/a) Non-treated Check .............................................................................................. 26.3 ay 75.8
Quilt 1.66SC 10.5 fl.oz. + Induce 90SL 0.125% v/v (R3) .................................. 18.8 ab 73.0
Fortix 3.22SC 5.0 fl.oz. (R1) .............................................................................. 15.0 abd 77.6
Topguard 1.04SC 7.0 fl.oz. + Quadris Top SB 2.72SC 4.8 fl.oz. (R1) .............. 12.5 be 70.5
Stratego YLD 500SC 4.0 fl.oz. + Induce 90SL 0.125% v/v (R3) ..................... 12.5 be 77.4
Topguard 1.04SC 7.0 fl.oz. (R1) ......................................................................... 11.3 bc 74.6
Topguard 1.04SC 7.0 fl.oz. + CHA-064 21.0 fl.oz. (R1) ................................... 11.3 bc 74.8
CHA-064 21.0 fl.oz. (R1) ................................................................................... 11.3 bc 74.6
Aproach 2.08SC 6.0 fl.oz. + Induce 90SL 0.125% v/v (R3) ............................. 11.3 bc 74.7
Topguard 1.04SC 7.0 fl.oz. (R3) ......................................................................... 10.0 bc 76.3
Topguard 1.04SC 7.0 fl.oz. + CHA-064 21.0 fl.oz. (R3) ................................... 10.0 bc 75.2
Topguard 1.04SC 7.0 fl.oz. + CHA-064 16.0 fl.oz. (R1) ................................... 8.8 bc 77.0
Fortix 3.22SC 5.0 fl.oz. (R3) .............................................................................. 7.5 bc 72.5
Stratego YLD 500SC 4.0 fl.oz. + Belt 480SC 2.5 fl.oz. + COC 1.0% v/v (R3) . 7.5 bc 76.0
Quadris Top SB 2.72SC 10.0 fl.oz. (R3) ............................................................ 6.3 cde 80.0
Headline 2.08SC 6.0 fl.oz. + Induce 90SL 0.125% v/v (R3) .............................. 6.3 cde 76.5
Quilt Xcel 2.2SE 10.5 fl.oz. + Induce 90SL 0.125% v/v (R3) ........................... 5.0 cde 75.9
Topguard 1.04SC 7.0 fl.oz. + Quadris Top SB 2.72SC 4.8 fl.oz. (R3) .............. 3.8 cde 79.9
Priaxor 4.17SC 4.0 fl.oz. + Induce 90SL 0.125% v/v (R3) ................................ 3.8 cde 75.6
Stratego YLD 500SC 4.0 fl.oz. + Leverage 360SC 2.8 fl.oz. + COC 1.0% v/v (R3) ..................................................................................................................... 3.1 ce 74.2
CHA-064 21.0 fl.oz. (R3) ................................................................................... 2.5 ce 77.8
Proline 480SC 5.0 fl.oz (R1)
Stratego YLD 500SC 4.7 fl.oz. + Induce 90SL 0.125% v/v (R3) ................... 1.3 ce 75.8
Proline 480SC 3.0 fl.oz (R1)
Stratego YLD 500SC 4.0 fl.oz. + Induce 90SL 0.125% v/v (R3) ................... 0.0 c 72.0
LSD (α=0.05) 11.8 ns zBrown spot severity was assessed visually using a standard area diagram. Scale is from 0% to 100% coverage of leaves by brown spot lesions yMeans followed by the same letter are not significantly different based on Fisher’s Least Significant Difference (LSD; α=0.05)
5
Evaluation of fungicides for control of Sclerotinia stem rot of soybean in Wisconsin, 2013 SOYBEAN (Glycine max ‘24RR19’)
Sclerotinia stem rot; Sclerotinia sclerotiorum The trial was established at the Arlington Agricultural Research Station located in Arlington, WI. The soybean cultivar ‘24RR19’ was chosen for this study. Soybeans were planted on 3 June 2013 in a field with a Plano silt loam soil (2 to 6 percent slopes). The experimental design was a randomized complete block with four replicates. Plots consisted of six 15-in. spaced rows, 21 ft long and 7.5 ft wide with 4-ft alleys between plots. Standard soybean production practices as described by the University of Wisconsin Cooperative Extension Service were followed. Treatments consisted of a non-treated control and 20 fungicide treatments and one herbicide treatment. Pesticides were applied using a CO2 pressurized backpack sprayer equipped with 8001 TurboJet flat fan nozzles calibrated to deliver 20 GPA. Pesticides were applied at growth stages R1, R3, or both. Natural sources of pathogen inoculum were relied upon for disease. Plots were mist-irrigated for 5-10 minutes for every hour from 8pm to 12am each day during growth stages R1 to R4. Disease was evaluated at growth stage R7 using the Sclerotinia stem rot severity index (DSI). DSI was determined by rating 30 arbitrarily selected plants in each plot and scoring plants with a: 0 = no infection; 1 = infection on branches; 2 = infection on mainstem with little effect on pod fill; 3 = infection on mainstem resulting in death or poor pod fill. The scores of the 30 plants were totaled and divided by 0.9. Yield was determined by harvesting the center 4 rows of each plot using a small-plot combine. All disease and yield data were analyzed using a mixed model analysis of variance (P=0.05). Weather was very wet at planting and then turned hot and dry. During flowering weather was cool and humid, which resulted in high levels of Sclerotinia Stem rot. Plots treated with Aproach Prima 2.34SC at 6.8 fl.oz. (R1 growth stage), Domark 40 ME at 5.0 fl.oz. (R1 growth stage), Proline 480 SC 5.0 fl.oz. (R1 growth stage), Incognito 4.5FL at 20.0 fl.oz. (R1 growth stage), Priaxor 4.17SC at 4.0 fl.oz. (R3 growth stage), and Endura 70WG at 6.0 fl.oz. (R1 growth stage) followed by Priaxor 4.17SC 4.0 fl.oz. (R3 growth stage) had levels of Sclerotinia stem rot comparable to the non-treated check. These treatments also typically resulted in the lowest yields in the trial with the exception of the Endura 70WG and Priaxor 4.17SC treatment. Lowest levels of Sclerotinia stem rot were recorded in plots treated with Cobra 2EC at 6.0 fl.oz. at R1. However, yield in these plots was not comparable to the highest yielding plots which were treated with Endura 70WG at 8.0 oz. (R1 growth stage). Plots treated with two applications of fungicide or one application of Aproach 2.08SC at 9.0 fl.oz. (R1 or R3 growth stage) or one application of Proline 480SC at 3.0 fl.oz. (R1 growth stage) resulted in variable levels of Sclerotinia stem rot, which in some cases was significantly higher than plots treated with Cobra 2EC. However, these plots yielded as well as plots treated with Endura 70WG at 8.0 oz. No phytotoxicity was observed in this trial.
6
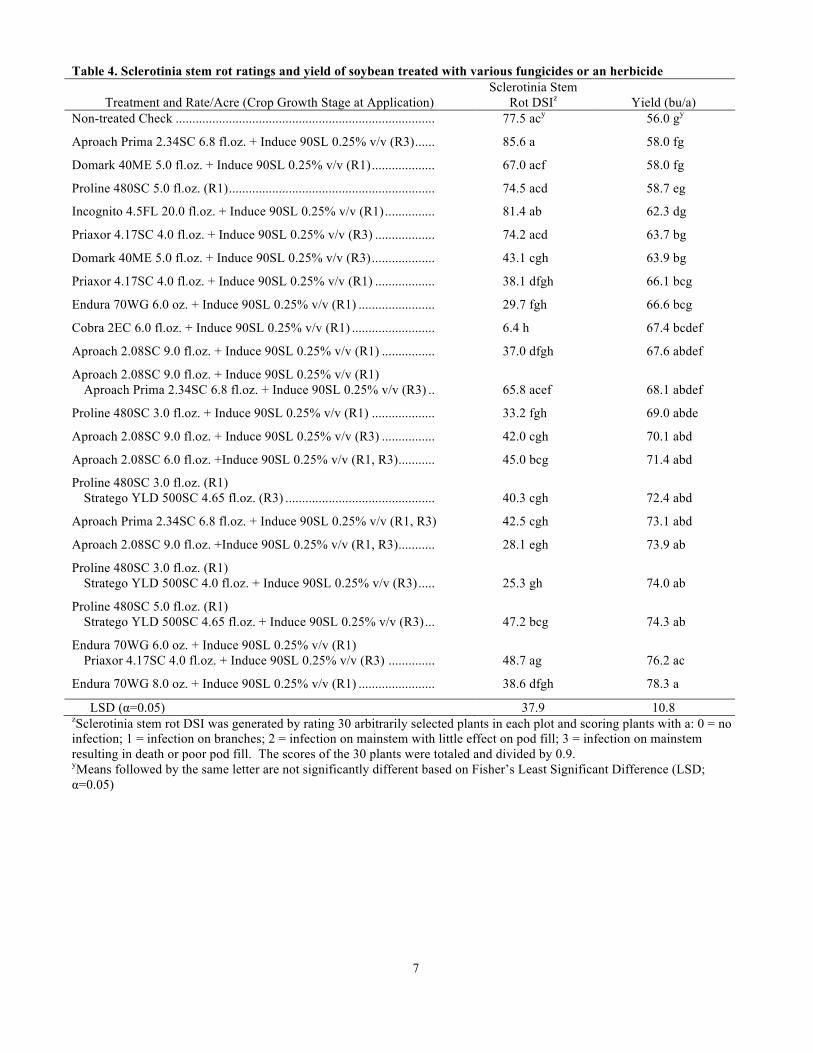
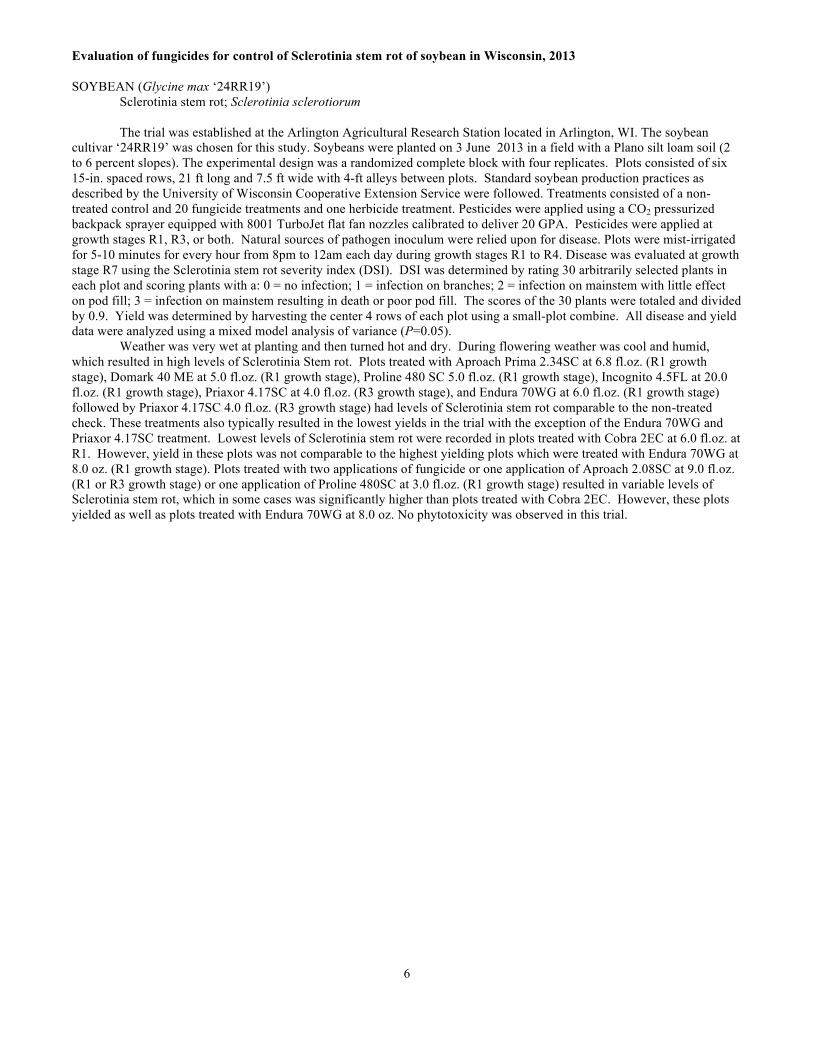
Table 4. Sclerotinia stem rot ratings and yield of soybean treated with various fungicides or an herbicide
Treatment and Rate/Acre (Crop Growth Stage at Application) Sclerotinia Stem
Rot DSIz Yield (bu/a) Non-treated Check .............................................................................. 77.5 acy 56.0 gy
Aproach Prima 2.34SC 6.8 fl.oz. + Induce 90SL 0.25% v/v (R3) ...... 85.6 a 58.0 fg
Domark 40ME 5.0 fl.oz. + Induce 90SL 0.25% v/v (R1) ................... 67.0 acf 58.0 fg
Proline 480SC 5.0 fl.oz. (R1) .............................................................. 74.5 acd 58.7 eg
Incognito 4.5FL 20.0 fl.oz. + Induce 90SL 0.25% v/v (R1) ............... 81.4 ab 62.3 dg
Priaxor 4.17SC 4.0 fl.oz. + Induce 90SL 0.25% v/v (R3) .................. 74.2 acd 63.7 bg
Domark 40ME 5.0 fl.oz. + Induce 90SL 0.25% v/v (R3) ................... 43.1 cgh 63.9 bg
Priaxor 4.17SC 4.0 fl.oz. + Induce 90SL 0.25% v/v (R1) .................. 38.1 dfgh 66.1 bcg
Endura 70WG 6.0 oz. + Induce 90SL 0.25% v/v (R1) ....................... 29.7 fgh 66.6 bcg
Cobra 2EC 6.0 fl.oz. + Induce 90SL 0.25% v/v (R1) ......................... 6.4 h 67.4 bcdef
Aproach 2.08SC 9.0 fl.oz. + Induce 90SL 0.25% v/v (R1) ................ 37.0 dfgh 67.6 abdef
Aproach 2.08SC 9.0 fl.oz. + Induce 90SL 0.25% v/v (R1) Aproach Prima 2.34SC 6.8 fl.oz. + Induce 90SL 0.25% v/v (R3) .. 65.8 acef 68.1 abdef
Proline 480SC 3.0 fl.oz. + Induce 90SL 0.25% v/v (R1) ................... 33.2 fgh 69.0 abde
Aproach 2.08SC 9.0 fl.oz. + Induce 90SL 0.25% v/v (R3) ................ 42.0 cgh 70.1 abd
Aproach 2.08SC 6.0 fl.oz. +Induce 90SL 0.25% v/v (R1, R3) ........... 45.0 bcg 71.4 abd
Proline 480SC 3.0 fl.oz. (R1) Stratego YLD 500SC 4.65 fl.oz. (R3) ............................................. 40.3 cgh 72.4 abd
Aproach Prima 2.34SC 6.8 fl.oz. + Induce 90SL 0.25% v/v (R1, R3) 42.5 cgh 73.1 abd
Aproach 2.08SC 9.0 fl.oz. +Induce 90SL 0.25% v/v (R1, R3) ........... 28.1 egh 73.9 ab
Proline 480SC 3.0 fl.oz. (R1) Stratego YLD 500SC 4.0 fl.oz. + Induce 90SL 0.25% v/v (R3) ..... 25.3 gh 74.0 ab
Proline 480SC 5.0 fl.oz. (R1) Stratego YLD 500SC 4.65 fl.oz. + Induce 90SL 0.25% v/v (R3) ... 47.2 bcg 74.3 ab
Endura 70WG 6.0 oz. + Induce 90SL 0.25% v/v (R1) Priaxor 4.17SC 4.0 fl.oz. + Induce 90SL 0.25% v/v (R3) .............. 48.7 ag 76.2 ac
Endura 70WG 8.0 oz. + Induce 90SL 0.25% v/v (R1) ....................... 38.6 dfgh 78.3 a
LSD (α=0.05) 37.9 10.8 zSclerotinia stem rot DSI was generated by rating 30 arbitrarily selected plants in each plot and scoring plants with a: 0 = no infection; 1 = infection on branches; 2 = infection on mainstem with little effect on pod fill; 3 = infection on mainstem resulting in death or poor pod fill. The scores of the 30 plants were totaled and divided by 0.9. yMeans followed by the same letter are not significantly different based on Fisher’s Least Significant Difference (LSD; α=0.05)
7
Evaluation of foliar fungicides for control of foliar diseases of sweet corn in Wisconsin, 2013 SWEET CORN (Zea mays ‘GSS 1477’) Eyespot; Kabatiella zeae The trial was established at the Arlington Agricultural Research Station located in Arlington, WI. The processing sweet corn variety ‘GSS14767’ was chosen for this study. Sweet corn was planted on 19 June 2013 in a field with a Plano silt loam soil (0 to 2 percent slopes). The experimental design was a randomized complete block with four replicates. Plots consisted of six 30-in. rows, 50 ft long and 15 ft wide with 6-ft alleys between plots. Standard sweet corn production practices as described by the University of Wisconsin Cooperative Extension Service were followed. Treatments consisted of a non-treated control and nine fungicide treatments. All fungicide treatments were applied using a CO2 pressurized, self propelled high-clearance sprayer calibrated to deliver 20 GPA. Applications of fungicide were applied at the V9-10 (Jul 25) or VT (Aug 8) growth stages, or at both growth stages. All fungicide treatments except those with Viathon 4.1SC were applied with a non-ionic surfactant (Induce SL) at 0.125% v/v. Leaf disease severity was rated on 10 ear leaves in each plot at harvest. Marketable ears were harvested by hand from the center two rows of each plot. Disease data were log-transformed for statistical analysis and back-transformed for presentation. All disease and yield data were analyzed using a mixed model analysis of variance (P=0.05). The 2013 season was hot and dry during planting. Weather turned cool and generally dry until harvest. Levels of foliar disease were low throughout the season. The common rust and eyespot were the only diseases observed in plots. Common rust severity was less than 1% in all treatments. No significant differences in eyespot severity were observed among treatments. Yield between plots was highly variable. This was likely due to dry weather conditions. No significant differences in yield were detected among treatments. However, all plots that received fungicide had numerically higher yield than the non-treated control with the exception of the Headline AMP 1.68SC treatment. Table 5. Eyespot ratings and yield of sweet corn treated with various fungicides
Treatment and Rate/Acre (Crop Growth Stage at Application)z Eyespot Severity (%) Yield, Marketable Ears
(Tons/a) Non-treated control ............................................................................. 3.8 7.2
Stratego YLD 500SC 4.0 fl.oz. (V9-10) Prosaro 421SC 7.0 fl.oz. (VT) ......................................................... 6.4 7.6
Headline AMP 1.68SC 10.0 fl.oz. (V9-10, VT) ................................. 4.0 7.2
Prosaro 421SC 7.0 fl.oz. (V9-10) Stratego YLD 4.0 fl.oz. (VT) .......................................................... 3.6 7.9
Viathon 4.1SC 3.0 pt. (V9-10, VT) ..................................................... 3.5 7.7
Priaxor 4.17SC 4.0 fl.oz. (V9-10, VT) ................................................ 3.5 7.9
Quilt Xcel 2.2SE 11 fl.oz. (VT) .......................................................... 3.3 8.0
Quilt Xcel 2.2SE 11 fl.oz. (V9-10, VT) .............................................. 3.3 7.8
Viathon 4.1 SC 2.0 pt. (V9-10, VT) .................................................... 2.7 8.2
Quilt Xcel 2.2SE 11 fl.oz. (V9-10) ..................................................... 2.5 7.5
Pr > F 0.40 nsy 0.76 ns
zInduce 90% SL (Non-ionic surfactant) at 0.125% v/v was added to all fungicide treatments except those containing Viathon 4.1SC. yns=not significant
8
Evaluation of foliar fungicides for control of diseases of wheat in Wisconsin, 2013 WHEAT, SOFT WINTER (Triticum aestivum ‘Kaskaskia’) Leaf blotch; Septoria tritici Fusarium head blight; Fusarium graminearum Powdery mildew; Blumeria graminis The trial was established at the Arlington Agricultural Research Station located in Arlington, WI. The soft red winter wheat cultivar ‘Kaskaskia’ was chosen for this study. Wheat was planted on 25 September 2012 in a field with a Plano silt loam soil (2 to 6 percent slopes). The experimental design was a randomized complete block with four replicates. Plots were 21 ft long and 7.5 ft wide with 4-ft alleys between plots. Standard wheat production practices as described by the University of Wisconsin Cooperative Extension Service were followed. Treatments consisted of a non-treated control and 11 fungicide treatments. All fungicide treatments contained the non-ionic surfactant Induce 90% SL at 0.125% v/v. Fungicides were applied using a CO2 pressurized backpack sprayer equipped with TTJ60-11002 Turbo TwinJet flat fan nozzles calibrated to deliver 20 GPA. Fungicides were used to target general wheat disease in the area. Fungicide were applied either just before jointing (Feekes 5), at emerging flag leaf (Feekes 8), at anthesis (Feekes 10.5.1), or using two sprays with the first occurring just prior to jointing or at emerging flag leaf and the second spray being applied at anthesis (Figure 3). Natural sources of pathogen inoculum were relied upon for disease and plots were also inoculated with a spore suspension (9.63x10⁶ spores/fl.oz. @ 20GPA) of Fusarium graminearum. Leaf disease severity (leaf blotch and powdery mildew) was rated on 10 arbitrary plants in each plot near ripening. A lower leaf and flag leaf were evaluated for each plant and all observations were averaged for each disease. Incidence of powdery mildew was also evaluated. Fusarium head blight was evaluated at the same time by visually estimating average incidence and severity. Level of deoxynevalenol (DON) was also evaluated in grain harvest from each treatment. All disease and yield data were analyzed using a mixed model analysis of variance (P=0.05). The primary disease present was Septoria tritici leaf blotch. Low levels of powdery mildew and scab were also observed. Non-treated check plots had the highest leaf blotch severity. Plots that received Priaxor 4.17SC at emerging flag leaf, followed by Prosaro 421SC at anthesis had the lowest levels of leaf blotch. Plots that received fungicide at emerging flag leaf or two applications of fungicide had significantly less leaf blotch than plots that received fungicide prior to jointing. Most of these same treatments were not significantly different from the Priaxor 4.17SC/Prosaro 421SC treatment. Non-treated check plots had the highest levels of powdery mildew, however, severity was only about 5%. Therefore, there were no significant differences in powdery mildew incidence or severity among plots treated with fungicide. While plots were inoculated with the Fusarium head blight (FHB) fungus, incidence and severity of FHB were low in the non-treated checks. No significant differences in disease were observed among plots treated with fungicide. There were significant differences in the levels of DON. Plots that received fungicide at anthesis had the lowest levels of DON. Grain yield in plots not treated with fungicide were near lowest among all treatments. Fungicide sprays resulted in a significant increase in yield over not spraying, with the exception of applications of fungicide just prior to jointing. The highest yield was observed in plots that received Headline 2.08SC at emerging flag leaf, followed by Prosaro 421SC at anthesis. All other two-spray treatments and flag leaf only applications of Aproach 2.08SC, Headline 2.08SC, and Prosaro 421SC resulted in comparable yields to the highest yielding program. No phytotoxicity was observed in this trial.
9
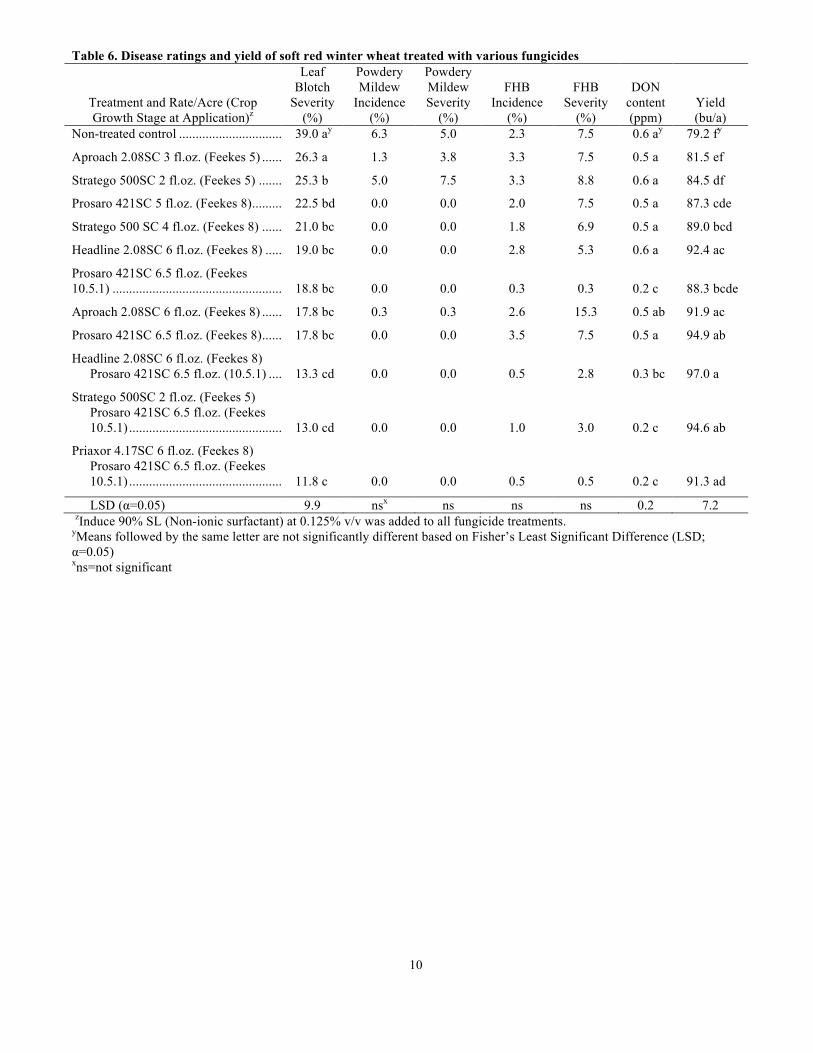
Table 6. Disease ratings and yield of soft red winter wheat treated with various fungicides
Treatment and Rate/Acre (Crop Growth Stage at Application)z
Leaf Blotch
Severity (%)
Powdery Mildew
Incidence (%)
Powdery Mildew Severity
(%)
FHB Incidence
(%)
FHB Severity
(%)
DON content (ppm)
Yield (bu/a)
Non-treated control ............................................................................. 39.0 ay 6.3 5.0 2.3 7.5 0.6 ay 79.2 fy
Aproach 2.08SC 3 fl.oz. (Feekes 5) .................................................... 26.3 a 1.3 3.8 3.3 7.5 0.5 a 81.5 ef
Stratego 500SC 2 fl.oz. (Feekes 5) ..................................................... 25.3 b 5.0 7.5 3.3 8.8 0.6 a 84.5 df
Prosaro 421SC 5 fl.oz. (Feekes 8) ....................................................... 22.5 bd 0.0 0.0 2.0 7.5 0.5 a 87.3 cde
Stratego 500 SC 4 fl.oz. (Feekes 8) .................................................... 21.0 bc 0.0 0.0 1.8 6.9 0.5 a 89.0 bcd
Headline 2.08SC 6 fl.oz. (Feekes 8) ................................................... 19.0 bc 0.0 0.0 2.8 5.3 0.6 a 92.4 ac
Prosaro 421SC 6.5 fl.oz. (Feekes 10.5.1) ................................................................................................. 18.8 bc 0.0 0.0 0.3 0.3 0.2 c 88.3 bcde
Aproach 2.08SC 6 fl.oz. (Feekes 8) .................................................... 17.8 bc 0.3 0.3 2.6 15.3 0.5 ab 91.9 ac
Prosaro 421SC 6.5 fl.oz. (Feekes 8) .................................................... 17.8 bc 0.0 0.0 3.5 7.5 0.5 a 94.9 ab
Headline 2.08SC 6 fl.oz. (Feekes 8) Prosaro 421SC 6.5 fl.oz. (10.5.1) .................................................. 13.3 cd 0.0 0.0 0.5 2.8 0.3 bc 97.0 a
Stratego 500SC 2 fl.oz. (Feekes 5) Prosaro 421SC 6.5 fl.oz. (Feekes 10.5.1) ............................................................................................ 13.0 cd 0.0 0.0 1.0 3.0 0.2 c 94.6 ab
Priaxor 4.17SC 6 fl.oz. (Feekes 8) Prosaro 421SC 6.5 fl.oz. (Feekes 10.5.1) ............................................................................................ 11.8 c 0.0 0.0 0.5 0.5 0.2 c 91.3 ad
LSD (α=0.05) 9.9 nsx ns ns ns 0.2 7.2 zInduce 90% SL (Non-ionic surfactant) at 0.125% v/v was added to all fungicide treatments. yMeans followed by the same letter are not significantly different based on Fisher’s Least Significant Difference (LSD; α=0.05) xns=not significant
10