2013 aerospace medical certification statistical handbook · pdf file2013 aerospace medical...
TRANSCRIPT

2013 Aerospace Medical Certification
Statistical Handbook
Valerie J. Skaggs Ann I. Norris Civil Aerospace Medical InstituteFederal Aviation AdministrationOklahoma City, OK 73125
December 2014
Final Report
DOT/FAA/AM-14/15Office of Aerospace MedicineWashington, DC 20591

NOTICE
This document is disseminated under the sponsorship of the U.S. Department of Transportation in the interest
of information exchange. The United States Government assumes no liability for the contents thereof.
___________
This publication and all Office of Aerospace Medicine technical reports are available in full-text from the
Federal Aviation Administration website.

i
Technical Report Documentation Page
1. Report No. 2. Government Accession No. 3. Recipient's Catalog No.
DOT/FAA/AM-14/15 4. Title and Subtitle 5. Report Date
2013 Aerospace Medical Certification Statistical Handbook December 2014 6. Performing Organization Code
7. Author(s) 8. Performing Organization Report No. Skaggs VJ, Norris AI
9. Performing Organization Name and Address 10. Work Unit No. (TRAIS) FAA Civil Aerospace Medical Institute P.O. Box 25082 Oklahoma City, OK 73125
11. Contract or Grant No.
12. Sponsoring Agency name and Address 13. Type of Report and Period Covered Office of Aerospace Medicine Federal Aviation Administration 800 Independence Ave., S.W. Washington, DC 20591
14. Sponsoring Agency Code
15. Supplemental Notes 16. Abstract Introduction. The annual Aerospace Medical Certification Statistical Handbook reports descriptive characteristics of all active U.S. civil aviation airmen and the aviation medical examiners (AMEs) that perform the required medical examinations. The 2013 annual handbook documents the most recent and most widely relevant data on active civil aviation airmen and AMEs. Methods. Medical certification records from 2008-2013 were selected from the Document Imaging Workflow System (DIWS), which is the FAA medical certification database. All medical data were abstracted from the most recent medical examinations with the exception of medical conditions which were historical and current. Only those with a non-expired medical certificate remained in the dataset. AME records were selected from the Aviation Medical Examiner Information System (AMEIS). The current status of each AME was determined for each year of the study period from 2011-2013, retaining only those with an active status. Airman variables include age, issued and effective medical classes, height, weight, BMI, gender, select medical conditions, special issuances, and FAA region of residence. AME variables include AME type, age, gender, medical specialty, pilot license status, senior examiner status, and region. Results. Airmen: As of December 31, 2013, there were 572,406 medically certified airmen age 16 and older, and 33.8%, 21.0%, and 45.2% were issued a Class 1, Class 2, and Class 3 medical certificate, respectively. Across all medical classes, the average age was 43 years and 93.5% of the airmen were male. The mean BMI for both females and males was 24.1 and 27.2 respectively. Six percent of issued certificates required a special issuance. The most commonly reported medical condition was hypertension with medication at 10.9%. AME: Of the 3,324 active AMEs, 93.3% were civilian, 2.0% federal, and 4.7% military. Nearly 49% reported their medical specialty as family practice. Their average age was 60.3 years; the majority (53.0%) did not hold a pilot license, and 87.7% were male. Summary. This report contains widely requested data on the active U.S. civil airman population. This report is updated annually and is used by the aerospace community, including FAA leadership, aerospace researchers, advocacy groups, legislative staff, and the general public.
17. Key Words 18. Distribution Statement
Pilot Medical Certification, Pilot Demographics, Pilot Medical Conditions, Pilot Statistics, Aviation Medical Examiners
Document is available to the public through the Internet:
www.faa.gov/go/oamtechreports
19. Security Classif. (of this report) 20. Security Classif. (of this page) 21. No. of Pages 22. Price
Unclassified Unclassified 40 Form DOT F 1700.7 (8-72) Reproduction of completed page authorized


iii
CONTENTS
2013 AErOSpACE MEdiCAl CErTifiCATiON STATiSTiCAl HANdbOOk
Introduction . . . . . . . . . . . . . . . . . . . . . . . . . . . . . . . . . . . . . . . . . . . . . . . . . . . . . . . . . . . . . . . . . . . . . . . . . . . . . . . . . 1Methods . . . . . . . . . . . . . . . . . . . . . . . . . . . . . . . . . . . . . . . . . . . . . . . . . . . . . . . . . . . . . . . . . . . . . . . . . . . . . . . . . . . . . 1Results . . . . . . . . . . . . . . . . . . . . . . . . . . . . . . . . . . . . . . . . . . . . . . . . . . . . . . . . . . . . . . . . . . . . . . . . . . . . . . . . . . . . . . . 1Summary . . . . . . . . . . . . . . . . . . . . . . . . . . . . . . . . . . . . . . . . . . . . . . . . . . . . . . . . . . . . . . . . . . . . . . . . . . . . . . . . . . . . . 1 Table 1 . FAA Aviation Medical Examiners by Year and Type . . . . . . . . . . . . . . . . . . . . . . . . . . . . . . . . . . . . . . . . . . . 2Section I . Aviation Medical Examiners . . . . . . . . . . . . . . . . . . . . . . . . . . . . . . . . . . . . . . . . . . . . . . . . . . . . . . . . . . . . 2 Table 2 . Designated FAA Aviation Medical Examiners by Year and Region . . . . . . . . . . . . . . . . . . . . . . . . . . . . . . . 3 Figure 1 . Distribution of Newly Appointed FAA Aviation Medical Examiners by Region and Year . . . . . . . . . . . . . 4 Figure 2 . Distribution of Active FAA Aviation Medical Examiners by Region and Year . . . . . . . . . . . . . . . . . . . . . . 5 Figure 3 . Distribution of Active FAA Aviation Medical Examiners by Region . . . . . . . . . . . . . . . . . . . . . . . . . . . . . 6 Figure 4 . Medical Practice Specialty of Active FAA Aviation Medical Examiners . . . . . . . . . . . . . . . . . . . . . . . . . . . 6 Figure 5 . Gender Distribution of Active FAA Aviation Medical Examiners . . . . . . . . . . . . . . . . . . . . . . . . . . . . . . . 7 Table 3 . Pilot License Type of Active FAA Aviation Medical Examiners . . . . . . . . . . . . . . . . . . . . . . . . . . . . . . . . . . 8 Figure 6 . Pilot License Type of Active FAA Aviation Medical Examiner . . . . . . . . . . . . . . . . . . . . . . . . . . . . . . . . . . 8 Table 4 . Senior Examiner Status of Active FAA Aviation Medical Examiners . . . . . . . . . . . . . . . . . . . . . . . . . . . . . . 9 Figure 7 . Senior Examiner Status of Active FAA Aviation Medical Examiners by Region . . . . . . . . . . . . . . . . . . . . . 9 Table 5 . Age by Gender of Active FAA Aviation Medical Examiners . . . . . . . . . . . . . . . . . . . . . . . . . . . . . . . . . . . 10 Figure 8 . Age Group of Active FAA Aviation Medical Examiners . . . . . . . . . . . . . . . . . . . . . . . . . . . . . . . . . . . . . 10Section II . Airman Medical Certification . . . . . . . . . . . . . . . . . . . . . . . . . . . . . . . . . . . . . . . . . . . . . . . . . . . . . . . . 11 Table 6 . Number of Medical Applications Processed by Year . . . . . . . . . . . . . . . . . . . . . . . . . . . . . . . . . . . . . . . . . 11 Table 7 . Issued and Effective Medical Class by Region . . . . . . . . . . . . . . . . . . . . . . . . . . . . . . . . . . . . . . . . . . . . . . 12 Table 8 . Issued Medical Class by State of Residence and Gender . . . . . . . . . . . . . . . . . . . . . . . . . . . . . . . . . . . . . . 13 Figure 9 . Issued Medical Class by Region and Gender . . . . . . . . . . . . . . . . . . . . . . . . . . . . . . . . . . . . . . . . . . . . . . 14 Table 9 . Age as of 12/31/2013 of all Active Airmen by Effective Medical Class . . . . . . . . . . . . . . . . . . . . . . . . . . . 15 Table 10 . Age Groups of all Active Airmen by Effective Medical Class . . . . . . . . . . . . . . . . . . . . . . . . . . . . . . . . . . 15 Figure 10 . Age Groups as of 12/31/2013 of all Active Airmen . . . . . . . . . . . . . . . . . . . . . . . . . . . . . . . . . . . . . . . . 16 Figure 11 . Age Groups as of 12/31/2013 by Effective Medical Class for all Active Airmen . . . . . . . . . . . . . . . . . . . 16 Table 11 . Age at Exam Summary Statistics for Active Airmen by Issued Medical Class . . . . . . . . . . . . . . . . . . . . . 17 Table 12 . Age Groups for all Active Airmen by Issued Medical Class . . . . . . . . . . . . . . . . . . . . . . . . . . . . . . . . . . . 17 Figure 12 . Age Group of all Active Airmen at Time of Exam . . . . . . . . . . . . . . . . . . . . . . . . . . . . . . . . . . . . . . . . . 18 Figure 13 . Age Groups by Issued Medical Class for all Active Airmen at Time of Exam . . . . . . . . . . . . . . . . . . . . . 19 Table 13 . Age at Time of Exam by Issued Medical Class and Gender . . . . . . . . . . . . . . . . . . . . . . . . . . . . . . . . . . . 19 Figure 14 . Age Group at Time of Exam by Gender and Issued Medical Class . . . . . . . . . . . . . . . . . . . . . . . . . . . . 20 Table 14 . Height (inches) of all Active Airmen by Gender and Issued Medical Class . . . . . . . . . . . . . . . . . . . . . . . 21 Table 15 . Height (inches) by Issued Medical Class and Gender . . . . . . . . . . . . . . . . . . . . . . . . . . . . . . . . . . . . . . . 21 Figure 15 . Height (inches) by Gender and Issued Medical Class . . . . . . . . . . . . . . . . . . . . . . . . . . . . . . . . . . . . . . 22 Figure 16 . Height (inches) by Issued Medical Class – Females only . . . . . . . . . . . . . . . . . . . . . . . . . . . . . . . . . . . . 23 Figure 17 . Height (inches) by Issued Medical Class – Males only . . . . . . . . . . . . . . . . . . . . . . . . . . . . . . . . . . . . . . 23 Table 16 . Weight (pounds) of all Active Airmen by Gender and Issued Medical Class . . . . . . . . . . . . . . . . . . . . . . 24 Table 17 . Weight (pounds) by Issued Medical Class and Gender . . . . . . . . . . . . . . . . . . . . . . . . . . . . . . . . . . . . . . 24 Figure 18 . Weight (pounds) by Gender and Issued Medical Class . . . . . . . . . . . . . . . . . . . . . . . . . . . . . . . . . . . . . 25 Figure 19 . Weight (pounds) by Issued Medical Class – Females only . . . . . . . . . . . . . . . . . . . . . . . . . . . . . . . . . . . 26 Figure 20 . Weight (pounds) by Issued Medical Class – Males only . . . . . . . . . . . . . . . . . . . . . . . . . . . . . . . . . . . . . 26 Table 18 . BMI of all Active Airmen by Gender and Issued Medical Class . . . . . . . . . . . . . . . . . . . . . . . . . . . . . . . 27

iv
Table 19 . BMI Category by Issued Medical Class and Gender . . . . . . . . . . . . . . . . . . . . . . . . . . . . . . . . . . . . . . . . 27 Figure 21 . BMI by Gender and Issued Medical Class . . . . . . . . . . . . . . . . . . . . . . . . . . . . . . . . . . . . . . . . . . . . . . . 28 Figure 22 . BMI by Issued Medical Class – Females only . . . . . . . . . . . . . . . . . . . . . . . . . . . . . . . . . . . . . . . . . . . . 29 Figure 23 . BMI by Issued Medical Class – Males only . . . . . . . . . . . . . . . . . . . . . . . . . . . . . . . . . . . . . . . . . . . . . . 29 Table 20 . Special Issuance by Issued Medical Class, Gender, Age, and Body Mass Index . . . . . . . . . . . . . . . . . . . . 30 Figure 24 . Special Issuance by Issued Medical Class . . . . . . . . . . . . . . . . . . . . . . . . . . . . . . . . . . . . . . . . . . . . . . . . 31 Figure 25 . Special Issuance by Age Group at Time of Exam . . . . . . . . . . . . . . . . . . . . . . . . . . . . . . . . . . . . . . . . . . 31 Figure 26 . Special Issuance by BMI Category . . . . . . . . . . . . . . . . . . . . . . . . . . . . . . . . . . . . . . . . . . . . . . . . . . . . 32 Table 21 . Top 15 Reported Medical Conditions . . . . . . . . . . . . . . . . . . . . . . . . . . . . . . . . . . . . . . . . . . . . . . . . . . 33 Table 22 . Medical Conditions by Issued Medical Class . . . . . . . . . . . . . . . . . . . . . . . . . . . . . . . . . . . . . . . . . . . . . 34

1
2013 AErOSpACE MEdiCAl CErTifiCATiON STATiSTiCAl HANdbOOk
iNTrOduCTiON
The annual Aerospace Medical Certification Statistical Hand-book reports descriptive characteristics of all active U .S . civil aviation airmen and the aviation medical examiners (AMEs) that perform the required medical examinations . The 2013 annual handbook documents the most recent and most widely relevant data on active civil aviation airmen and AMEs .
METHOdS
Medical certification records from 2008-2013 were selected from the Document Imaging Workflow System (DIWS), which is the FAA medical certification database . All medical data were abstracted from the most recent medical examinations with the exception of medical conditions which were historical and cur-rent . Only those with a non-expired medical certificate remained in the dataset .
AME records were selected from the Aviation Medical Exam-iner Information System (AMEIS) . The current status of each AME was determined for each year of the study period from 2011-2013, retaining only those with an active status .
Airman variables include age, issued and effective medical classes, height, weight, BMI, gender, select medical conditions, special issuances, and FAA region of residence . AME variables include AME type, age, gender, medical specialty, pilot license status, senior examiner status, and region .
rESulTS
Airmen . As of December 31, 2013, there were 572,406 medically certified airmen age 16 and older, and 33 .8%, 21 .0%, and 45 .2% were issued a Class 1, Class 2, and Class 3 medical certificate, respectively . Across all medical classes, the average age was 43 .0 years and 93 .5% of the airmen were male . The mean BMI for both females and males was 24 .1 and 27 .2 respectively . Six percent of issued certificates required a special issuance . The most commonly reported medical condition was hypertension with medication at 10 .9% .
AMEs. Of the 3,324 active AMEs, 93 .3% were civilian, 2 .0% federal, and 4 .7% military . Nearly 49% reported their medical specialty as family practice . Their average age was 60 .3 years; the majority (53 .0%) did not hold a pilot license, and 87 .7% were male .
SuMMAry
This report contains widely requested data on the active U .S . civil airman population . This report is updated annually and is used by the aerospace community, including FAA leadership, aerospace researchers, advocacy groups, legislative staff, and the general public .

2
SECTiON i. AviATiON MEdiCAl ExAMiNErS
This section characterizes the aviation medical examiners during 2013 with some comparative data from 2011 and 2012 . All analyses represent data through December 31, 2013 unless otherwise noted . Data may slightly fluctuate annually from systematic changes and corrections to the records .
An aviation medical examiner (AME) is a physician authorized by the Federal Aviation Administration (FAA) to perform airmen
physical examinations for issuance of FAA medical certificates . These physicians are designated according to the geographical distribution of airmen . There are also military facilities (installa-tions) designated to perform FAA airmen examinations of military personnel for issuance of second- and third-class certificates .
AME seminars are held in each region and at Oklahoma City’s Civil Aerospace Medical Institute to acquaint these physicians with the regulations and procedures governing the issuance of FAA medical certificates .
1
Table 1. FAA Aviation Medical Examiners by Year and Type
AME Type
2011 Number
(Percent of Total)
2012 Number
(Percent of Total)
2013 Number
(Percent of Total)
Civilian 3,272 (94.2)
3,218 (93.8)
3,102 (93.3)
Federal 76 (2.2)
68 (2.0)
67 (2.0)
Military 125 (3.6)
145 (4.2)
155 (4.7)
Total 3,473 3,431 3,324
Table 1. FAA Aviation Medical Examiners by Year and Type.

3
2
Table 2. Designated FAA Aviation Medical Examiners by Year and Region
Region
Newly Appointed Number
(Percent of Total by Year)
All Active Number
(Percent of Total by Year) 2011 2012 2013 2011 2012 2013
Alaskan 1
(0.8) 1
(0.6) 1
(0.8) 65
(1.9) 63
(1.8) 54
(1.6)
Central 2
(1.7) 8
(5.0) 5
(3.8) 174
(5.0) 177
(5.2) 170
(5.1)
Eastern 2
(1.7) 11
(6.9) 9
(6.8) 379
(10.9) 373
(10.9) 355
(10.7)
Federal/Official 2
(1.7) 2
(1.3) 3
(2.3) 95
(2.7) 88
(2.6) 87
(2.6)
Great Lakes 13
(10.7) 16
(10.1) 16
(12.0) 490
(14.1) 475
(13.8) 459
(13.8)
International 25
(20.7) 16
(10.1) 19
(14.3) 318
(9.2) 321
(9.4) 320
(9.6)
Military 26
(21.5) 43
(27.0) 28
(21.1) 122
(3.5) 142
(4.1) 152
(4.6)
New England 2
(1.7) 7
(4.4) 2
(1.5) 117
(3.4) 115
(3.4) 102
(3.1)
Northwest Mountain
12 (9.9)
11 (6.9)
8 (6.0)
346 (10.0)
336 (9.8)
318 (9.6)
Southern 14
(11.6) 17
(10.7) 20
(15.0) 677
(19.5) 665
(19.4) 655
(19.7)
Southwest 20
(16.5) 18
(11.3) 13
(9.8) 410
(11.8) 398
(11.6) 383
(11.5)
Western-Pacific 2
(1.7) 9
(5.7) 9
(6.8) 280
(8.1) 278
(8.1) 269
(8.1)
Total 121 159 133 3,473 3,431 3,324
Table 2. Designated FAA Aviation Medical Examiners by Year and Region

4
6
Figu
re 1
. Dis
tribu
tion
of N
ewly
App
oint
ed F
AA A
viat
ion
Med
ical
Exa
min
ers
by R
egio
n an
d Ye
ar
Figu
re 1
. Dis
tribu
tion
of N
ewly
App
oint
ed F
AA
Avia
tion
Med
ical
Exa
min
ers
by R
egio
n an
d Ye
ar

5
Figu
re 2
. Dis
tribu
tion
of A
ctiv
e FA
A Av
iatio
n M
edic
al E
xam
iner
s by
Reg
ion
and
Year
7
Figu
re 2
. Dis
tribu
tion
of A
ctiv
e FA
A A
viat
ion
Med
ical
Exa
min
ers
by R
egio
n an
d Ye
ar

6
8
Figure 3. Distribution of Active FAA Aviation Medical Examiners by Region
Figure 3. Distribution of Active FAA Aviation Medical Examiners by Region
9
Figure 4. Medical Practice Specialty of Active FAA Aviation Medical Examiners
Specialty Percent
Family Practice 48.9 Internal Medicine 18.5 Aerospace Medicine 10.1 Other 7.8 Occupational Medicine 5.8 General Surgery 2.6 Ophthalmology 2.3 Emergency Medicine 1.6 Otorhinolaryngology 1.2 Orthopedic Surgery 1.2 Total 3,324
Figure 4. Medical Practice Specialty of Active FAA Aviation Medical Examiners

7
10
Figure 5. Gender Distribution of Active FAA Aviation Medical Examiners
Figure 5. Gender Distribution of Active FAA Aviation Medical Examiners

8
Figure 6. Pilot License Type of Active FAA Aviation Medical Examiners
12
Figure 6. Pilot License Type of Active FAA Aviation Medical Examiners
4
Table 3. Pilot License Type of Active FAA Aviation Medical Examiners
Pilot License Type Number (Percent)
Commercial – Instrument Flight Rules 142 (4.3)
Commercial 89 (2.7)
Private – Instrument Flight Rules 117 (3.5)
Private 1,051 (31.6)
Student 123 (3.7)
Other 40 (1.2)
None 1,762 (53.0)
Total 3,324
Table 3. Pilot License Type of Active FAA Aviation Medical Examiners

9
14
Figure 7. Senior Examiner Status of Active FAA Aviation Medical Examiners by Region
Figure 7. Senior Examiner Status of Active FAA Aviation Medical Examiners by Region
5
Table 4. Senior Examiner Status of Active FAA Aviation Medical Examiners
Senior Examiner
Number (Percent)
Yes 2,081 (62.6)
No 1,243 (37.4)
Total 3,324
Table 4. Senior Examiner Status of Active FAA Aviation Medical Examiners

10
16
Figure 8. Age Group of Active FAA Aviation Medical Examiners
Figure 8. Age Group of Active FAA Aviation Medical Examiners
6
Table 5. Age by Gender of Active FAA Aviation Medical Examiners
Number Mean Median Standard Deviation Minimum Maximum
Overall 3,324 60.3 60.5 11.3 29.0 91.1 Gender Female 308 52.6 53.1 9.3 30.7 79.3
Male 2,916 61.0 61.1 11.2 29.0 91.1
Not Reported 100 64.8 63.9 9.1 40.8 90.8
Table 5. Age by Gender of Active FAA Aviation Medical Examiners

11
SECTiON ii. AirMAN MEdiCAl CErTifiCATiON
The Aerospace Medical Certification Division is the central screening facility and repository within the Federal Aviation Administration for the collection, investigation, adjudication, and analysis of medical data .
Activities of the Aerospace Medical Certification Division are presented in this section . Data are presented by calendar year and represent the most recent medical examination data for all active civil aviation airmen in the United States and its territories as of December 31, 2013 . Data may slightly fluctuate annually from systematic changes and corrections to the records .
Class issued represents the medical class certificate that was issued at the time of the examination . As of July 24, 2008, if the airman is under 40, first- and second-class certificates are valid for 1 year and third-class certificates are valid for 5 years . If the airman is 40 and older, first-class certificates are valid for
6 months, second-class for 1 year, and third-class for 2 years . The length of certificate validity varies for those requiring a special issuance .
Effective medical class is determined by class issued, the age of the airman, time since exam, and whether the airman had a time limited certificate . A certificate can be issued as a higher class (i .e . first-class) and become valid as a lower class certificate (i .e . third-class) as the validity period expires for each higher class .
All medical data were abstracted from the most recent medical examinations with the exception of medical conditions . Medi-cal conditions are determined by whether the airman has ever reported the condition on any past or current medical exami-nation . Body mass index (BMI) classifications are as follows: Underweight (less than 18 .5), Normal (18 .5 to 24 .9), Overweight (25 to 29 .9), and Obese (greater than or equal to 30) .
7
Table 6. Number of Medical Applications Processed by Year
Year Number of
Applications Percent Change From
Previous Year 2003 444,732 N/A 2004 444,250 -0.1 2005 438,415 -1.3 2006 440,271 0.4 2007 452,592 2.8 2008 425,273 -6.0 2009 397,170 -6.6 2010 394,720 -0.6 2011 400,124 1.4 2012 396,332 -0.9 2013 394,404 -0.5
*Policy change July 24, 2008 lengthened the time of certificate validity for those under 40 years of age.
Table 6. Number of Medical Applications Processed by Year

12
Tabl
e 7.
Issu
ed a
nd E
ffect
ive M
edic
al C
lass
by
Regi
on
Reg
ion
*
Firs
t S
econ
d Th
ird
Tota
l Act
ive A
irmen
E
ffect
ive C
lass
Effe
ctive
Cla
ss
E
ffect
ive
Cla
ss
Effe
ctive
Cla
ss
1st
Cla
ss
Cer
tifie
d 1
2 3
2nd
Cla
ss
Cer
tifie
d 2
3
3rd
Cla
ss
Cer
tifie
d 3
Tota
l A
irmen
C
ertif
ied
Per
cent
of
Tot
al
Airm
en
1 2
3
Ala
skan
1,
953
1,53
2 15
0 27
1 2,
059
1,40
1 65
8 3,
827
3,82
7 7,
839
1.4
1,53
2 1,
551
4,75
6 C
entra
l 4,
840
3,35
8 51
9 96
3 5,
320
3,28
7 2,
033
12,6
81
12,6
81
22,8
41
4.0
3,35
8 3,
806
15,6
77
Eas
tern
18
,823
13
,318
1,
412
4,09
3 12
,561
7,
184
5,37
7 30
,355
30
,355
61
,739
10
.8
13,3
18
8,59
6 39
,825
G
reat
Lak
es
26,3
53
18,0
75
1,86
7 6,
411
13,9
57
8,19
0 5,
767
36,6
22
36,6
22
76,9
32
13.4
18
,075
10
,057
48
,800
N
ew E
ngla
nd
6,00
9 4,
388
419
1,20
2 3,
710
2,21
4 1,
496
10,3
71
10,3
71
20,0
90
3.5
4,38
8 2,
633
13,0
69
Nor
thw
est-
Mou
ntai
n 19
,067
13
,854
1,
460
3,75
3 13
,812
7,
977
5,83
5 25
,758
25
,758
58
,637
10
.3
13,8
54
9,43
7 35
,346
S
outh
ern
43,4
33
30,9
58
3,75
5 8,
720
24,8
67
15,2
11
9,65
6 49
,354
49
,354
11
7,65
4 20
.6
30,9
58
18,9
66
67,7
30
Sou
thw
est
21,4
74
15,0
90
1,90
7 4,
477
15,9
03
9,89
8 6,
005
31,4
19
31,4
19
68,7
96
12.0
15
,090
11
,805
41
,901
W
este
rn-P
acifi
c 24
,067
16
,590
2,
084
5,39
3 18
,115
10
,771
7,
344
39,4
57
39,4
57
81,6
39
14.3
16
,590
12
,855
52
,194
US
Tot
al
166,
019
117,
163
13,5
73
35,2
83
110,
304
66,1
33
44,1
71
239,
844
239,
844
516,
167
90.2
11
7,16
3 79
,706
31
9,29
8
Mili
tary
12
3
1 8
1,94
5 71
1 1,
234
3,81
2 3,
812
5,76
9 1.
0 3
712
5,05
4 In
tern
atio
nal
27,2
39
10,9
09
2,00
3 14
,327
7,
973
3,30
2 4,
671
14,8
99
14,8
99
50,1
11
8.8
10,9
09
5,30
5 33
,897
Tota
l 19
3,27
0 12
8,07
5 15
,577
49
,618
12
0,22
2 70
,146
50
,076
25
8,55
5 25
8,55
5 57
2,04
7 10
0 12
8,07
5 85
,723
35
8,24
9
Per
cent
of T
otal
C
ertif
ied
Airm
en
33.8
21.0
45
.2
100.
0 22
.4
15.0
62
.6
* 35
9 ai
rmen
with
unk
now
n re
gion
Ta
ble
7. Is
sued
and
Effe
ctiv
e M
edic
al C
lass
by
Reg
ion

13
8
Table 8. Issued Medical Class by State of Residence and Gender
State of Residence *
Issued Medial Class First Second Third Total Airmen
Female Male Female Male Female Male Female Male
Alabama 34 1,138 82 2,313 220 3,621 336 7,072 Alaska 154 1,799 145 1,914 398 3,429 697 7,142 Arizona 368 5,981 228 3,387 503 6,420 1,099 15,788 Arkansas 47 861 38 1,350 142 2,335 227 4,546 California 968 12,809 764 11,352 2,361 26,730 4,093 50,891 Colorado 484 6,062 188 2,540 549 5,793 1,221 14,395 Connecticut 74 1,503 50 792 152 2,450 276 4,745 Delaware 26 374 11 268 43 556 80 1,198 District of Columbia 11 130 10 74 39 272 60 476 Florida 1,188 19,030 572 10,053 1,701 18,476 3,461 47,559 Georgia 344 7,253 172 3,123 432 6,273 948 16,649 Hawaii 152 1,293 72 696 63 605 287 2,594 Idaho 45 767 73 1,314 163 2,134 281 4,215 Illinois 409 5,462 175 2,538 428 6,414 1,012 14,414 Indiana 180 2,911 84 1,478 247 4,039 511 8,428 Iowa 27 634 49 1,027 171 2,766 247 4,427 Kansas 61 1,190 82 1,574 268 3,293 411 6,057 Kentucky 123 2,246 37 844 160 2,126 320 5,216 Louisiana 49 1,175 56 1,594 139 2,324 244 5,093 Maine 29 455 29 519 79 1,121 137 2,095 Maryland 100 1,741 126 1,479 352 3,525 578 6,745 Massachusetts 138 1,841 74 1,196 322 3,811 534 6,848 Michigan 283 4,058 119 2,055 410 5,824 812 11,937 Minnesota 280 4,205 139 1,952 304 4,871 723 11,028 Mississippi 46 926 36 969 129 1,881 211 3,776 Missouri 124 2,188 78 1,779 279 3,951 481 7,918 Montana 47 619 61 1,001 146 1,738 254 3,358 Nebraska 31 585 16 715 113 1,840 160 3,140 Nevada 134 2,179 89 1,392 227 2,318 450 5,889 New Hampshire 69 1,308 53 637 94 1,304 216 3,249 New Jersey 163 2,607 104 1,413 254 3,682 521 7,702 New Mexico 27 517 76 940 143 1,647 246 3,104 New York 283 4,259 171 2,580 572 7,066 1,026 13,905 North Carolina 231 4,038 120 2,372 398 5,869 749 12,279 North Dakota 57 1,371 36 782 64 1,128 157 3,281 Ohio 228 4,416 158 2,337 460 6,553 846 13,306 Oklahoma 71 1,435 110 1,749 300 3,907 481 7,091 Oregon 115 1,461 170 2,265 323 3,718 608 7,444 Pennsylvania 236 4,440 214 2,744 435 6,328 885 13,512 Rhode Island 24 277 10 139 29 430 63 846 South Carolina 78 1,744 62 1,227 185 2,864 325 5,835 South Dakota 24 316 24 570 58 981 106 1,867 Tennessee 189 4,022 150 2,319 284 4,113 623 10,454 Texas 728 16,564 589 9,401 1,504 18,978 2,821 44,943 Utah 146 2,907 150 2,044 130 2,185 426 7,136 Vermont 21 270 13 198 38 541 72 1,009 Virginia 248 3,854 167 2,677 520 5,634 935 12,165 Washington 438 5,706 237 3,351 598 7,203 1,273 16,260 West Virginia 17 277 21 392 66 886 104 1,555 Wisconsin 114 2,039 89 1,421 355 4,486 558 7,946 Wyoming 15 255 25 393 82 996 122 1,644 US Territories 53 944 38 610 55 900 146 2,454 Military 0 12 75 1,870 367 3,445 442 5,327 International 1,569 25,670 374 7,599 1,040 13,859 2,983 47,128 Total 11,100 182,124 6,891 113,318 18,894 239,639 36,885 535,081 *440 airmen missing state
Table 8. Issued Medical Class by State of Residence and Gender

14
19
Figure 9. Issued Medical Class by Region and Gender
Figure 9. Issued Medical Class by Region and Gender

15
10
Table 9. Age as of 12/31/2013 of all Active Airmen by Effective Medical Class
Effective Medical Class Number of airmen Mean Median Standard
Deviation First 128,092 43.9 45.2 12.4
Second 85,746 49.5 50.3 13.7
Third 358,568 43.3 41.0 16.8 All Classes 572,406 44.4 44.1 15.6
Table 9. Age as of 12/31/2013 of all Active Airmen by Effective Medical Class
11
Table 10. Age Groups of all Active Airmen by Effective Medical Class
Age Group
(as of 12/31/2013)
Effective Medical Class Number (Percent)
First Second Third
16-19 3,067 (2.39)
1,356 (1.58)
10,493 (2.93)
20-24 6,781 (5.29)
3,427 (4.00)
46,323 (12.92)
25-29 11,010 (8.60)
4,629 (5.40)
49,322 (13.76)
30-34 14,161 (11.06)
4,892 (5.71)
37,162 (10.36)
35-39 14,137 (11.04)
4,932 (5.75)
30,271 (8.44)
40-44 14,341 (11.20)
10,244 (11.95)
29,344 (8.18)
45-49 17,305 (13.51)
12,614 (14.71)
23,062 (6.43)
50-54 19,469 (15.20)
12,583 (14.67)
28,737 (8.01)
55-59 16,535 (12.91)
10,889 (12.70)
30,990 (8.64)
60-64 8,914 (6.96)
8,291 (9.67)
27,115 (7.56)
65+ 2,372 (1.85)
11,889 (13.87)
45,749 (12.76)
Total 128,092 (22.38)
85,746 (14.98)
358,568 (62.64)
Table 10. Age Groups of all Active Airmen by Effective Medical Class

16
21
Figure 10. Age Groups as of 12/31/2013 of all Active Airmen
Figure 10. Age Groups as of 12/31/2013 of all Active Airmen
22
Figure 11. Age Groups as of 12/31/2013 by Effective Medical Class for all Active Airmen
Figure 11. Age Groups as of 12/31/2013 by Effective Medical Class for all Active Airmen

17
Table 11. Age at Exam Summary Statistics for Active Airmen by Issued Medical Class
Table 11. Age at Exam Summary Statistics for Active Airmen by Issued Medical Class
Issued Medical Class Number of Airmen Mean Median Standard Deviation First 193,392 40.4 40.8 13.8
Second 120,280 43.6 43.7 16.0
Third 258,734 44.7 45.8 17.6
All Classes 572,406 43.0 43.3 16.2
Table 12. Age Groups for all Active Airmen by Issued Medical Class
Table 12. Age Groups for all Active Airmen by Issued Medical Class
Age Group
(at time of exam)
Issued Medical Class Number
(Percent) First Second Third
16-19 13,058 (6.75)
6,902 (5.74)
17,898 (6.92)
20-24 20,495 (10.60)
12,335 (10.26)
30,990 (11.98)
25-29 21,411 (11.07)
12,498 (10.39)
23,525 (9.09)
30-34 21,302 (11.01)
10,609 (8.82)
19,342 (7.48)
35-39 18,286 (9.46)
11,257 (9.36)
21,354 (8.25)
40-44 18,923 (9.78)
9,285 (7.72)
13,710 (5.30)
45-49 22,635 (11.70)
11,522 (9.58)
20,129 (7.78)
50-54 23,443 (12.12)
12,380 (10.29)
25,515 (9.86)
55-59 19,145 (9.90)
11,360 (9.44)
26,967 (10.42)
60-64 11,129 (5.75)
9,215 (7.66)
22,732 (8.79)
65+ 3,565 (1.84)
12,917 (10.74)
36,572 (14.13)
Total 193,392 (33.79)
120,280 (21.01)
258,734 (45.20)

18
24
Figure 12. Age Group of all Active Airmen at Time of Exam
Figure 12. Age Group of all Active Airmen at Time of Exam

19
26
Figure 13. Age Groups by Issued Medical Class for all Active Airmen at Time of Exam
Figure 13. Age Groups by Issued Medical Class for all Active Airmen at Time of Exam
Table 13. Age at Time of Exam by Issued Medical Class and Gender
Age Group
Issued Medical Class First Second Third Total Airmen
Female Male Female Male Female Male Female Male 16-19 1,527 11,531 910 5,992 2,633 15,265 5,070 32,788 20-24 1,820 18,675 1,072 11,263 3,344 27,646 6,236 57,584 25-29 1,608 19,803 1,051 11,447 2,254 21,271 4,913 52,521 30-34 1,528 19,774 803 9,806 1,708 17,634 4,039 47,214 35-39 1,132 17,154 754 10,503 1,634 19,720 3,520 47,377 40-44 956 17,967 460 8,825 884 12,826 2,300 39,618 45-49 994 21,641 491 11,031 1,180 18,949 2,665 51,621 50-54 868 22,575 503 11,877 1,511 24,004 2,882 58,456 55-59 510 18,635 379 10,981 1,468 25,499 2,357 55,115 60-64 152 10,977 258 8,957 1,037 21,695 1,447 41,629
65+ 19 3,546 218 12,699 1,264 35,308 1,501 51,553 Total 11,114 182,278 6,899 113,381 18,917 239,817 36,930 535,476
Table 13. Age at Time of Exam by Issued Medical Class and Gender

20
28 Figure 14. Age Group at Time of Exam by Gender and Issued Medical Class
Figure 14. Age Group at Time of Exam by Gender and Issued Medical Class

21
Table 14. Height (inches) of all Active Airmen by Gender and Issued Medical Class Issued Medical Class* Number of
Airmen Mean Median Standard
Deviation
First Females 11,114 65.5 65.0 2.7
Males 182,272 70.6 71.0 2.7
Second Females 6,899 65.4 65.0 2.9
Males 113,379 70.5 70.0 2.7
Third Females 18,915 65.4 65.0 2.9
Males 239,798 70.5 70.0 2.8
All Classes Females 36,928 65.4 65.0 2.9
Males 535,449 70.5 71.0 2.7 *29 airmen missing height
Table 14. Height (inches) of all Active Airmen by Gender and Issued Medical Class
Table 15. Height (inches) by Issued Medical Class and Gender
Height*
Issued Medical Class First Second Third Total Airmen
Female Male Female Male Female Male Female Male <59 61 161 51 133 135 295 247 589
59 46 47 38 73 99 141 183 261 60 175 114 126 130 383 257 684 501 61 352 96 219 100 682 241 1,253 437 62 757 180 547 142 1,484 392 2,788 714 63 1,069 387 704 282 1,971 761 3,744 1,430 64 1,556 1,251 1,018 790 2,618 1,912 5,192 3,953 65 1,596 2,685 952 1,787 2,605 3,997 5,153 8,469 66 1,697 6,381 1,023 4,186 2,647 8,826 5,367 19,393 67 1,421 11,181 798 6,866 2,153 14,976 4,372 33,023 68 989 17,627 568 10,855 1,587 23,106 3,144 51,588 69 614 22,142 351 14,079 1,010 28,761 1,975 64,982 70 405 27,500 223 17,296 662 36,610 1,290 81,406 71 191 24,495 118 15,659 359 32,987 668 73,141 72 110 27,205 91 16,867 254 34,737 455 78,809 73 36 16,161 31 9,561 97 20,441 164 46,163 74 18 12,351 21 7,363 84 15,458 123 35,172 75 8 6,446 10 3,684 43 8,122 61 18,252 76 9 3,759 5 2,180 26 4,791 40 10,730 77 1 1,298 2 788 6 1,705 9 3,791
78+ 3 805 3 558 10 1,282 16 2,645 Total 11,114 182,272 6,899 113,379 18,915 239,798 36,928 535,449 *29 airmen missing height
Table 15. Height (inches) by Issued Medical Class and Gender

22
30
Figure 15. Height (inches) by Gender and Issued Medical Class
Figure 15. Height (inches) by Gender and Issued Medical Class

23
31
Figure 16. Height (inches) by Issued Medical Class – Females only Figure 16. Height (inches) by Issued Medical Class – Females only
32 Figure 17. Height (inches) by Issued Medical Class – Males only
Figure 17. Height (inches) by Issued Medical Class – Males only

24
Table 16. Weight (pounds) of all Active Airmen by Gender and Issued Medical Class
Issued Medical Class* Number of Airmen Mean Median Standard
Deviation
First Females 11,111 144.6 139.0 28.4
Males 182,260 190.2 187.0 33.0
Second Females 6,899 149.6 143.0 32.2
Males 113,371 194.6 191.0 34.3
Third Females 18,915 147.4 141.0 30.3
Males 239,798 193.6 190.0 34.6
All Classes Females 36,925 147.0 140.0 30.2
Males 535,429 192.6 190.0 34.0 *52 missing weight
Table 16. Weight (pounds) of all Active Airmen by Gender and Issued Medical Class
Table 17. Weight (pounds) by Issued Medical Class and Gender
Weight* Issued Medical Class
First Second Third Total Airmen Female Male Female Male Female Male Female Male
<100 115 53 41 38 143 68 299 159 100-109 407 163 222 66 676 173 1,305 402 110-119 1,140 613 653 272 1,789 669 3,582 1,554 120-129 1,812 1,867 992 955 2,876 2,173 5,680 4,995 130-139 2,091 4,340 1,147 2,308 3,267 4,971 6,505 11,619 140-149 1,686 8,135 1,004 4,242 2,867 9,668 5,557 22,045 150-159 1,180 13,738 779 7,072 2,145 16,311 4,104 37,121 160-169 865 18,784 581 10,435 1,521 23,368 2,967 52,587 170-179 579 23,316 400 13,314 1,101 28,728 2,080 65,358 180-189 432 25,098 309 14,895 800 31,724 1,541 71,717 190-199 272 22,287 228 13,961 532 28,786 1,032 65,034 200-209 164 18,171 148 12,037 343 24,523 655 54,731 210-219 106 14,146 124 9,676 252 19,276 482 43,098 220-229 96 10,393 88 7,547 199 15,065 383 33,005 230-239 52 7,115 56 5,323 140 10,965 248 23,403 240-249 35 4,816 33 3,662 79 7,470 147 15,948 250-259 29 3,240 37 2,586 61 5,301 127 11,127 260-269 17 2,080 15 1,640 45 3,502 77 7,222 270-279 10 1,384 14 1,089 33 2,404 57 4,877
280+ 23 2,521 28 2,253 46 4,653 97 9,427 Total 11,111 182,260 6,899 113,371 18,915 239,798 36,925 535,429 *52 airmen missing weight
Table 17. Weight (pounds) by Issued Medical Class and Gender

25
33
Fi
gure
18.
Wei
ght (
poun
ds) b
y G
ende
r and
Issu
ed M
edic
al C
lass
Figu
re 1
8. W
eigh
t (po
unds
) by
Gen
der a
nd Is
sued
Med
ical
Cla
ss

26
35
Figure 19. Weight (pounds) by Issued Medical Class – Females only Figure 19. Weight (pounds) by Issued Medical Class – Females only
36
Figure 20. Weight (pounds) by Issued Medical Class – Males onlyFigure 20. Weight (pounds) by Issued Medical Class – Males only

27
Table 18. BMI of all Active Airmen by Gender and Issued Medical Class
Issued Medical Class* Number of Airmen Mean Median Standard
Deviation
First Females 11,111 23.7 22.7 4.3
Males 182,255 26.8 26.4 4.2
Second Females 6,899 24.6 23.5 4.9
Males 113,369 27.5 27.1 4.5
Third Females 18,913 24.2 23.2 4.5
Males 239,780 27.4 26.9 4.5
All Classes Females 36,923 24.1 23.1 4.5
Males 535,404 27.2 26.7 4.4 *79 airmen missing BMI
Table 18. BMI of all Active Airmen by Gender and Issued Medical Class
Table 19. BMI Category by Issued Medical Class and Gender
BMI* Issued Medical Class
First Second Third Total Airmen Female Male Female Male Female Male Female Male
Underweight 501 1,680 252 816 695 1,802 1,448 4,298 Normal 7,390 61,160 4,127 32,188 11,895 72,339 23,412 165,687 Overweight 2,297 84,528 1,645 52,358 4,375 108,675 8,317 245,561 Obese 923 34,887 875 28,007 1,948 56,964 3,746 119,858 Total 11,111 182,255 6,899 113,369 18,913 239,780 36,923 535,404 *79 airmen missing BMI and/or gender
Table 19. BMI Category by Issued Medical Class and Gender

28
38 Figure 21. BMI by Gender and Issued Medical Class
Figure 21. BMI by Gender and Issued Medical Class

29
39
Figure 22. BMI by Issued Medical Class – Females only Figure 22. BMI by Issued Medical Class – Females only
Figure 23. BMI by Issued Medical Class – Males only
40
Figure 23. BMI by Issued Medical Class – Males only

30
Table 20. Special Issuance by Issued Medical Class, Gender, Age, and BMI
Special Issuance Yes
(Percent) No
(Percent)
Class Issued
First 9,156 (4.73)
184,236 (95.27)
Second 6,325 (5.26)
113,955 (94.74)
Third 20,588 (7.96)
238,146 (92.04)
Gender Female 1,235
(3.34) 35,695 (96.66)
Male 34,834 (6.51)
500,642 (93.49)
Age at Exam
16-19 482 (1.27)
37,376 (98.73)
20-24 616 (0.97)
63,204 (99.03)
25-29 837 (1.46)
56,597 (98.54)
30-34 980 (1.91)
50,273 (98.09)
35-39 1,250 (2.46)
49,647 (97.54)
40-44 1,774 (4.23)
40,144 (95.77)
45-49 2,925 (5.39)
51,361 (94.61)
50-54 4,586 (7.48)
56,752 (92.52)
55-59 6,050 (10.53)
51,422 (89.47)
60-64 5,835 (13.55)
37,241 (86.45)
65+ 10,734 (20.23)
42,320 (79.77)
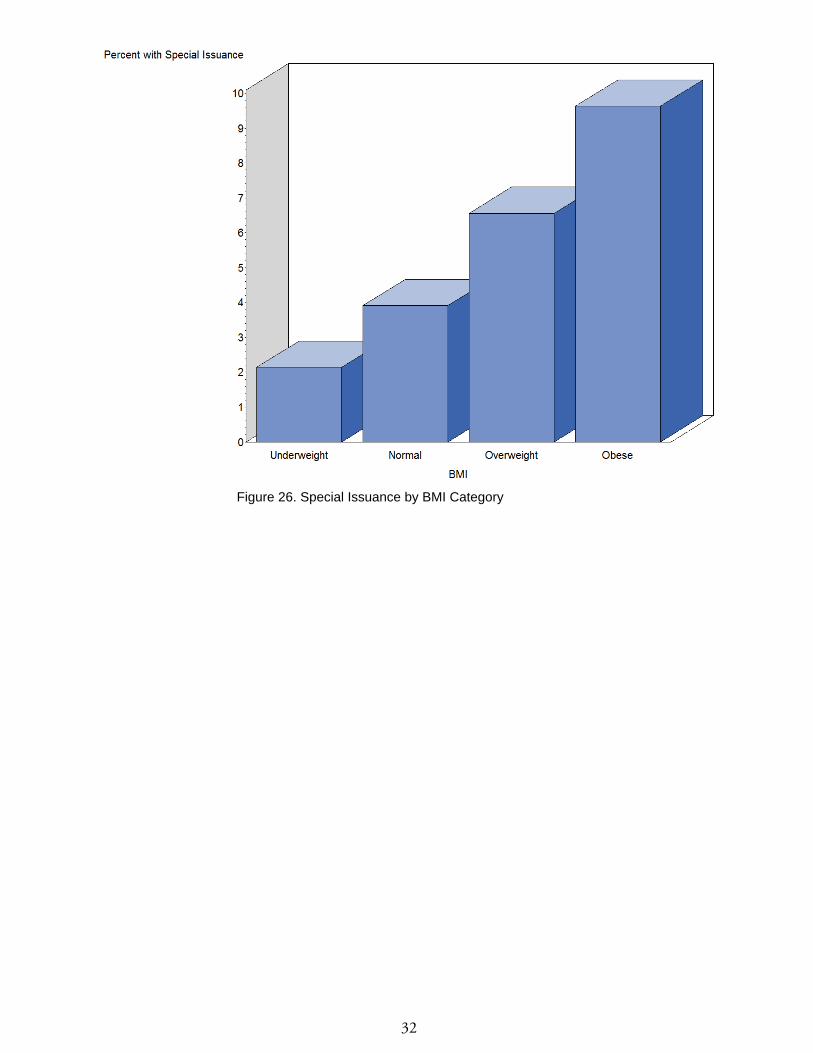
BMI*
Underweight 123 (2.14)
5,623 (97.86)
Normal 7,397 (3.91)
181,702 (96.09)
Overweight 16,645 (6.56)
237,233 (93.44)
Obese 11,903 (9.63)
111,701 (90.37)
Total 36,069 (6.30)
536,337 (93.70)
*79 airmen missing BMI
Table 20. Special Issuance by Issued Medical Class, Gender, Age, and Body Mass Index

31
42
Figure 24. Special Issuance by Issued Medical Class
Figure 24. Special Issuance by Issued Medical Class
43
Figure 25. Special Issuance by Age Group at Time of Exam
Figure 25. Special Issuance by Age Group at Time of Exam
32
44
Figure 26. Special Issuance by BMI Category
Figure 26. Special Issuance by BMI Category

33
Table 21. Top 15 Reported Medical Conditions Pathology Description Number Percent
Hypertension with medication 62,595 10.94 Other miscellaneous allergic conditions* 38,150 6.66 Hernias – inguinal, femoral, umbilical, hiatal 29,328 5.12 Urolithiasis – stones or calculus of kidney, ureter, bladder 23,020 4.02 Other esophagus, stomach, and duodenal conditions – severe gastritis, esophageal reflux, achalasia, GERD, gastroplasty, dysphagia, dyspepsia, thrombus abdomen aorta#
21,645 3.78
Male genital system – prostatic, varicocele, hydrocele, transurethral resection of prostate (TURP), spermatocele, benign prostatic hypertrophy (BPH)
21,070 3.68
Other skin conditions – includes acne, abnormal pigmentation, vitiligo, psoriasis, keratosis, neurofibroma, (basal cell carcinoma), adenoma, ganglio neuroma, fibroma, fibroadenoma, neuroma, Morton’s neuroma, hemangioma‡
15,377 2.69
Other lower extremities conditions – operations, fractures, dislocation, knee replacement, knee reconstruction, ACL reconstruction§
15,340 2.68
Ruptured intervertebral disk, nucleus pulposus, spinal fusion, laminectomy and spinal stenosis, compression disc, other back surgeries
14,530 2.54
Hay fever 13,849 2.42 Asthma 12,096 2.11 Other general heart pathology (abnormal ECG, open heart surgery, etc.). Wolff-Parkinson-White syndrome, ablation, AV block, right bundle branch block, left bundle branch block†
10,899 1.90
Hypothyroidism, underactive thyroid, euthyroid, Hashimoto 10,259 1.79 Arthritis (osteo, gout) -- degenerative joint disease 9,592 1.68 Other intestinal conditions -- diverticulitis, polyposis, appendicitis, appendectomy, colon cancer, rectal cancer, appendix cancer, colon resection
9,551 1.67
* Excludes hay fever and asthma # Excludes ulcers, gastrectomy, lap band staple bypass, gastric bypass, hernias, esophageal
varices ‡ Excludes dermatitis, pilonidal cyst, significant scarring, melanoma, squamous cell carcinoma § Excludes deformity of toes, foot, or leg, diseases (synovitis, arthritis, bursitis, osteomyelitis,
neoplasms, polymyalgia, rheumatica, etc.), rheumatoid arthritis, unstable knee (locked knee, herniated meniscus, no patella)
† Excludes cardiomyopathy, pacemaker, cardiac stents, cardiac angioplasty
Table 21. Top 15 Reported Medical Conditions
34
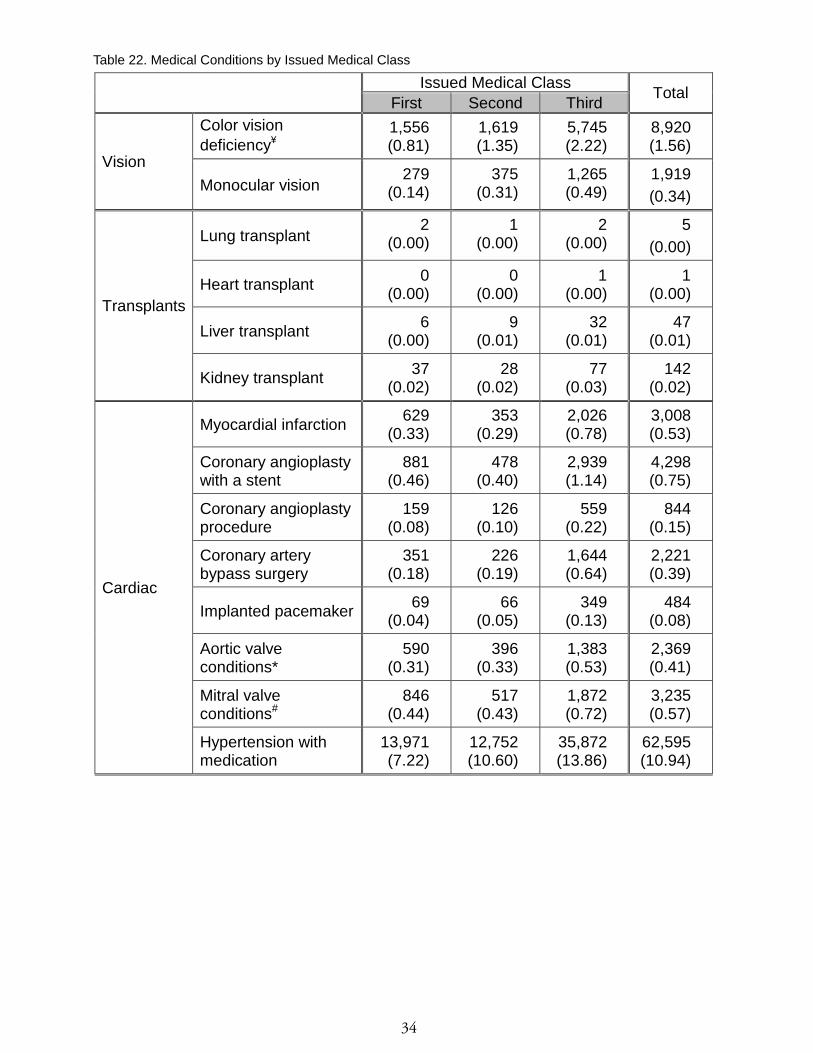
Table 22. Medical Conditions by Issued Medical Class
Table 22. Medical Conditions by Issued Medical Class
Issued Medical Class Total First Second Third
Vision
Color vision deficiency¥
1,556 (0.81)
1,619 (1.35)
5,745 (2.22)
8,920 (1.56)
Monocular vision 279
(0.14) 375
(0.31) 1,265 (0.49)
1,919 (0.34)
Transplants
Lung transplant 2
(0.00) 1
(0.00) 2
(0.00) 5
(0.00)
Heart transplant 0 (0.00)
0 (0.00)
1 (0.00)
1 (0.00)
Liver transplant 6 (0.00)
9 (0.01)
32 (0.01)
47 (0.01)
Kidney transplant 37 (0.02)
28 (0.02)
77 (0.03)
142 (0.02)
Cardiac
Myocardial infarction 629 (0.33)
353 (0.29)
2,026 (0.78)
3,008 (0.53)
Coronary angioplasty with a stent
881 (0.46)
478 (0.40)
2,939 (1.14)
4,298 (0.75)
Coronary angioplasty procedure
159 (0.08)
126 (0.10)
559 (0.22)
844 (0.15)
Coronary artery bypass surgery
351 (0.18)
226 (0.19)
1,644 (0.64)
2,221 (0.39)
Implanted pacemaker 69 (0.04)
66 (0.05)
349 (0.13)
484 (0.08)
Aortic valve conditions*
590 (0.31)
396 (0.33)
1,383 (0.53)
2,369 (0.41)
Mitral valve conditions#
846 (0.44)
517 (0.43)
1,872 (0.72)
3,235 (0.57)
Hypertension with medication
13,971 (7.22)
12,752 (10.60)
35,872 (13.86)
62,595 (10.94)

35
Table 22 Continued. Medical conditions by Issued Medical Class
Medical Class Issued Total First Second Third
Alcohol and Drugs
Alcohol abuse/dependence
2,085 (1.08)
994 (0.83)
1,688 (0.65)
4,767 (0.83)
Drug abuse/dependence
807 (0.42)
533 (0.44)
757 (0.29)
2,097 (0.37)
Alcohol/Drug case monitored
1,129 (0.58)
83 (0.07)
15 (0.01)
1,227 (0.21)
Alcohol related offense‡
10,375 (5.36)
7,072 (5.88)
13,065 (5.05)
30,512 (5.33)
Drug related offense/misuse§
613 (0.32)
584 (0.49)
948 (0.37)
2,145 (0.37)
Other conditions of interest
Sleep apnea 1,985 (1.03)
1,437 (1.19)
3,376 (1.30)
6,798 (1.19)
Applied for SSRI use 104 (0.05)
81 (0.07)
311 (0.12)
496 (0.09)
SSRI special issuance
50 (0.03)
19 (0.02)
72 (0.03)
141 (0.03)
Diabetes† 1,197 (0.62)
1,428 (1.19)
4,455 (1.72)
7,080 (1.24)
¥ Color vision deficiency at initial screening test * Includes aortic valvular disease, aortic stenosis, aortic regurgitation, aortic insufficiency, bicuspid
aortic valve, also replacement, ruptured aorta or lacerated, aortic bruit # Includes mitral valve disease, mitral stenosis, mitral regurgitation, mitral insufficiency. Does not
include valve replacement. ‡ Includes DUI, DWI, public intoxication, wet/reckless, .04-.09 blood alcohol § Includes drug offenses and positive drug test other than Drug Industry Program (Failed Drug Testing) † Controlled by hypoglycemic drugs or insulin
Table 22 Continued. Medical Conditions by Issued Medical Class
