2012 state of aging and disabilities survey - nasuad.org 2012 state… · 2012 state of aging and...
TRANSCRIPT

Another Year of Challenges Tempered by Opportunities
2012 State of Aging and Disabilities Survey

Another Year of Challenges Tempered by Opportunities
2012 State of Aging and Disabilities Survey

National Association of States United for Aging and Disabilities (NASUAD)ii
Table of Contents
Acknowledgements .......................................................................................................................iv
About NASUAD ...............................................................................................................................v
Executive Summary.......................................................................................................................vii
Methodology ..................................................................................................................................1
Themes Emerging from 2012 Survey
Theme 1 The growth of Medicaid managed long term services and supports is accelerating. ...................................................................................2
Theme 2 Participation in Affordable Care Act (ACA) opportunities is rapidly growing. ..............................................................................................5
Theme 3 Limited budgets and growing demand continue to be top concerns to state aging and disability agencies. ............................................12
Theme 4 Agency restructuring continues around the nation. ......................................13
Theme 5 The loss of historical knowledge continues around the nation. ..................15
Overview of State Aging and Disability Agencies
Populations Served by State Agencies ................................................................................17
Funding for State Agencies .................................................................................................18
Approaches to Cost-Sharing by State Agencies .................................................................21
Services Provided by State Agencies ...................................................................................22
Administration of State Agency Services............................................................................28
Conclusions ...................................................................................................................................31
2012 State of Aging and Disabilities Survey: Another Year of Challenges Tempered by Opportunities iii
State-by-State Summary Tables ....................................................................................................33
Table 1 Structure of State Agencies ...............................................................................34
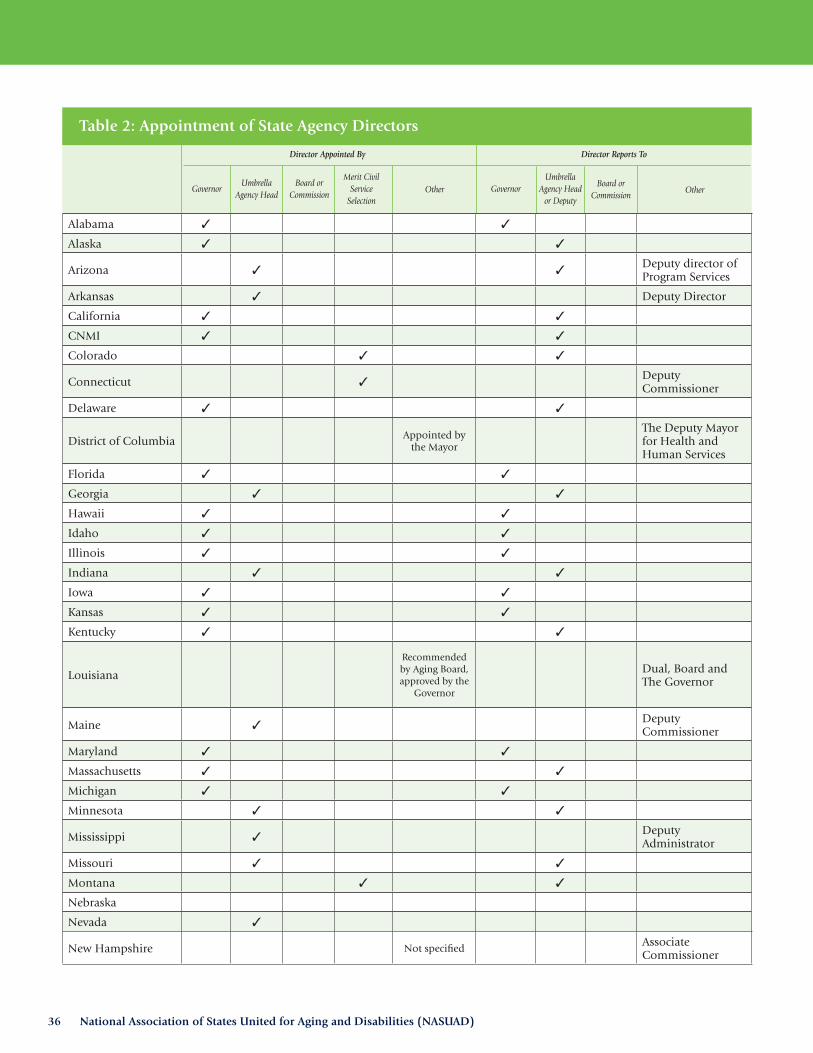
Table 2 Appointment of State Agency Directors ..........................................................36
Table 3 Components of LTSS for Which State Agency is Responsible .......................38
Table 4 Federally Funded, Non-Medicaid Programs/Services Administered by State Agencies...............................................................................................42
Table 5 Sources of Funding for State Agencies ............................................................46
Table 6 Non-Medicaid, State-Funded Only HCBS Administered by State Agencies ....................................................................................................50
Table 7 Types of Evidence-Based Programs Operated by State Agencies and Funding Sources .......................................................................................54
Table 8 Medicaid HCBS Waivers Operated by State Agencies ....................................56
Table 9 Medicaid HCBS Waiver Services Provided by State Agencies, by Who Directs the Services ...........................................................................58
Table 10 Medicaid-Funded Case Management and Other Services Provided by Area Agencies on Aging and Centers for Independent Living ..................62

National Association of States United for Aging and Disabilities (NASUAD)iv
Acknowledgements
F or the past several years, most states have struggled with staff reductions, furlough days, and unrelenting pressure to assure that aging and disability programs function effectively
with fewer resources. In spite of these challenges, staff of the state aging and disability agencies across the country spent considerable time responding to NASUAD’s 2012 State of Aging and Disabilities Survey. NASUAD thanks state agency directors and their staff for their valuable contributions to this report.
Under the leadership of President Lance Robertson, Director of the Oklahoma Aging Services Division, the NASUAD Board of Directors offered support throughout the 2012 survey process. Almost the entire NASUAD staff was involved in the 2012 survey. Project leadership was provided by Diana Scully, Senior Director for State Services, who was ably assisted by Grace Cho, Research Assistant. A special acknowledgement is reserved for Elizabeth Sullivan, our summer intern who spent countless hours reviewing states’ responses, letting NASUAD staff know when follow up was needed, and creating survey-related spreadsheets and charts.
I thank everyone involved in the production of the 2012 report.
Sincerely,
Martha A. Roherty Executive Director

2012 State of Aging and Disabilities Survey: Another Year of Challenges Tempered by Opportunities v
About NASUAD
T he National Association of States United for Aging and Disabilities (NASUAD) was founded in 1964 under the name National Association of State Units on Aging
(NASUA). In 2010, the organization added disabilities to its name in recognition of the fact that member state agencies are responsible for programs serving both older adults and people with disabilities.
Representing the nation’s 56 state and territorial agencies on aging and disabilities, NASUAD’s mission is to design, improve and sustain state systems delivering home and community-based services and supports for older adults and people with disabilities and their family caregivers. NASUAD supports visionary state leadership, the advancement of state systems innovation and the articulation of national policies that support long term services and supports, including home and community-based services.
NASUAD works to:
n Inform policymakers about the current and future status and operations of state systems that support older adults, people with disabilities, and their family caregivers.
n Serve as the vehicle for state agencies to collectively develop and promote public policy and programmatic recommendations for consideration by key federal partners and others involved in the aging and disabilities network.
n Maintain collaborative relationships with: key federal partners, in particular, the U.S. Department of Health and Human Services’ Administration on Community Living (overseeing the Administration on Aging, Administration on Intellectual and Developmental Disabilities, and Office on Disability) and Centers for Medicare and Medicaid Services; aging and disability network partners at the local, state and national levels; and other key national organizations.
n Analyze pertinent federal legislative, regulatory, and administrative actions; and, based on this analysis, inform and advocate with federal partners regarding impacts on state systems that support older adults, people with disabilities and their family caregivers.
n Facilitate the exchange of information and ideas about effective and efficient state and local policy options, program models, service delivery strategies, and management practices.
n Provide general and specialized information consultation, training, technical assistance, and professional development on a full range of policy, program and management challenges facing the states.

National Association of States United for Aging and Disabilities (NASUAD)vi
Board of Directors
Officers of NASUAD’s Board of Directors (2012–13)
President:
Lance Robertson, Director, Aging Services Division, Oklahoma Department of Human Services
Vice President:
Gloria Lawlah, Secretary, Maryland Department of Aging
Secretary:
James Bulot, Director, Division of Aging Services, Georgia Department of Human Services
Treasurer:
Lora Connolly, Director, California Department of Aging

2012 State of Aging and Disabilities Survey: Another Year of Challenges Tempered by Opportunities vii
Executive Summary
L ike the 2009 and 2011 surveys conducted by the National Association of States United for Aging and Disabilities (NASUAD),1 the 2012 survey has captured a snapshot of the
states during a period of change.
State aging and disability agencies have operated within a tumultuous environment for the past several years. They demonstrated resilience in the face of daunting challenges as they participated in a rich array of new opportunities.
Beginning with the 2007 great recession, state agencies faced continuing budgetary challenges. It has become increasingly more difficult to reconcile the needs of older adults and people with disabilities with the resources available to address those needs.
Simultaneously, state agencies had to plan and manage programs against the backdrop of the rapidly growing aging population (leading to increasing demands for service and triggering major loss of knowledgeable, seasoned staff through retirements); a dizzying array of federal and state reforms in the financing and delivery of long term services and support (LTSS), including home and community-based services (HCBS); and a widespread emphasis on the integration and consolidation of agencies and programs.
Themes emerging from the 2012 state of aging and disabilities surveys are similar to themes from the 2011 and 2009 surveys, though there have been a few changes.
n Theme 1—Medicaid managed long term services and supports (MLTSS) are accelerating. In the 2009 survey, six states reported that they had some form of capitated Medicaid MLTSS programs operating in a portion of the state or statewide. As of April 2012, this was the case in 16 states. By 2014, 26 states are projected to have Medicaid MLTSS programs.2
n Theme 2—Participation in Affordable Care Act (ACA) opportunities is growing. The 2011 survey indicated that a significant number of states had limited involvement in ACA-specific efforts. In contrast, the 2012 survey reveals that more states are playing an active role in developing or operating one or more ACA opportunities, including state dual integration demonstrations, health homes for people with chronic conditions, Balancing Incentive Program, Medicaid state plan amendments under Section 1915(i), and Community First Choice Option.
___________
1 State of Aging: State Perspectives on State Units on Aging Policies and Practices (October 2009), NASUAD; and 2011 State of the States Survey: “NASUAD State Aging & Disability Agencies in Times of Change”
2 Saucier P., Kasten, J. et al. (July 2012) The Growth of Managed Long-Term Services and Supports (MLTSS) Programs: A 2012 Update, prepared by Truven Health Analytics for the Centers for Medicaid and Medicaid Services (CMS).

National Association of States United for Aging and Disabilities (NASUAD)viii
n Theme 3—Limited budgets and growing demand continue to be top concerns to state aging and disability agencies. Despite the slightly improving state- level fiscal picture, most state aging and disability agencies remain concerned about budgets and their capacity to meet the demand for services.
n Theme 4—Agency restructuring continues around the nation. State aging and disability agencies continue to restructure their functions and to integrate and consolidate their programs.
n Theme 5—Loss of historical knowledge continues around the nation. State aging and disability agencies continue to experience turnover in leadership. Since the beginning of 2010, 47 new state directors have been appointed. At the same time, these agencies have continued to lose a significant number of employees, as they have become eligible for retirement.

2012 State of Aging and Disabilities Survey: Another Year of Challenges Tempered by Opportunities 1
Methodology
W hile many questions from NASUAD’s 2011 survey were included in the 2012 survey, the 2012 edition was more streamlined. Some questions asked in 2011 were not
asked again in 2012, because the information was not likely to change. A few new disability-related questions were added to the 2012 survey.
Using a web-based survey instrument and related analytic database, NASUAD surveyed all 56 states and territories. Fifty-one state and territory member agencies responded to the 2012 survey.
Each NASUAD senior and policy staff person was assigned a group of states, organized by US Administration for Community Living regions, for response review. First, 2012 responses were compared to 2011 responses. Second, based on these reviews, NASUAD staff developed follow-up questions, and states responded to these questions either electronically or during phone interviews. Finally, state agencies conducted a review of their raw state data organized in a table format.
The report provides a comparison of 2009, 2011 and 2012 data, where possible.

National Association of States United for Aging and Disabilities (NASUAD)2
Themes Emerging from 2012 Survey
N ASUAD’s 2012 State of Aging and Disabilities Survey revealed five key themes regarding the status and activities of state agencies.
Theme 1—The growth of Medicaid managed long term services and supports is accelerating.
Medicaid managed long term services and supports (MLTSS) has notable implications for state aging and disability agencies because of the important roles they play in the delivery and support of Medicaid LTSS. A majority of state agencies operate one or more Medicaid HCBS 1915(c) waivers for elders and people with disabilities; many have roles in the delivery of LTSS funded through the Medicaid state plan; and many are involved in the design and/or implementation of LTSS-related options under the Affordable Care Act (ACA). Key areas of concern to state aging and disability agencies related to MLTSS include whether or not they are included in MLTSS program development; the role that local or regional aging and disability network partners play; and overall impacts on older adults and persons with disabilities.
Information in this section is drawn from a number of sources, including NASUAD surveys, NASUAD’s State Medicaid Integration Tracker3, and a nationwide scan conducted from January through June 2012 for the Centers for Medicare and Medicaid Services (CMS)4. This information is current as of October 2012, however, given the nature of this systems change, for a more detailed and updated breakdown, please visit our State Medicaid Integration Tracker. Tracking efforts by different organizations can yield different results. One explanation for this is that state plans and programs are changing rapidly and survey data reflects information as of a certain point in time. Also, the numerous surveys in this area ask respondents to include different information, such as the populations covered by MLTSS. For example, in NASUAD’s 2012 survey, states were asked not to include or consider people with intellectual/developmental disabilities when responding.
___________
3 State Medicaid Integration Tracker, National Association of States United for Aging and Disabilities: http://www.nasuad.org/medicaid_integration_tracker.html
4 Saucier P., Kasten, J. et al. (July 2012) The Growth of Managed Long-Term Services and Supports (MLTSS) Programs: A 2012 Update, prepared by Truven Health Analytics for the Centers for Medicaid and Medicaid Services (CMS).

2012 State of Aging and Disabilities Survey: Another Year of Challenges Tempered by Opportunities 3
In 2009, six states had some form of capitated MLTSS operating in a portion of the state or statewide. In a 2011 survey, 12 states reported having operating MLTSS programs and 11 states indicated that they plan to implement MLTSS in either 2012 or 2013.5 In 2012, the nationwide scan conducted for CMS, indicated that 16 states (AZ, CA, DE, FL, HI, MA, MI, MN, NC, NM, NY, PA, TN, TX, WA, WI) operate 19 MLTSS programs. By 2014, 26 states are projected to have these programs.6
NASUAD’s 2012 survey and tracking efforts7 indicate that one additional state is operating MLTSS (IL)8 and the expansion of MLTSS is under way in four states (FL, MN, NM, NY). In addition, seven states are working toward implementation of MLTSS for the first-time:
n CMS has approved applications from two states (NH, NJ).
n CMS has not yet approved applications from three states. (KS, NV, OH).9
n MLTSS is in earlier stages of development in two states. (CO, GA).
The role the state aging and disability agencies are playing with respect to MLTSS is evolving. In NASUAD’s 2012 survey, state agencies engaged in MLTSS indicated that they participate in a variety of ways. Several reported that they have been involved throughout the process of planning, development, and implementation of the state’s MLTSS model. Other roles mentioned include serving as the operating agency, outreach to stakeholders, performing functional eligibility and enrollment counseling via Aging and Disability Resource Centers, meeting regularly with the state Medicaid agency, managing nursing home diversion, providing options counseling, and involvement with the dual integration demonstration.
The NASUAD 2012 survey and tracking efforts also reveal the following information about the states engaged in MLTSS:
n States use or plan to use the following Medicaid authority or authorities to operate MLTSS. Some states are listed more than once because they have or are planning to have multiple programs.
• Ten states—Section 1115 (AZ, DE, HI, KS, NJ, NM, NV, NY, TN, TX)
• Six states—Sections 1915(b)+(c) (FL, IL, MI, MN, NM, WI)
___________
5 Cheek, M., Roherty, M., Cho, E., Walls, J., Gifford, K., Fox-Grage, W., Ujvari, K. (February 2012) On the Verge: The Transformation of Long-Term Services and Supports, AARP Public Policy Institute, National Association of States United for Aging and Disabilities, and Health Management Associates.
6 Saucier P., Kasten, J. et al. (July 2012) The Growth of Managed Long-Term Services and Supports (MLTSS) Programs: A 2012 Update, prepared by Truven Health Analytics for the Centers for Medicaid and Medicaid Services (CMS).
7 State Medicaid Integration Tracker, National Association of States United for Aging and Disabilities: http://www.nasuad.org/medicaid_integration_tracker.html
8 In addition, Vermont has had comprehensive, capitated LTSS for a number of years. However, this system is operated directly by the state rather than through private managed care organizations.
9 In Ohio, MLTSS is part of the proposed care coordination demonstration for people who are dually eligible for Medicaid and Medicare.

National Association of States United for Aging and Disabilities (NASUAD)4
• Five states—Section 1915(a) (CA, NC, NY, PA, WA)
• Three states—Sections 1915(a)+(c) (FL, MA)
• One state—Section 1932(a) and 1915(c) (WI)
• Three states—undecided on implementation (CO, NH, OH)
n States operate or plan to operate their Medicaid Managed Care programs in different ways, including which services are offered and which populations are served.
• Sixteen state agencies indicated that their states include or plan to include nursing facilities in MLTSS (AZ, CA, DE, FL, HI, IL, MA, MI, MN, NC, NH, NJ, NM, NY, TN, WI).10
• Thirteen state agencies said their states include or plan to include assisted living facilities in MLTSS (CA, DE, FL, HI, IL, MI, MN, NC, NH, NJ, NM, TX, TN).11
n States also differ in how they geographically operate their MMLTSS programs.
• Eleven state agencies reported that their states are operating or planning to operate MLTSS statewide12 (AZ, DE, FL, HI, MA, MN, NC, NJ, NM, NY, TN).
• One state (NH) is likely to operate statewide and
• One state (WI) covers 85% of the state.
___________
10 Vermont also includes nursing facilities.
11 Vermont also includes assisted living facilities.
12 Vermont, the publicly operated MLTSS program, also is statewide.

2012 State of Aging and Disabilities Survey: Another Year of Challenges Tempered by Opportunities 5
Theme 2—Participation in Affordable Care Act opportunities is growing.
The Affordable Care Act (ACA) includes several LTSS options and health care programs with implications for LTSS populations. Optional Medicaid provisions in ACA that support HCBS include health homes, improved care coordination for dually eligible individuals, Community First Choice under Section 1915(k), amendments to Section 1915(i) which further support HCBS through Medicaid state plan amendments, and the Balancing Incentive Program.
In NASUAD’s 2011 survey, fewer than half the states reported that they were engaged in implementing ACA options relating to LTSS. The majority of responding states indicated that they were not currently pursuing ACA options pending Centers for Medicare and Medicaid Services (CMS) guidance and the legal actions related to the outcome of the Supreme Court decision.
As seen in Figure 1, there is robust participation in ACA programs for LTSS populations in 2012. This information is based on both the 2012 survey and NASUAD’s State Medicaid Integration Tracker.13 The following descriptions provide more information about the status of implementation in the states indicating that they are participating in or pursuing each of these ACA programs:
Figure 1 Overview of State Participation in Affordable Care Act Options that Impact LTSS
October 2012
___________
13 State Medicaid Integration Tracker, National Association of States United for Aging and Disabilities: http://www.nasuad.org/medicaid_integration_tracker.html

National Association of States United for Aging and Disabilities (NASUAD)6
Map 1 Care Coordination for Dually Eligible Individuals
n State with CMS approval for duals care coordination demonstration (MA)
n States that have submitted proposals to CMS (AZ, CA, CO, CT, HI, ID, IL, IA, MI, MN, MO, NC, NM, NV, OH, OK, OR, RI, SC, TN, TX, VT, VA, WA, WI)
n States in conceptualization phase (AL, AR, GA, IN, MD, NH)October 2012
n Care coordination for dually eligible individuals—CMS has approved the duals care coordination demonstration in one state (MA); 26 states have submitted proposals to CMS and six states are in the conceptualization phase. In the 2012 NASUAD survey:
• Twenty-six state agencies reported that the state did not have a duals coordination program before ACA, but they are developing one now.
• With regard to the Medicaid authority under which they are operating or plan to operate, 12 states identified Section 1115, four states said Sections 1915(b) + (c), and seven states checked “other”.
• Three-quarters of the state agencies said they are involved in the duals care coordination demonstrations in various ways: partner/active participant in program development; participating on a stakeholder committee; serving in advisory capacity; assessing impact on current services; SHIP and ADRC initiatives coordinating closely with state Medicaid Agency; involved in selection of managed care organizations; co-facilitator/leader; and assuring support for capacity building at the state agency and area agencies on aging (AAAs).

2012 State of Aging and Disabilities Survey: Another Year of Challenges Tempered by Opportunities 7
___________
14 At least five states (ID, KS, OK, MI, WA) have included health homes as part of their care coordination demonstrations for people who are dually eligible for Medicaid and Medicare. It is possible that additional states, not listed in this report, are including health homes in their dual demonstration proposals.
15 At least five states (ID, KS, OK, MI, WA) have included health homes as part of their care coordination demonstrations for people who are dually eligible for Medicaid and Medicare. It is possible that additional states are including health homes in their dual demonstration proposals.
Map 2 Health Homes for Individuals with Chronic Conditions14
n States with CMS approval (IA, MO, NC, NY, OH, OR, RI)
n States with planning grant to coordinate health homes with Medicaid managed LTSS (AR, AZ, CA, DC, MS, NJ, NM, NV, WA)
n States that have submitted proposal to CMS (AL, IL, ID, ME, MA, OK, WI)
n States in conceptualization phase (CO, DE, GA, HI, KS, MI, MN, ND, NH, TX)October 2012
n Health Homes for individuals with chronic conditions15—Seven states have received CMS approval; nine states have a planning grant to coordinate health homes with Medicaid managed LTSS; seven states have submitted a proposal to CMS; and ten states are in the conceptualization phase. In response to NASUAD’s 2012 survey, state aging and disability agencies described their involvement with health homes in various ways: partner or active participant in development of the program model; part of a team or stakeholder group; serving in consultant role; participant in planning meetings; and informing the process based on experience and expertise in chronic care management and chronic disease self-management programs.

National Association of States United for Aging and Disabilities (NASUAD)8
Map 3 Section 1915(i) HCBS State Plan Amendment
n States with CMS approval (FL, IA, MT, NV, OR, WI)
n States that have submitted proposed state plan amendments to CMS (CA, CT, IN, LA, NC, TX)
n States in conceptualization phase (AK, AL, AR, DC, IL, ID, ME, MA, ND, WA)
n States considering this option (NE, OH)
October 2012
n Section 1915(i) HCBS State Plan Amendment—CMS has approved Medicaid state plan amendments in six states; six states have submitted proposed state plan amendments to CMS; ten states are in the conceptualization phase; and two states are considering this option. Populations and services that are the focus of 1915(i) state plan amendments include:
• Services for people with mental illness—ten states (AL, AR, FL, IN, IA, KY, LA, MT, OR, WI)
• Personal care services or other HCBS for elders and adults with disabilities—five states (CT, ID, NC, OK, TX)
• Services for people with intellectual/developmental disabilities—three states (AL, CA, ID)
• Services provided still under consideration—two states (NE, OH)

2012 State of Aging and Disabilities Survey: Another Year of Challenges Tempered by Opportunities 9
n Balancing Incentive Program (BIP)—CMS has approved eight states for participation in BIP; seven states are in the conceptualization phase; and two states are still considering BIP. In NASUAD’s 2012 survey, state aging and disability agencies described their involvement in BIP in various ways: taking the lead; responsible for day-to-day management; involved in all aspects; serving as co-administrator; serving as part of the team; participating on a stakeholder committee; responsible for point of entry to LTSS; and assisting with proposal writing.
Map 4 Balancing Incentive Program (BIP)
n States with CMS approval (GA, IA, IN, MD, MO, MS, NH, TX)
n States in conceptualization phase (AR, CO, CT, IL, NJ, OH, RI)
n States considering this option (MA, ND)
October 2012

National Association of States United for Aging and Disabilities (NASUAD)10
___________
16 Minnesota has proposed implementing CFCO as part of a broader Section 1115 proposal.
17 In LA, there is a proposed rule regarding CFCO.
Map 5 Community First Choice Option (CFCO)
n State with CMS approval (CA)
n States that have submitted applications to CMS (AZ, MN16)
n States in conceptualization phase (AK, AR, CO, GA, LA17, MA, MD, MT, NY, OR, UT, WA)
n States considering this option (ND, TX)
October 2012
n Community First Choice Option (CFCO)—One state’s CFCO application has been approved by CMS; one state has submitted a CFCO application to CMS; one state has proposed implementing CFCO as part of a broader Section 1115 proposal; in one state a rule regarding CFCO has been proposed; 11 states are in the conceptualization phase; and CFCO is under more preliminary discussion in two states. Three quarters of the state agencies providing information in the 2012 survey stated that they are involved in this option in various ways: taking the lead; providing oversight or guidance; participating on a stakeholder committee; serving as part of the team or as a partner; and seeking legislative direction.

2012 State of Aging and Disabilities Survey: Another Year of Challenges Tempered by Opportunities 11
n Accountable Care Organizations (ACOs)—In NASUAD’s 2012 survey, 13 state aging and disability agencies indicated that the state was considering or involved in the development of ACOs. The state agencies reported that they are involved in ACOs in a variety of ways—attending planning meetings; assuring that aging network and HCBS are included in the model; and participating on advisory committees, workgroups, and stakeholder groups.
Map 6 Accountable Care Organizations (ACOs)
n State aging and disability agencies indicated that the state was considering or involved in the development of ACOs (CA,CO, CT, GA, IL, MA, ME, MN, NM, RI, UT, VT, WA)
October 2012

National Association of States United for Aging and Disabilities (NASUAD)12
Theme 3—Limited budgets and growing demand continue to be top concerns to state aging and disability agencies.
In reflecting on 2009 survey results, NASUAD’s 2011 survey report indicated that despite the improving financial picture in many states, the majority of state aging and disability agencies remain especially concerned about budgets and their capacity to maintain services as the numbers of older adults and persons with disabilities grow. This trend continues during 2012. As shown in Figure 2:
n Every state “strongly agreed” (72.5 percent) or “agreed” (27.5 percent) that they face budgetary challenges, defined as increasing expenses and limited funding.
n All but two states “strongly agreed” (51 percent) or “agreed” (45 percent) that a challenge they face is that the baby boomer population will begin seeking services.
n Immediately following budget concerns and increasing demand for services, are state agencies’ challenges associated with insufficient state staff; lack of direct care services providers (e.g. personal care attendants and nurses); and lack of specialty providers (e.g. geriatric physicians, behavioral health providers and physical/occupational therapy.)
While states’ concern about insufficient state staff has remained fairly level between 2011 and 2012, their concern about the lack of direct care and specialty providers has increased, especially with respect to direct care workers. In 2011, only 45 percent of states “agreed” that a lack of direct care service providers was a concern, while in 2012, 66 percent “agreed” and 18 percent “strongly agreed.”
Figure 2 Top State Agency Challenges
October 2012

2012 State of Aging and Disabilities Survey: Another Year of Challenges Tempered by Opportunities 13
Theme 4—Agency restructuring continues around the nation.
In 2011, more than half the states reported they had restructured since 2009 or had plans to restructure. Similarly in 2012, 55 percent of the states reported that they either have been restructured since 2011 (19 states) or have plans for restructuring (eight states). Three states reported both that they have been restructured since 2011 and that there are plans for further restructuring.
Map 7 States Restructuring State Aging and Disability Agencies
n States restructuring since 2011 (CT, DE, HI, IA, IN, KS, ME, NC, NH, OH, OR, PA, VT, VA, WA, WY)
n States with plans for restructuring (CO, DC, LA, NV, WV)
n States both restructuring since 2011 and with plans (AL, MD, NJ)
October 2012

National Association of States United for Aging and Disabilities (NASUAD)14
Figure 3 provides an overview of factors driving state agency restructuring, as reported by the states in 2012. The top three factors driving agency restructuring include providing a comprehensive vision; consistent policymaking; and administrative simplification. States expressed other challenges in state agency restructuring. Chief among the challenges are difficulty serving multiple populations and agency turf battles. Several states identified other challenges not listed in the survey instrument:
n Supporting staff through the restructuring process;
n Redefining staff roles;
n Working with stakeholder groups so they feel included in the restructuring process;
n Continual cuts to general fund appropriations resulting in erosion of infrastructure, fewer direct services, elimination of programs and reductions in force; and
The 2012 survey asked whether states restructured or relocated the Long Term Care Ombudsman Program since January 2011. Five states (AL, DE, IA, MD, VA) responded affirmatively. In two states the Ombudsman Program was restructured and in three states it was relocated. Reasons for these changes varied. In three states the governor or agency commissioner drove the changes, in one state the state agency took on responsibility for state operated long term care facilities, and in another state the AAAs decided they no longer wanted to host the Ombudsman Program.
Figure 3 Factors Driving State Agency Restructuring
October 2012

2012 State of Aging and Disabilities Survey: Another Year of Challenges Tempered by Opportunities 15
In addition to state-level restructuring, local and regional restructuring is occurring. Approximately a third of states in 2011 and 2012 indicated that some sort of regional or local restructuring effort was underway or planned. In 2012, the two top reasons reported by states for local and regional restructuring were consolidation of Medicaid HCBS operations (36 percent) and change in designated planning and service areas under the OAA (29 percent). Among other reasons states mentioned were transfer of authority for Medicaid HCBS, devolution of a state managed care system to a regional system, moving toward statewide implementation of Aging and Disability Resource Centers, and possible consolidation of local Long Term Care Ombudsman Programs.
Theme 5—The loss of historical knowledge continues around the nation.
In recent years, state aging and disability agencies have experienced a significant turnover in leadership and staff. In 2009, 55 percent of state agency directors had held their positions between one and four years and 14 percent for less than one year. In 2011, 40 percent of state agency directors had served between one and five years and 36 percent for less than one year.
Figure 4 provides a 2012 snapshot of state agency directors’ years of service. More than 80 percent of the state agency directors have been in their positions for five years or less— 59 percent have served between one and five years and 25 percent for less than one year.
The size of state agencies in terms of full time equivalents (FTEs) varies widely from fewer than 10 to more than 150. However, state agency size clusters around two ranges. Approxi-mately 33 percent of state agencies currently report between 21 and 75 FTEs, while 43 per-cent have 126 or more FTEs. Among the latter category, 19 states have more than 150 FTEs.
Figure 4 State Agency Directors’ Years of Service (2012)
October 2012

National Association of States United for Aging and Disabilities (NASUAD)16
Consistent with the results of NASUAD’s 2009 and 2011 surveys, the 2012 survey shows that it is still the case that the staff members in almost all state agencies have long tenures. In 48 percent of the states, the average tenure is more than ten years of service, while in 50 percent of the states it is between four and ten years.
The 2012 survey indicates that three quarters of the state agencies have experienced personnel reductions since the beginning of the economic downturn in fiscal year 2007. The rate of reductions has not accelerated since the 2009 survey. States have used three primary methods to reduce personnel—92 percent have implemented hiring freezes, 54 percent have carried out reductions-in-force, and 49 percent have instituted furloughs.
Of the states’ reduction in full-time equivalents (FTEs) since fiscal year 2007, 41 percent reported a loss of ten percent or fewer FTEs, 34 percent reported a loss of 11 percent to 20 percent of their FTEs, and 25 percent reported a loss of more than 20 percent of their FTEs. Two states indicated that they have had staffing increases since 2007.
The 2012 survey reveals a modest reduction in the percentage of state staff eligible for retirement. Since many state agency employees retired prior to 2012, this is not surprising. As seen in Figure 5:
n In 2011, 16 states reported that more than 25 percent of employees were eligible for retirement, but in 2012, only 14 states reported this.
n Similarly, in 2011, 16 states indicated that 16-25 percent of employees were eligible for retirement, but in 2012 only 14 states indicated this.
n With regard to the five to ten percent range of employees eligible for retirement, 11 states reported this range in 2012, but only 6 states reported it in 2011.
State agencies struggle to find time to develop a plan for replacing the knowledge and experience of the many employees eligible for retirement. In 2012, 43 percent of states reported that they have such a plan in place.
Figure 5 Percent of State Agency Staff Eligible for Retirement by Percent of Total Full-Time Equivalents (2011 and 2012)
October 2012

2012 State of Aging and Disabilities Survey: Another Year of Challenges Tempered by Opportunities 17
Overview of State Aging and Disability Agencies
S tate aging and disability agencies are highly individualized. Populations served, funding sources, services provided, and administrative responsibilities vary greatly
from state to state.
Populations Served by State Agencies
All state agencies manage programs serving older adults and most manage programs serving people with disabilities. Vehicles for supports available to people with disabilities include targeted programs and broader initiatives. An example of a targeted program is a Medicaid HCBS waiver, while an example of a broader effort is an Aging and Disability Resource Center program.
State aging and disability agencies also play purely administrative roles in programs which serve both older adults and people with disabilities. This varies by state. Examples include managing the functional assessment process for LTSS, certifying adult day programs, overseeing registration of direct care workers, and administering supplementary state payments for people in residential settings.
Figure 6 Disabilities for Which State Agencies Are Responsible
October 2012

National Association of States United for Aging and Disabilities (NASUAD)18
Figure 6 provides an overview of disabilities for which state agencies are responsible. More than half the states indicated that the state agency is responsible for people with cognitive impairment and people with physical disabilities, while a quarter of the states indicated that the state agency is responsible for people with brain injury. Fifteen states indicated that the state agency is responsible for “other” areas related to people with disabilities including adult protective services, guardianship, people who need respite, and advocacy services. A number of state agencies noted that they serve people with disabilities, but do not have primary responsibility for serving them.
Funding for State AgenciesIn NASUAD’s 2012 survey, states reported that state agency annual budgets, including federal and state funds for all programs, range from less than $1 million to more than $150 million. Half the state agencies have annual budgets of more than $100 million.
As seen in Figure 7, in 2012, 72 percent of the states indicated that their total state agency budget was less than five percent of the total FY 2012 state budget, while only 16 percent said their total state agency budget was more than 15 percent of the total FY 2012 state budget.
Figure 7 State Agency Budget as Percent of Total State Budget (2012)
October 2012

2012 State of Aging and Disabilities Survey: Another Year of Challenges Tempered by Opportunities 19
As Figure 8 shows, state agencies receive funding from a wide variety of sources. Of all the funding sources, only OAA funds and state appropriations are received by every state agency. Sixty-nine percent of the states receive Medicaid funding; 61 percent receive funding from the U.S. Department of Labor, 57 percent receive funding from the U.S. Department of Agriculture, and 43 percent receive funding from the U.S. Department of Health and Human Services, Administration for Children and Families (Social Services Block Grant). [See Table 5 in the state-by-state tables at the end of this report.]
The amount of state funding state agencies received in 2012 for HCBS programs ranges from $0.3 million to more than $300 million. Of the more than 70 percent of state agencies that received state funding for HCBS in 2012:
n 12 states receive $5 million or less
n 11 states receive more than $5 million to $20 million
n Ten states receive between more than $20 million, including three that receive more than $100 million
Figure 8 Funding Sources for State Agencies
October 2012

National Association of States United for Aging and Disabilities (NASUAD)20
The 2012 survey asked state agencies whether their funding for state-only funded services had changed since 2011. Figure 9 indicates that funding has increased in 11 states, remained the same in 13 states, and decreased in 11 states. Despite the ongoing effects of the economic downturn at the state level, it is significant that fewer than one-third of the states with state-only funded services reported funding decreases in 2012.
The Older Americans Act lays the foundation for the long term services and supports landscape. Yet OAA funding to the aging network is very modest. As seen in Figure 10, OAA funds represent 25 percent or less of the overall state agency budget in half the states.
Figure 10 OAA Funds as Percent of Total State Agency Budgets (2012)
October 2012
Figure 9 Changes in Funding for State-Only Funded Services Since 2011
October 2012

2012 State of Aging and Disabilities Survey: Another Year of Challenges Tempered by Opportunities 21
Medicaid is the largest source of funding for many state aging and disability agencies. To put things in perspective, Medicaid funding for LTSS ($105.5 billion for nursing facility care, home health and personal care in 2010) is more than 70 times greater than the amount of OAA funding ($1.5 billion for a wide range of programs).18
In the 2012 survey, more than two-thirds of the states responded that Medicaid is part of their state agency budgets. Of the state agencies leveraging Medicaid funds, 77 percent said they are using Medicaid to fund HCBS programs and 85 percent said they are using Medicaid to cover administrative functions related to waiver or state plan operations, eligibility, enrollment, etc.
Approaches to Cost-Sharing by State Agencies
Another source of revenue for state agencies is cost-sharing by people who receive services. At present, this is a modest source of income, but given the gap between demand for services and available resources, states will consider this option. OAA allows cost-sharing within specific federal requirements and restrictions.19 For example:
n Cost-sharing is allowed in LTSS financial planning, home care, adult day services, respite care, health promotion/disease prevention programs, and transportation.
n Cost-sharing is not allowed for older people who are poor or for information and assistance services, short-term case management, benefits counseling, vulnerable elder rights protection, nutrition, and services delivered through tribal organizations.
Thirty-one percent of state agencies have a cost-sharing plan and an equal percent do not require any cost-sharing for OAA-funded services. Twenty-two percent of state agencies restrict AAAs from implementing cost-sharing. Reasons offered by state agencies for cost-sharing restrictions include: there is no state plan for doing this; it would need to be statewide; discussions are under way; voluntary contributions generate more income than cost-sharing would; and, given the economy, this could prove burdensome for the people served.
At the AAA level, nearly 70 percent of the states responded that “no AAAs,” and 14 percent said “some AAAs” have cost-sharing plans. The rest of the states said “all AAAs” have cost-sharing plans. The most frequently given reason for AAAs not having cost-sharing, besides it being restricted, is that there is no cost-sharing plan. Among other reasons mentioned: state policymakers decided cost-sharing is not appropriate and the administrative burden would cost more money than cost-sharing would generate. Several states indicated that they can raise more money through voluntary contributions than required cost-sharing, while several others said they are interested in developing cost-sharing.
___________
18 Scully, D., Business Planning: Moving into the Future (June 2012). Workshop Presented at 14th Annual Healthy Communities Summit, Athens, GA.
19 Older Americans Act Cost-sharing (May 2011). National Association of States United for Aging and Disabilities.

National Association of States United for Aging and Disabilities (NASUAD)22
Figure 11 shows the OAA-funded services that are subject to cost-sharing in the 16 states that use this revenue generating mechanism. These services include adult day, chore, disease prevention and health promotion, homemaker, personal care, respite, and other. When it comes to state-only funded services, more than 70 percent of state agencies that fund these services impose cost-sharing.
Services Provided by State Agencies
State aging and disability agencies offer a wide variety of services. All state agencies offer OAA-funded services; more than three-quarters offer state-only funded HCBS; and at least two-thirds provide Medicaid-funded HCBS.
Consistent with the variety of funding sources upon which they rely, state aging and disability agencies provide a broad range of federally-funded, non-Medicaid services. Many of these services are provided only to older adults and many are provided to both older adults and adults with disabilities. [See Table 4 in state-by-state tables at the end of this report for a detailed breakdown.]
OAA programs are the most frequently federally-funded, non-Medicaid services that state agencies provide, including legal assistance development, meals (congregate and home-delivered), Aging and Disability Resource Centers/Information and Referral, Long-Term Care Ombudsman, elder abuse prevention, disease prevention/health promotion, transportation, senior centers, homemaker/chore/personal care, family caregiver support and respite, Alzheimer’s support and respite, case management, and Senior Community Service Employment Program.
Figure 11 Percent of States Using Cost-Sharing by Type of OAA Service
October 2012

2012 State of Aging and Disabilities Survey: Another Year of Challenges Tempered by Opportunities 23
In addition to OAA programs, many state agencies also oversee the Senior Medicare Patrol (SMP), the State Health Insurance Assistance Program (SHIP), adult day services, adult protective services and guardianship, Veterans-Directed HCBS, the Senior Farmers’ Market Nutrition Program, and others.
As displayed in Figure 12, state agencies offer a rich array of state-only funded HCBS. [See Table 6 of the state-by-state tables at the end of this report.]
n The most frequently provided services are respite (29 states); homemaker and personal assistance (28 states each); and case management and home-delivered meals (26 states each).
n Fewer than 25 but more than 15 state agencies provide transportation; adult day (social and health); personal emergency response systems; specialized equipment, supplies or assistive technology; and environmental modifications.
n At least five but fewer than ten state agencies provide community transition support, nutritional supplements, therapies (occupational, physical, speech, recreation), assisted living, pharmaceutical assistance, and supported employment.
n Fewer than five state agencies offer behavioral supports, residential rehabilitation, adult foster care, day habilitation, independent living, supported living, and vocational rehabilitation.
Figure 12 Non-Medicaid, State-Only Funded Home and Community-Based Services Operated by State Agencies
October 2012

National Association of States United for Aging and Disabilities (NASUAD)24
n Eleven state agencies noted “other” state-only funded programs not listed in the survey. Seven states mentioned chore services. Other services were: assisted transportation, caregiver and/or participant training, companion services, group homes, habilitation therapy, home health and home health aide services, nutrition assessment, pharmacy/medication dispensing, services to adults not yet age 60, supported housing, room and board during evaluation or treatment, wanderer locator, and wellness and exercise.
State aging and disability agencies also offer Medicaid-financed HCBS. In NASUAD’s 2012 survey, 30 state agencies reported that they operate one or more Medicaid HCBS waivers for elders and people with disabilities.20 This includes Vermont, which operates HCBS through Medicaid’s Section 1115 authority. Figure 13 describes the different types of waivers and the number of state agencies that operate each type. As was the case in 2011, the majority of waivers operated by state agencies in 2012 are targeted to elders and people with physical disabilities. [See Table 8 in the state-by-state tables at the end of this report.]
Figure 14 shows the number of state agencies providing each type of Medicaid HCBS waiver service through an agency (by staff employed by an agency) and through consumer-direction (by staff managed directly by the consumer or his/her representative). [See Table 9 in the state-by-state tables at the end of this report.]
n Case management, personal assistance services and respite services top the list of agency-directed services (21 states each). Following closely are home-delivered meals (20 states) and homemaker, personal emergency response systems, and specialized equipment and supplies (19 states each). Agency-directed services operated by fewer than 19 but more than 10 state agencies include environmental modifications (17 states); adult day health (16 states); assistive technology (15 states); adult day social (14 states); community transition support and transportation (13 states each); occupational therapy (12 states); and day habilitation (11 states).
n Personal assistance heads the list of consumer-directed services (22 states). Respite (15 states) is the next most frequently identified consumer-directed service, followed by homemaker (13 states). Case management is next (10 states) with assistive technology, environmental modifications, and transportation (8 states each) following closely.
___________
20 Most states operate Medicaid HCBS waivers under Section 1915(c) that serve elders and adults with physical disabilities, but in many states these waivers are operated by state agencies other than state aging and disability agencies, such as state Medicaid agencies.
Figure 13 Medicaid HCBS Waivers Operated by State Aging and Disability Agencies
Number of State Agencies Type of Waiver Operating Each Type of Waiver
Elders and Adults with Disabilities ............................... 17
Elders .............................................................................. 15
Physical Disabilities ........................................................ 12
Assisted Living .................................................................. 8
Intellectual/Developmental Disabilities ........................ 7
Traumatic Brain Injury ..................................................... 6
Alzheimer’s disease ........................................................... 3
Severe Emotional Disturbance ........................................ 3
Adult Foster Care .............................................................. 2
Autism ............................................................................... 2
Other ................................................................................. 7
October 2012

2012 State of Aging and Disabilities Survey: Another Year of Challenges Tempered by Opportunities 25
Figure 14 Type of Services Provided Under Medicaid HCBS Waivers Administered by State Aging and Disability Agencies by Who Directs the Service
Agency-Directed HCBS Services # States
Case Management ...........................................................21
Personal Assistance Services ...........................................21
Respite .............................................................................21
Home-delivered Meals .................................................. 20
Homemaker .................................................................... 19
Personal Emergency Response Systems ........................ 19
Specialized Equipment and Supplies ........................... 19
Environmental Modifications ....................................... 17
Adult Day Health ........................................................... 16
Assistive Technology ....................................................... 15
Adult Day Social ............................................................. 14
Community Transition Support ................................... 13
Transportation ............................................................... 13
Occupational Therapy .................................................... 12
Day Habilitation ..............................................................11
Assisted Living .................................................................10
Behavioral Supports ........................................................10
Speech Therapy ................................................................10
Adult Foster Care .............................................................. 9
Nutritional Supplements ................................................. 9
Physical Therapy ............................................................... 9
Other HCBS Waiver Services ........................................... 9
Supported Employment................................................... 8
Residential Rehabilitation ................................................ 7
Supported Living .............................................................. 6
Extended State Plan: Nursing .......................................... 6
Extended State Plan: Home Health ................................ 4
Extended State Plan: Personal Care ................................ 3
Recreation Therapy ........................................................... 3
Consumer-Directed HCBS Services # States
Personal Assistance Services .......................................... 22
Respite ............................................................................. 15
Homemaker .................................................................... 13
Case Management ...........................................................10
Assistive Technology ......................................................... 8
Environmental Modifications ......................................... 8
Transportation .................................................................. 8
Adult Day Health .............................................................. 6
Other HCBS Waiver Services ........................................... 6
Personal Emergency Response Systems .......................... 5
Specialized Equipment and Supplies ............................. 5
Community Transition Support .................................... 4
Home-Delivered Meals .................................................... 4
Adult Day Social ............................................................... 3
Day Habilitation ............................................................... 3
Supported Living .............................................................. 3
Extended State Plan: Personal Care ................................ 3
Extended State Plan: Nursing .......................................... 3
Adult Foster Care .............................................................. 2
Behavioral Supports ......................................................... 2
Supported Employment................................................... 2
Assisted Living .................................................................. 1
Nutritional Supplements ................................................. 1
Occupational Therapy ...................................................... 1
Physical Therapy ............................................................... 1
Residential Habilitation ................................................... 1
Speech Therapy ................................................................. 1
Extended State Plan: Home Health ................................ 1
Recreation Therapy ........................................................... 0
October 2012

National Association of States United for Aging and Disabilities (NASUAD)26
As shown in Figure 15, several state aging and disability agencies also administer HCBS programs under the Medicaid state plan. The most frequently identified State Plan HCBS were personal assistance services and adult day services (each provided in nine states), followed by case management (provided seven states), assisted living (provided in six states), and home health (provided in five states).
NASUAD’s 2012 survey asked whether area agencies on aging (AAAs) and centers for independent living (CILs) provide Medicaid-funded case management and any other Medicaid-funded HCBS. Figure 16 indicates that in a number of states AAAs and CILS provide both case management and other HCBS services. [See Table 10 in the state-by-state tables at the end of this report.]
Figure 15 Medicaid State Plan Home and Community-Based Services Managed by State Aging and Disability Agencies
Number of State Agencies Managing the Service Type of Medicaid State Plan Service
9 Personal Assistance Services
7 Adult Day Health
7 Case Management
6 Assisted Living
5 Home Health
4 Adult Foster Care
4 Hospice
4 Occupational Therapy
4 Physical Therapy
4 Speech Therapy
4 Transportation
2 Adult Day Social (no health component)
2 Assistive Technology
2 Day Habilitation
2 Home-Delivered Meals
2 Homemaker
2 Respite
2 Personal Emergency Response Systems
2 Specialized Equipment and Supplies
1 Behavioral Supports
1 Community Transition Support
1 Environmental Modifications
1 Nutritional Supplements
1 Recreation Therapy
1 Residential Rehabilitation
1 Supported Employment
1 Supported Living
October 2012

2012 State of Aging and Disabilities Survey: Another Year of Challenges Tempered by Opportunities 27
n 14 states responded that AAAs provide both case management and other HCBS, 12 said AAAs provide only case management, and 6 said AAAs provide only other HCBS.
n Eight states responded that CILs provide both case management and other HCBS, seven said CILs provide only HCBS, and six said CILS provide only case management.
Figure 16 Medicaid-Funded Case Management Services Provided by Area Agencies on Aging and Centers for Independent Living
October 2012
Figure 17 States Offering Evidence-Based Services, by Funding Source
AoA Medicaid State Other Evidence-Based Services Funding* Funding Funding Funding
Chronic Disease Self-Management 39 2 8 19
Family Caregiver Support 30 1 15 6
A Matter of Balance 23 1 5 16
Transition from Institutions Programs 8 12 8 6
Healthy IDEAS or PEARLS 9 1 3 5
Enhance-Fitness 7 0 4 7
Enhance-Wellness 1 0 1 1
Other 13 3 5 8
*AoA=Administration on Aging
October 2012

National Association of States United for Aging and Disabilities (NASUAD)28
States were asked whether the state aging and disability agency offers evidence-based services and the source(s) of funding for those services, if provided. Figure 17 reveals the following information. [See Table 7 in state-by-state tables at the end of this report.]
n Funding from the U.S. Administration on Aging (AoA) is used most frequently for chronic disease self-management21 (39 states), followed by caregiver support (30 states) and A Matter of Balance22 (23 states).
n Medicaid funding is used most frequently for transition from institutions programs (11 states).
n Family caregiver support is the program with the greatest success in securing state funding (15 states), followed by chronic disease self-management and transition from institution programs (8 states each).
n Several states have been particularly successful in accessing “other” funding, in particular for chronic disease self-management (19 states) and A Matter of Balance, a falls prevention program (16 states).
n Healthy IDEAS23 and PEARLS24 depression screening programs are funded by AoA (nine states), Medicaid (one state), by states (three states) and other sources (five states.)
Administration of State Agency Services
State aging and disability agencies are structured in a variety of ways. In more than 60 percent of the states, these agencies are part of a larger umbrella agency, while in one-third of the states they are independent agencies. The Governor appoints the director of the state aging and disability agency in 26 states, the umbrella agency head appoints the director in 15 states, and the civil service process is used to appoint the director in 6 states. [See Tables 1 and 2 in the state-by-state tables at the end of this report.]
Figure 18 depicts how aging services and disability services are administered by state agencies. More aging services are administered regionally, than on a statewide basis. In contrast, more disability services are administered on a statewide basis, than regionally. Some state agencies noted that they are responsible for the administration of both statewide services and services administered regionally.
___________
21 For information about the Chronic Disease Self-Management Programs go to: http://patienteducation.stanford.edu/programs/cdsmp.html
22 For information about A Matter of Balance go to: http://www.ncoa.org/improve-health/center-for-healthy-aging/ a-matter-of-balance.html
23 For information about Healthy Ideas go to: http://www.ncoa.org/improve-health/center-for-healthy-aging/ healthy-ideas-identifying.html
24 For information about PEARLS go to: http://www.centeronaging.uiowa.edu/AHRQ-CollaborativeCareConference/Docs/Snowden.pdf

2012 State of Aging and Disabilities Survey: Another Year of Challenges Tempered by Opportunities 29
Figure 19 examines the LTSS components for which state agencies are responsible. In NASUAD’s 2012 survey, most states reported that the state agency is responsible for LTSS planning and policy development (45 states). A majority of the states indicated that the state agency is responsible for quality assurance of HCBS (34 states), LTSS financing (29 states), and LTSS functional/medical eligibility determination (27 states). Far fewer state agencies said they are responsible for the remaining LTSS components listed in Figure 19, most of which are administrative functions related to facility-based services and financial eligibility determination. [See Table 3 in the state-by-state tables at the end of this report.]
Figure 18 How State Agencies Administer Aging Services and Disability Services
October 2012
Figure 19 LTSS Components for Which State Agencies Are Responsible
October 2012

National Association of States United for Aging and Disabilities (NASUAD)30

2012 State of Aging and Disabilities Survey: Another Year of Challenges Tempered by Opportunities 31
conclusions
State aging and disability agencies face a challenging confluence of factors:
n Growing Demand—For years, states have anticipated an increasing number of older adults. LTSS for the older adult population is often complicated by multiple chronic conditions. Additionally, higher numbers of younger people with disabilities are requesting services and are in need of services for longer periods of time. Finally, due to the economic downturn, more people, particularly older adults, are turning to public services for assistance.
n State Budgets—While there are some signals that the economy is improving, years of recovery will be required to return to 2007 state budget levels. However, 2007 revenue levels and related service outlays likely will be insufficient to meet future higher levels of demand. Additionally, even in the few states with no or minimal budget pressures today, state agencies are concerned about sufficient resources to meet future need.
n Restructuring—In order to meet higher levels of demand and operate within their means, state agencies are reorganizing and redesigning service systems. Such changes are producing both innovations and concerns.
As states struggle with these factors, they also are faced with a number of opportunities. States’ interest in Medicaid managed LTSS and a range of options under the Affordable Care Act is growing. In the midst of their rapidly changing environment, state aging and disability agencies are striving to innovate and restructure in order to meet the demand for services with lower staffing levels and lingering budget issues. State agencies have demonstrated resilience in the face of daunting challenges as they also participated in a rich array of new opportunities to improve LTSS.

National Association of States United for Aging and Disabilities (NASUAD)32

2012 State of Aging and Disabilities Survey: Another Year of Challenges Tempered by Opportunities 33
State-by-State Summary Tables

National Association of States United for Aging and Disabilities (NASUAD)34
OtherIndependent Administrative
Agency
Part of Umbrella Agency
Human Services Health Medicaid Welfare Behavioral Health
Board or Commission
Table 1: Structure of State Agencies
Alabama ✓Cabinet level agency
Alaska ✓ ✓ ✓ ✓ ✓
Arizona ✓
Arkansas ✓ ✓ ✓ ✓
California ✓
Colorado ✓
Commonwealth of the Northern Mariana Islands (CNMI)
✓ ✓ ✓ ✓
Connecticut ✓
Delaware ✓ ✓ ✓ ✓ ✓ Medical Examiner
District of Columbia Cabinet level agency
Florida ✓
Georgia ✓ ✓ ✓ Child Support
Hawaii ✓
Idaho ✓
Illinois ✓
Indiana ✓ ✓ ✓
Iowa ✓
Kansas ✓
Kentucky ✓ ✓ ✓ ✓ ✓Inspector General and Ombudsman
Louisiana Office of the Governor
Maine ✓ ✓ ✓ ✓ ✓
Maryland ✓
Massachusetts ✓
Michigan ✓
Minnesota ✓
Independent board administratively place in human services for OAA only; remainder in DHS
Mississippi ✓
Missouri ✓
Montana ✓ ✓ ✓ ✓ ✓
Nebraska
Nevada ✓ ✓ ✓ ✓ ✓

2012 State of Aging and Disabilities Survey: Another Year of Challenges Tempered by Opportunities 35
OtherIndependent Administrative
Agency
Part of Umbrella Agency
Human Services Health Medicaid Welfare Behavioral Health
Board or Commission
Table 1: Structure of State Agencies (Continued)
New Hampshire ✓ ✓ ✓ ✓ ✓
Developmental/intellectual disabilities, child welfare, juvenile justice, alcohol/substance abuse prevention, traumatic brain injury
New Jersey ✓
New Mexico ✓
New York ✓
North Carolina Health and Human Services
North Dakota ✓ ✓ ✓
Children and Family Services, Developmental Disabilities, Economic Assistance Policy, Mental Health & Substance Abuse Services, Vocational Rehabilitation, State Hospital, Developmental Center and Regional Human Service Centers
Ohio ✓
Oklahoma ✓ ✓
Oregon ✓ ✓
Pennsylvania ✓
Rhode Island ✓ ✓ ✓ ✓ ✓
South Carolina Lt. Governor
South Dakota ✓ ✓ ✓
Tennessee ✓
Texas ✓ ✓ ✓ ✓ ✓
Utah ✓ ✓
Vermont ✓
Virginia ✓
Washington ✓ ✓ ✓ ✓
West Virginia ✓
Wisconsin ✓ ✓ ✓ ✓
Wyoming ✓
17 24 15 17 17 15 1
National Association of States United for Aging and Disabilities (NASUAD)36
Director Appointed By
Umbrella Agency Head
Board or Commission
Merit Civil Service
SelectionGovernor
Umbrella Agency Head
or Deputy
Board or Commission
Governor
Director Reports To
Table 2: Appointment of State Agency Directors
Other Other
Alabama ✓ ✓
Alaska ✓ ✓
Arizona ✓ ✓Deputy director of Program Services
Arkansas ✓ Deputy Director
California ✓ ✓
CNMI ✓ ✓
Colorado ✓ ✓
Connecticut ✓Deputy Commissioner
Delaware ✓ ✓
District of Columbia Appointed by the Mayor
The Deputy Mayor for Health and Human Services
Florida ✓ ✓
Georgia ✓ ✓
Hawaii ✓ ✓
Idaho ✓ ✓
Illinois ✓ ✓
Indiana ✓ ✓
Iowa ✓ ✓
Kansas ✓ ✓
Kentucky ✓ ✓
Louisiana
Recommended by Aging Board, approved by the
Governor
Dual, Board and The Governor
Maine ✓Deputy Commissioner
Maryland ✓ ✓
Massachusetts ✓ ✓
Michigan ✓ ✓
Minnesota ✓ ✓
Mississippi ✓Deputy Administrator
Missouri ✓ ✓
Montana ✓ ✓
Nebraska
Nevada ✓
New Hampshire Not specifiedAssociate Commissioner

2012 State of Aging and Disabilities Survey: Another Year of Challenges Tempered by Opportunities 37
Director Appointed By
Umbrella Agency Head
Board or Commission
Merit Civil Service
SelectionGovernor
Umbrella Agency Head
or Deputy
Board or Commission
Governor
Director Reports To
Table 2: Appointment of State Agency Directors (Continued)
Other Other
New Jersey ✓Deputy Commissioner
New Mexico ✓ ✓
New York ✓
Governors Deputy Secretary for Health and Human Services
North Carolina ✓
DHHS Deputy Secretary for Long Term Care and Family Services
North Dakota ✓Cabinet Head to umbrella agency head
Ohio ✓ ✓
Oklahoma ✓Chief Coordinating Officer
Oregon ✓ ✓
Pennsylvania ✓ ✓
Rhode Island ✓ Director of DHS
South Carolina Appointed by Lt. Governor Lt. Governor
South Dakota ✓ ✓
Tennessee ✓ ✓
Texas ✓ ✓
Utah ✓ ✓
Vermont ✓ ✓
Virginia ✓ ✓
Washington ✓ ✓
West Virginia ✓ ✓
Wisconsin ✓Division administrator
Wyoming ✓ ✓
26 15 0 6 4 15 20 0 16

National Association of States United for Aging and Disabilities (NASUAD)38
Planning and policy
development
Table 3: Components of LTSS for Which State Agency is Responsible
Financing Regulation of nursing facility
services
Licensure and certification of
nursing facilities services and staff
Quality assurance of nursing facility
services
Regulation of assisted living
Licensure and certification of
assisted living services and staff
Alabama ✓ ✓ ✓ ✓
Alaska ✓ ✓ ✓ ✓ ✓ ✓ ✓ ✓
Arizona ✓ ✓ ✓* ✓* ✓*For non-Medicaid HCBS via AAAs; other includes LTSS Ombudsman
Arkansas ✓ ✓ ✓
California ✓ ✓ ✓ ✓ ✓ ✓ ✓Long Term Care Ombudsman services in nursing facilities and assisted living facilities
Colorado ✓ ✓ ✓
CNMI ✓ ✓ ✓
Connecticut ✓ ✓ ✓ ✓ ✓
Delaware ✓ ✓ ✓ ✓
District of columbia ✓ ✓ ✓Provision of direct home and community-based services
Florida ✓ ✓ ✓ ✓ ✓ ✓ Rule making authority for ALFs
Georgia ✓ ✓ ✓ ✓ ✓ ✓Answers check in this section are relative to Older Americans Act HCBS and to 1915c waiver services
Hawaii ✓
Idaho ✓ None
Illinois ✓ ✓ ✓ ✓ ✓ ✓ Certification of state requirements.
Indiana ✓ ✓ ✓ ✓ ✓ ✓ ✓
Iowa ✓
Kansas ✓ ✓ ✓ ✓ ✓ ✓ ✓ ✓ ✓ ✓ ✓ ✓
Kentucky ✓ ✓ ✓ ✓ ✓ ✓ ✓
Louisiana ✓ ✓
It is in statue that this office oversee all aging issues in the state. This does not always happen. As the State Unit on Aging, we oversee the above only with OAA funds and few state dollars for aging services.
Maine ✓ ✓ ✓ ✓ ✓ ✓ ✓ ✓Some answers above only partially apply. See comments next to them on word document survey.
Maryland ✓ ✓See
explanation ✓
Quality assurance for HCBS provided under Medicaid Waiver for Older Adults and providers of services financed by the agency; serve as preliminary screen for LTSS
Massachusetts ✓ ✓ ✓ ✓ ✓ ✓ ✓ ✓
Michigan ✓ ✓ ✓
"STLCO Omnbudsman, coordination and advocacy for LTC supports and services. Answers check in this section are relative to Older Americans Act and state-funded HCBS.
Minnesota ✓ ✓ ✓ ✓
Mississippi

2012 State of Aging and Disabilities Survey: Another Year of Challenges Tempered by Opportunities 39
Quality assurance of assisted living
services
Regulation of home and community based providers
Licensure and certification of home and
community based providers and staff
Quality assurance of home and
community based service
Financial eligibility
determination
Functional/medical eligibility
determination
Other Explanation on “Other”
Alabama ✓ ✓ ✓ ✓
Alaska ✓ ✓ ✓ ✓ ✓ ✓ ✓ ✓
Arizona ✓ ✓ ✓* ✓* ✓*For non-Medicaid HCBS via AAAs; other includes LTSS Ombudsman
Arkansas ✓ ✓ ✓
California ✓ ✓ ✓ ✓ ✓ ✓ ✓Long Term Care Ombudsman services in nursing facilities and assisted living facilities
Colorado ✓ ✓ ✓
CNMI ✓ ✓ ✓
Connecticut ✓ ✓ ✓ ✓ ✓
Delaware ✓ ✓ ✓ ✓
District of columbia ✓ ✓ ✓Provision of direct home and community-based services
Florida ✓ ✓ ✓ ✓ ✓ ✓ Rule making authority for ALFs
Georgia ✓ ✓ ✓ ✓ ✓ ✓Answers check in this section are relative to Older Americans Act HCBS and to 1915c waiver services
Hawaii ✓
Idaho ✓ None
Illinois ✓ ✓ ✓ ✓ ✓ ✓ Certification of state requirements.
Indiana ✓ ✓ ✓ ✓ ✓ ✓ ✓
Iowa ✓
Kansas ✓ ✓ ✓ ✓ ✓ ✓ ✓ ✓ ✓ ✓ ✓ ✓
Kentucky ✓ ✓ ✓ ✓ ✓ ✓ ✓
Louisiana ✓ ✓
It is in statue that this office oversee all aging issues in the state. This does not always happen. As the State Unit on Aging, we oversee the above only with OAA funds and few state dollars for aging services.
Maine ✓ ✓ ✓ ✓ ✓ ✓ ✓ ✓Some answers above only partially apply. See comments next to them on word document survey.
Maryland ✓ ✓See
explanation ✓
Quality assurance for HCBS provided under Medicaid Waiver for Older Adults and providers of services financed by the agency; serve as preliminary screen for LTSS
Massachusetts ✓ ✓ ✓ ✓ ✓ ✓ ✓ ✓
Michigan ✓ ✓ ✓
"STLCO Omnbudsman, coordination and advocacy for LTC supports and services. Answers check in this section are relative to Older Americans Act and state-funded HCBS.
Minnesota ✓ ✓ ✓ ✓
Mississippi

National Association of States United for Aging and Disabilities (NASUAD)40
Planning and policy
development
Table 3: Components of LTSS for Which State Agency is Responsible (Continued)
Financing Regulation of nursing facility
services
Licensure and certification of
nursing facilities services and staff
Quality assurance of nursing facility
services
Regulation of assisted living
Licensure and certification of
assisted living services and staff
Missouri ✓ ✓ ✓ ✓
Montana ✓ ✓ ✓ ✓
Nebraska
Nevada ✓ ✓ ✓
New Hampshire ✓ ✓ ✓ ✓Medicaid certification of OQAs; programmatic oversight of atypical nursing facilities
New Jersey ✓ ✓ ✓ ✓
New Mexico ✓ ✓ ✓Ombudsman; information, referral and assistance
New York
North Carolina ✓ ✓ ✓ ✓ ✓ ✓Other agencies in our DHHS also have a role with some of these componets, along with DAAS.
North Dakota ✓ ✓ ✓ ✓ ✓ ✓ ✓ ✓ ✓ ✓OAA funds, state funds for guardian-ship and dementia care servicers and telecommunication devices
Ohio ✓ ✓ ✓ ✓ ✓ ✓ ✓ ✓ ✓ ✓ ✓
For checked items 6, 7 & 8 above, this only applies to the Assisted Living Medicaid waiver for which operational responsibility has been delegated to ODA. For items 9, 10 and 11, this only applies to the providers participating in the PASS-PORT and Choices Medicaid waivers for which operational responsibility has been delegated to ODA. For items 13, this only applies to the ODA-operated Medicaid waivers, the PACE program and nursing facility adminissions.
Oklahoma ✓ ✓ ✓ ✓ ✓ ✓ ✓ ✓ HCBS Service Plan Authorization
Oregon ✓ ✓ ✓ ✓ ✓ ✓ ✓ ✓ ✓ ✓ ✓ ✓ ✓
Pennsylvania ✓ ✓ ✓ ✓ ✓ ✓ ✓ ✓
Rhode Island ✓ ✓ ✓ ✓
South Carolina ✓ ✓
South Dakota ✓ ✓ ✓
Tennessee ✓ ✓
Texas ✓ ✓ ✓ ✓ ✓ ✓ ✓ ✓ ✓ ✓ ✓
Utah
Vermont ✓ ✓ ✓ ✓ ✓ ✓ ✓ ✓ ✓ ✓ ✓ ✓
Virginia ✓ ✓ ✓
Washington ✓ ✓ ✓ ✓ ✓ ✓ ✓ ✓ ✓ ✓ ✓ ✓Coordinating and advocating for aging long-term services and supports
West Virginia ✓ ✓ ✓
Wisconsin ✓ ✓
Wyoming ✓ ✓ ✓ ✓ ✓ Participate in plannning and policy
45 29 5 5 8 10 11 18 20 14 34 9 28 19
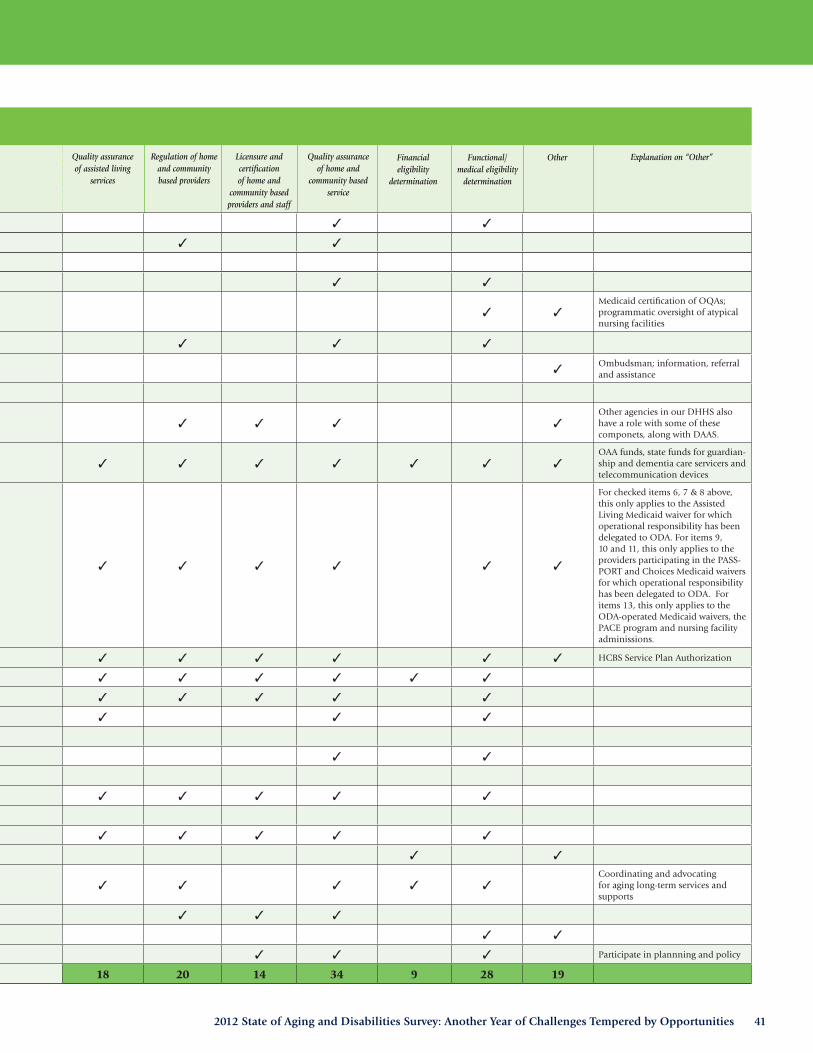
2012 State of Aging and Disabilities Survey: Another Year of Challenges Tempered by Opportunities 41
Quality assurance of assisted living
services
Regulation of home and community based providers
Licensure and certification of home and
community based providers and staff
Quality assurance of home and
community based service
Financial eligibility
determination
Functional/medical eligibility
determination
Other Explanation on “Other”
Missouri ✓ ✓ ✓ ✓
Montana ✓ ✓ ✓ ✓
Nebraska
Nevada ✓ ✓ ✓
New Hampshire ✓ ✓ ✓ ✓Medicaid certification of OQAs; programmatic oversight of atypical nursing facilities
New Jersey ✓ ✓ ✓ ✓
New Mexico ✓ ✓ ✓Ombudsman; information, referral and assistance
New York
North Carolina ✓ ✓ ✓ ✓ ✓ ✓Other agencies in our DHHS also have a role with some of these componets, along with DAAS.
North Dakota ✓ ✓ ✓ ✓ ✓ ✓ ✓ ✓ ✓ ✓OAA funds, state funds for guardian-ship and dementia care servicers and telecommunication devices
Ohio ✓ ✓ ✓ ✓ ✓ ✓ ✓ ✓ ✓ ✓ ✓
For checked items 6, 7 & 8 above, this only applies to the Assisted Living Medicaid waiver for which operational responsibility has been delegated to ODA. For items 9, 10 and 11, this only applies to the providers participating in the PASS-PORT and Choices Medicaid waivers for which operational responsibility has been delegated to ODA. For items 13, this only applies to the ODA-operated Medicaid waivers, the PACE program and nursing facility adminissions.
Oklahoma ✓ ✓ ✓ ✓ ✓ ✓ ✓ ✓ HCBS Service Plan Authorization
Oregon ✓ ✓ ✓ ✓ ✓ ✓ ✓ ✓ ✓ ✓ ✓ ✓ ✓
Pennsylvania ✓ ✓ ✓ ✓ ✓ ✓ ✓ ✓
Rhode Island ✓ ✓ ✓ ✓
South Carolina ✓ ✓
South Dakota ✓ ✓ ✓
Tennessee ✓ ✓
Texas ✓ ✓ ✓ ✓ ✓ ✓ ✓ ✓ ✓ ✓ ✓
Utah
Vermont ✓ ✓ ✓ ✓ ✓ ✓ ✓ ✓ ✓ ✓ ✓ ✓
Virginia ✓ ✓ ✓
Washington ✓ ✓ ✓ ✓ ✓ ✓ ✓ ✓ ✓ ✓ ✓ ✓Coordinating and advocating for aging long-term services and supports
West Virginia ✓ ✓ ✓
Wisconsin ✓ ✓
Wyoming ✓ ✓ ✓ ✓ ✓ Participate in plannning and policy
45 29 5 5 8 10 11 18 20 14 34 9 28 19

National Association of States United for Aging and Disabilities (NASUAD)42
Table 4: Federally Funded, Non-Medicaid Programs/Services Administered by State Agencies
Adul
t day
hea
lth (
inclu
des
heal
th c
ompo
nent
)Ad
ult d
ay so
cial
(do
es n
ot
inclu
de h
ealth
com
pone
nt)
Adul
t pro
tect
ive
serv
ices
Agin
g an
d D
isabi
lity
Reso
urce
Cen
ter (
ADRC
)Al
zhei
mer
’s su
ppor
t pro
gram
sC
ase
man
agem
ent
Chi
ld a
nd A
dult
Car
e Fo
od
Prog
ram
(C
ACFP
)
Cho
reC
omm
odity
Sup
plem
enta
l Foo
d
Prog
ram
(C
SFP)
Con
greg
ate
mea
lsD
iseas
e pr
even
tion
and
heal
th
prom
otio
nD
isabi
lity
repr
esen
tativ
e pa
yee
Elde
r abu
se p
reve
ntio
nFa
mily
car
egiv
er su
ppor
tG
uard
ians
hip
(for
adu
lts)
Gua
rdia
nshi
p (f
or p
eopl
e w
ith
disa
bilit
ies)
Hom
e de
liver
ed m
eals
Alabama B A B A A B A B A A A A A B A A B A B B B
Alaska B A A A A A A A B A A A A A
Arizona B B B B B B B B B B B B B B B B B B B B B B B B B
Arkansas B B A B B A B B B B B B B A A A A A B B B A A A A
California A A A A A A A A A A A A A A A A A A A A A A
CNMI B B B B B B B D B B
Colorado A A B B B A A A A A A A A B B A B B A A A A A A A
Connecticut B B A B B B B A A B A B B D B B A B B B B B A A B B B B B
Delaware B B B B B B A A A A A B B B A A B B A B B A A A
District of Columbia
A A B A A A A A A A A A A A A B A A A A A A
Florida A A A B A A A A B A A A A A A B A A A A A A A A A
Georgia A A A A A A A A A A A A A A A A A A A A A A A A A A A A A
Hawaii A A B A A A A A A A A A A B B A A A A A A
Idaho A A A A A A A A A A A A A
Illinois A A A A A A A A A A A A A A A A A A A A A A
Indiana B B B B A B B A A A B A A B B B B B B A B B B B B B A A A A A B B
Iowa B A A A A A B A A A A
Kansas B B B B A A A A B A B D B B B D B B A A D
Kentucky A A B A B A A A B A A B B A A B B A A B A B B A A A B B
Louisiana A A A A A A A A A A A A A A A A A
Maine B B B A B B B B B B B B B B B B B B B B B B A A B B B
Maryland B A A A A A A A A A A A A A A A A A A A A
Massachusetts A B A A A A B A B A A A B A B A A A A A A B A
Michigan A A A A A A A A A A A A A A A A A A A A A A A A A A
Minnesota A A A A A A A A A A A A A A A A A A A A
Mississippi A A A A A A A A A A A A A A A A A A A A
Missouri B B B B B B B B B B B B B B B B B B B B B B B B
Montana A B B A A A A A A A A A A A B A A A A A B B A B
Nebraska
Nevada A A B A B B A B A B A B B B A A A B A A A A
New Hampshire B B B B A A B B B B B B A A A B B A B B
New Jersey A A A A A A A A A A A A A A A A A A A A A A A
New Mexico B B B B B B B B B A A B B B B A B B B B B B
New York A B A A A A A A B A A A A A B A A A A A A A A A A

2012 State of Aging and Disabilities Survey: Another Year of Challenges Tempered by Opportunities 43
Hom
emak
er
Inde
pend
ent l
ivin
gIn
form
atio
n an
d re
ferr
alKi
nshi
p ca
reLe
gal a
ssist
ance
dev
elop
men
tLo
ng T
erm
Car
e O
mbu
dsm
an
(in-
hom
e se
rvic
es)
Long
Ter
m C
are
Om
buds
man
(lon
g te
rm c
are
faci
lity)
Low
Inco
me
Hom
e En
ergy
Assis
tanc
e Pr
ogra
m (
LIH
EAP)
Tran
spor
tatio
n
Pers
onal
car
ePu
blic
gua
rdia
nshi
p
Resp
ite
Seni
or c
ente
rsSe
nior
Com
mun
ity S
ervi
ce
Empl
oym
ent P
rogr
am (
SCSE
P)
Seni
or F
arm
ers’
Mar
ket N
utrit
ion
Prog
ram
(SF
MN
P)Se
nior
Med
icar
e Pa
trol (
SMP)
Hom
e de
liver
ed m
eals
Stat
e H
ealth
Insu
ranc
e As
sista
nce
Prog
ram
(SH
IP)
The
Emer
genc
y Fo
od A
ssist
ance
Prog
ram
(TE
FAP)
Trau
mat
ic B
rain
Inju
ry G
rant
Prog
ram
Vete
rans
-Dire
cted
Hom
e an
d
Com
mun
ity B
ased
Ser
vice
sVo
catio
nal r
ehab
ilita
tion
Alabama B A B A A B A B A A A A A B A A B A B B B
Alaska B A A A A A A A B A A A A A
Arizona B B B B B B B B B B B B B B B B B B B B B B B B B
Arkansas B B A B B A B B B B B B B A A A A A B B B A A A A
California A A A A A A A A A A A A A A A A A A A A A A
CNMI B B B B B B B D B B
Colorado A A B B B A A A A A A A A B B A B B A A A A A A A
Connecticut B B A B B B B A A B A B B D B B A B B B B B A A B B B B B
Delaware B B B B B B A A A A A B B B A A B B A B B A A A
District of Columbia
A A B A A A A A A A A A A A A B A A A A A A
Florida A A A B A A A A B A A A A A A B A A A A A A A A A
Georgia A A A A A A A A A A A A A A A A A A A A A A A A A A A A A
Hawaii A A B A A A A A A A A A A B B A A A A A A
Idaho A A A A A A A A A A A A A
Illinois A A A A A A A A A A A A A A A A A A A A A A
Indiana B B B B A B B A A A B A A B B B B B B A B B B B B B A A A A A B B
Iowa B A A A A A B A A A A
Kansas B B B B A A A A B A B D B B B D B B A A D
Kentucky A A B A B A A A B A A B B A A B B A A B A B B A A A B B
Louisiana A A A A A A A A A A A A A A A A A
Maine B B B A B B B B B B B B B B B B B B B B B B A A B B B
Maryland B A A A A A A A A A A A A A A A A A A A A
Massachusetts A B A A A A B A B A A A B A B A A A A A A B A
Michigan A A A A A A A A A A A A A A A A A A A A A A A A A A
Minnesota A A A A A A A A A A A A A A A A A A A A
Mississippi A A A A A A A A A A A A A A A A A A A A
Missouri B B B B B B B B B B B B B B B B B B B B B B B B
Montana A B B A A A A A A A A A A A B A A A A A B B A B
Nebraska
Nevada A A B A B B A B A B A B B B A A A B A A A A
New Hampshire B B B B A A B B B B B B A A A B B A B B
New Jersey A A A A A A A A A A A A A A A A A A A A A A A
New Mexico B B B B B B B B B A A B B B B A B B B B B B
New York A B A A A A A A B A A A A A B A A A A A A A A A A
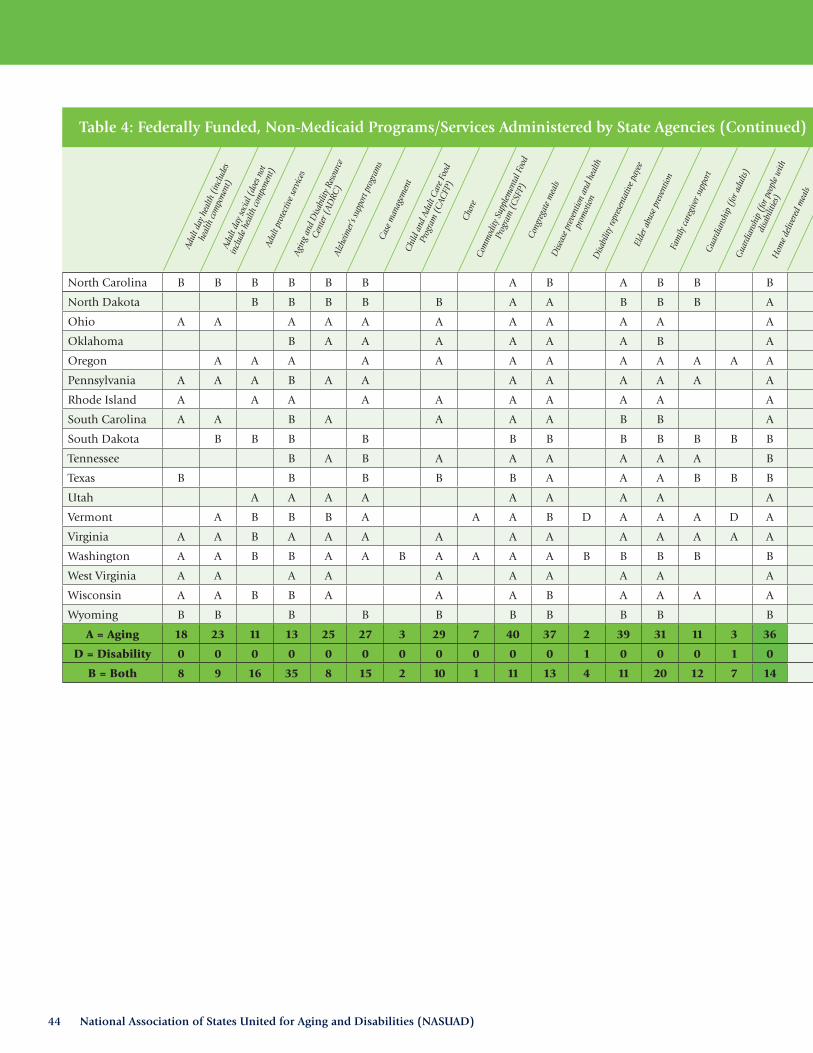
National Association of States United for Aging and Disabilities (NASUAD)44
Table 4: Federally Funded, Non-Medicaid Programs/Services Administered by State Agencies (Continued)
Adul
t day
hea
lth (
inclu
des
heal
th c
ompo
nent
)Ad
ult d
ay so
cial
(do
es n
ot
inclu
de h
ealth
com
pone
nt)
Adul
t pro
tect
ive
serv
ices
Agin
g an
d D
isabi
lity
Reso
urce
Cen
ter (
ADRC
)Al
zhei
mer
’s su
ppor
t pro
gram
sC
ase
man
agem
ent
Chi
ld a
nd A
dult
Car
e Fo
od
Prog
ram
(C
ACFP
)
Cho
reC
omm
odity
Sup
plem
enta
l Foo
d
Prog
ram
(C
SFP)
Con
greg
ate
mea
lsD
iseas
e pr
even
tion
and
heal
th
prom
otio
nD
isabi
lity
repr
esen
tativ
e pa
yee
Elde
r abu
se p
reve
ntio
nFa
mily
car
egiv
er su
ppor
tG
uard
ians
hip
(for
adu
lts)
Gua
rdia
nshi
p (f
or p
eopl
e w
ith
disa
bilit
ies)
Hom
e de
liver
ed m
eals
North Carolina B B B B B B A B A B B B B B A A B B B B B A A A
North Dakota B B B B B A A B B B A B B A B B B B A
Ohio A A A A A A A A A A A A A A B B A A A A A A A A B
Oklahoma B A A A A A A B A A B A B A A A A A A
Oregon A A A A A A A A A A A A A A A A A A A A A A A A A
Pennsylvania A A A B A A A A A A A A A A A A A B A B A B A A A A B A
Rhode Island A A A A A A A A A A A A A A A A A A A A
South Carolina A A B A A A A B B A A A B B B B A A A A A A B
South Dakota B B B B B B B B B B B B B A B B B B A
Tennessee B A B A A A A A A B B B A A A B A B B
Texas B B B B B A A A B B B B B B A A A A B A A A
Utah A A A A A A A A A A A A A A A A A A A A
Vermont A B B B A A A B D A A A D A A B A A A A B B A A A A B B B B
Virginia A A B A A A A A A A A A A A A A A A A A A A A A A A A A
Washington A A B B A A B A A A A B B B B B A A B A B B A B A A A A B B B B D
West Virginia A A A A A A A A A A A A A A A A A A A A A A A A
Wisconsin A A B B A A A B A A A A A B B A A A A A A A A B B
Wyoming B B B B B B B B B B B B B B B B B B B B
A = Aging 18 23 11 13 25 27 3 29 7 40 37 2 39 31 11 3 36 32 5 22 16 41 8 22 3 37 22 8 27 33 31 21 26 23 0 2 11 1
D = Disability 0 0 0 0 0 0 0 0 0 0 0 1 0 0 0 1 0 0 2 0 0 0 0 0 1 0 0 0 1 0 0 0 0 0 0 1 0 1
B = Both 8 9 16 35 8 15 2 10 1 11 13 4 11 20 12 7 14 16 7 28 7 5 8 25 6 10 18 6 18 6 5 1 7 14 2 6 9 3

2012 State of Aging and Disabilities Survey: Another Year of Challenges Tempered by Opportunities 45
Table 4: Federally Funded, Non-Medicaid Programs/Services Administered by State Agencies (Continued)
Hom
emak
er
Inde
pend
ent l
ivin
gIn
form
atio
n an
d re
ferr
alKi
nshi
p ca
reLe
gal a
ssist
ance
dev
elop
men
tLo
ng T
erm
Car
e O
mbu
dsm
an
(in-
hom
e se
rvic
es)
Long
Ter
m C
are
Om
buds
man
(lon
g te
rm c
are
faci
lity)
Low
Inco
me
Hom
e En
ergy
Assis
tanc
e Pr
ogra
m (
LIH
EAP)
Tran
spor
tatio
n
Pers
onal
car
ePu
blic
gua
rdia
nshi
p
Resp
ite
Seni
or c
ente
rsSe
nior
Com
mun
ity S
ervi
ce
Empl
oym
ent P
rogr
am (
SCSE
P)
Seni
or F
arm
ers’
Mar
ket N
utrit
ion
Prog
ram
(SF
MN
P)Se
nior
Med
icar
e Pa
trol (
SMP)
Hom
e de
liver
ed m
eals
Stat
e H
ealth
Insu
ranc
e As
sista
nce
Prog
ram
(SH
IP)
The
Emer
genc
y Fo
od A
ssist
ance
Prog
ram
(TE
FAP)
Trau
mat
ic B
rain
Inju
ry G
rant
Prog
ram
Vete
rans
-Dire
cted
Hom
e an
d
Com
mun
ity B
ased
Ser
vice
sVo
catio
nal r
ehab
ilita
tion
North Carolina B B B B B B A B A B B B B B A A B B B B B A A A
North Dakota B B B B B A A B B B A B B A B B B B A
Ohio A A A A A A A A A A A A A A B B A A A A A A A A B
Oklahoma B A A A A A A B A A B A B A A A A A A
Oregon A A A A A A A A A A A A A A A A A A A A A A A A A
Pennsylvania A A A B A A A A A A A A A A A A A B A B A B A A A A B A
Rhode Island A A A A A A A A A A A A A A A A A A A A
South Carolina A A B A A A A B B A A A B B B B A A A A A A B
South Dakota B B B B B B B B B B B B B A B B B B A
Tennessee B A B A A A A A A B B B A A A B A B B
Texas B B B B B A A A B B B B B B A A A A B A A A
Utah A A A A A A A A A A A A A A A A A A A A
Vermont A B B B A A A B D A A A D A A B A A A A B B A A A A B B B B
Virginia A A B A A A A A A A A A A A A A A A A A A A A A A A A A
Washington A A B B A A B A A A A B B B B B A A B A B B A B A A A A B B B B D
West Virginia A A A A A A A A A A A A A A A A A A A A A A A A
Wisconsin A A B B A A A B A A A A A B B A A A A A A A A B B
Wyoming B B B B B B B B B B B B B B B B B B B B
A = Aging 18 23 11 13 25 27 3 29 7 40 37 2 39 31 11 3 36 32 5 22 16 41 8 22 3 37 22 8 27 33 31 21 26 23 0 2 11 1
D = Disability 0 0 0 0 0 0 0 0 0 0 0 1 0 0 0 1 0 0 2 0 0 0 0 0 1 0 0 0 1 0 0 0 0 0 0 1 0 1
B = Both 8 9 16 35 8 15 2 10 1 11 13 4 11 20 12 7 14 16 7 28 7 5 8 25 6 10 18 6 18 6 5 1 7 14 2 6 9 3

National Association of States United for Aging and Disabilities (NASUAD)46
State appropriation
Table 5: Sources of Funding for State Agencies
Local (i.e. county or city) funding
Targeted tax State lottery Foundation/private grants
Older Americans Act Medicaid
Alabama ✓ ✓ ✓ ✓ ✓ ✓
Alaska ✓ ✓ ✓
Arizona ✓ ✓ ✓ ✓ ✓ ✓ ✓ ✓ ✓ ✓
Arkansas ✓ ✓ ✓ ✓ ✓ ✓ ✓ ✓ ✓
California ✓ ✓ ✓ ✓ ✓
Colorado ✓ ✓ ✓ ✓ ✓ ✓ ✓ ✓
CNMI ✓ ✓ ✓ ✓ ✓ ✓
Connecticut ✓ ✓ ✓ ✓ ✓ ✓ ✓ ✓ ✓
Delaware ✓ ✓ ✓ ✓
District of Columbia ✓ ✓ ✓ ✓ ✓
Florida ✓ ✓ ✓ ✓ ✓ ✓
Georgia ✓ ✓ ✓ ✓ ✓ ✓ ✓ ✓
Hawaii ✓ ✓ ✓ ✓
Idaho ✓ ✓ ✓
Illinois ✓ ✓ ✓ ✓
Indiana ✓ ✓ ✓ ✓ ✓ ✓
Iowa ✓ ✓ ✓
Kansas ✓ ✓ ✓ ✓ ✓
Kentucky ✓ ✓ ✓ ✓ ✓ ✓
Louisiana ✓ ✓
Maine ✓ ✓ ✓ ✓ ✓ ✓ ✓
Maryland ✓ ✓ ✓ ✓ ✓
Massachusetts ✓ ✓ ✓ ✓ ✓
Michigan ✓ ✓ ✓ ✓ ✓
Minnesota ✓ ✓ ✓ ✓
Mississippi ✓ ✓ ✓ ✓ ✓
Missouri ✓ ✓ ✓ ✓ ✓ ✓
Montana ✓ ✓ ✓ ✓
Nebraska
Nevada ✓ ✓ ✓ ✓ ✓
New Hampshire ✓ ✓ ✓ ✓ ✓ ✓
New Jersey ✓ ✓ ✓ ✓ ✓ ✓ ✓
New Mexico ✓ ✓ ✓ ✓ ✓ ✓
New York ✓ ✓ ✓ ✓ ✓ ✓ ✓ ✓
North Carolina ✓ ✓ ✓ ✓ ✓ ✓ ✓ ✓ ✓
North Dakota ✓ ✓ ✓ ✓ ✓ ✓ ✓
Ohio ✓ ✓ ✓ ✓ ✓ ✓
Oklahoma ✓ ✓ ✓ ✓ ✓ ✓ ✓

2012 State of Aging and Disabilities Survey: Another Year of Challenges Tempered by Opportunities 47
Community Services Block Grant
Social Services Block Grant
Federal Emergency Management
Agency (FEMA)
U.S. Department of Agriculture
U.S. Department of Education
U.S. Department of Justice
U.S. Department of Labor
U.S. Department of Transportation
Other
Alabama ✓ ✓ ✓ ✓ ✓ ✓
Alaska ✓ ✓ ✓
Arizona ✓ ✓ ✓ ✓ ✓ ✓ ✓ ✓ ✓ ✓
Arkansas ✓ ✓ ✓ ✓ ✓ ✓ ✓ ✓ ✓
California ✓ ✓ ✓ ✓ ✓
Colorado ✓ ✓ ✓ ✓ ✓ ✓ ✓ ✓
CNMI ✓ ✓ ✓ ✓ ✓ ✓
Connecticut ✓ ✓ ✓ ✓ ✓ ✓ ✓ ✓ ✓
Delaware ✓ ✓ ✓ ✓
District of Columbia ✓ ✓ ✓ ✓ ✓
Florida ✓ ✓ ✓ ✓ ✓ ✓
Georgia ✓ ✓ ✓ ✓ ✓ ✓ ✓ ✓
Hawaii ✓ ✓ ✓ ✓
Idaho ✓ ✓ ✓
Illinois ✓ ✓ ✓ ✓
Indiana ✓ ✓ ✓ ✓ ✓ ✓
Iowa ✓ ✓ ✓
Kansas ✓ ✓ ✓ ✓ ✓
Kentucky ✓ ✓ ✓ ✓ ✓ ✓
Louisiana ✓ ✓
Maine ✓ ✓ ✓ ✓ ✓ ✓ ✓
Maryland ✓ ✓ ✓ ✓ ✓
Massachusetts ✓ ✓ ✓ ✓ ✓
Michigan ✓ ✓ ✓ ✓ ✓
Minnesota ✓ ✓ ✓ ✓
Mississippi ✓ ✓ ✓ ✓ ✓
Missouri ✓ ✓ ✓ ✓ ✓ ✓
Montana ✓ ✓ ✓ ✓
Nebraska
Nevada ✓ ✓ ✓ ✓ ✓
New Hampshire ✓ ✓ ✓ ✓ ✓ ✓
New Jersey ✓ ✓ ✓ ✓ ✓ ✓ ✓
New Mexico ✓ ✓ ✓ ✓ ✓ ✓
New York ✓ ✓ ✓ ✓ ✓ ✓ ✓ ✓
North Carolina ✓ ✓ ✓ ✓ ✓ ✓ ✓ ✓ ✓
North Dakota ✓ ✓ ✓ ✓ ✓ ✓ ✓
Ohio ✓ ✓ ✓ ✓ ✓ ✓
Oklahoma ✓ ✓ ✓ ✓ ✓ ✓ ✓

National Association of States United for Aging and Disabilities (NASUAD)48
State appropriation
Table 5: Sources of Funding for State Agencies (Continued)
Local (i.e. county or city) funding
Targeted tax State lottery Foundation/private grants
Older Americans Act Medicaid
Oregon ✓ ✓ ✓ ✓ ✓ ✓
Pennsylvania ✓ ✓ ✓ ✓ ✓ ✓ ✓
Rhode Island ✓ ✓ ✓ ✓ ✓
South Carolina ✓ ✓ ✓ ✓ ✓ ✓ ✓
South Dakota ✓ ✓ ✓ ✓ ✓ ✓
Tennessee ✓ ✓ ✓
Texas ✓ ✓ ✓ ✓ ✓
Utah ✓ ✓ ✓ ✓ ✓ ✓
Vermont ✓ ✓ ✓ ✓ ✓ ✓ ✓ ✓
Virginia ✓ ✓ ✓ ✓ ✓
Washington ✓ ✓ ✓ ✓ ✓ ✓ ✓
West Virginia ✓ ✓ ✓ ✓ ✓ ✓
Wisconsin ✓ ✓ ✓ ✓ ✓ ✓ ✓
Wyoming ✓ ✓
51 12 13 3 12 51 35 9 22 1 29 4 1 31 5 15

2012 State of Aging and Disabilities Survey: Another Year of Challenges Tempered by Opportunities 49
Community Services Block Grant
Social Services Block Grant
Federal Emergency Management
Agency (FEMA)
U.S. Department of Agriculture
U.S. Department of Education
U.S. Department of Justice
U.S. Department of Labor
U.S. Department of Transportation
Other
Oregon ✓ ✓ ✓ ✓ ✓ ✓
Pennsylvania ✓ ✓ ✓ ✓ ✓ ✓ ✓
Rhode Island ✓ ✓ ✓ ✓ ✓
South Carolina ✓ ✓ ✓ ✓ ✓ ✓ ✓
South Dakota ✓ ✓ ✓ ✓ ✓ ✓
Tennessee ✓ ✓ ✓
Texas ✓ ✓ ✓ ✓ ✓
Utah ✓ ✓ ✓ ✓ ✓ ✓
Vermont ✓ ✓ ✓ ✓ ✓ ✓ ✓ ✓
Virginia ✓ ✓ ✓ ✓ ✓
Washington ✓ ✓ ✓ ✓ ✓ ✓ ✓
West Virginia ✓ ✓ ✓ ✓ ✓ ✓
Wisconsin ✓ ✓ ✓ ✓ ✓ ✓ ✓
Wyoming ✓ ✓
51 12 13 3 12 51 35 9 22 1 29 4 1 31 5 15

National Association of States United for Aging and Disabilities (NASUAD)50
Table 6: Non-Medicaid, State-Only Funded HCBS Administered by State Agencies
Adul
t day
hea
lth (
inclu
des h
ealth
com
pone
nt)
Adul
t day
socia
l (do
es n
ot in
clude
heal
th co
mpo
nent
)Ad
ult f
oste
r car
e
Assis
ted
livin
g
Beha
vior
al su
ppor
tsCa
se m
anag
emen
tCo
mm
unity
tran
sitio
n su
ppor
tD
ay h
abili
tatio
nEn
viro
nmen
tal m
odifi
catio
nsH
ome-
deliv
ered
mea
ls
Hom
emak
er
Inde
pend
ent l
ivin
gN
utrit
iona
l sup
plem
ents
Occ
upat
iona
l the
rapy
Perso
nal a
ssista
nce s
ervi
ces
Perso
nal e
mer
genc
y
resp
onse
syste
ms
Alabama ✓ ✓
Alaska ✓ ✓ ✓ ✓ ✓ ✓ ✓ ✓ ✓Chore, Group Home, Supported living, ADRD Education. Senior residential housing (rural)
Arizona ✓ ✓ ✓ ✓ ✓ ✓ ✓ ✓ ✓ ✓
Arkansas
California
Colorado
CNMI
Connecticut ✓ ✓ ✓ ✓ ✓ ✓ ✓ ✓ ✓ ✓ ✓ ✓ ✓
Delaware ✓ ✓ ✓
District of Columbia ✓ ✓ ✓ Wellness and Excercise
Florida ✓ ✓ ✓ ✓ ✓ ✓ ✓ ✓ ✓ ✓ ✓ ✓ ✓ ✓ ✓
Georgia
Hawaii ✓ ✓ ✓ ✓ ✓ ✓ Chore and Assisted Transportation
Idaho
Illinois
Indiana ✓ ✓ ✓ ✓ ✓ ✓ ✓ ✓ ✓ ✓ ✓ ✓ ✓ ✓ ✓ ✓ ✓ ✓ ✓ ✓ ✓
Iowa
Kansas ✓ ✓ ✓ ✓
Kentucky ✓ ✓ ✓ ✓
Louisiana ✓ ✓ ✓ ✓
Maine ✓ ✓ ✓ ✓ ✓ ✓ ✓ ✓ ✓ ✓ ✓ ✓ ✓ ✓
Maryland ✓ ✓ ✓ ✓ ✓ ✓ ✓ ✓ ✓ ✓ ✓
Maryland has a State-funded program called Senior Care which may cover the cost of almost any service that is needed to divert someone from LTC placement. The services checked here are generally services which may be paid for with Senior Care funds, not stand-alone categorical services.
Massachusetts ✓ ✓ ✓ ✓ ✓ ✓ ✓ ✓ ✓ ✓ ✓ ✓ ✓ ✓ ✓ ✓ ✓ ✓
Habilitation Therapy, Wanderer Locator, Chore, Laundry, Food Shopping/Delivery, Nutrition Assessment, Skilled Nursing, Medicine Dispensing System
Michigan ✓ ✓ ✓ ✓ ✓ ✓ ✓ ✓ ✓ ✓ ✓ ✓ ✓ Chore
Minnesota ✓ ✓ ✓ ✓ ✓ ✓ ✓ ✓ ✓ ✓ ✓ ✓Caregiver training, education; home health; companion services; chore;
Mississippi

2012 State of Aging and Disabilities Survey: Another Year of Challenges Tempered by Opportunities 51
Phys
ical t
hera
py
Recr
eatio
n th
erap
yRe
siden
tial h
abili
tatio
n
Resp
iteSp
ecia
lized
equi
pmen
t, su
pplie
s or
assis
tive t
echn
olog
ySp
eech
ther
apy
Stat
e pha
rmac
eutic
al a
ssista
nce
Supp
orte
d em
ploy
men
tSu
ppor
ted
livin
g
Tran
spor
tatio
nVo
catio
nal r
ehab
ilita
tion
Oth
er
Expl
anat
ion
on “
Oth
er”
Table 6: Non-Medicaid, State-Only Funded HCBS Administered by State Agencies
Perso
nal e
mer
genc
y
resp
onse
syste
ms
Alabama ✓ ✓
Alaska ✓ ✓ ✓ ✓ ✓ ✓ ✓ ✓ ✓Chore, Group Home, Supported living, ADRD Education. Senior residential housing (rural)
Arizona ✓ ✓ ✓ ✓ ✓ ✓ ✓ ✓ ✓ ✓
Arkansas
California
Colorado
CNMI
Connecticut ✓ ✓ ✓ ✓ ✓ ✓ ✓ ✓ ✓ ✓ ✓ ✓ ✓
Delaware ✓ ✓ ✓
District of Columbia ✓ ✓ ✓ Wellness and Excercise
Florida ✓ ✓ ✓ ✓ ✓ ✓ ✓ ✓ ✓ ✓ ✓ ✓ ✓ ✓ ✓
Georgia
Hawaii ✓ ✓ ✓ ✓ ✓ ✓ Chore and Assisted Transportation
Idaho
Illinois
Indiana ✓ ✓ ✓ ✓ ✓ ✓ ✓ ✓ ✓ ✓ ✓ ✓ ✓ ✓ ✓ ✓ ✓ ✓ ✓ ✓ ✓
Iowa
Kansas ✓ ✓ ✓ ✓
Kentucky ✓ ✓ ✓ ✓
Louisiana ✓ ✓ ✓ ✓
Maine ✓ ✓ ✓ ✓ ✓ ✓ ✓ ✓ ✓ ✓ ✓ ✓ ✓ ✓
Maryland ✓ ✓ ✓ ✓ ✓ ✓ ✓ ✓ ✓ ✓ ✓
Maryland has a State-funded program called Senior Care which may cover the cost of almost any service that is needed to divert someone from LTC placement. The services checked here are generally services which may be paid for with Senior Care funds, not stand-alone categorical services.
Massachusetts ✓ ✓ ✓ ✓ ✓ ✓ ✓ ✓ ✓ ✓ ✓ ✓ ✓ ✓ ✓ ✓ ✓ ✓
Habilitation Therapy, Wanderer Locator, Chore, Laundry, Food Shopping/Delivery, Nutrition Assessment, Skilled Nursing, Medicine Dispensing System
Michigan ✓ ✓ ✓ ✓ ✓ ✓ ✓ ✓ ✓ ✓ ✓ ✓ ✓ Chore
Minnesota ✓ ✓ ✓ ✓ ✓ ✓ ✓ ✓ ✓ ✓ ✓ ✓Caregiver training, education; home health; companion services; chore;
Mississippi

National Association of States United for Aging and Disabilities (NASUAD)52
Table 6: Non-Medicaid, State-Only Funded HCBS Administered by State Agencies (Continued)
Adul
t day
hea
lth (
inclu
des h
ealth
com
pone
nt)
Adul
t day
socia
l (do
es n
ot in
clude
heal
th co
mpo
nent
)Ad
ult f
oste
r car
e
Assis
ted
livin
g
Beha
vior
al su
ppor
tsCa
se m
anag
emen
tCo
mm
unity
tran
sitio
n su
ppor
tD
ay h
abili
tatio
nEn
viro
nmen
tal m
odifi
catio
nsH
ome-
deliv
ered
mea
ls
Hom
emak
er
Inde
pend
ent l
ivin
gN
utrit
iona
l sup
plem
ents
Occ
upat
iona
l the
rapy
Perso
nal a
ssista
nce s
ervi
ces
Perso
nal e
mer
genc
y
resp
onse
syste
ms
Missouri ✓ ✓ ✓ ✓ ✓
Montana
Nevada ✓ ✓ ✓ ✓ ✓ ✓
New Hampshire
New Jersey ✓ ✓ ✓ ✓ ✓ ✓ ✓ ✓ ✓ ✓ ✓ ✓ ✓Chore services such as clean-outs, attendant care, caregiver/participant training.
New Mexico ✓Could be Institutional Transition Advocacy
New York ✓ ✓ ✓ ✓ ✓ ✓ ✓ ✓ ✓ ✓ ✓ ✓ NORCs
North Carolina ✓ ✓ ✓ ✓ ✓ ✓ ✓ ✓
North Dakota ✓ ✓ ✓ ✓ ✓ ✓ ✓ ✓ ✓ ✓ ✓ ✓
Ohio ✓ ✓ ✓ ✓ ✓ ✓ ✓ ✓ ✓ ✓ ✓ ✓ ✓
Oklahoma ✓ ✓
Oregon ✓ ✓ ✓ ✓ ✓ ✓
Pennsylvania ✓ ✓ ✓ ✓ ✓ ✓ ✓ ✓ ✓ ✓ ✓ ✓ ✓ ✓ ✓ ✓ ✓ ✓
Rhode Island ✓ ✓ ✓
South Carolina ✓ ✓ ✓ ✓ ✓ ✓ ✓ ✓ ✓ ✓ ✓Services to older adults not yet 60 but in need of OAA services
South Dakota ✓ ✓ ✓
Tennessee ✓ ✓ ✓ ✓
Texas ✓ ✓ ✓ ✓ ✓ ✓ ✓ ✓ ✓ ✓ ✓ ✓
Home health services; Home health aides; chore services, medical services; surgical, therapeutic, diagnostic and other health services; room and board during evaluation or treatment.
Utah ✓ ✓ ✓ ✓ ✓ ✓ ✓ ✓
Vermont ✓ ✓ ✓ ✓
Virginia ✓ ✓ ✓ ✓ ✓ ✓Pharmacy Connect, companion care, senior centers
Washington ✓ ✓ ✓ ✓ ✓ ✓ ✓ ✓ ✓ ✓ ✓ ✓ ✓ ✓ ✓ ✓ ✓ ✓
West Virginia ✓ ✓ ✓ ✓ ✓ ✓
Wisconsin
Wyoming ✓ ✓ ✓ ✓ ✓ ✓ ✓
18 19 3 6 4 26 9 3 17 26 28 3 7 6 28 18 7 5 4 29 18 7 7 5 2 22 1 12

2012 State of Aging and Disabilities Survey: Another Year of Challenges Tempered by Opportunities 53
Phys
ical t
hera
py
Recr
eatio
n th
erap
yRe
siden
tial h
abili
tatio
n
Resp
iteSp
ecia
lized
equi
pmen
t, su
pplie
s or
assis
tive t
echn
olog
ySp
eech
ther
apy
Stat
e pha
rmac
eutic
al a
ssista
nce
Supp
orte
d em
ploy
men
tSu
ppor
ted
livin
g
Tran
spor
tatio
nVo
catio
nal r
ehab
ilita
tion
Oth
er
Expl
anat
ion
on “
Oth
er”
Table 6: Non-Medicaid, State-Only Funded HCBS Administered by State Agencies (Continued)
Perso
nal e
mer
genc
y
resp
onse
syste
ms
Missouri ✓ ✓ ✓ ✓ ✓
Montana
Nevada ✓ ✓ ✓ ✓ ✓ ✓
New Hampshire
New Jersey ✓ ✓ ✓ ✓ ✓ ✓ ✓ ✓ ✓ ✓ ✓ ✓ ✓Chore services such as clean-outs, attendant care, caregiver/participant training.
New Mexico ✓Could be Institutional Transition Advocacy
New York ✓ ✓ ✓ ✓ ✓ ✓ ✓ ✓ ✓ ✓ ✓ ✓ NORCs
North Carolina ✓ ✓ ✓ ✓ ✓ ✓ ✓ ✓
North Dakota ✓ ✓ ✓ ✓ ✓ ✓ ✓ ✓ ✓ ✓ ✓ ✓
Ohio ✓ ✓ ✓ ✓ ✓ ✓ ✓ ✓ ✓ ✓ ✓ ✓ ✓
Oklahoma ✓ ✓
Oregon ✓ ✓ ✓ ✓ ✓ ✓
Pennsylvania ✓ ✓ ✓ ✓ ✓ ✓ ✓ ✓ ✓ ✓ ✓ ✓ ✓ ✓ ✓ ✓ ✓ ✓
Rhode Island ✓ ✓ ✓
South Carolina ✓ ✓ ✓ ✓ ✓ ✓ ✓ ✓ ✓ ✓ ✓Services to older adults not yet 60 but in need of OAA services
South Dakota ✓ ✓ ✓
Tennessee ✓ ✓ ✓ ✓
Texas ✓ ✓ ✓ ✓ ✓ ✓ ✓ ✓ ✓ ✓ ✓ ✓
Home health services; Home health aides; chore services, medical services; surgical, therapeutic, diagnostic and other health services; room and board during evaluation or treatment.
Utah ✓ ✓ ✓ ✓ ✓ ✓ ✓ ✓
Vermont ✓ ✓ ✓ ✓
Virginia ✓ ✓ ✓ ✓ ✓ ✓Pharmacy Connect, companion care, senior centers
Washington ✓ ✓ ✓ ✓ ✓ ✓ ✓ ✓ ✓ ✓ ✓ ✓ ✓ ✓ ✓ ✓ ✓ ✓
West Virginia ✓ ✓ ✓ ✓ ✓ ✓
Wisconsin
Wyoming ✓ ✓ ✓ ✓ ✓ ✓ ✓
18 19 3 6 4 26 9 3 17 26 28 3 7 6 28 18 7 5 4 29 18 7 7 5 2 22 1 12

National Association of States United for Aging and Disabilities (NASUAD)54
Active Choices
Table 7: Types of Evidence-Based Programs Operated by State Agencies and Funding Sources
A Matter of Balance
Caregiver Support
Programs
Chronic Disease Self-Management
Enhance- Fitness
Enhance-Wellness
Healthy IDEAS or PEARLS
Prevention and Managements
of Alcohol Problems in Older Adults
Transition from
Institutions Programs
Other Programs
AoA = Adminstration on AgingM = MedicaidS = StateO = Other
Alabama AoA/O AoA/O AoA/O
Alaska AoA AoA AoA
Arizona AoA AoA AoA AoA AoA
Arkansas AoA OAA AoA
California AoA AoA AoA/O
CNMI AoA/S
Colorado AoA/S/O AoA/S/O AoA/S/O AoA/O
Connecticut OAA AoA/S
Delaware AoA/O AoA AoA/O S AoA
District of Columbia AoA/S O AoA/S AoA/S S O
Florida AoA AoA O O AoA O AoA
Georgia O AoA AoA M AoA
Hawaii AoA/S/O AoA/S/O AoA/S/O
Idaho O M
Illinois AoA AoA AoA/S M
Indiana AoA AoA AoA/M
Iowa
Kansas AoA/S/O O
Kentucky AoA/S AoA/S/O
Louisiana O AoA
Maine O AoA/S AoA S/O
Maryland AoA/O AoA/O AoA/O AoA/M AoA/O
Massachusetts AoA/O AoA/O AoA/O AoA/O M/S/O O
Michigan AoA AoA AoA
Minnesota AoA AoA/S AoA S AoA/M/S
Mississippi AoA AoA
Missouri
Montana
Nevada AoA
New Hampshire AoA AoA/O AoA M
New Jersey AoA AoA/S AoA AoA AoA/M/S AoA/M/S
New Mexico S/O AoA/S/O S/O S/O M/S S/O
New York AoA/S AoA/S AoA/S AoA/S
North Carolina AoA/O AoA/O AoA/O AoA/O O
North Dakota AoA
Ohio AoA/O AoA/S AoA/O AoA/M/O AoA AoA/M/O

2012 State of Aging and Disabilities Survey: Another Year of Challenges Tempered by Opportunities 55
Active Choices
Table 7: Types of Evidence-Based Programs Operated by State Agencies and Funding Sources (Continued)
A Matter of Balance
Caregiver Support
Programs
Chronic Disease Self-Management
Enhance- Fitness
Enhance-Wellness
Healthy IDEAS or PEARLS
Prevention and Managements
of Alcohol Problems in Older Adults
Transition from
Institutions Programs
Other Programs
AoA = Adminstration on AgingM = MedicaidS = StateO = Other
Oklahoma AoA/S/O AoA/S AoA/S/O S/O
Oregon AoA AoA AoA AoA AoA
Pennsylvania AoA/S AoA/S M/S S
Rhode Island O AoA AoA M
South Carolina O AoA/O AoA/O
South Dakota AoA
Tennessee AoA
Texas O AoA AoA O AoA
Utah AoA/S AoA
Vermont AoA/M AoA/M AoA/M AoA
Virginia AoA
Washington AoA/S AoA/M O O AoA/O M/S
West Virginia AoA AoA/S O AoA
Wisconsin AoA/O AoA/S AoA/O O O AoA/M/O
Wyoming AoA/O

National Association of States United for Aging and Disabilities (NASUAD)56
Adult Foster Care
Table 8: Medicaid HCBS Waivers Operated by State Agencies
Alzheimer’s Disease
Assisted Living
Autism Intellectual/ Developmental
Disabilities
Elders Elders and Adults with Disabilities
Physical Disabilities
Severe Emotional
Disturbance
Traumatic Brain Injury
Other HCBS
Waivers
Alabama ✓ ✓ ✓
Alaska ✓ ✓ ✓
Arizona
Arkansas ✓ ✓ ✓ ✓ ✓
California ✓
CNMI
Colorado
Connecticut ✓ ✓ ✓
Delaware
District of Co-lumbia
Florida ✓ ✓ ✓ ✓
Georgia ✓ ✓ ✓ ✓ ✓
Hawaii
Idaho
Illinois ✓ ✓ ✓
Indiana ✓ ✓ ✓
Iowa
Kansas ✓ ✓ ✓ ✓ ✓ ✓ ✓ ✓
Kentucky ✓ ✓ ✓ ✓
Louisiana
Maine ✓ ✓ ✓ ✓
Maryland ✓
Massachusetts ✓
Michigan
Minnesota ✓
Mississippi
Missouri ✓ ✓ ✓
Montana
Nebraska
Nevada ✓ ✓
New Hampshire ✓
New Jersey ✓
New Mexico
New York
North Carolina
North Dakota
Ohio ✓ ✓
Oklahoma ✓

2012 State of Aging and Disabilities Survey: Another Year of Challenges Tempered by Opportunities 57
Adult Foster Care
Table 8: Medicaid HCBS Waivers Operated by State Agencies (Continued)
Alzheimer’s Disease
Assisted Living
Autism Intellectual/ Developmental
Disabilities
Elders Elders and Adults with Disabilities
Physical Disabilities
Severe Emotional
Disturbance
Traumatic Brain Injury
Other HCBS
Waivers
Oregon ✓ ✓ ✓ ✓ ✓ ✓ ✓ ✓
Pennsylvania ✓ ✓ ✓
Rhode Island
South Carolina
South Dakota ✓
Tennessee
Texas ✓ ✓ ✓ ✓ ✓ ✓ ✓
Utah
Vermont ✓
Virginia
Washington ✓ ✓ ✓
West Virginia ✓
Wisconsin
Wyoming
2 3 8 2 7 15 18 12 3 6 7

National Association of States United for Aging and Disabilities (NASUAD)58
Table 9: Medicaid HCBS Waiver Services Operated by State Agencies, by Who Directs the Services
Adul
t Day
Hea
lth (
inclu
des h
ealth
com
pone
nt)
Adul
t Day
Soc
ial (
does
not
inclu
de
heal
th co
mpo
nent
)Ad
ult F
oste
r Car
e
Assis
ted
Livi
ng
Assis
tive T
echn
olog
yBe
havi
oral
Sup
ports
Case
Man
agem
ent
Com
mun
ity T
rans
ition
Sup
port
Day
Hab
ilita
tion
Envi
ronm
enta
l Mod
ifica
tions
Hom
e-de
liver
ed M
eals
Hom
emak
er
Nut
ritio
nal S
uppl
emen
tsO
ccup
atio
nal T
hera
pyA = Service is Agency-DirectedC = Service is Consumer-DirectedW = Service Offered under Waiver(s)
Alabama A W W A/W A W C/W A/W A/C/W W A/C/W A/C/W W W A/C/W
Alaska A/W A/W A/W A/W A/W A/W A/C/W A/W A/W A/W A/W A/W A/W
Arizona
Arkansas A/W A/W A/W A/W A/W A/W A/W A/W A/W A/C /W A/W A/W
California W A W A/W A/W A/W W A/W A/W A/W A/W A/W A/W A/W A/W A/W A/W A/W A/W A/W A/W
CNMI A A A A A A W A A A W A A A A A W W A A A W A W
Colorado A/W A/W A A/W A/C/W A/C/W A/C/W A/C/W A/W A/C/W A/C/W A/C/W A/W A/W A/W
Connecticut A/C/W A/C/W W A/C/W W W A/C/W A/C/W A/C/W A/C/W A/C/W A/C/W W W A/C/W C
Delaware
District of Columbia
Florida A/C/W A/C/W A/W A/C/W A/C/W A/W A/C/W A/C/W A/C/W A/W A/C/W A/C/W A/C/W W A/C/W W C
Georgia W W W W W C/W W W
Hawaii
Idaho
Illinois A A A/W A/W A/W A/W A/W A/C/W A/C/W A/W A/W A/W A/W A/W
Indiana A/W A/W A/W A/W A/W A/W A/W A/W A/W A/W A/W A/W A/W A/W A/W A/C/W A/W A/W A/W A/W A/W A/W A/W
Iowa
Kansas A/W A/W A/C/W A /W A/W A/C/W A/W A/W A/C/W
Kentucky W W C/W C/W C/W C/W W W W
Louisiana
Maine A/W A/W A/W A/W A/W A/W A/C/W A/W A/C/W A/ C /W A/W A/W A/W A/W A/W A/W
Maryland W W W A W W W W C/W W
Massachusetts W A/W A/C/W A/W A/C/W A/W A/W A/C/W A/W W W A/C/W W C/W W C/W A/W C/W C/W C/W C/W A/W W C/W
Michigan
Minnesota A/C/W A/C/W A/C/W A/C/W A/C/W W A/C/W A/C/W W A/C/W A/C/W A/C/W A/C/W A/C/W A/C/W A/C/W A/C/W A/C/W A/C/W A/C/W
Mississippi
Missouri C C C/W A/W A/W A/W A/C/W C/W
Montana A/W A/W A/W A/W A/W A/W A/W A/W A/W A/W A/W A/C/W A/C/W A/W A/C/W A/C/W A/W A/W A/W A/W A/W A/W A/W A/W A/C/W A/C/W A/C/W A/W A/C/W
Nebraska
Nevada W W W W W
New Hampshire A/W A/W A/W A/C/W A/W A/W A/W A/C/W A/C/W A/W A/W
New Jersey A/W A/W A/W A/W A/W A/W A/W A/W A/C/W A/W A/W A/C/W A/C/W
New Mexico
New York
North Carolina

2012 State of Aging and Disabilities Survey: Another Year of Challenges Tempered by Opportunities 59
Table 9: Medicaid HCBS Waiver Services Operated by State Agencies, by Who Directs the Services
Resp
ite
Perso
nal A
ssista
nce S
ervi
ces
Perso
nal E
mer
genc
y
Resp
onse
Sys
tem
s
Phys
ical T
hera
py
Recr
eatio
n Th
erap
yRe
siden
tial H
abili
tatio
nSp
ecia
lized
Equ
ipm
ent
and
Supp
lies
Spee
ch T
hera
py
Supp
orte
d Em
ploy
men
t
Supp
orte
d Li
ving
Tran
spor
tatio
nEx
tend
ed S
tate
Pla
n W
aive
r
Bene
fit: P
erso
nal C
are
Exte
nded
Sta
te P
lan
Wai
ver
Bene
fit: N
ursin
gEx
tend
ed S
tate
Pla
n W
aive
r
Bene
fit: H
ome H
ealth
Exte
nded
Sta
te P
lan
Wai
ver B
enefi
t: ot
her
Oth
er M
edica
id H
CBS
Wai
ver S
ervi
ces
Alabama A W W A/W A W C/W A/W A/C/W W A/C/W A/C/W W W A/C/W
Alaska A/W A/W A/W A/W A/W A/W A/C/W A/W A/W A/W A/W A/W A/W
Arizona
Arkansas A/W A/W A/W A/W A/W A/W A/W A/W A/W A/C /W A/W A/W
California W A W A/W A/W A/W W A/W A/W A/W A/W A/W A/W A/W A/W A/W A/W A/W A/W A/W A/W
CNMI A A A A A A W A A A W A A A A A W W A A A W A W
Colorado A/W A/W A A/W A/C/W A/C/W A/C/W A/C/W A/W A/C/W A/C/W A/C/W A/W A/W A/W
Connecticut A/C/W A/C/W W A/C/W W W A/C/W A/C/W A/C/W A/C/W A/C/W A/C/W W W A/C/W C
Delaware
District of Columbia
Florida A/C/W A/C/W A/W A/C/W A/C/W A/W A/C/W A/C/W A/C/W A/W A/C/W A/C/W A/C/W W A/C/W W C
Georgia W W W W W C/W W W
Hawaii
Idaho
Illinois A A A/W A/W A/W A/W A/W A/C/W A/C/W A/W A/W A/W A/W A/W
Indiana A/W A/W A/W A/W A/W A/W A/W A/W A/W A/W A/W A/W A/W A/W A/W A/C/W A/W A/W A/W A/W A/W A/W A/W
Iowa
Kansas A/W A/W A/C/W A /W A/W A/C/W A/W A/W A/C/W
Kentucky W W C/W C/W C/W C/W W W W
Louisiana
Maine A/W A/W A/W A/W A/W A/W A/C/W A/W A/C/W A/ C /W A/W A/W A/W A/W A/W A/W
Maryland W W W A W W W W C/W W
Massachusetts W A/W A/C/W A/W A/C/W A/W A/W A/C/W A/W W W A/C/W W C/W W C/W A/W C/W C/W C/W C/W A/W W C/W
Michigan
Minnesota A/C/W A/C/W A/C/W A/C/W A/C/W W A/C/W A/C/W W A/C/W A/C/W A/C/W A/C/W A/C/W A/C/W A/C/W A/C/W A/C/W A/C/W A/C/W
Mississippi
Missouri C C C/W A/W A/W A/W A/C/W C/W
Montana A/W A/W A/W A/W A/W A/W A/W A/W A/W A/W A/W A/C/W A/C/W A/W A/C/W A/C/W A/W A/W A/W A/W A/W A/W A/W A/W A/C/W A/C/W A/C/W A/W A/C/W
Nebraska
Nevada W W W W W
New Hampshire A/W A/W A/W A/C/W A/W A/W A/W A/C/W A/C/W A/W A/W
New Jersey A/W A/W A/W A/W A/W A/W A/W A/W A/C/W A/W A/W A/C/W A/C/W
New Mexico
New York
North Carolina

National Association of States United for Aging and Disabilities (NASUAD)60
Table 9: Medicaid HCBS Waiver Services Operated by State Agencies, by Who Directs the Services (Continued)
Adul
t Day
Hea
lth (
inclu
des h
ealth
com
pone
nt)
Adul
t Day
Soc
ial (
does
not
inclu
de
heal
th co
mpo
nent
)Ad
ult F
oste
r Car
e
Assis
ted
Livi
ng
Assis
tive T
echn
olog
yBe
havi
oral
Sup
ports
Case
Man
agem
ent
Com
mun
ity T
rans
ition
Sup
port
Day
Hab
ilita
tion
Envi
ronm
enta
l Mod
ifica
tions
Hom
e-de
liver
ed M
eals
Hom
emak
er
Nut
ritio
nal S
uppl
emen
tsO
ccup
atio
nal T
hera
pyA = Service is Agency-DirectedC = Service is Consumer-DirectedW = Service Offered under Waiver(s)
North Dakota A/W A/W A/W A/W A/W A/W A/W A/W A/W A/W A/W A/W A/W A/W
Ohio A A/W W A/W A/W A A/W A/W A/C/W A/W A/W A/C/W A/W A/W A/W A/W
Oklahoma A/W A/W A/W A/W A/W A/W A/W A/W A/W A/W A/W A/W A/C/W A/W A/W
Oregon C/W C/W C/W C/W C/W C/W C/W C/W C/W C/W C/W
Pennsylvania A/W A W A/W A/W A/W A/W A/W A/W A/W A/C/W A/W A/W A/C/W A/C/W A/W A/W A/W A/W A/W A/W A/W A/W A/W A/W
Rhode Island
South Carolina
South Dakota W W W W W W W W W W W W W
Tennessee
Texas A A/W W C/W C/W A/W A/W A/W A/W C/W A/W A/C/W A/W A/W A/C/W A/C/W A/W A/W A/W A A/W A/W W C/W A/C/W W A/C/W A/WA/C /W
Utah C/W A/C/W A/W C/W A/W
Vermont A/C/W A/W A/C/W A/C/W A/C/W A/C/W A/C/W A/C/W A/W A/W A/C/W A/C/W A/C/W A/W A/W A/W A/W A/C/W A/C/W A/C/W
Virginia
Washington C/W C/W C/W C /W W W W W W W C/W W W W W
West Virginia A/C A/C/W A/C/W A/C/W
Wisconsin A
Wyoming

2012 State of Aging and Disabilities Survey: Another Year of Challenges Tempered by Opportunities 61
Table 9: Medicaid HCBS Waiver Services Operated by State Agencies, by Who Directs the Services (Continued)
Resp
ite
Perso
nal A
ssista
nce S
ervi
ces
Perso
nal E
mer
genc
y
Resp
onse
Sys
tem
s
Phys
ical T
hera
py
Recr
eatio
n Th
erap
yRe
siden
tial H
abili
tatio
nSp
ecia
lized
Equ
ipm
ent
and
Supp
lies
Spee
ch T
hera
py
Supp
orte
d Em
ploy
men
t
Supp
orte
d Li
ving
Tran
spor
tatio
nEx
tend
ed S
tate
Pla
n W
aive
r
Bene
fit: P
erso
nal C
are
Exte
nded
Sta
te P
lan
Wai
ver
Bene
fit: N
ursin
gEx
tend
ed S
tate
Pla
n W
aive
r
Bene
fit: H
ome H
ealth
Exte
nded
Sta
te P
lan
Wai
ver B
enefi
t: ot
her
Oth
er M
edica
id H
CBS
Wai
ver S
ervi
ces
North Dakota A/W A/W A/W A/W A/W A/W A/W A/W A/W A/W A/W A/W A/W A/W
Ohio A A/W W A/W A/W A A/W A/W A/C/W A/W A/W A/C/W A/W A/W A/W A/W
Oklahoma A/W A/W A/W A/W A/W A/W A/W A/W A/W A/W A/W A/W A/C/W A/W A/W
Oregon C/W C/W C/W C/W C/W C/W C/W C/W C/W C/W C/W
Pennsylvania A/W A W A/W A/W A/W A/W A/W A/W A/W A/C/W A/W A/W A/C/W A/C/W A/W A/W A/W A/W A/W A/W A/W A/W A/W A/W
Rhode Island
South Carolina
South Dakota W W W W W W W W W W W W W
Tennessee
Texas A A/W W C/W C/W A/W A/W A/W A/W C/W A/W A/C/W A/W A/W A/C/W A/C/W A/W A/W A/W A A/W A/W W C/W A/C/W W A/C/W A/WA/C /W
Utah C/W A/C/W A/W C/W A/W
Vermont A/C/W A/W A/C/W A/C/W A/C/W A/C/W A/C/W A/C/W A/W A/W A/C/W A/C/W A/C/W A/W A/W A/W A/W A/C/W A/C/W A/C/W
Virginia
Washington C/W C/W C/W C /W W W W W W W C/W W W W W
West Virginia A/C A/C/W A/C/W A/C/W
Wisconsin A
Wyoming

National Association of States United for Aging and Disabilities (NASUAD)62
Area Agencies on Aging (AAAs) provide:
Other HCBS services
BothCase management
only
Table 10: Medicaid-Funded Case Management and Other Services Provided by Area Agencies on Aging and Centers for Independent Living
There is no AAA in my
state
Centers for Independent Living (CILs) provide:
Other HCBS services
BothCase management
only
Alabama ✓ ✓
Alaska ✓ ✓
Arizona ✓ ✓
Arkansas ✓ ✓
California ✓
Colorado ✓
Commonwealth of the Northern Mariana Islands
✓ ✓
Connecticut ✓
Delaware ✓
District of Columbia ✓
Florida ✓ ✓
Georgia ✓
Hawaii
Idaho ✓
Illinois
Indiana ✓
Iowa ✓
Kansas ✓ ✓
Kentucky ✓ ✓
Louisiana ✓
Maine ✓ ✓
Maryland ✓
Massachusetts ✓
Michigan ✓
Minnesota ✓ ✓
Mississippi
Missouri ✓ ✓
Montana ✓ ✓
Nevada ✓
New Hampshire ✓ ✓
New Jersey ✓
New Mexico
New York
North Carolina ✓ ✓
North Dakota ✓ ✓
Ohio ✓ ✓

2012 State of Aging and Disabilities Survey: Another Year of Challenges Tempered by Opportunities 63
Area Agencies on Aging (AAAs) provide:
Other HCBS services
BothCase management
only
Table 10: Medicaid-Funded Case Management and Other Services Provided by Area Agencies on Aging and Centers for Independent Living (Continued)
There is no AAA in my
state
Centers for Independent Living (CILs) provide:
Other HCBS services
BothCase management
only
Oklahoma ✓ ✓
Oregon ✓ ✓
Pennsylvania ✓ ✓
Rhode Island ✓
South Carolina
South Dakota ✓
Tennessee ✓
Texas ✓
Utah ✓
Vermont ✓
Virginia ✓
Washington ✓
West Virginia ✓
Wisconsin
Wyoming ✓ ✓
12 6 14 11 6 7 8

National Association of States United for Aging and Disabilities (NASUAD)64
Notes


National Association of States United for Aging and Disabilities 1201 15th Street NW, Suite 350 Washington, DC 20005 Phone: 202-898-2578 www.nasuad.org