2012 staar grades 3 8 results: preliminary · subject: 2012 staar grades 3–8 results: preliminary...
TRANSCRIPT
MEMORANDUM June 1, 2012 TO: Board Members FROM: Terry B. Grier, Ed.D. Superintendent of Schools
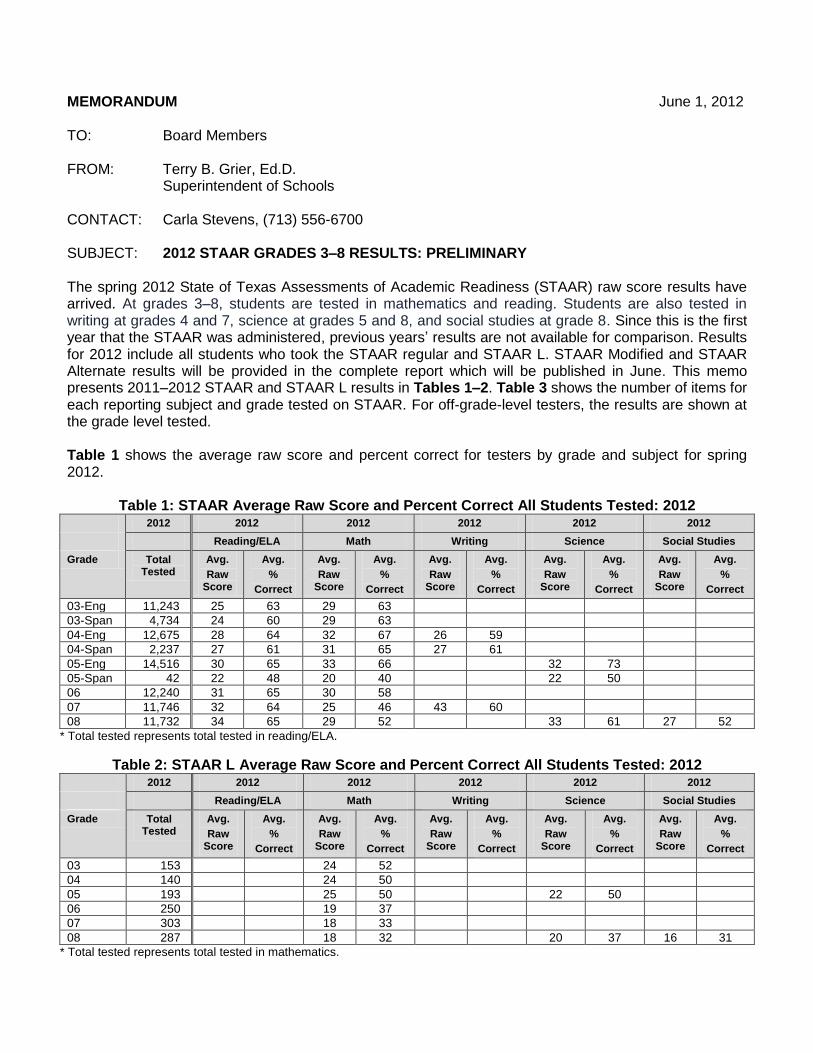
CONTACT: Carla Stevens, (713) 556-6700 SUBJECT: 2012 STAAR GRADES 3–8 RESULTS: PRELIMINARY The spring 2012 State of Texas Assessments of Academic Readiness (STAAR) raw score results have arrived. At grades 3–8, students are tested in mathematics and reading. Students are also tested in writing at grades 4 and 7, science at grades 5 and 8, and social studies at grade 8. Since this is the first year that the STAAR was administered, previous years’ results are not available for comparison. Results for 2012 include all students who took the STAAR regular and STAAR L. STAAR Modified and STAAR Alternate results will be provided in the complete report which will be published in June. This memo presents 2011–2012 STAAR and STAAR L results in Tables 1–2. Table 3 shows the number of items for each reporting subject and grade tested on STAAR. For off-grade-level testers, the results are shown at the grade level tested. Table 1 shows the average raw score and percent correct for testers by grade and subject for spring 2012.
Table 1: STAAR Average Raw Score and Percent Correct All Students Tested: 2012 2012 2012 2012 2012 2012 2012
Reading/ELA Math Writing Science Social Studies
Grade Total Tested
Avg.
Raw Score
Avg.
%
Correct
Avg.
Raw Score
Avg.
%
Correct
Avg.
Raw Score
Avg.
%
Correct
Avg.
Raw Score
Avg.
%
Correct
Avg.
Raw Score
Avg.
%
Correct
03-Eng 11,243 25 63 29 63
03-Span 4,734 24 60 29 63
04-Eng 12,675 28 64 32 67 26 59
04-Span 2,237 27 61 31 65 27 61
05-Eng 14,516 30 65 33 66 32 73
05-Span 42 22 48 20 40 22 50
06 12,240 31 65 30 58
07 11,746 32 64 25 46 43 60
08 11,732 34 65 29 52 33 61 27 52
* Total tested represents total tested in reading/ELA.
Table 2: STAAR L Average Raw Score and Percent Correct All Students Tested: 2012 2012 2012 2012 2012 2012 2012
Reading/ELA Math Writing Science Social Studies
Grade Total Tested
Avg.
Raw Score
Avg.
%
Correct
Avg.
Raw Score
Avg.
%
Correct
Avg.
Raw Score
Avg.
%
Correct
Avg.
Raw Score
Avg.
%
Correct
Avg.
Raw Score
Avg.
%
Correct
03 153 24 52
04 140 24 50
05 193 25 50 22 50
06 250 19 37
07 303 18 33
08 287 18 32 20 37 16 31
* Total tested represents total tested in mathematics.
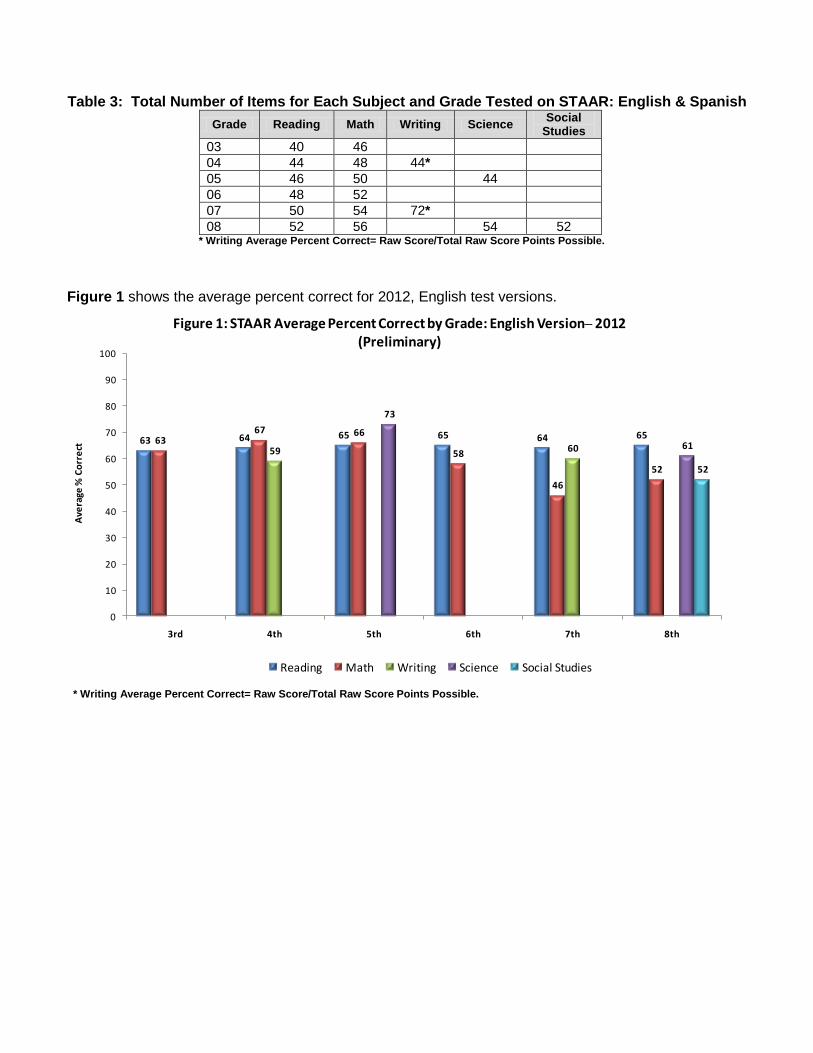
Table 3: Total Number of Items for Each Subject and Grade Tested on STAAR: English & Spanish
Grade Reading Math Writing Science Social
Studies
03 40 46
04 44 48 44*
05 46 50 44
06 48 52
07 50 54 72*
08 52 56 54 52 * Writing Average Percent Correct= Raw Score/Total Raw Score Points Possible.
Figure 1 shows the average percent correct for 2012, English test versions.
* Writing Average Percent Correct= Raw Score/Total Raw Score Points Possible.
63 64 65 65 64 6563
67 66
58
46
52
59 60
73
61
52
0
10
20
30
40
50
60
70
80
90
100
3rd 4th 5th 6th 7th 8th
Ave
rage
% C
orr
ect
Figure 1: STAAR Average Percent Correct by Grade: English Version– 2012 (Preliminary)
Reading Math Writing Science Social Studies
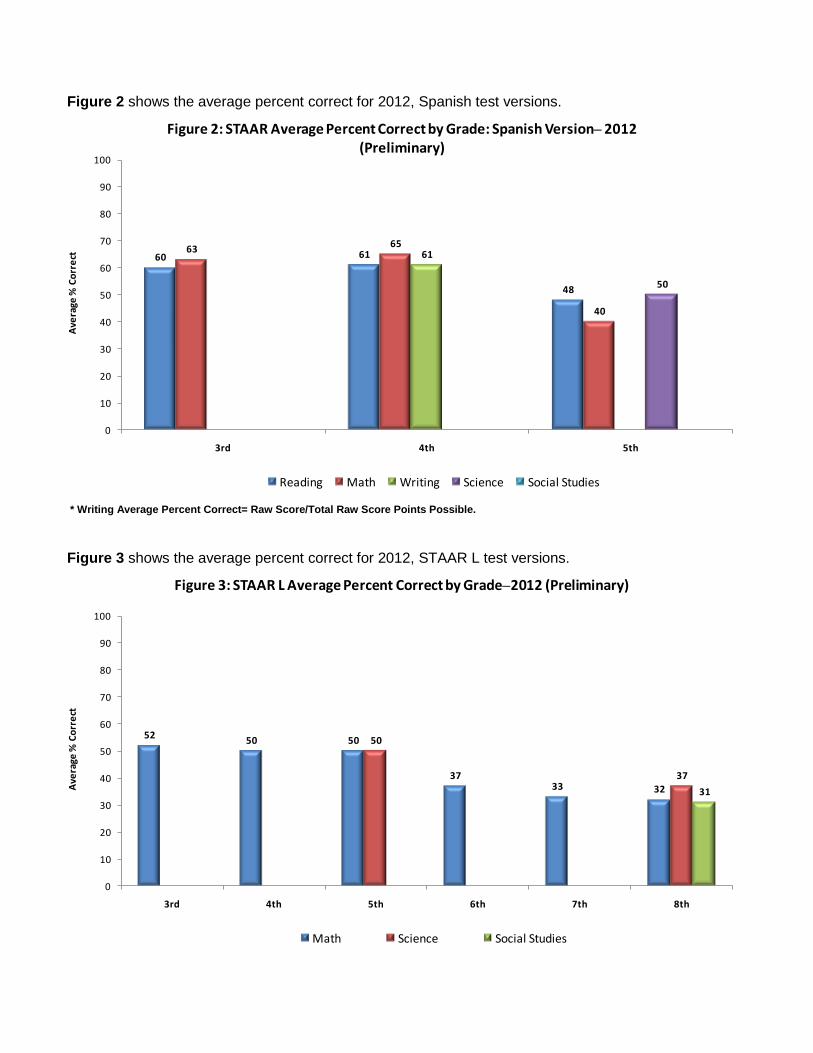
Figure 2 shows the average percent correct for 2012, Spanish test versions.
* Writing Average Percent Correct= Raw Score/Total Raw Score Points Possible.
Figure 3 shows the average percent correct for 2012, STAAR L test versions.
60 61
48
6365
40
61
50
0
10
20
30
40
50
60
70
80
90
100
3rd 4th 5th
Ave
rage
% C
orr
ect
Figure 2: STAAR Average Percent Correct by Grade: Spanish Version– 2012 (Preliminary)
Reading Math Writing Science Social Studies
5250 50
3733 32
50
37
31
0
10
20
30
40
50
60
70
80
90
100
3rd 4th 5th 6th 7th 8th
Ave
rage
% C
orr
ect
Figure 3: STAAR L Average Percent Correct by Grade–2012 (Preliminary)
Math Science Social Studies
Appendix A contains additional graphs showing the average raw score and percent correct by grade, subject, and student group. Also attached are additional tables that provide the average raw score and average percent correct for all students by grade level for each school (see Appendices B and C).Total tested represents the number tested on the reading exam. The math results for off grade level testers will be shown for the grade tested. For example, sixth graders taking the seventh grade math test are counted in the 6th grade testers and results are shown under 7th grade math. A detailed report will be available within 20 working days. Should you have further questions, please contact my office or Carla Stevens in the Department of Research and Accountability at 713-556-6700.
TBG Attachments
cc: Superintendent’s Direct Reports
Chief School Officers
School Improvement Officers
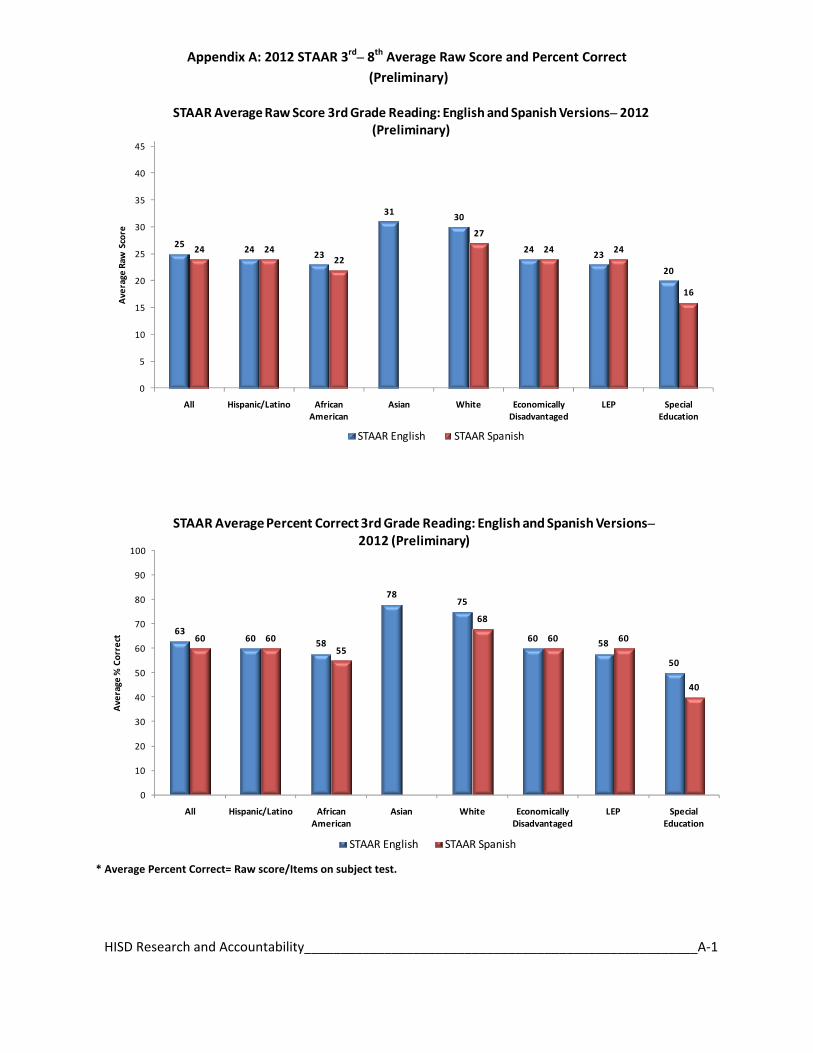
Appendix A: 2012 STAAR 3rd– 8th Average Raw Score and Percent Correct (Preliminary)
HISD Research and Accountability______________________________________________________A‐1
25 24 23
31 30
24 23
20
24 2422
27
24 24
16
0
5
10
15
20
25
30
35
40
45
All Hispanic/Latino African American
Asian White Economically Disadvantaged
LEP Special Education
Average
Raw
Score
STAAR Average Raw Score 3rd Grade Reading: English and Spanish Versions– 2012 (Preliminary)
STAAR English STAAR Spanish
6360 58
7875
60 58
50
60 6055
68
60 60
40
0
10
20
30
40
50
60
70
80
90
100
All Hispanic/Latino African American
Asian White Economically Disadvantaged
LEP Special Education
Average
% Correct
STAAR Average Percent Correct 3rd Grade Reading: English and Spanish Versions–2012 (Preliminary)
STAAR English STAAR Spanish
* Average Percent Correct= Raw score/Items on subject test.

Appendix A: 2012 STAAR 3rd– 8th Average Raw Score and Percent Correct (Preliminary)
HISD Research and Accountability______________________________________________________A‐2
29 29
25
38
35
2830
25
29 2931
35
30 29
21
24
28
19
2725
2325
0
5
10
15
20
25
30
35
40
45
All Hispanic/Latino African American
Asian White Economically Disadvantaged
LEP Special Education
Average
Raw
Score
STAAR Average Raw Score 3rd Grade Math: English, Spanish, and L Versions–2012 (Preliminary)
STAAR English STAAR Spanish STAAR L
63 63
54
83
76
6165
54
63 6367
76
65 63
4652
61
41
5954
5054
0
10
20
30
40
50
60
70
80
90
100
All Hispanic/Latino African American
Asian White Economically Disadvantaged
LEP Special Education
Average
% Correct
STAAR Average Percent Correct 3rd Grade Math: English, Spanish, and L Versions– 2012 (Preliminary)
STAAR English STAAR Spanish STAAR L
* Average Percent Correct= Raw score/Items on subject test.
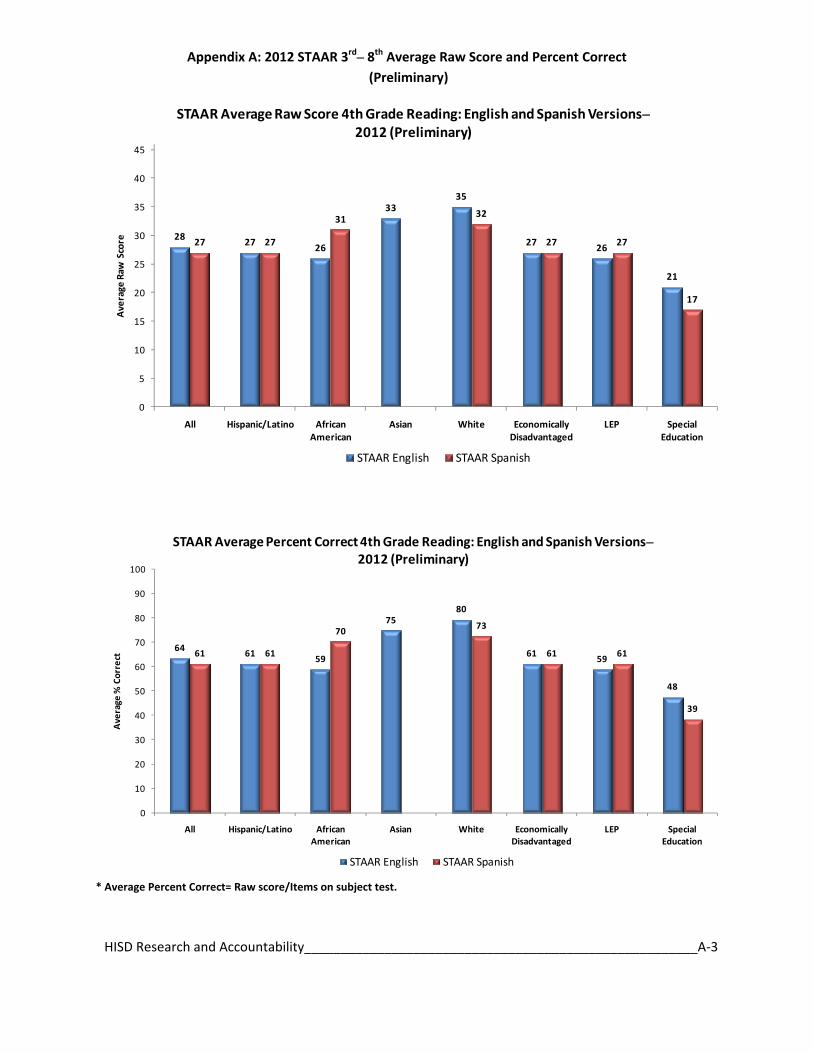
Appendix A: 2012 STAAR 3rd– 8th Average Raw Score and Percent Correct (Preliminary)
HISD Research and Accountability______________________________________________________A‐3
28 27 26
3335
27 26
21
27 27
31 32
27 27
17
0
5
10
15
20
25
30
35
40
45
All Hispanic/Latino African American
Asian White Economically Disadvantaged
LEP Special Education
Average
Raw
Score
STAAR Average Raw Score 4th Grade Reading: English and Spanish Versions–2012 (Preliminary)
STAAR English STAAR Spanish
64 61 59
7580
61 59
48
61 61
70 73
61 61
39
0
10
20
30
40
50
60
70
80
90
100
All Hispanic/Latino African American
Asian White Economically Disadvantaged
LEP Special Education
Average
% Correct
STAAR Average Percent Correct 4th Grade Reading: English and Spanish Versions–2012 (Preliminary)
STAAR English STAAR Spanish
* Average Percent Correct= Raw score/Items on subject test.
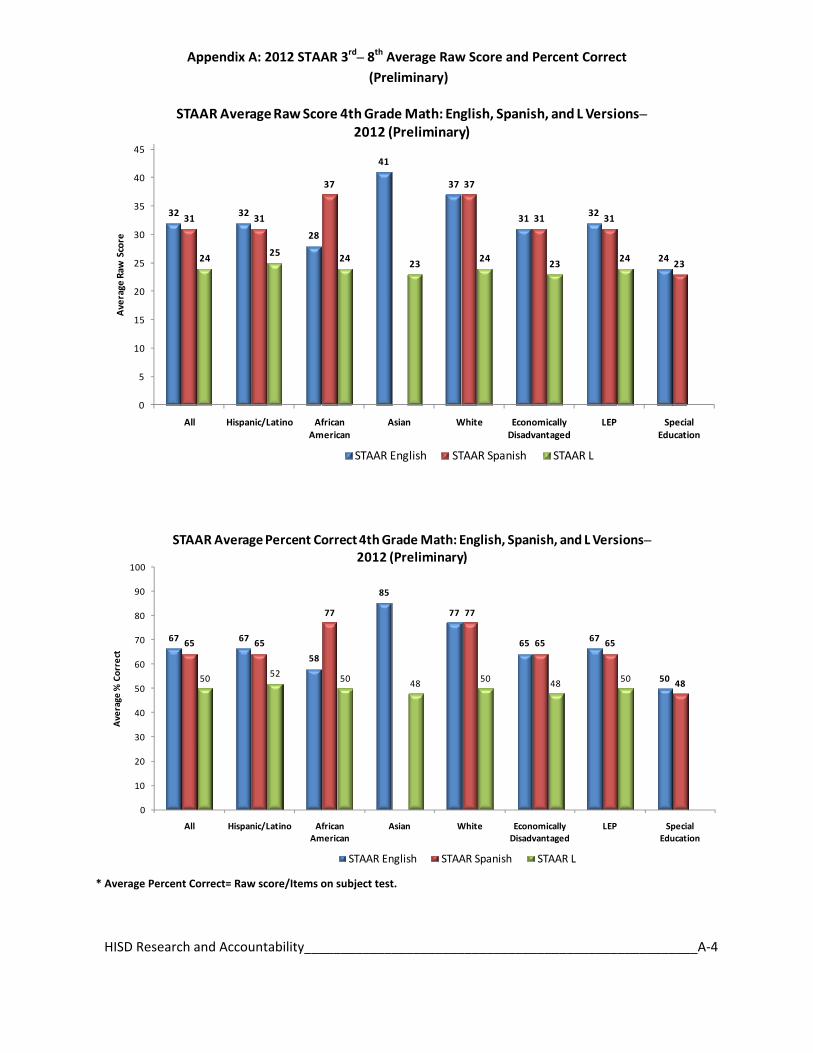
Appendix A: 2012 STAAR 3rd– 8th Average Raw Score and Percent Correct (Preliminary)
HISD Research and Accountability______________________________________________________A‐4
32 32
28
41
37
31 32
24
31 31
37 37
31 31
2324 25 24 23 24 23 24
0
5
10
15
20
25
30
35
40
45
All Hispanic/Latino African American
Asian White Economically Disadvantaged
LEP Special Education
Average
Raw
Score
STAAR Average Raw Score 4th Grade Math: English, Spanish, and L Versions–2012 (Preliminary)
STAAR English STAAR Spanish STAAR L
67 67
58
85
77
65 67
50
65 65
77 77
65 65
4850 52 50 48 50 48 50
0
10
20
30
40
50
60
70
80
90
100
All Hispanic/Latino African American
Asian White Economically Disadvantaged
LEP Special Education
Average
% Correct
STAAR Average Percent Correct 4th Grade Math: English, Spanish, and L Versions–2012 (Preliminary)
STAAR English STAAR Spanish STAAR L
* Average Percent Correct= Raw score/Items on subject test.
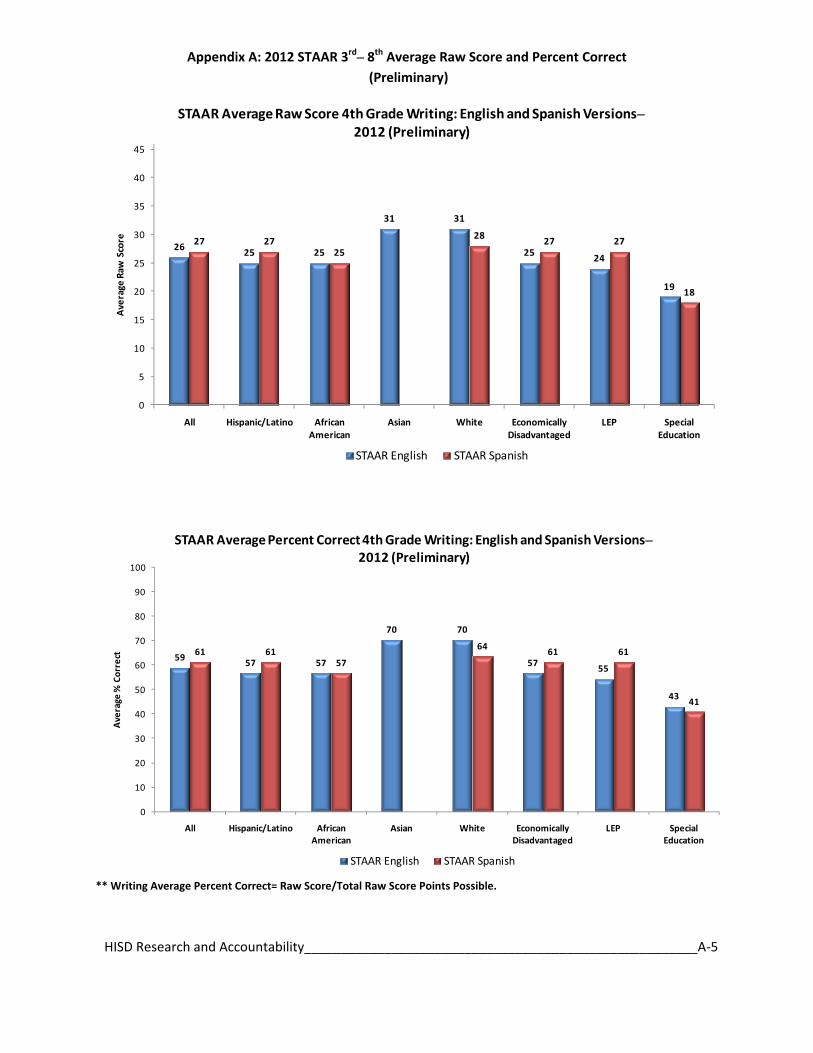
Appendix A: 2012 STAAR 3rd– 8th Average Raw Score and Percent Correct (Preliminary)
HISD Research and Accountability______________________________________________________A‐5
26 25 25
31 31
25 24
19
27 2725
28 27 27
18
0
5
10
15
20
25
30
35
40
45
All Hispanic/Latino African American
Asian White Economically Disadvantaged
LEP Special Education
Average
Raw
Score
STAAR Average Raw Score 4th Grade Writing: English and Spanish Versions–2012 (Preliminary)
STAAR English STAAR Spanish
59 57 57
70 70
57 55
43
61 6157
64 61 61
41
0
10
20
30
40
50
60
70
80
90
100
All Hispanic/Latino African American
Asian White Economically Disadvantaged
LEP Special Education
Average
% Correct
STAAR Average Percent Correct 4th Grade Writing: English and Spanish Versions–2012 (Preliminary)
STAAR English STAAR Spanish
** Writing Average Percent Correct= Raw Score/Total Raw Score Points Possible.
Appendix A: 2012 STAAR 3rd– 8th Average Raw Score and Percent Correct (Preliminary)
HISD Research and Accountability______________________________________________________A‐6
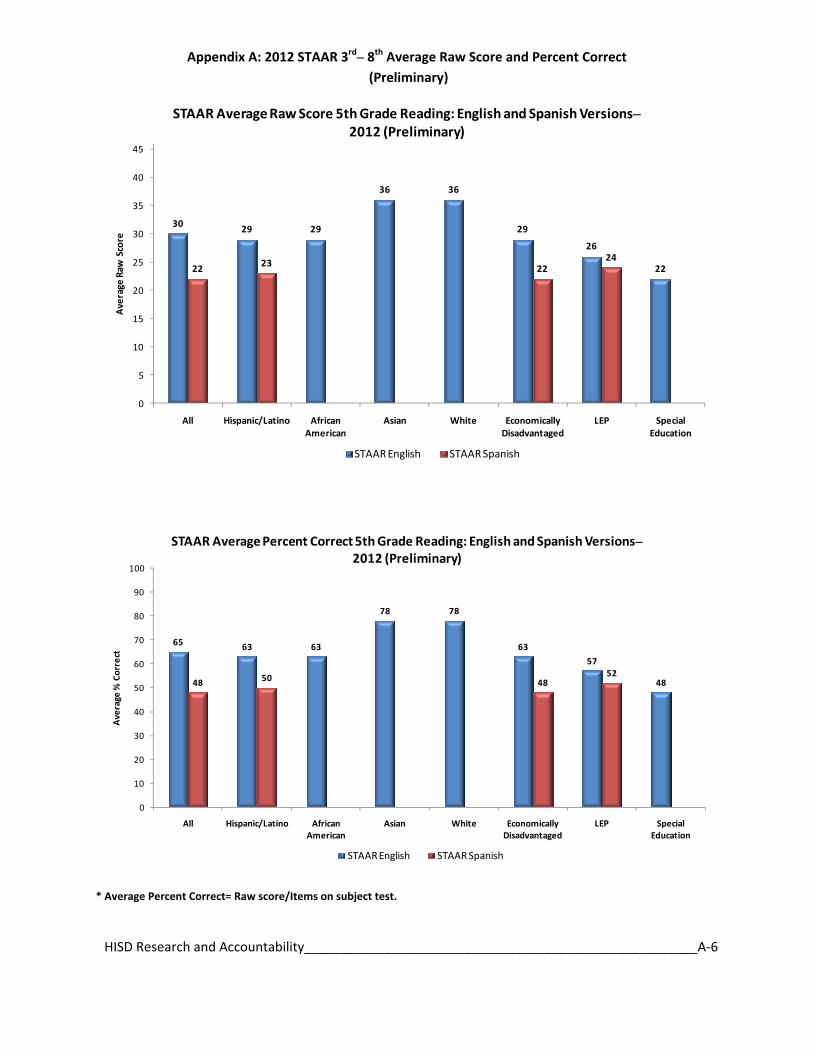
30 29 29
36 36
29
26
2222 23 2224
0
5
10
15
20
25
30
35
40
45
All Hispanic/Latino African American
Asian White Economically Disadvantaged
LEP Special Education
Average
Raw
Score
STAAR Average Raw Score 5th Grade Reading: English and Spanish Versions–2012 (Preliminary)
STAAR English STAAR Spanish
65 63 63
78 78
63
57
4848 50 4852
0
10
20
30
40
50
60
70
80
90
100
All Hispanic/Latino African American
Asian White Economically Disadvantaged
LEP Special Education
Average
% Correct
STAAR Average Percent Correct 5th Grade Reading: English and Spanish Versions–2012 (Preliminary)
STAAR English STAAR Spanish
* Average Percent Correct= Raw score/Items on subject test.
Appendix A: 2012 STAAR 3rd– 8th Average Raw Score and Percent Correct (Preliminary)
HISD Research and Accountability______________________________________________________A‐7
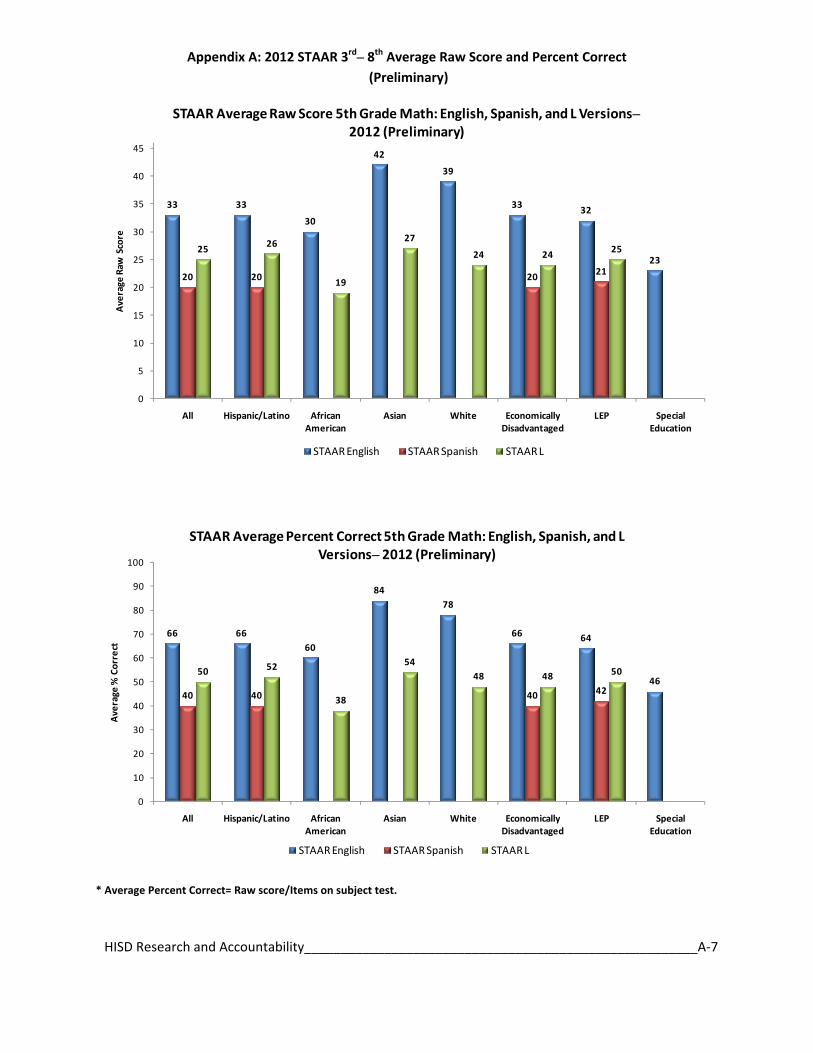
33 33
30
42
39
33 32
23
20 20 20 21
25 26
19
27
24 24 25
0
5
10
15
20
25
30
35
40
45
All Hispanic/Latino African American
Asian White Economically Disadvantaged
LEP Special Education
Average
Raw
Score
STAAR Average Raw Score 5th Grade Math: English, Spanish, and L Versions–2012 (Preliminary)
STAAR English STAAR Spanish STAAR L
66 6660
8478
66 64
4640 40 40 42
50 52
38
5448 48 50
0
10
20
30
40
50
60
70
80
90
100
All Hispanic/Latino African American
Asian White Economically Disadvantaged
LEP Special Education
Average
% Correct
STAAR Average Percent Correct 5th Grade Math: English, Spanish, and L Versions– 2012 (Preliminary)
STAAR English STAAR Spanish STAAR L
* Average Percent Correct= Raw score/Items on subject test.
Appendix A: 2012 STAAR 3rd– 8th Average Raw Score and Percent Correct (Preliminary)
HISD Research and Accountability______________________________________________________A‐8
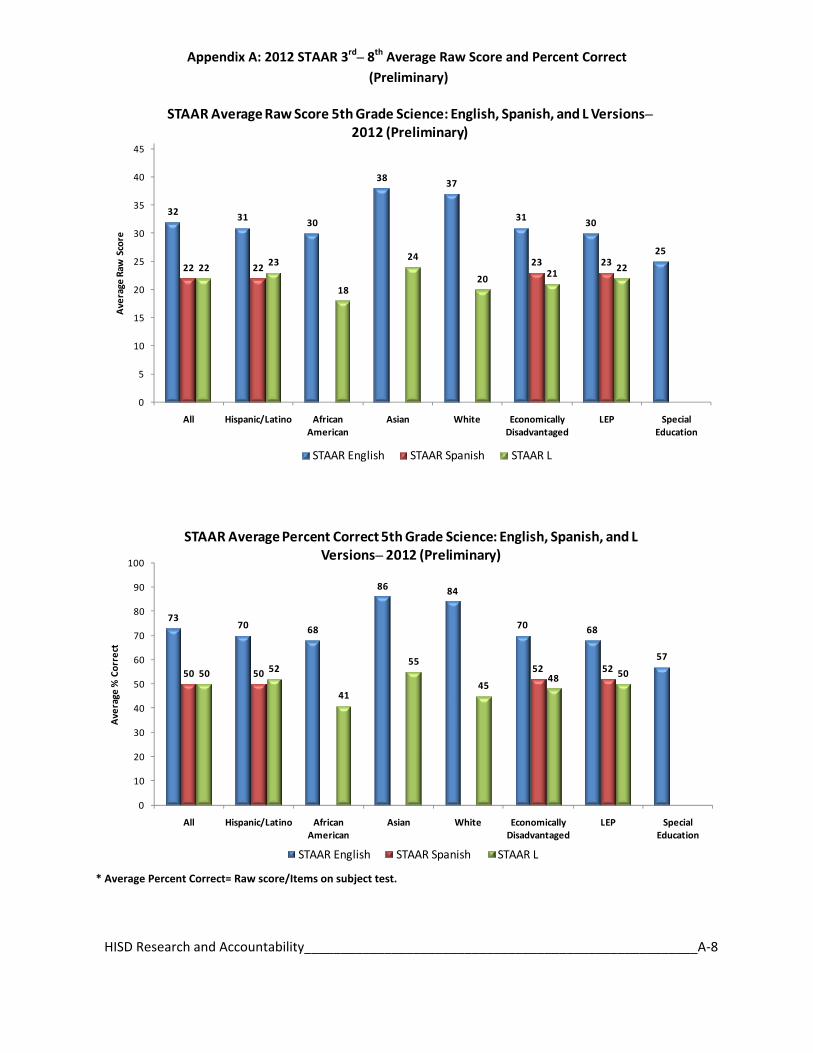
32 31 30
38 37
31 30
25
22 22 23 2322 23
18
24
20 21 22
0
5
10
15
20
25
30
35
40
45
All Hispanic/Latino African American
Asian White Economically Disadvantaged
LEP Special Education
Average
Raw
Score
STAAR Average Raw Score 5th Grade Science: English, Spanish, and L Versions–2012 (Preliminary)
STAAR English STAAR Spanish STAAR L
7370 68
86 84
70 68
57
50 50 52 5250 52
41
55
4548 50
0
10
20
30
40
50
60
70
80
90
100
All Hispanic/Latino African American
Asian White Economically Disadvantaged
LEP Special Education
Average
% Correct
STAAR Average Percent Correct 5th Grade Science: English, Spanish, and L Versions– 2012 (Preliminary)
STAAR English STAAR Spanish STAAR L
* Average Percent Correct= Raw score/Items on subject test.
Appendix A: 2012 STAAR 3rd– 8th Average Raw Score and Percent Correct (Preliminary)
HISD Research and Accountability______________________________________________________A‐9
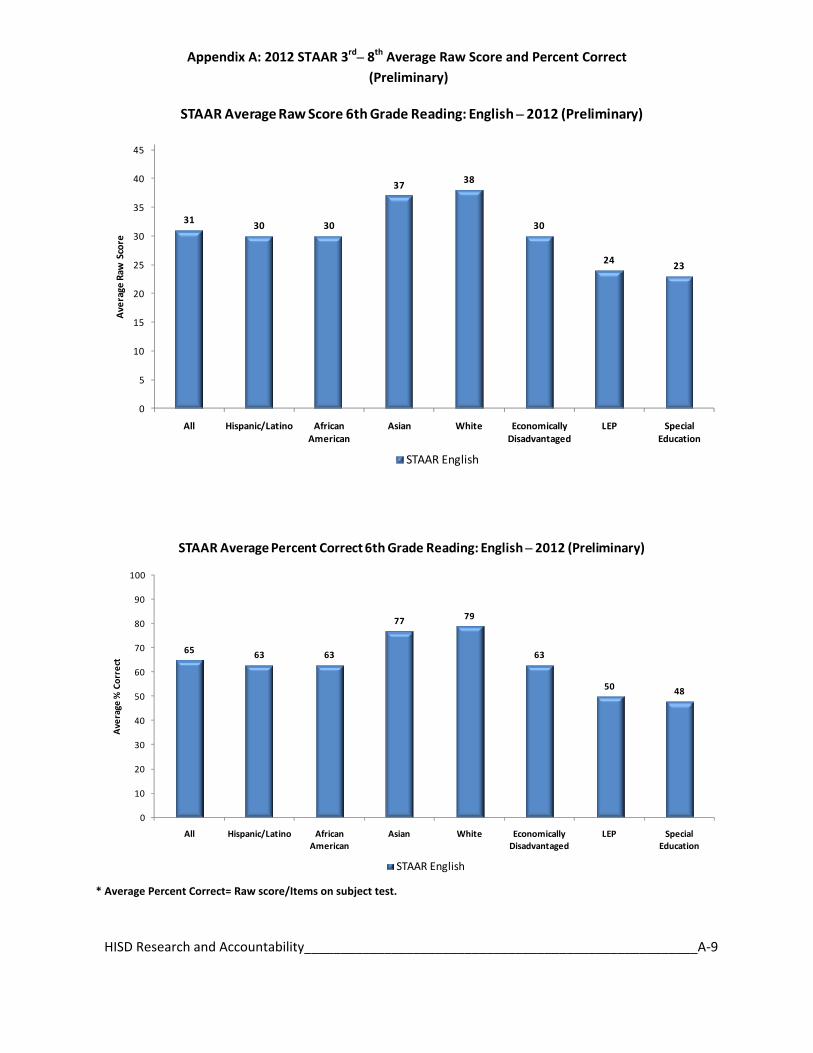
31 30 30
37 38
30
24 23
0
5
10
15
20
25
30
35
40
45
All Hispanic/Latino African American
Asian White Economically Disadvantaged
LEP Special Education
Average
Raw
Score
STAAR Average Raw Score 6th Grade Reading: English – 2012 (Preliminary)
STAAR English
65 63 63
77 79
63
50 48
0
10
20
30
40
50
60
70
80
90
100
All Hispanic/Latino African American
Asian White Economically Disadvantaged
LEP Special Education
Average
% Correct
STAAR Average Percent Correct 6th Grade Reading: English – 2012 (Preliminary)
STAAR English
* Average Percent Correct= Raw score/Items on subject test.
Appendix A: 2012 STAAR 3rd– 8th Average Raw Score and Percent Correct (Preliminary)
HISD Research and Accountability______________________________________________________A‐10
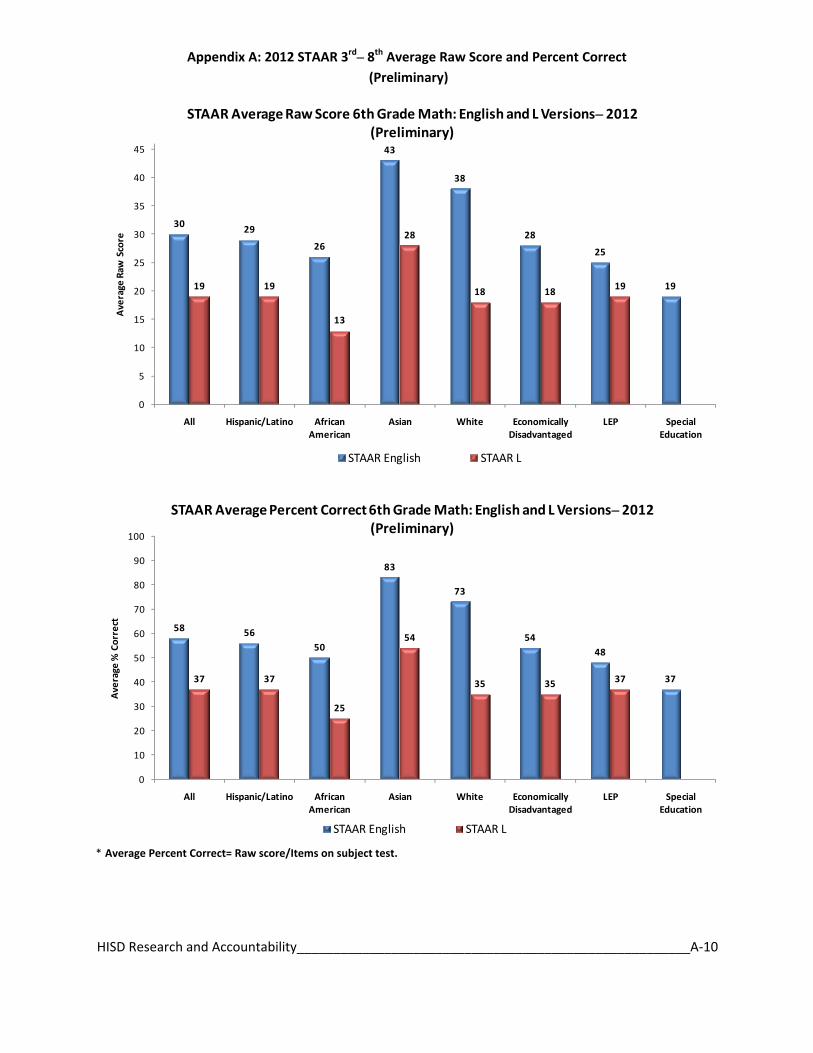
30 29
26
43
38
28
25
1919 19
13
28
18 18 19
0
5
10
15
20
25
30
35
40
45
All Hispanic/Latino African American
Asian White Economically Disadvantaged
LEP Special Education
Average
Raw
Score
STAAR Average Raw Score 6th Grade Math: English and L Versions– 2012 (Preliminary)
STAAR English STAAR L
58 5650
83
73
5448
3737 37
25
54
35 35 37
0
10
20
30
40
50
60
70
80
90
100
All Hispanic/Latino African American
Asian White Economically Disadvantaged
LEP Special Education
Average
% Correct
STAAR Average Percent Correct 6th Grade Math: English and L Versions– 2012 (Preliminary)
STAAR English STAAR L
* Average Percent Correct= Raw score/Items on subject test.
Appendix A: 2012 STAAR 3rd– 8th Average Raw Score and Percent Correct (Preliminary)
HISD Research and Accountability______________________________________________________A‐11
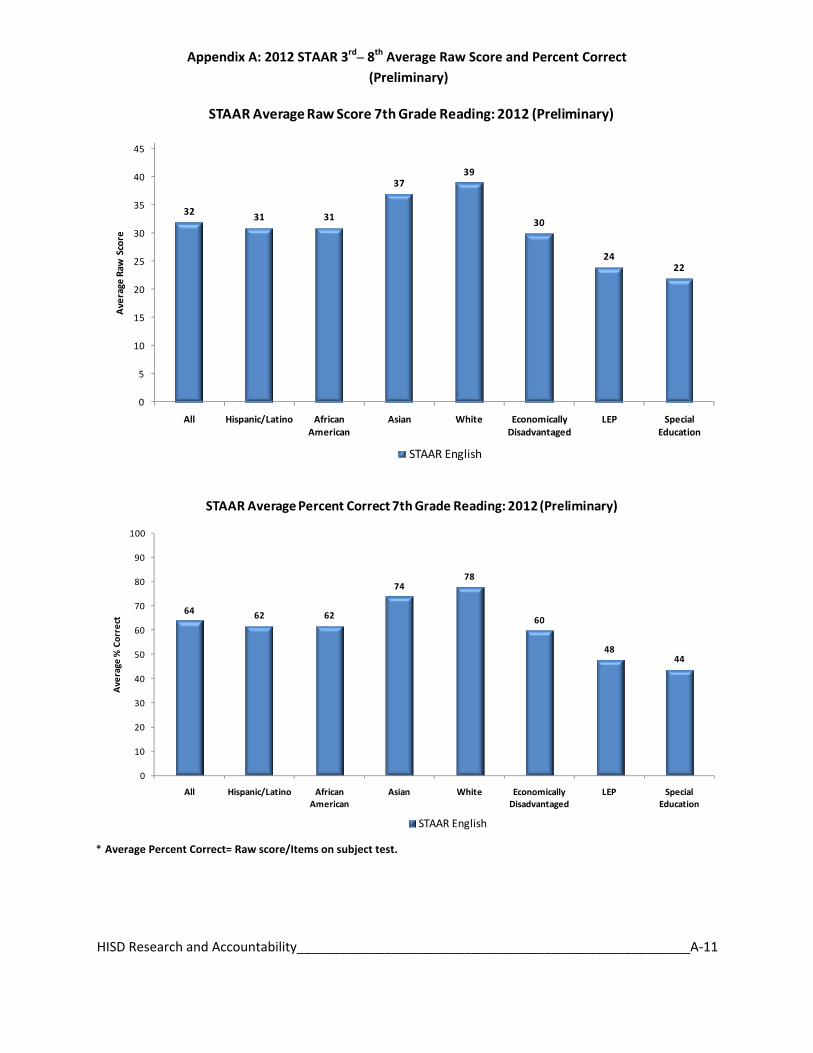
32 31 31
3739
30
2422
0
5
10
15
20
25
30
35
40
45
All Hispanic/Latino African American
Asian White Economically Disadvantaged
LEP Special Education
Average
Raw
Score
STAAR Average Raw Score 7th Grade Reading: 2012 (Preliminary)
STAAR English
64 62 62
7478
60
4844
0
10
20
30
40
50
60
70
80
90
100
All Hispanic/Latino African American
Asian White Economically Disadvantaged
LEP Special Education
Average
% Correct
STAAR Average Percent Correct 7th Grade Reading: 2012 (Preliminary)
STAAR English
* Average Percent Correct= Raw score/Items on subject test.
Appendix A: 2012 STAAR 3rd– 8th Average Raw Score and Percent Correct (Preliminary)
HISD Research and Accountability______________________________________________________A‐12
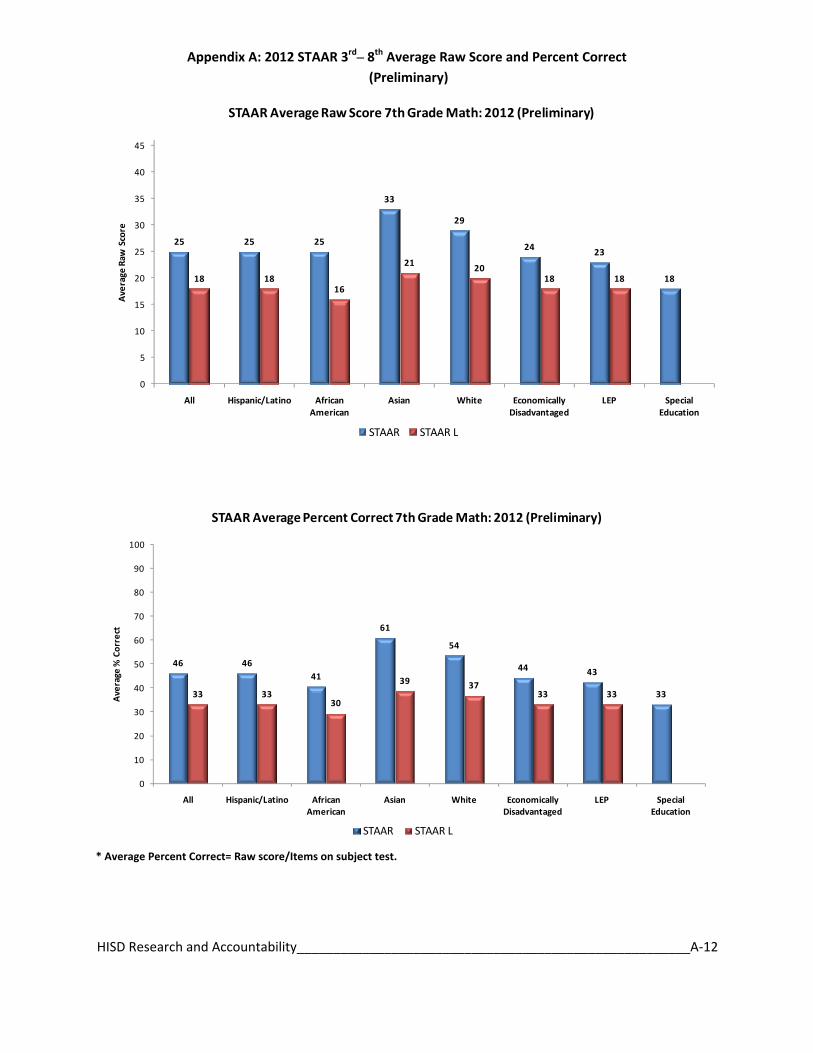
25 25 25
33
29
24 23
1818 1816
21 2018 18
0
5
10
15
20
25
30
35
40
45
All Hispanic/Latino African American
Asian White Economically Disadvantaged
LEP Special Education
Average
Raw
Score
STAAR Average Raw Score 7th Grade Math: 2012 (Preliminary)
STAAR STAAR L
46 4641
61
54
44 43
3333 3330
39 3733 33
0
10
20
30
40
50
60
70
80
90
100
All Hispanic/Latino African American
Asian White Economically Disadvantaged
LEP Special Education
Average
% Correct
STAAR Average Percent Correct 7th Grade Math: 2012 (Preliminary)
STAAR STAAR L
* Average Percent Correct= Raw score/Items on subject test.
Appendix A: 2012 STAAR 3rd– 8th Average Raw Score and Percent Correct (Preliminary)
HISD Research and Accountability______________________________________________________A‐13
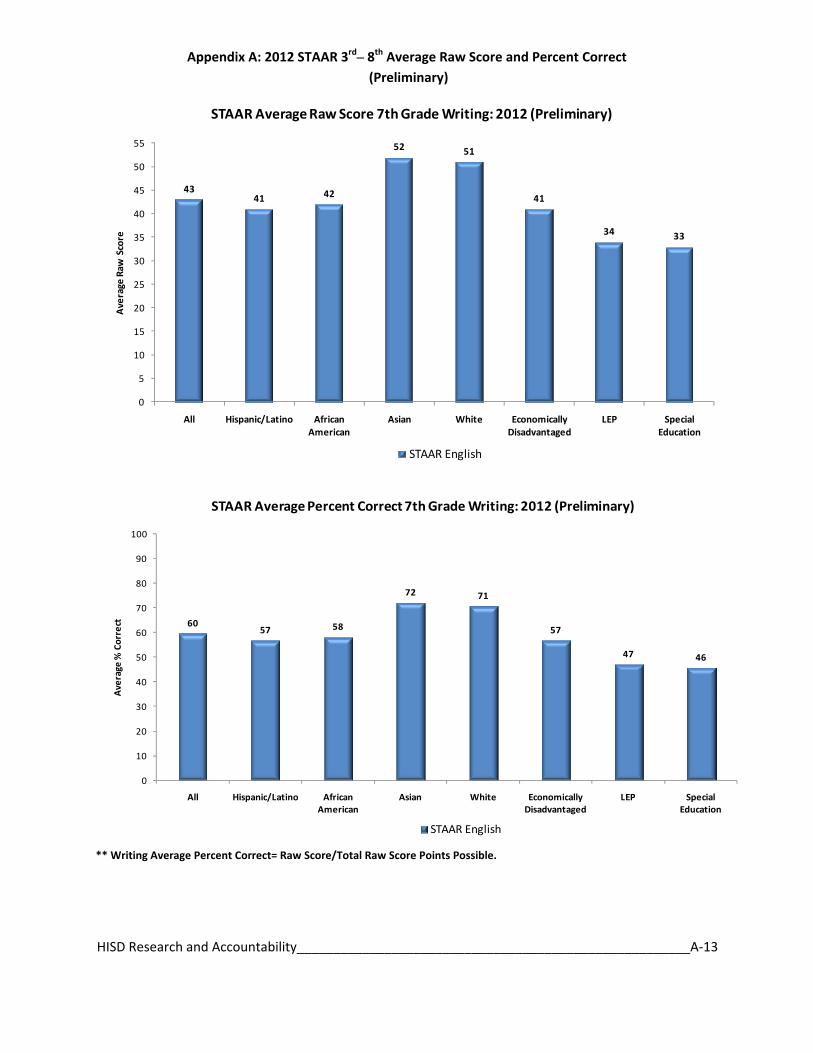
4341 42
52 51
41
34 33
0
5
10
15
20
25
30
35
40
45
50
55
All Hispanic/Latino African American
Asian White Economically Disadvantaged
LEP Special Education
Average
Raw
Score
STAAR Average Raw Score 7th Grade Writing: 2012 (Preliminary)
STAAR English
6057 58
72 71
57
47 46
0
10
20
30
40
50
60
70
80
90
100
All Hispanic/Latino African American
Asian White Economically Disadvantaged
LEP Special Education
Average
% Correct
STAAR Average Percent Correct 7th Grade Writing: 2012 (Preliminary)
STAAR English
** Writing Average Percent Correct= Raw Score/Total Raw Score Points Possible.
Appendix A: 2012 STAAR 3rd– 8th Average Raw Score and Percent Correct (Preliminary)
HISD Research and Accountability______________________________________________________A‐14
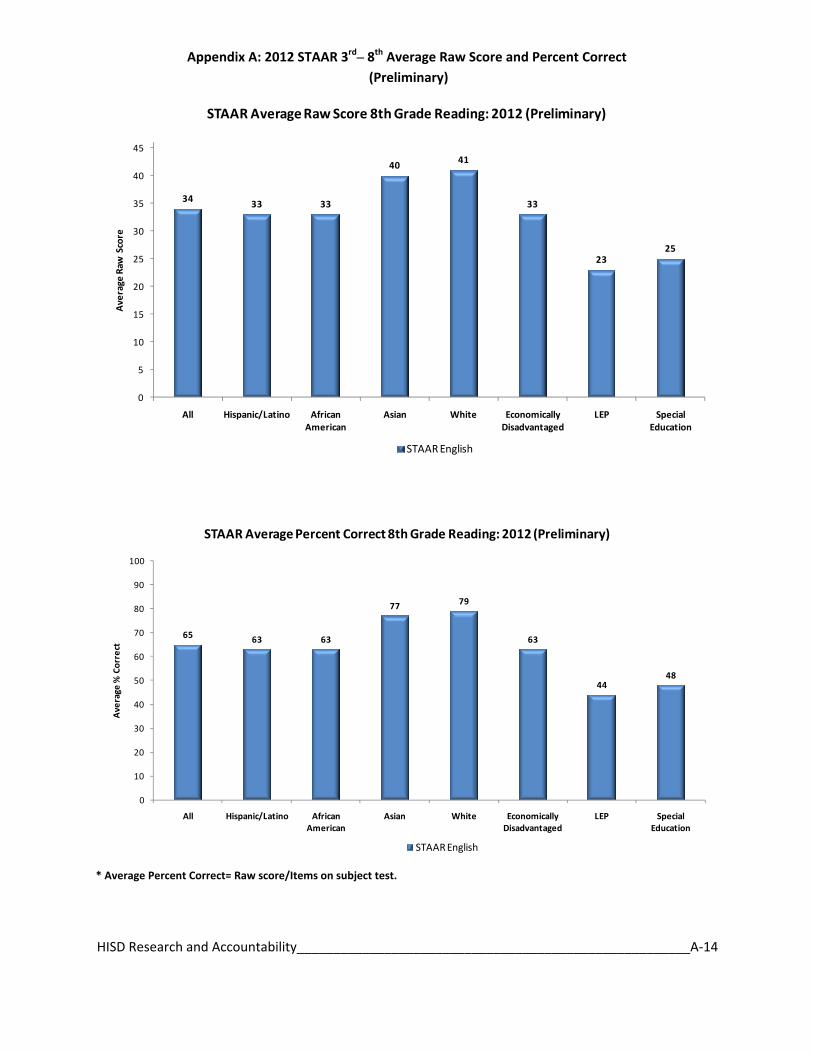
34 33 33
40 41
33
2325
0
5
10
15
20
25
30
35
40
45
All Hispanic/Latino African American
Asian White Economically Disadvantaged
LEP Special Education
Average
Raw
Score
STAAR Average Raw Score 8th Grade Reading: 2012 (Preliminary)
STAAR English
65 63 63
77 79
63
4448
0
10
20
30
40
50
60
70
80
90
100
All Hispanic/Latino African American
Asian White Economically Disadvantaged
LEP Special Education
Average
% Correct
STAAR Average Percent Correct 8th Grade Reading: 2012 (Preliminary)
STAAR English
* Average Percent Correct= Raw score/Items on subject test.
Appendix A: 2012 STAAR 3rd– 8th Average Raw Score and Percent Correct (Preliminary)
HISD Research and Accountability______________________________________________________A‐15
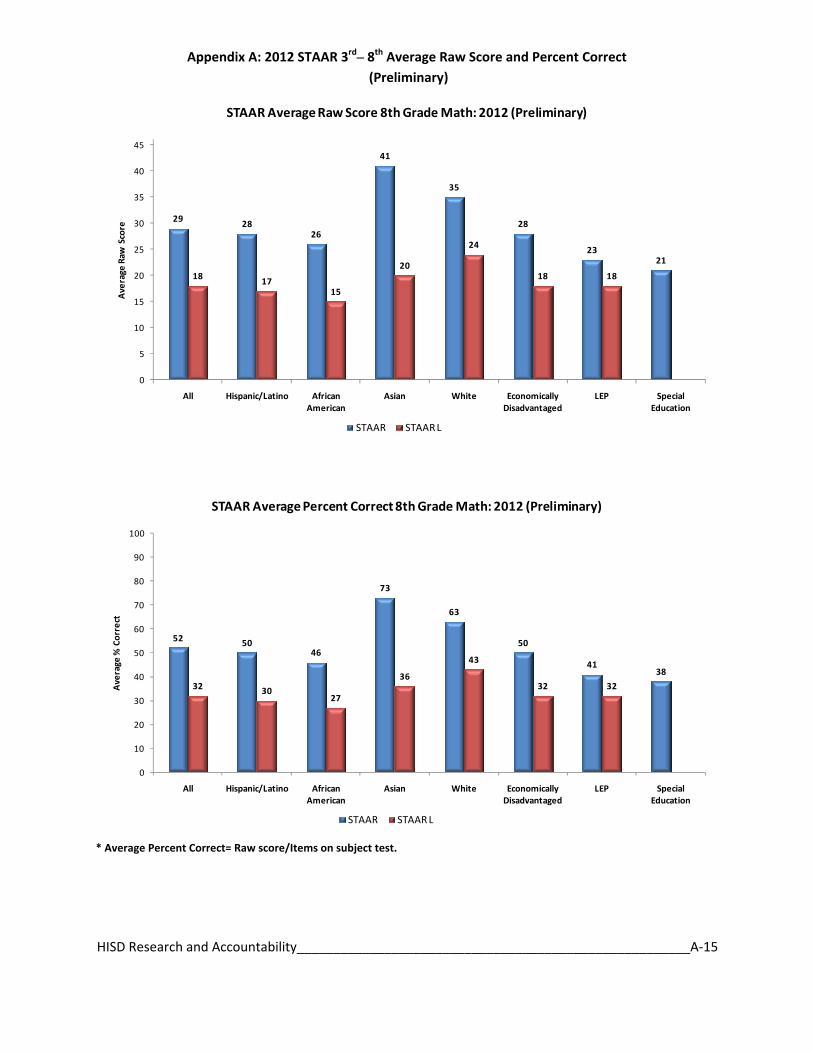
29 2826
41
35
28
2321
18 1715
20
24
18 18
0
5
10
15
20
25
30
35
40
45
All Hispanic/Latino African American
Asian White Economically Disadvantaged
LEP Special Education
Average
Raw
Score
STAAR Average Raw Score 8th Grade Math: 2012 (Preliminary)
STAAR STAAR L
52 5046
73
63
50
4138
32 3027
36
43
32 32
0
10
20
30
40
50
60
70
80
90
100
All Hispanic/Latino African American
Asian White Economically Disadvantaged
LEP Special Education
Average
% Correct
STAAR Average Percent Correct 8th Grade Math: 2012 (Preliminary)
STAAR STAAR L
* Average Percent Correct= Raw score/Items on subject test.
Appendix A: 2012 STAAR 3rd– 8th Average Raw Score and Percent Correct (Preliminary)
HISD Research and Accountability______________________________________________________A‐16
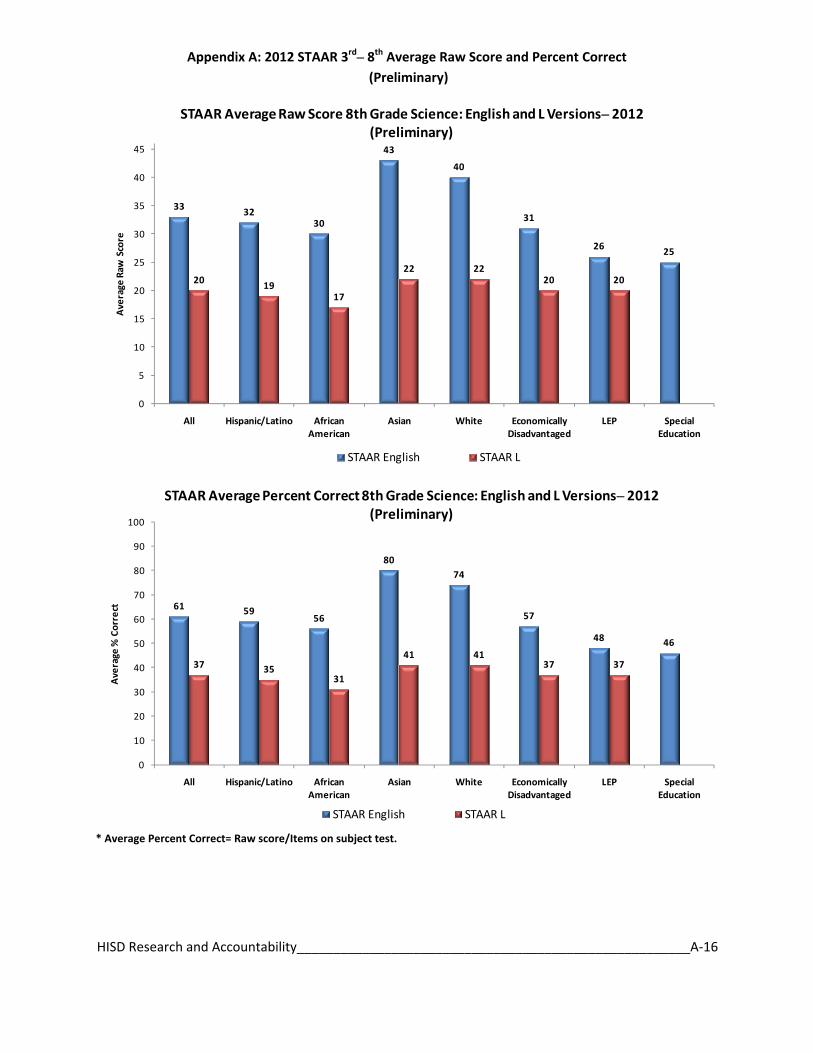
33 3230
43
40
31
26 25
20 1917
22 2220 20
0
5
10
15
20
25
30
35
40
45
All Hispanic/Latino African American
Asian White Economically Disadvantaged
LEP Special Education
Average
Raw
Score
STAAR Average Raw Score 8th Grade Science: English and L Versions– 2012 (Preliminary)
STAAR English STAAR L
61 5956
8074
57
48 46
37 3531
41 4137 37
0
10
20
30
40
50
60
70
80
90
100
All Hispanic/Latino African American
Asian White Economically Disadvantaged
LEP Special Education
Average
% Correct
STAAR Average Percent Correct 8th Grade Science: English and L Versions– 2012 (Preliminary)
STAAR English STAAR L
* Average Percent Correct= Raw score/Items on subject test.
Appendix A: 2012 STAAR 3rd– 8th Average Raw Score and Percent Correct (Preliminary)
HISD Research and Accountability______________________________________________________A‐17
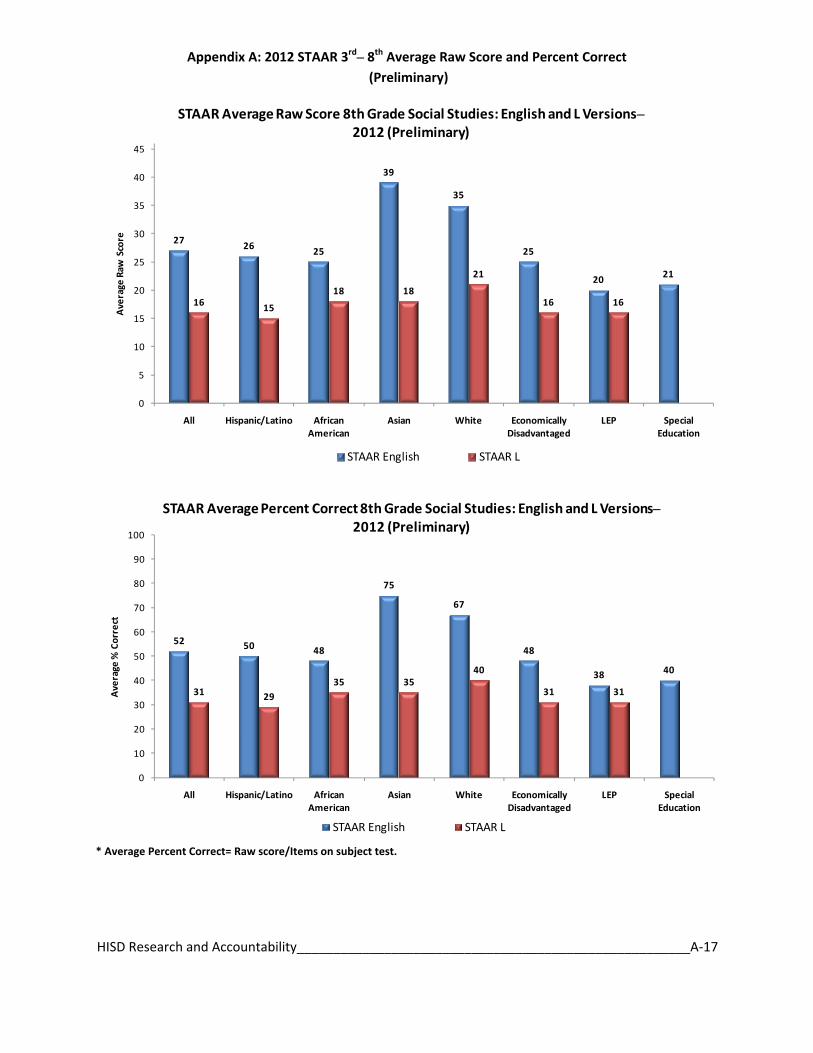
27 26 25
39
35
25
20 21
16 15
18 18
21
16 16
0
5
10
15
20
25
30
35
40
45
All Hispanic/Latino African American
Asian White Economically Disadvantaged
LEP Special Education
Average
Raw
Score
STAAR Average Raw Score 8th Grade Social Studies: English and L Versions–2012 (Preliminary)
STAAR English STAAR L
52 50 48
75
67
48
38 40
31 2935 35
40
31 31
0
10
20
30
40
50
60
70
80
90
100
All Hispanic/Latino African American
Asian White Economically Disadvantaged
LEP Special Education
Average
% Correct
STAAR Average Percent Correct 8th Grade Social Studies: English and L Versions–2012 (Preliminary)
STAAR English STAAR L
* Average Percent Correct= Raw score/Items on subject test.

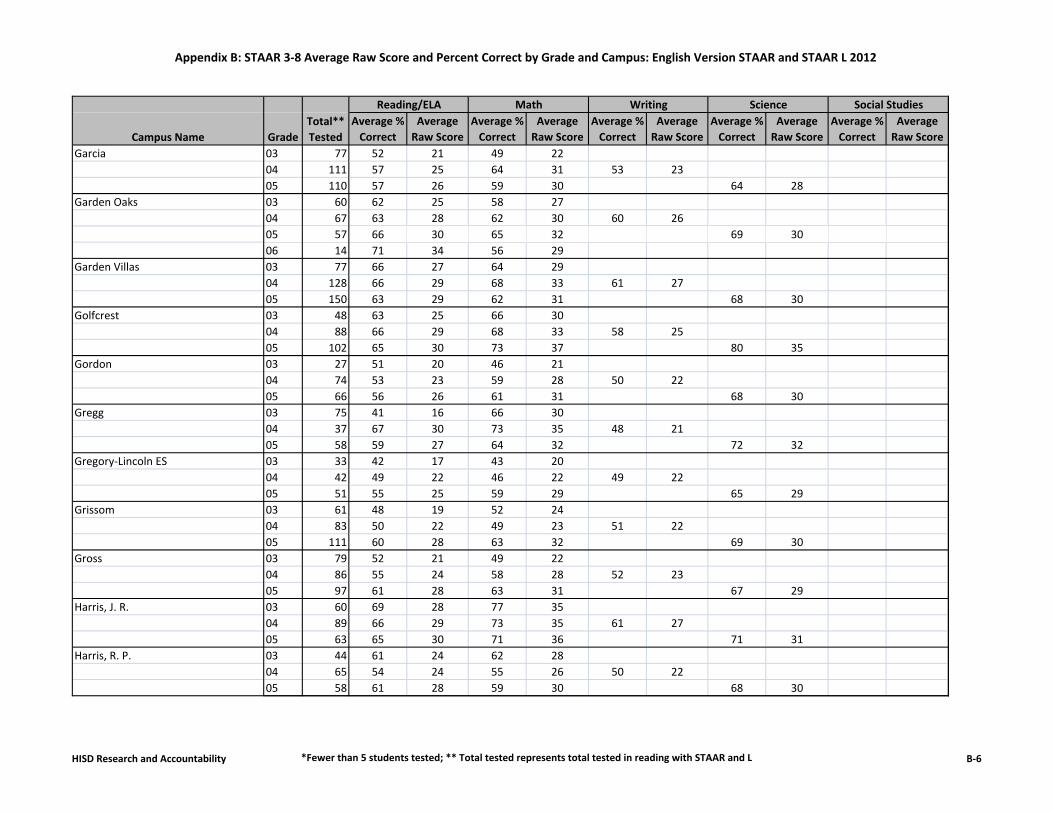
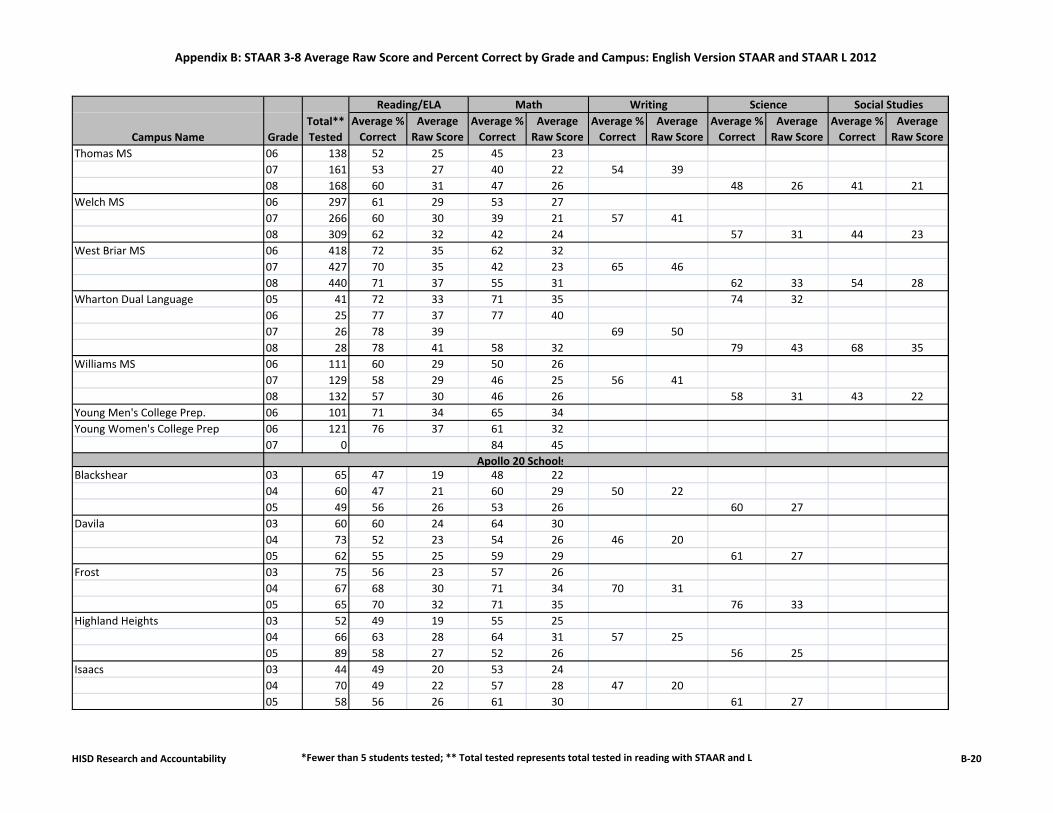
Appendix B: STAAR 3‐8 Average Raw Score and Percent Correct by Grade and Campus: English Version STAAR and STAAR L 2012
Average % Correct
Average Raw Score
Average % Correct
Average Raw Score
Average % Correct
Average Raw Score
Average % Correct
Average Raw Score
Average % Correct
Average Raw Score
Houston ISD 03 11,243 63 25 63 2904 12,675 64 28 67 32 59 2605 14,516 65 30 66 33 73 3206 12,240 65 31 58 3007 11,746 64 32 46 25 60 4308 11,732 65 34 52 29 61 33 52 27
Alcott 03 54 48 19 45 2104 59 54 24 52 25 52 2305 76 58 27 55 28 68 30
Almeda 03 87 62 25 63 2904 118 58 26 60 29 52 2305 103 62 28 65 32 69 31
Anderson 03 36 53 21 60 2804 78 66 29 70 34 59 2605 112 65 30 73 36 73 32
Askew 03 98 70 28 75 3404 110 70 31 71 34 63 2805 119 72 33 73 36 79 35
Atherton 03 50 69 28 72 3304 51 50 22 50 24 54 2405 49 51 24 49 25 57 25
Barrick 03 44 61 25 64 2904 34 57 25 79 38 58 2605 94 61 28 64 32 73 32
Bastian 03 83 53 21 53 2404 72 55 24 61 30 55 2405 78 58 27 56 28 72 32
Bell 03 97 66 26 65 3004 102 68 30 72 34 64 2805 104 67 31 63 31 74 33
Benavidez 03 56 57 23 61 2804 63 57 25 63 30 53 2305 101 57 26 60 30 67 30
Campus Name GradeTotal** Tested
Reading/ELA Math Writing Science Social Studies
HISD Research and Accountability *Fewer than 5 students tested; ** Total tested represents total tested in reading with STAAR and L B‐1

Appendix B: STAAR 3‐8 Average Raw Score and Percent Correct by Grade and Campus: English Version STAAR and STAAR L 2012
Average % Correct
Average Raw Score
Average % Correct
Average Raw Score
Average % Correct
Average Raw Score
Average % Correct
Average Raw Score
Average % Correct
Average Raw ScoreCampus Name Grade
Total** Tested
Reading/ELA Math Writing Science Social Studies
Benbrook 03 24 47 19 53 2404 21 64 28 64 31 61 2705 71 62 29 68 34 73 32
Berry 03 58 63 25 66 3104 93 54 24 57 28 47 2105 78 63 29 60 30 70 31
Bonham 03 50 58 23 60 2804 115 58 26 62 30 56 2505 111 59 27 71 36 72 32
Bonner 03 65 56 22 62 2804 85 68 30 71 34 63 2805 116 60 28 66 33 68 30
Braeburn 03 51 63 25 66 3004 92 65 29 63 30 54 2405 144 56 26 66 33 66 29
Briargrove 03 154 70 28 70 3204 111 66 29 72 34 61 2705 128 74 34 71 36 79 35
Briarmeadow 03 64 64 26 69 3204 65 70 31 65 31 62 2705 47 66 30 66 33 72 3206 50 82 40 81 4207 46 81 41 71 39 73 5308 46 81 42 74 42 78 42 67 35
Briscoe 03 30 57 23 60 2804 33 57 25 66 32 54 2405 65 66 30 65 32 80 3506 46 70 33 62 32
Brookline 03 98 59 24 62 2804 137 57 25 61 29 56 2505 130 63 29 66 33 69 30
Browning 03 51 64 25 67 3104 67 68 30 71 34 62 2705 62 66 30 69 34 82 36
HISD Research and Accountability *Fewer than 5 students tested; ** Total tested represents total tested in reading with STAAR and L B‐2

Appendix B: STAAR 3‐8 Average Raw Score and Percent Correct by Grade and Campus: English Version STAAR and STAAR L 2012
Average % Correct
Average Raw Score
Average % Correct
Average Raw Score
Average % Correct
Average Raw Score
Average % Correct
Average Raw Score
Average % Correct
Average Raw ScoreCampus Name Grade
Total** Tested
Reading/ELA Math Writing Science Social Studies
Bruce 03 62 49 20 50 2304 89 49 21 57 27 50 2205 84 55 25 58 29 60 27
Burbank ES 03 54 63 25 59 2704 58 58 26 60 29 58 2605 107 61 28 69 35 76 33
Burnet 03 39 60 24 62 2804 58 60 26 61 29 58 2505 81 64 29 65 32 77 3406 39 65 31 68 35
Burrus 03 60 54 21 55 2504 58 55 24 49 24 54 2405 57 64 29 60 30 66 29
Bush 03 115 76 30 77 3604 107 82 36 83 40 73 3205 112 81 37 83 41 85 37
Cage 03 40 65 26 63 2904 68 68 30 69 33 61 2705 75 63 29 65 32 69 30
Carrillo 03 39 74 29 77 3604 49 71 31 74 36 67 3005 94 63 29 69 35 75 33
Codwell 03 101 65 26 58 2704 83 60 27 61 29 59 2605 77 59 27 58 29 63 28
Condit 03 99 79 31 76 3504 109 77 34 82 39 72 3205 116 80 37 80 40 83 36
Cook 03 93 51 21 49 2204 86 52 23 56 27 54 2405 84 59 27 55 27 68 30
Coop 03 57 48 19 47 2204 100 56 25 62 30 52 2305 101 55 25 56 28 62 27
HISD Research and Accountability *Fewer than 5 students tested; ** Total tested represents total tested in reading with STAAR and L B‐3

Appendix B: STAAR 3‐8 Average Raw Score and Percent Correct by Grade and Campus: English Version STAAR and STAAR L 2012
Average % Correct
Average Raw Score
Average % Correct
Average Raw Score
Average % Correct
Average Raw Score
Average % Correct
Average Raw Score
Average % Correct
Average Raw ScoreCampus Name Grade
Total** Tested
Reading/ELA Math Writing Science Social Studies
Cornelius 03 125 68 27 66 3004 110 68 30 69 33 65 2905 122 69 32 75 38 84 37
Crespo 03 31 60 24 58 2704 85 70 31 71 34 68 3005 98 61 28 65 33 72 32
Crockett 03 57 60 24 63 2904 64 61 27 56 27 54 2405 63 68 31 60 30 64 28
Cunningham 03 24 54 21 53 2404 73 56 25 67 32 57 2505 91 61 28 67 34 70 31
Daily 03 127 60 24 56 2604 98 73 32 74 35 69 3005 91 68 31 74 37 76 34
DeAnda 03 59 55 22 54 2504 64 62 27 63 30 58 2605 67 59 27 60 30 68 30
DeChaumes 03 46 59 24 69 3204 39 66 29 69 33 58 2605 87 63 29 68 34 75 33
DeZavala 03 46 64 26 65 3004 90 68 30 74 36 64 2805 83 69 32 75 38 81 36
Dodson 03 50 56 22 54 2504 55 48 21 51 25 44 1905 38 58 27 49 24 63 2806 12 66 32 47 24
Dogan 03 48 41 16 43 2004 47 49 22 45 22 49 2105 62 57 26 56 28 65 29
Durham 03 48 58 23 53 2504 70 61 27 65 31 55 2405 68 62 29 65 32 70 31
HISD Research and Accountability *Fewer than 5 students tested; ** Total tested represents total tested in reading with STAAR and L B‐4

Appendix B: STAAR 3‐8 Average Raw Score and Percent Correct by Grade and Campus: English Version STAAR and STAAR L 2012
Average % Correct
Average Raw Score
Average % Correct
Average Raw Score
Average % Correct
Average Raw Score
Average % Correct
Average Raw Score
Average % Correct
Average Raw ScoreCampus Name Grade
Total** Tested
Reading/ELA Math Writing Science Social Studies
Durkee 03 45 54 21 55 2504 46 52 23 50 24 51 2205 106 58 27 54 27 66 29
Eliot 03 41 55 22 53 2504 69 58 26 61 29 54 2405 69 59 27 59 30 72 32
Elrod 03 36 60 24 61 2804 80 63 28 61 29 59 2605 60 60 28 60 30 66 29
Emerson 03 56 53 21 52 2404 70 66 29 67 32 62 2705 112 59 27 61 31 61 27
Energ for Excell ES 03 273 59 23 65 3004 207 61 27 73 35 56 2505 211 62 28 66 33 70 31
Field 03 26 65 26 72 3304 40 67 30 62 30 60 2605 56 71 33 71 35 71 31
Foerster 03 82 51 20 55 2504 89 50 22 55 26 51 2305 85 59 27 61 30 67 30
Fondren 03 25 58 23 55 2504 25 55 24 61 29 55 2405 38 57 26 62 31 62 27
Foster 03 74 48 19 45 2004 52 52 23 47 23 48 2105 51 53 24 45 22 59 26
Franklin 03 23 52 21 52 2404 79 56 25 57 27 54 2405 60 58 27 65 32 72 32
Gallegos 03 58 64 26 70 3204 65 63 28 77 37 56 2505 62 65 30 76 38 82 36
HISD Research and Accountability *Fewer than 5 students tested; ** Total tested represents total tested in reading with STAAR and L B‐5
Appendix B: STAAR 3‐8 Average Raw Score and Percent Correct by Grade and Campus: English Version STAAR and STAAR L 2012
Average % Correct
Average Raw Score
Average % Correct
Average Raw Score
Average % Correct
Average Raw Score
Average % Correct
Average Raw Score
Average % Correct
Average Raw ScoreCampus Name Grade
Total** Tested
Reading/ELA Math Writing Science Social Studies
Garcia 03 77 52 21 49 2204 111 57 25 64 31 53 2305 110 57 26 59 30 64 28
Garden Oaks 03 60 62 25 58 2704 67 63 28 62 30 60 2605 57 66 30 65 32 69 3006 14 71 34 56 29
Garden Villas 03 77 66 27 64 2904 128 66 29 68 33 61 2705 150 63 29 62 31 68 30
Golfcrest 03 48 63 25 66 3004 88 66 29 68 33 58 2505 102 65 30 73 37 80 35
Gordon 03 27 51 20 46 2104 74 53 23 59 28 50 2205 66 56 26 61 31 68 30
Gregg 03 75 41 16 66 3004 37 67 30 73 35 48 2105 58 59 27 64 32 72 32
Gregory‐Lincoln ES 03 33 42 17 43 2004 42 49 22 46 22 49 2205 51 55 25 59 29 65 29
Grissom 03 61 48 19 52 2404 83 50 22 49 23 51 2205 111 60 28 63 32 69 30
Gross 03 79 52 21 49 2204 86 55 24 58 28 52 2305 97 61 28 63 31 67 29
Harris, J. R. 03 60 69 28 77 3504 89 66 29 73 35 61 2705 63 65 30 71 36 71 31
Harris, R. P. 03 44 61 24 62 2804 65 54 24 55 26 50 2205 58 61 28 59 30 68 30
HISD Research and Accountability *Fewer than 5 students tested; ** Total tested represents total tested in reading with STAAR and L B‐6

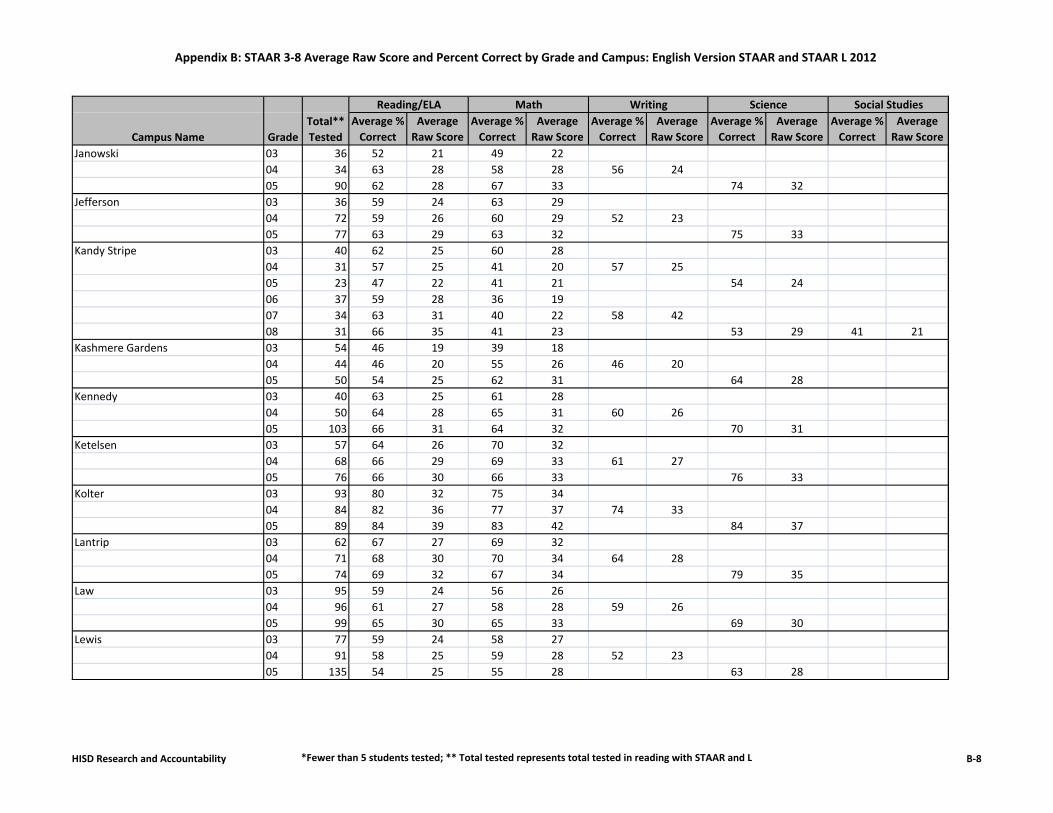
Appendix B: STAAR 3‐8 Average Raw Score and Percent Correct by Grade and Campus: English Version STAAR and STAAR L 2012
Average % Correct
Average Raw Score
Average % Correct
Average Raw Score
Average % Correct
Average Raw Score
Average % Correct
Average Raw Score
Average % Correct
Average Raw ScoreCampus Name Grade
Total** Tested
Reading/ELA Math Writing Science Social Studies
Hartsfield 03 62 66 26 64 2904 64 54 24 55 26 58 2605 60 64 30 56 28 68 30
Harvard 03 89 72 29 71 3304 98 76 33 72 35 67 3005 99 75 34 74 37 78 34
Helms 03 20 53 21 57 2604 16 61 27 61 29 56 2505 76 65 30 65 33 72 32
Henderson, J. P. 03 42 60 24 60 2804 40 65 28 71 34 64 2805 96 70 32 75 38 76 33
Henderson, N. Q. 03 51 61 25 56 2604 39 61 27 65 31 64 2805 41 70 32 69 35 76 34
Herod 03 88 68 27 71 3304 86 78 34 83 40 68 3005 105 77 36 81 40 85 37
Herrera 03 66 57 23 59 2704 59 62 27 52 25 50 2205 136 63 29 65 33 71 31
Hines‐Caldwell 03 75 69 27 69 3204 52 72 32 74 36 65 2905 141 65 30 66 33 73 32
Hobby 03 85 54 22 50 2304 65 59 26 51 24 57 2505 112 61 28 55 28 63 28
Horn 03 98 83 33 83 3804 96 82 36 81 39 71 3105 93 83 38 87 43 87 38
Houston Gardens 03 54 49 20 49 2304 44 57 25 55 26 54 2405 44 60 28 62 31 63 28
HISD Research and Accountability *Fewer than 5 students tested; ** Total tested represents total tested in reading with STAAR and L B‐7
Appendix B: STAAR 3‐8 Average Raw Score and Percent Correct by Grade and Campus: English Version STAAR and STAAR L 2012
Average % Correct
Average Raw Score
Average % Correct
Average Raw Score
Average % Correct
Average Raw Score
Average % Correct
Average Raw Score
Average % Correct
Average Raw ScoreCampus Name Grade
Total** Tested
Reading/ELA Math Writing Science Social Studies
Janowski 03 36 52 21 49 2204 34 63 28 58 28 56 2405 90 62 28 67 33 74 32
Jefferson 03 36 59 24 63 2904 72 59 26 60 29 52 2305 77 63 29 63 32 75 33
Kandy Stripe 03 40 62 25 60 2804 31 57 25 41 20 57 2505 23 47 22 41 21 54 2406 37 59 28 36 1907 34 63 31 40 22 58 4208 31 66 35 41 23 53 29 41 21
Kashmere Gardens 03 54 46 19 39 1804 44 46 20 55 26 46 2005 50 54 25 62 31 64 28
Kennedy 03 40 63 25 61 2804 50 64 28 65 31 60 2605 103 66 31 64 32 70 31
Ketelsen 03 57 64 26 70 3204 68 66 29 69 33 61 2705 76 66 30 66 33 76 33
Kolter 03 93 80 32 75 3404 84 82 36 77 37 74 3305 89 84 39 83 42 84 37
Lantrip 03 62 67 27 69 3204 71 68 30 70 34 64 2805 74 69 32 67 34 79 35
Law 03 95 59 24 56 2604 96 61 27 58 28 59 2605 99 65 30 65 33 69 30
Lewis 03 77 59 24 58 2704 91 58 25 59 28 52 2305 135 54 25 55 28 63 28
HISD Research and Accountability *Fewer than 5 students tested; ** Total tested represents total tested in reading with STAAR and L B‐8

Appendix B: STAAR 3‐8 Average Raw Score and Percent Correct by Grade and Campus: English Version STAAR and STAAR L 2012
Average % Correct
Average Raw Score
Average % Correct
Average Raw Score
Average % Correct
Average Raw Score
Average % Correct
Average Raw Score
Average % Correct
Average Raw ScoreCampus Name Grade
Total** Tested
Reading/ELA Math Writing Science Social Studies
Lockhart 03 101 66 26 61 2804 97 61 27 58 28 61 2705 101 70 32 64 32 75 33
Longfellow 03 115 67 27 62 2904 101 59 26 52 25 54 2405 119 61 28 58 29 68 30
Looscan 03 26 61 24 57 2604 62 54 24 63 30 55 2405 55 57 26 54 27 65 29
Love 03 43 68 27 65 3004 57 60 27 69 33 59 2605 67 60 28 55 27 69 30
Lovett 03 106 75 30 74 3404 113 74 33 70 34 70 3105 105 78 36 72 36 79 35
Lyons 03 57 66 26 71 3304 81 75 33 73 35 67 3005 125 69 32 76 38 79 35
MacGregor 03 73 69 28 70 3204 58 69 31 70 34 66 2905 72 72 33 64 32 74 33
Mading 03 78 64 25 65 3004 79 58 26 58 28 64 2805 72 65 30 62 31 67 30
Martinez, C. 03 45 54 22 59 2704 81 58 25 69 33 55 2405 78 56 26 50 25 62 27
Martinez, R. 03 62 56 23 53 2404 63 52 23 48 23 51 2205 59 62 28 58 29 68 30
McNamara 03 73 57 23 65 3004 99 64 28 71 34 55 2405 108 58 27 58 29 67 29
HISD Research and Accountability *Fewer than 5 students tested; ** Total tested represents total tested in reading with STAAR and L B‐9

Appendix B: STAAR 3‐8 Average Raw Score and Percent Correct by Grade and Campus: English Version STAAR and STAAR L 2012
Average % Correct
Average Raw Score
Average % Correct
Average Raw Score
Average % Correct
Average Raw Score
Average % Correct
Average Raw Score
Average % Correct
Average Raw ScoreCampus Name Grade
Total** Tested
Reading/ELA Math Writing Science Social Studies
Memorial 03 25 76 30 76 3504 60 61 27 61 29 55 2405 42 62 28 62 31 70 31
Milne 03 83 56 22 57 2604 104 57 25 55 26 54 2405 92 62 29 51 26 66 29
Mitchell 03 50 52 21 49 2304 42 53 24 52 25 51 2305 74 61 28 56 28 72 32
Montgomery 03 74 61 24 63 2904 54 64 28 61 29 59 2605 112 58 27 59 30 67 30
Moreno 03 134 62 25 67 3104 116 66 29 68 33 60 2605 120 68 31 72 36 71 31
Neff 03 87 68 27 73 3404 142 64 28 71 34 56 2505 127 64 30 68 34 73 32
Northline 03 37 47 19 45 2004 38 46 20 45 22 42 1905 86 59 27 61 30 68 30
Oak Forest 03 123 82 33 82 3804 111 77 34 83 40 71 3105 125 79 36 82 41 81 36
Oates 03 42 57 23 63 2904 48 63 28 65 31 62 2705 47 67 31 70 35 72 3206 43 69 33 57 30
Osborne 03 63 67 27 65 3004 48 73 32 71 34 69 3005 55 67 31 66 33 70 31
Paige 03 43 51 21 59 2704 43 49 21 55 26 52 2305 42 62 29 71 36 73 32
HISD Research and Accountability *Fewer than 5 students tested; ** Total tested represents total tested in reading with STAAR and L B‐10
Appendix B: STAAR 3‐8 Average Raw Score and Percent Correct by Grade and Campus: English Version STAAR and STAAR L 2012
Average % Correct
Average Raw Score
Average % Correct
Average Raw Score
Average % Correct
Average Raw Score
Average % Correct
Average Raw Score
Average % Correct
Average Raw ScoreCampus Name Grade
Total** Tested
Reading/ELA Math Writing Science Social Studies
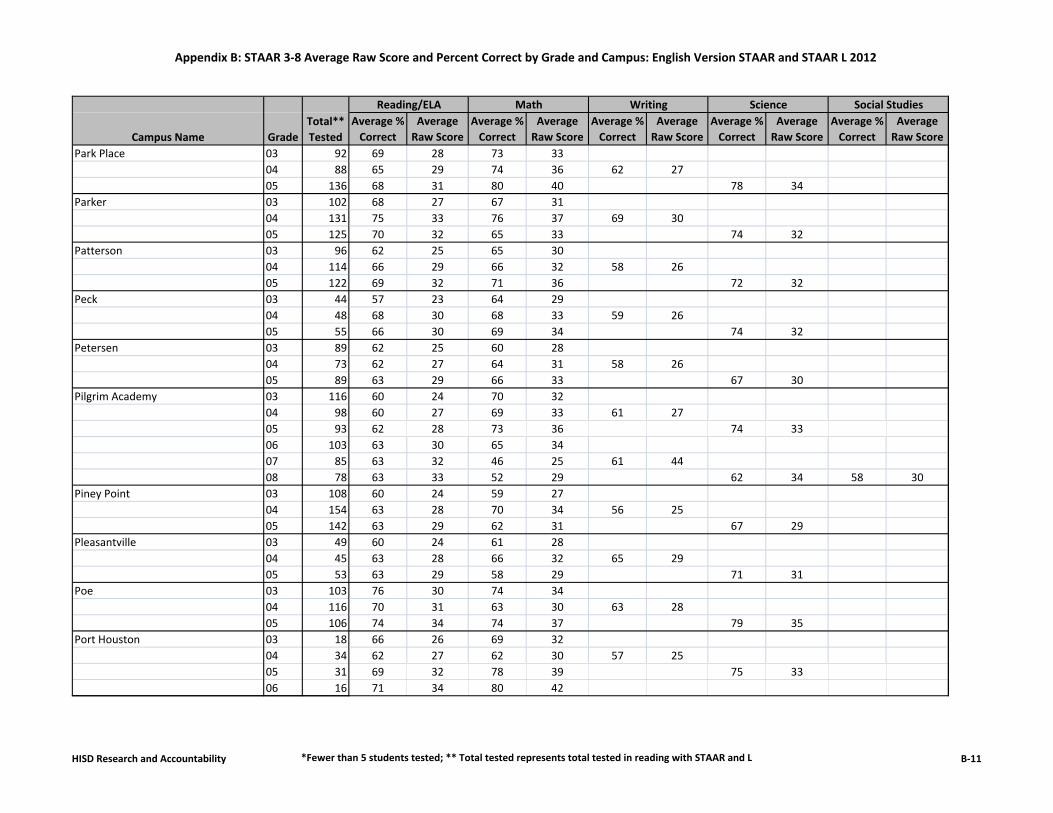
Park Place 03 92 69 28 73 3304 88 65 29 74 36 62 2705 136 68 31 80 40 78 34
Parker 03 102 68 27 67 3104 131 75 33 76 37 69 3005 125 70 32 65 33 74 32
Patterson 03 96 62 25 65 3004 114 66 29 66 32 58 2605 122 69 32 71 36 72 32
Peck 03 44 57 23 64 2904 48 68 30 68 33 59 2605 55 66 30 69 34 74 32
Petersen 03 89 62 25 60 2804 73 62 27 64 31 58 2605 89 63 29 66 33 67 30
Pilgrim Academy 03 116 60 24 70 3204 98 60 27 69 33 61 2705 93 62 28 73 36 74 3306 103 63 30 65 3407 85 63 32 46 25 61 4408 78 63 33 52 29 62 34 58 30
Piney Point 03 108 60 24 59 2704 154 63 28 70 34 56 2505 142 63 29 62 31 67 29
Pleasantville 03 49 60 24 61 2804 45 63 28 66 32 65 2905 53 63 29 58 29 71 31
Poe 03 103 76 30 74 3404 116 70 31 63 30 63 2805 106 74 34 74 37 79 35
Port Houston 03 18 66 26 69 3204 34 62 27 62 30 57 2505 31 69 32 78 39 75 3306 16 71 34 80 42
HISD Research and Accountability *Fewer than 5 students tested; ** Total tested represents total tested in reading with STAAR and L B‐11

Appendix B: STAAR 3‐8 Average Raw Score and Percent Correct by Grade and Campus: English Version STAAR and STAAR L 2012
Average % Correct
Average Raw Score
Average % Correct
Average Raw Score
Average % Correct
Average Raw Score
Average % Correct
Average Raw Score
Average % Correct
Average Raw ScoreCampus Name Grade
Total** Tested
Reading/ELA Math Writing Science Social Studies
Pugh 03 45 57 23 53 2404 67 60 26 56 27 58 2505 62 67 31 61 31 63 28
Red 03 79 67 27 66 3004 68 69 31 76 37 63 2805 73 67 31 68 34 74 33
Reynolds 03 88 55 22 51 2404 81 55 24 52 25 53 2305 48 59 27 55 27 60 26
Rice 03 95 68 27 71 3204 112 70 31 68 32 64 2805 135 69 32 70 35 72 3206 180 72 35 61 3207 162 72 36 42 22 67 4808 132 74 39 47 26 68 37 65 34
River Oaks 03 135 84 34 84 3904 107 85 38 84 40 77 3405 110 87 40 89 45 89 39
Roberts 03 123 78 31 79 3604 111 82 36 80 38 73 3205 109 80 37 80 40 84 37
Rodriguez 03 71 65 26 69 3204 94 74 33 79 38 66 2905 135 64 30 72 36 79 35
Roosevelt 03 81 58 23 67 3104 83 66 29 70 33 59 2605 73 65 30 70 35 68 30
Ross 03 63 59 24 57 2604 63 53 23 51 25 50 2205 78 63 29 59 29 67 30
Rucker 03 35 61 24 61 2804 40 56 25 53 25 52 2305 104 63 29 69 35 70 31
HISD Research and Accountability *Fewer than 5 students tested; ** Total tested represents total tested in reading with STAAR and L B‐12
Appendix B: STAAR 3‐8 Average Raw Score and Percent Correct by Grade and Campus: English Version STAAR and STAAR L 2012
Average % Correct
Average Raw Score
Average % Correct
Average Raw Score
Average % Correct
Average Raw Score
Average % Correct
Average Raw Score
Average % Correct
Average Raw ScoreCampus Name Grade
Total** Tested
Reading/ELA Math Writing Science Social Studies
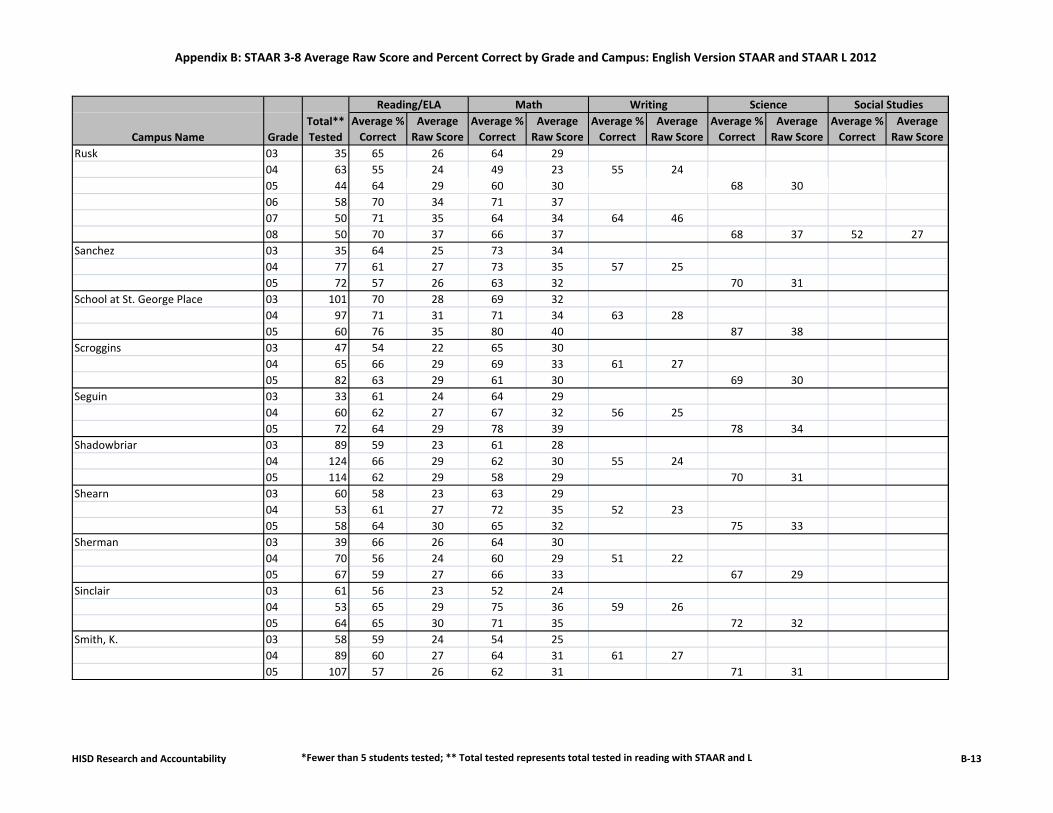
Rusk 03 35 65 26 64 2904 63 55 24 49 23 55 2405 44 64 29 60 30 68 3006 58 70 34 71 3707 50 71 35 64 34 64 4608 50 70 37 66 37 68 37 52 27
Sanchez 03 35 64 25 73 3404 77 61 27 73 35 57 2505 72 57 26 63 32 70 31
School at St. George Place 03 101 70 28 69 3204 97 71 31 71 34 63 2805 60 76 35 80 40 87 38
Scroggins 03 47 54 22 65 3004 65 66 29 69 33 61 2705 82 63 29 61 30 69 30
Seguin 03 33 61 24 64 2904 60 62 27 67 32 56 2505 72 64 29 78 39 78 34
Shadowbriar 03 89 59 23 61 2804 124 66 29 62 30 55 2405 114 62 29 58 29 70 31
Shearn 03 60 58 23 63 2904 53 61 27 72 35 52 2305 58 64 30 65 32 75 33
Sherman 03 39 66 26 64 3004 70 56 24 60 29 51 2205 67 59 27 66 33 67 29
Sinclair 03 61 56 23 52 2404 53 65 29 75 36 59 2605 64 65 30 71 35 72 32
Smith, K. 03 58 59 24 54 2504 89 60 27 64 31 61 2705 107 57 26 62 31 71 31
HISD Research and Accountability *Fewer than 5 students tested; ** Total tested represents total tested in reading with STAAR and L B‐13
Appendix B: STAAR 3‐8 Average Raw Score and Percent Correct by Grade and Campus: English Version STAAR and STAAR L 2012
Average % Correct
Average Raw Score
Average % Correct
Average Raw Score
Average % Correct
Average Raw Score
Average % Correct
Average Raw Score
Average % Correct
Average Raw ScoreCampus Name Grade
Total** Tested
Reading/ELA Math Writing Science Social Studies
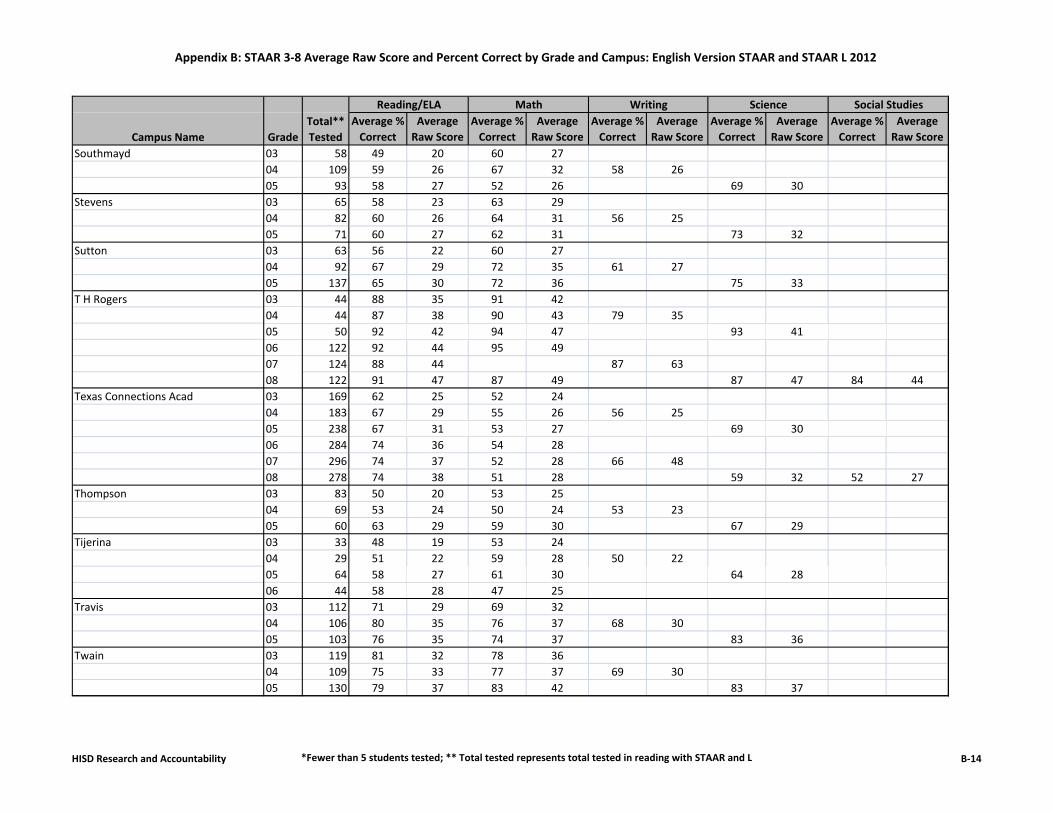
Southmayd 03 58 49 20 60 2704 109 59 26 67 32 58 2605 93 58 27 52 26 69 30
Stevens 03 65 58 23 63 2904 82 60 26 64 31 56 2505 71 60 27 62 31 73 32
Sutton 03 63 56 22 60 2704 92 67 29 72 35 61 2705 137 65 30 72 36 75 33
T H Rogers 03 44 88 35 91 4204 44 87 38 90 43 79 3505 50 92 42 94 47 93 4106 122 92 44 95 4907 124 88 44 87 6308 122 91 47 87 49 87 47 84 44
Texas Connections Acad 03 169 62 25 52 2404 183 67 29 55 26 56 2505 238 67 31 53 27 69 3006 284 74 36 54 2807 296 74 37 52 28 66 4808 278 74 38 51 28 59 32 52 27
Thompson 03 83 50 20 53 2504 69 53 24 50 24 53 2305 60 63 29 59 30 67 29
Tijerina 03 33 48 19 53 2404 29 51 22 59 28 50 2205 64 58 27 61 30 64 2806 44 58 28 47 25
Travis 03 112 71 29 69 3204 106 80 35 76 37 68 3005 103 76 35 74 37 83 36
Twain 03 119 81 32 78 3604 109 75 33 77 37 69 3005 130 79 37 83 42 83 37
HISD Research and Accountability *Fewer than 5 students tested; ** Total tested represents total tested in reading with STAAR and L B‐14
Appendix B: STAAR 3‐8 Average Raw Score and Percent Correct by Grade and Campus: English Version STAAR and STAAR L 2012
Average % Correct
Average Raw Score
Average % Correct
Average Raw Score
Average % Correct
Average Raw Score
Average % Correct
Average Raw Score
Average % Correct
Average Raw ScoreCampus Name Grade
Total** Tested
Reading/ELA Math Writing Science Social Studies
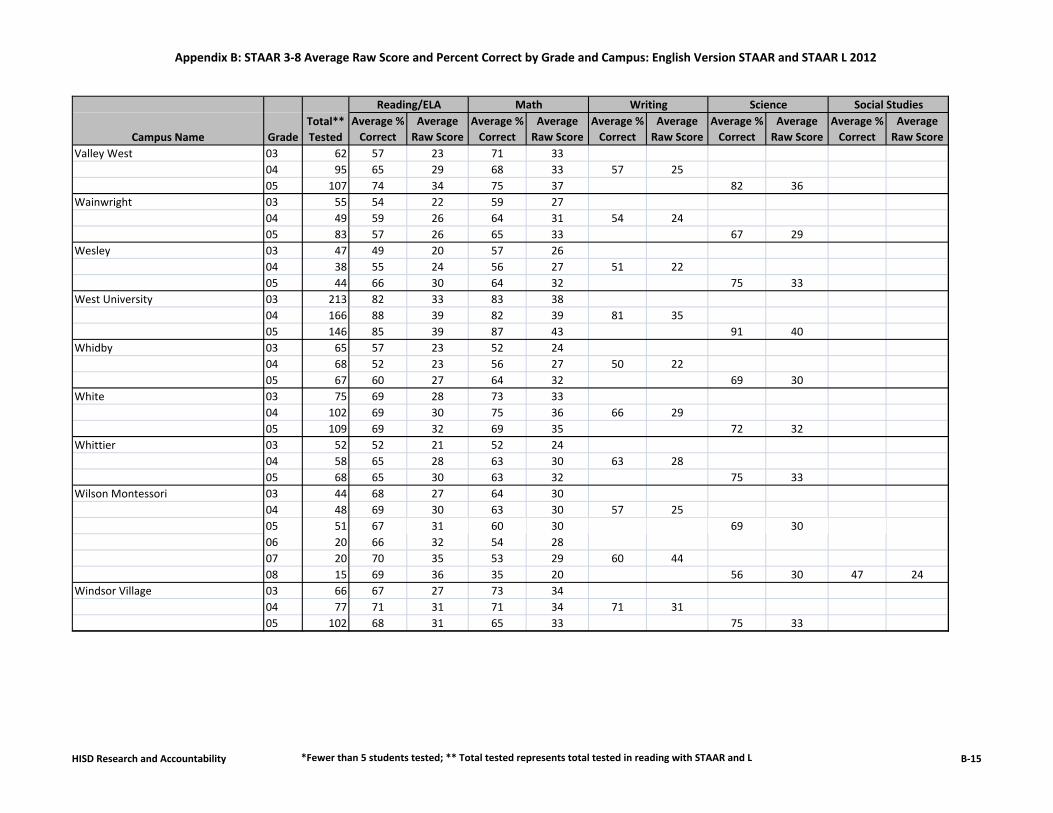
Valley West 03 62 57 23 71 3304 95 65 29 68 33 57 2505 107 74 34 75 37 82 36
Wainwright 03 55 54 22 59 2704 49 59 26 64 31 54 2405 83 57 26 65 33 67 29
Wesley 03 47 49 20 57 2604 38 55 24 56 27 51 2205 44 66 30 64 32 75 33
West University 03 213 82 33 83 3804 166 88 39 82 39 81 3505 146 85 39 87 43 91 40
Whidby 03 65 57 23 52 2404 68 52 23 56 27 50 2205 67 60 27 64 32 69 30
White 03 75 69 28 73 3304 102 69 30 75 36 66 2905 109 69 32 69 35 72 32
Whittier 03 52 52 21 52 2404 58 65 28 63 30 63 2805 68 65 30 63 32 75 33
Wilson Montessori 03 44 68 27 64 3004 48 69 30 63 30 57 2505 51 67 31 60 30 69 3006 20 66 32 54 2807 20 70 35 53 29 60 4408 15 69 36 35 20 56 30 47 24
Windsor Village 03 66 67 27 73 3404 77 71 31 71 34 71 3105 102 68 31 65 33 75 33
HISD Research and Accountability *Fewer than 5 students tested; ** Total tested represents total tested in reading with STAAR and L B‐15
Appendix B: STAAR 3‐8 Average Raw Score and Percent Correct by Grade and Campus: English Version STAAR and STAAR L 2012
Average % Correct
Average Raw Score
Average % Correct
Average Raw Score
Average % Correct
Average Raw Score
Average % Correct
Average Raw Score
Average % Correct
Average Raw ScoreCampus Name Grade
Total** Tested
Reading/ELA Math Writing Science Social Studies
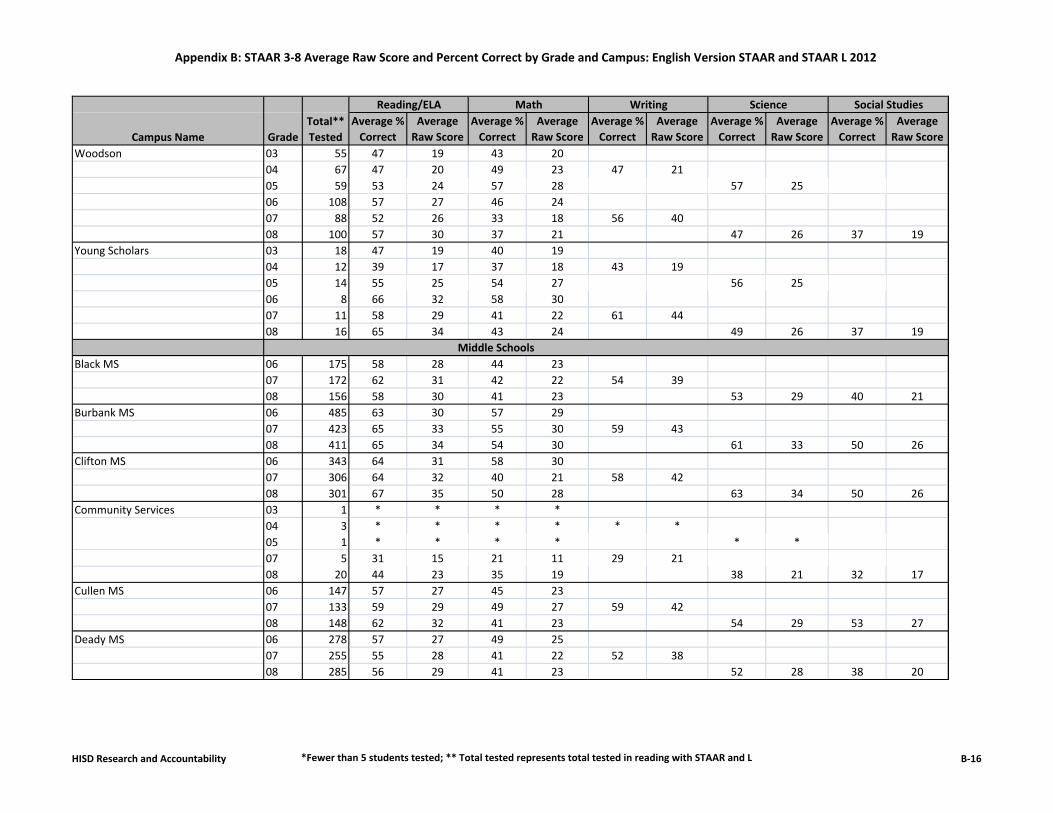
Woodson 03 55 47 19 43 2004 67 47 20 49 23 47 2105 59 53 24 57 28 57 2506 108 57 27 46 2407 88 52 26 33 18 56 4008 100 57 30 37 21 47 26 37 19
Young Scholars 03 18 47 19 40 1904 12 39 17 37 18 43 1905 14 55 25 54 27 56 2506 8 66 32 58 3007 11 58 29 41 22 61 4408 16 65 34 43 24 49 26 37 19
Black MS 06 175 58 28 44 2307 172 62 31 42 22 54 3908 156 58 30 41 23 53 29 40 21
Burbank MS 06 485 63 30 57 2907 423 65 33 55 30 59 4308 411 65 34 54 30 61 33 50 26
Clifton MS 06 343 64 31 58 3007 306 64 32 40 21 58 4208 301 67 35 50 28 63 34 50 26
Community Services 03 1 * * * *04 3 * * * * * *05 1 * * * * * *07 5 31 15 21 11 29 2108 20 44 23 35 19 38 21 32 17
Cullen MS 06 147 57 27 45 2307 133 59 29 49 27 59 4208 148 62 32 41 23 54 29 53 27
Deady MS 06 278 57 27 49 2507 255 55 28 41 22 52 3808 285 56 29 41 23 52 28 38 20
Middle Schools
HISD Research and Accountability *Fewer than 5 students tested; ** Total tested represents total tested in reading with STAAR and L B‐16
Appendix B: STAAR 3‐8 Average Raw Score and Percent Correct by Grade and Campus: English Version STAAR and STAAR L 2012
Average % Correct
Average Raw Score
Average % Correct
Average Raw Score
Average % Correct
Average Raw Score
Average % Correct
Average Raw Score
Average % Correct
Average Raw ScoreCampus Name Grade
Total** Tested
Reading/ELA Math Writing Science Social Studies
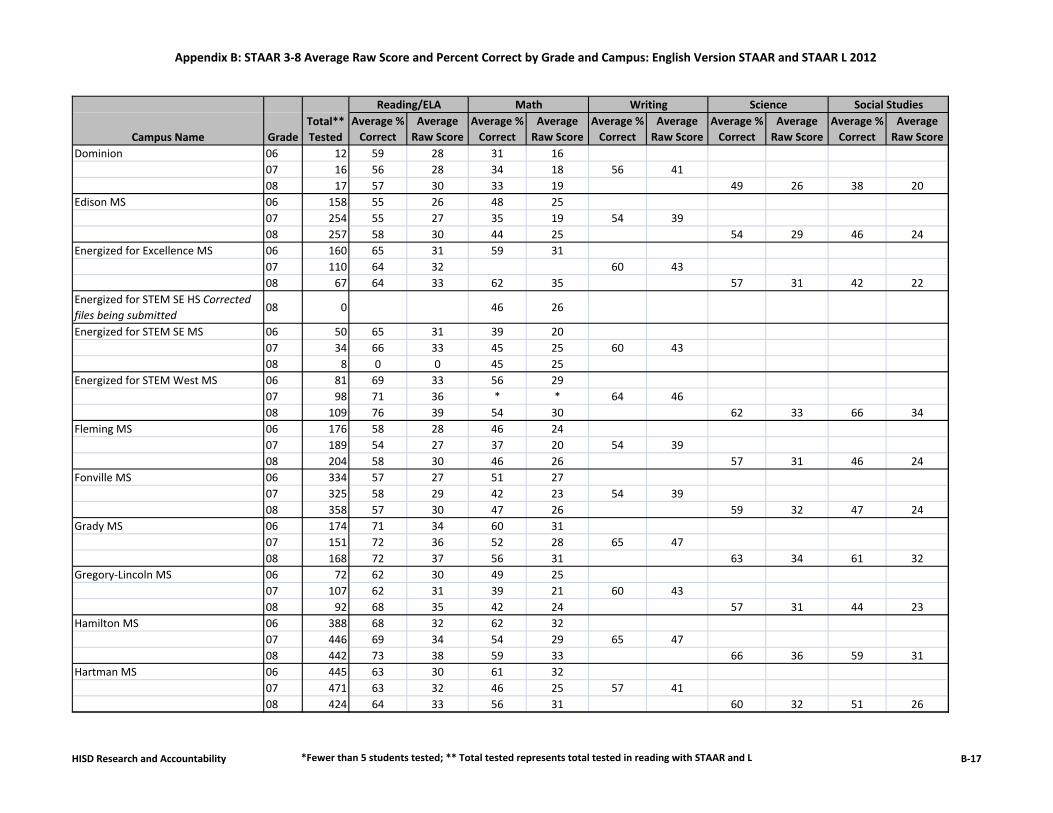
Dominion 06 12 59 28 31 1607 16 56 28 34 18 56 4108 17 57 30 33 19 49 26 38 20
Edison MS 06 158 55 26 48 2507 254 55 27 35 19 54 3908 257 58 30 44 25 54 29 46 24
Energized for Excellence MS 06 160 65 31 59 3107 110 64 32 60 4308 67 64 33 62 35 57 31 42 22
Energized for STEM SE HS Corrected files being submitted
08 0 46 26
Energized for STEM SE MS 06 50 65 31 39 2007 34 66 33 45 25 60 4308 8 0 0 45 25
Energized for STEM West MS 06 81 69 33 56 2907 98 71 36 * * 64 4608 109 76 39 54 30 62 33 66 34
Fleming MS 06 176 58 28 46 2407 189 54 27 37 20 54 3908 204 58 30 46 26 57 31 46 24
Fonville MS 06 334 57 27 51 2707 325 58 29 42 23 54 3908 358 57 30 47 26 59 32 47 24
Grady MS 06 174 71 34 60 3107 151 72 36 52 28 65 4708 168 72 37 56 31 63 34 61 32
Gregory‐Lincoln MS 06 72 62 30 49 2507 107 62 31 39 21 60 4308 92 68 35 42 24 57 31 44 23
Hamilton MS 06 388 68 32 62 3207 446 69 34 54 29 65 4708 442 73 38 59 33 66 36 59 31
Hartman MS 06 445 63 30 61 3207 471 63 32 46 25 57 4108 424 64 33 56 31 60 32 51 26
HISD Research and Accountability *Fewer than 5 students tested; ** Total tested represents total tested in reading with STAAR and L B‐17

Appendix B: STAAR 3‐8 Average Raw Score and Percent Correct by Grade and Campus: English Version STAAR and STAAR L 2012
Average % Correct
Average Raw Score
Average % Correct
Average Raw Score
Average % Correct
Average Raw Score
Average % Correct
Average Raw Score
Average % Correct
Average Raw ScoreCampus Name Grade
Total** Tested
Reading/ELA Math Writing Science Social Studies
Henry MS 06 330 54 26 48 2507 274 57 28 45 24 53 3808 307 59 31 48 27 54 29 40 21
High School Ahead 06 20 46 22 33 1707 145 43 21 31 17 44 3108 142 43 22 30 17 41 22 29 15
Hogg MS 06 201 61 29 50 2607 215 60 30 36 20 56 4008 227 64 33 49 28 62 33 62 32
Holland MS 06 175 57 27 44 2307 245 54 27 33 18 51 3708 239 58 30 38 21 55 30 39 20
Inspired for Excell Academy West 05 42 51 24 41 21 41 1806 42 46 22 29 1507 38 41 21 30 16 44 3208 62 56 29 40 22 41 22 31 16
Jackson MS 06 307 59 28 56 2907 343 58 29 50 27 55 3908 286 59 31 48 27 59 32 44 23
Johnston MS 06 517 70 33 59 3107 480 72 36 46 25 68 4908 464 72 38 50 28 66 36 62 32
Kaleidoscope School MS 06 48 64 31 67 3507 25 69 35 71 38 66 4708 32 65 34 64 36 63 34 54 28
Lanier MS 06 456 82 40 81 4207 424 78 39 48 26 71 5108 428 80 42 69 39 74 40 68 35
Las Americas MS 06 36 31 15 27 1407 58 33 16 33 18 34 2508 69 32 16 29 16 34 18 31 16
Long MS 06 221 52 25 49 2607 226 53 27 35 19 51 3708 205 55 29 42 23 48 26 46 24
HISD Research and Accountability *Fewer than 5 students tested; ** Total tested represents total tested in reading with STAAR and L B‐18

Appendix B: STAAR 3‐8 Average Raw Score and Percent Correct by Grade and Campus: English Version STAAR and STAAR L 2012
Average % Correct
Average Raw Score
Average % Correct
Average Raw Score
Average % Correct
Average Raw Score
Average % Correct
Average Raw Score
Average % Correct
Average Raw ScoreCampus Name Grade
Total** Tested
Reading/ELA Math Writing Science Social Studies
Marshall MS 06 243 60 29 55 2907 330 59 30 49 26 56 4108 281 59 31 43 24 56 30 48 25
McReynolds MS 06 211 59 28 52 2707 217 58 29 42 23 56 4008 222 60 31 47 26 64 35 44 23
Ortíz MS 06 345 60 29 51 2707 312 61 30 50 27 57 4108 309 62 32 46 26 61 33 47 24
Pershing MS 06 546 72 34 65 3407 563 69 35 46 25 65 4608 537 72 38 56 32 70 38 61 32
Pin Oak MS 06 364 82 39 79 4107 365 81 40 51 27 75 5408 378 81 42 60 34 77 42 71 37
Project Chrysalis 06 69 79 38 76 3907 70 77 39 * * 73 5208 58 81 42 58 32 73 39 74 38
Provision 05 8 41 19 44 22 52 2306 35 48 23 36 1907 38 48 24 38 20 46 3308 55 49 26 37 21 37 20 32 16
Revere MS 06 337 64 31 59 3107 255 59 30 44 24 54 3908 292 64 33 52 29 58 31 45 23
Sharpstown International 06 154 61 29 58 3007 135 62 31 58 31 58 4208 147 60 31 44 24 57 31 49 26
Stevenson MS 06 448 67 32 63 3307 450 65 33 52 28 62 4508 420 65 34 56 32 66 35 52 27
Sugar Grove 06 230 53 26 40 2107 189 59 30 42 23 55 4008 160 59 31 45 25 53 29 40 21
HISD Research and Accountability *Fewer than 5 students tested; ** Total tested represents total tested in reading with STAAR and L B‐19
Appendix B: STAAR 3‐8 Average Raw Score and Percent Correct by Grade and Campus: English Version STAAR and STAAR L 2012
Average % Correct
Average Raw Score
Average % Correct
Average Raw Score
Average % Correct
Average Raw Score
Average % Correct
Average Raw Score
Average % Correct
Average Raw ScoreCampus Name Grade
Total** Tested
Reading/ELA Math Writing Science Social Studies
Thomas MS 06 138 52 25 45 2307 161 53 27 40 22 54 3908 168 60 31 47 26 48 26 41 21
Welch MS 06 297 61 29 53 2707 266 60 30 39 21 57 4108 309 62 32 42 24 57 31 44 23
West Briar MS 06 418 72 35 62 3207 427 70 35 42 23 65 4608 440 71 37 55 31 62 33 54 28
Wharton Dual Language 05 41 72 33 71 35 74 3206 25 77 37 77 4007 26 78 39 69 5008 28 78 41 58 32 79 43 68 35
Williams MS 06 111 60 29 50 2607 129 58 29 46 25 56 4108 132 57 30 46 26 58 31 43 22
Young Men's College Prep. 06 101 71 34 65 34Young Women's College Prep 06 121 76 37 61 32
07 0 84 45
Blackshear 03 65 47 19 48 2204 60 47 21 60 29 50 2205 49 56 26 53 26 60 27
Davila 03 60 60 24 64 3004 73 52 23 54 26 46 2005 62 55 25 59 29 61 27
Frost 03 75 56 23 57 2604 67 68 30 71 34 70 3105 65 70 32 71 35 76 33
Highland Heights 03 52 49 19 55 2504 66 63 28 64 31 57 2505 89 58 27 52 26 56 25
Isaacs 03 44 49 20 53 2404 70 49 22 57 28 47 2005 58 56 26 61 30 61 27
Apollo 20 Schools
HISD Research and Accountability *Fewer than 5 students tested; ** Total tested represents total tested in reading with STAAR and L B‐20
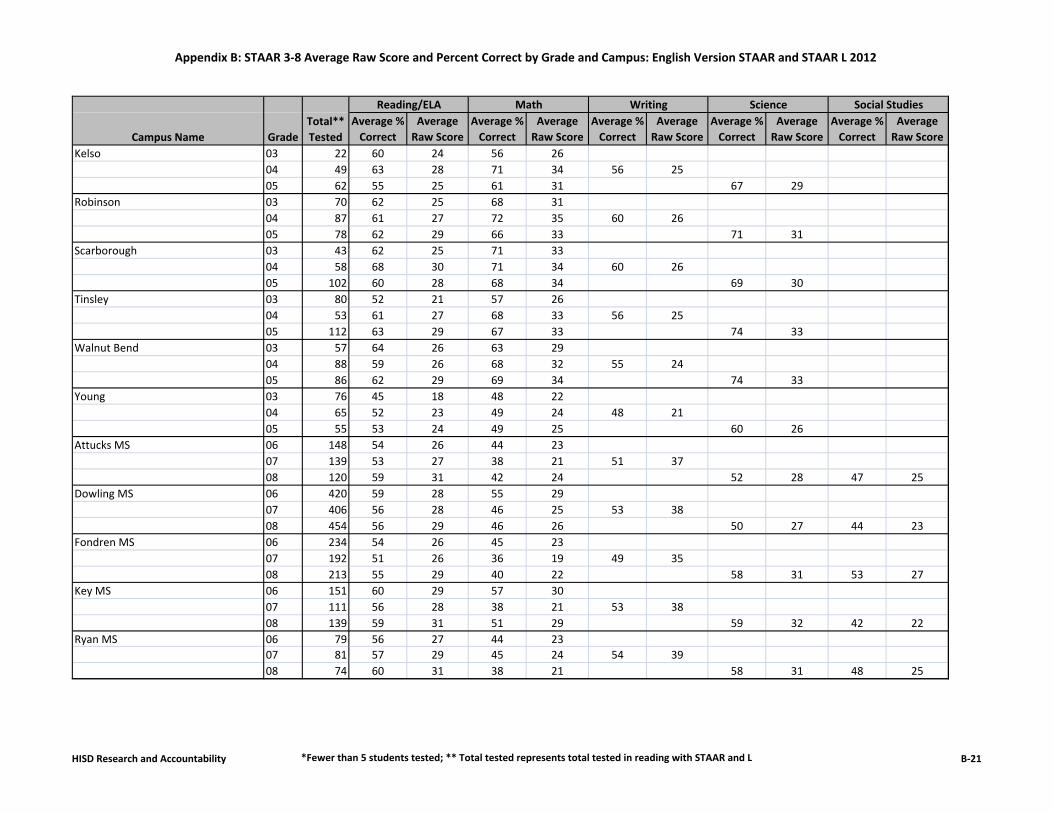
Appendix B: STAAR 3‐8 Average Raw Score and Percent Correct by Grade and Campus: English Version STAAR and STAAR L 2012
Average % Correct
Average Raw Score
Average % Correct
Average Raw Score
Average % Correct
Average Raw Score
Average % Correct
Average Raw Score
Average % Correct
Average Raw ScoreCampus Name Grade
Total** Tested
Reading/ELA Math Writing Science Social Studies
Kelso 03 22 60 24 56 2604 49 63 28 71 34 56 2505 62 55 25 61 31 67 29
Robinson 03 70 62 25 68 3104 87 61 27 72 35 60 2605 78 62 29 66 33 71 31
Scarborough 03 43 62 25 71 3304 58 68 30 71 34 60 2605 102 60 28 68 34 69 30
Tinsley 03 80 52 21 57 2604 53 61 27 68 33 56 2505 112 63 29 67 33 74 33
Walnut Bend 03 57 64 26 63 2904 88 59 26 68 32 55 2405 86 62 29 69 34 74 33
Young 03 76 45 18 48 2204 65 52 23 49 24 48 2105 55 53 24 49 25 60 26
Attucks MS 06 148 54 26 44 2307 139 53 27 38 21 51 3708 120 59 31 42 24 52 28 47 25
Dowling MS 06 420 59 28 55 2907 406 56 28 46 25 53 3808 454 56 29 46 26 50 27 44 23
Fondren MS 06 234 54 26 45 2307 192 51 26 36 19 49 3508 213 55 29 40 22 58 31 53 27
Key MS 06 151 60 29 57 3007 111 56 28 38 21 53 3808 139 59 31 51 29 59 32 42 22
Ryan MS 06 79 56 27 44 2307 81 57 29 45 24 54 3908 74 60 31 38 21 58 31 48 25
HISD Research and Accountability *Fewer than 5 students tested; ** Total tested represents total tested in reading with STAAR and L B‐21
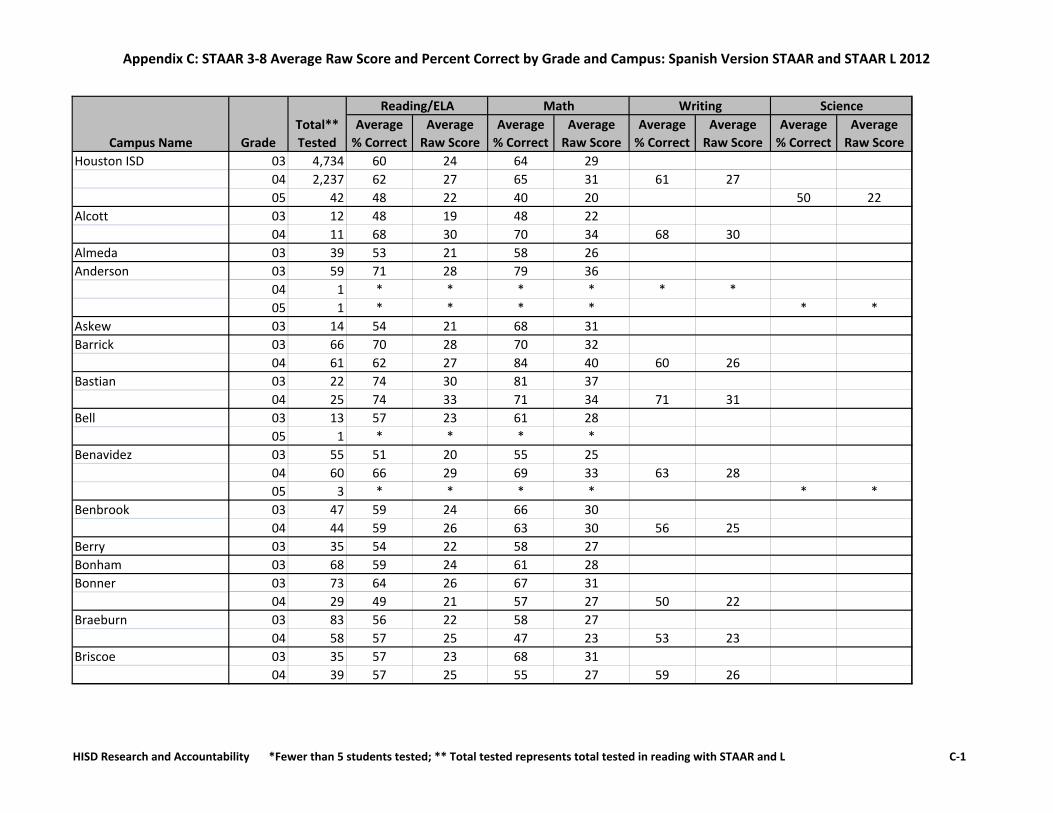
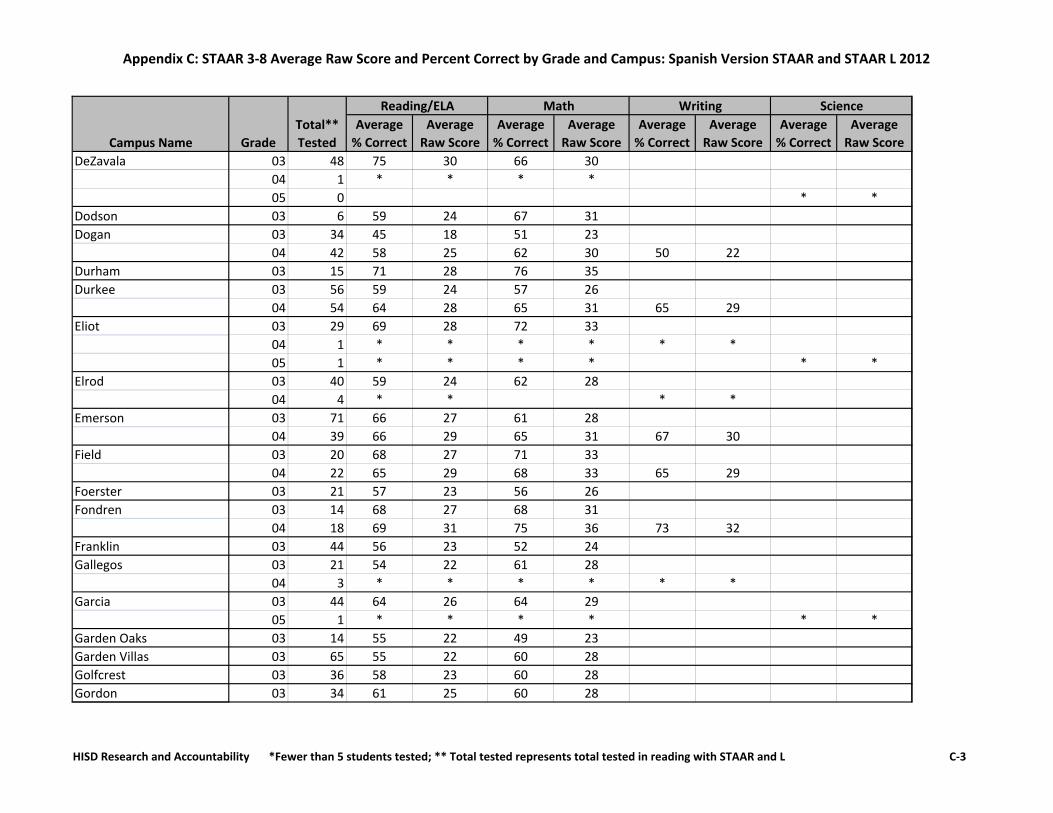
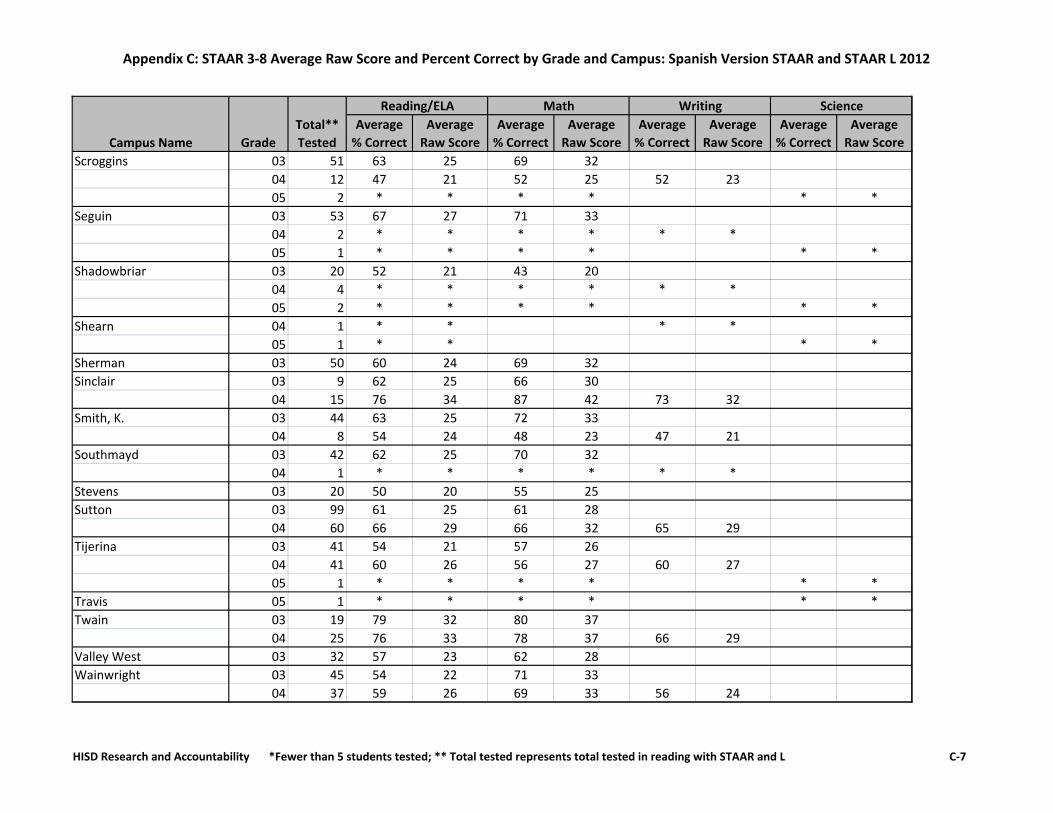
Appendix C: STAAR 3‐8 Average Raw Score and Percent Correct by Grade and Campus: Spanish Version STAAR and STAAR L 2012
Average % Correct
Average Raw Score
Average % Correct
Average Raw Score
Average % Correct
Average Raw Score
Average % Correct
Average Raw Score
Houston ISD 03 4,734 60 24 64 2904 2,237 62 27 65 31 61 2705 42 48 22 40 20 50 22
Alcott 03 12 48 19 48 2204 11 68 30 70 34 68 30
Almeda 03 39 53 21 58 26Anderson 03 59 71 28 79 36
04 1 * * * * * *05 1 * * * * * *
Askew 03 14 54 21 68 31Barrick 03 66 70 28 70 32
04 61 62 27 84 40 60 26Bastian 03 22 74 30 81 37
04 25 74 33 71 34 71 31Bell 03 13 57 23 61 28
05 1 * * * *Benavidez 03 55 51 20 55 25
04 60 66 29 69 33 63 2805 3 * * * * * *
Benbrook 03 47 59 24 66 3004 44 59 26 63 30 56 25
Berry 03 35 54 22 58 27Bonham 03 68 59 24 61 28Bonner 03 73 64 26 67 31
04 29 49 21 57 27 50 22Braeburn 03 83 56 22 58 27
04 58 57 25 47 23 53 23Briscoe 03 35 57 23 68 31
04 39 57 25 55 27 59 26
GradeCampus Name
Reading/ELA Math Writing ScienceTotal** Tested
HISD Research and Accountability *Fewer than 5 students tested; ** Total tested represents total tested in reading with STAAR and L C‐1
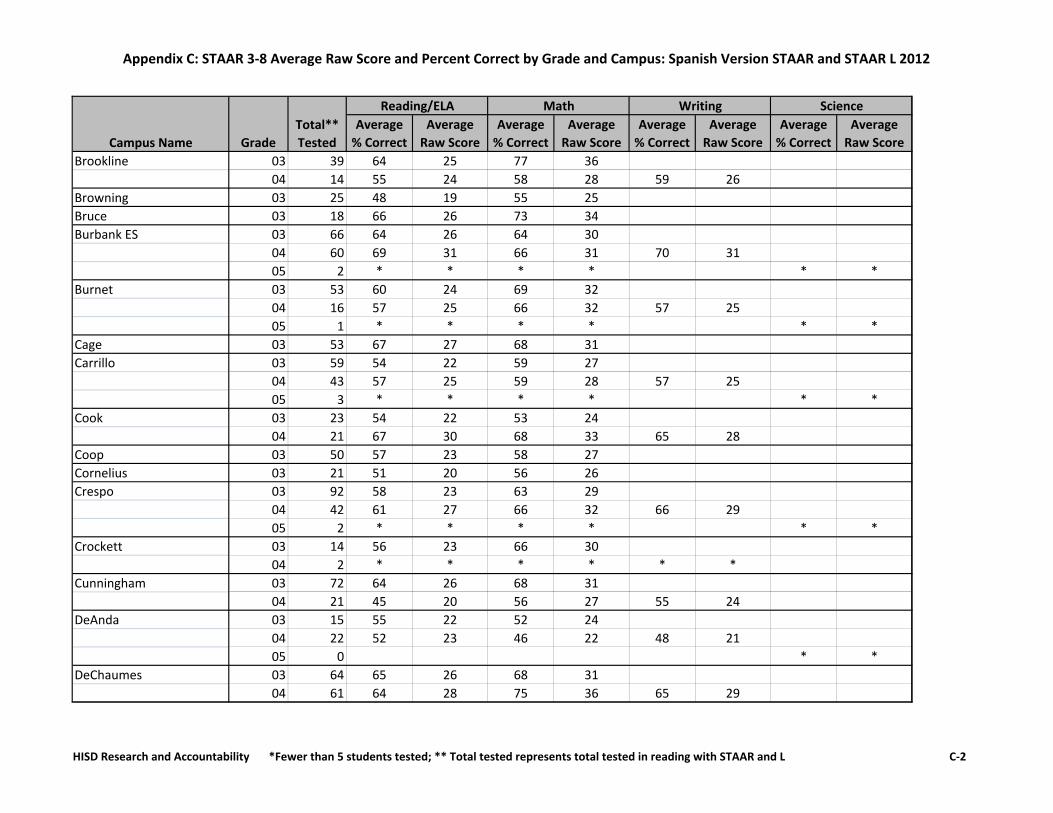
Appendix C: STAAR 3‐8 Average Raw Score and Percent Correct by Grade and Campus: Spanish Version STAAR and STAAR L 2012
Average % Correct
Average Raw Score
Average % Correct
Average Raw Score
Average % Correct
Average Raw Score
Average % Correct
Average Raw ScoreGradeCampus Name
Reading/ELA Math Writing ScienceTotal** Tested
Brookline 03 39 64 25 77 3604 14 55 24 58 28 59 26
Browning 03 25 48 19 55 25Bruce 03 18 66 26 73 34Burbank ES 03 66 64 26 64 30
04 60 69 31 66 31 70 3105 2 * * * * * *
Burnet 03 53 60 24 69 3204 16 57 25 66 32 57 2505 1 * * * * * *
Cage 03 53 67 27 68 31Carrillo 03 59 54 22 59 27
04 43 57 25 59 28 57 2505 3 * * * * * *
Cook 03 23 54 22 53 2404 21 67 30 68 33 65 28
Coop 03 50 57 23 58 27Cornelius 03 21 51 20 56 26Crespo 03 92 58 23 63 29
04 42 61 27 66 32 66 2905 2 * * * * * *
Crockett 03 14 56 23 66 3004 2 * * * * * *
Cunningham 03 72 64 26 68 3104 21 45 20 56 27 55 24
DeAnda 03 15 55 22 52 2404 22 52 23 46 22 48 2105 0 * *
DeChaumes 03 64 65 26 68 3104 61 64 28 75 36 65 29
HISD Research and Accountability *Fewer than 5 students tested; ** Total tested represents total tested in reading with STAAR and L C‐2
Appendix C: STAAR 3‐8 Average Raw Score and Percent Correct by Grade and Campus: Spanish Version STAAR and STAAR L 2012
Average % Correct
Average Raw Score
Average % Correct
Average Raw Score
Average % Correct
Average Raw Score
Average % Correct
Average Raw ScoreGradeCampus Name
Reading/ELA Math Writing ScienceTotal** Tested
DeZavala 03 48 75 30 66 3004 1 * * * *05 0 * *
Dodson 03 6 59 24 67 31Dogan 03 34 45 18 51 23
04 42 58 25 62 30 50 22Durham 03 15 71 28 76 35Durkee 03 56 59 24 57 26
04 54 64 28 65 31 65 29Eliot 03 29 69 28 72 33
04 1 * * * * * *05 1 * * * * * *
Elrod 03 40 59 24 62 2804 4 * * * *
Emerson 03 71 66 27 61 2804 39 66 29 65 31 67 30
Field 03 20 68 27 71 3304 22 65 29 68 33 65 29
Foerster 03 21 57 23 56 26Fondren 03 14 68 27 68 31
04 18 69 31 75 36 73 32Franklin 03 44 56 23 52 24Gallegos 03 21 54 22 61 28
04 3 * * * * * *Garcia 03 44 64 26 64 29
05 1 * * * * * *Garden Oaks 03 14 55 22 49 23Garden Villas 03 65 55 22 60 28Golfcrest 03 36 58 23 60 28Gordon 03 34 61 25 60 28
HISD Research and Accountability *Fewer than 5 students tested; ** Total tested represents total tested in reading with STAAR and L C‐3
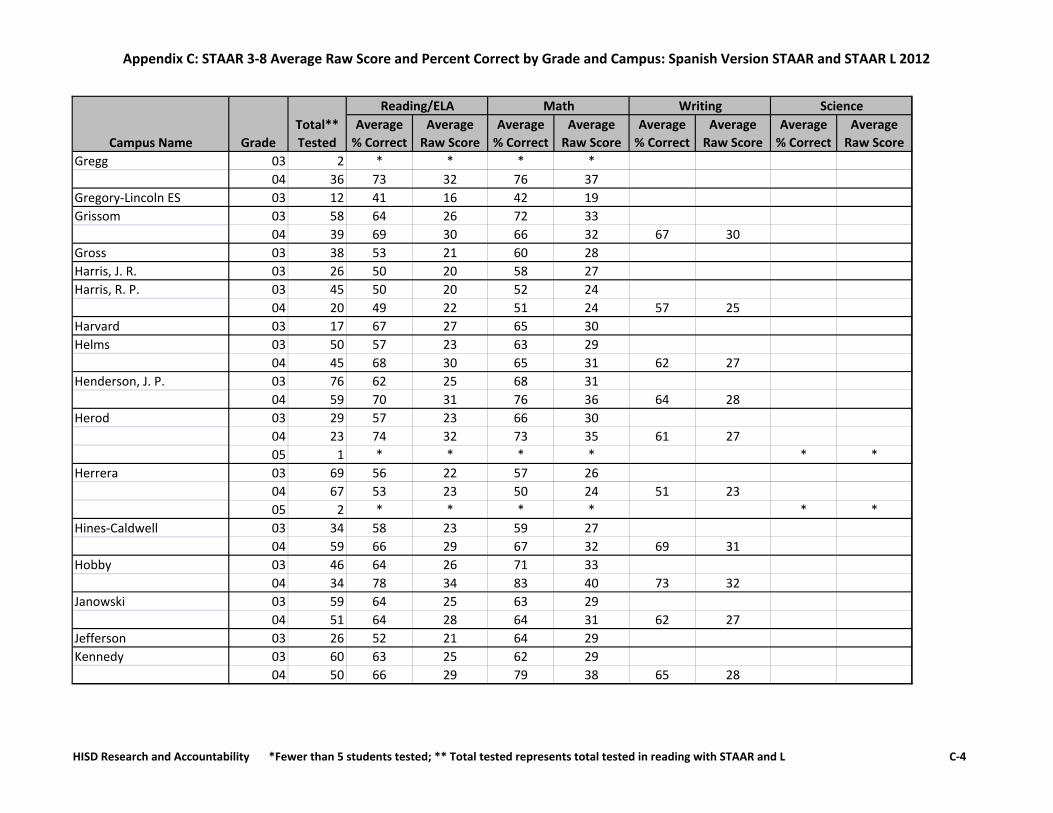
Appendix C: STAAR 3‐8 Average Raw Score and Percent Correct by Grade and Campus: Spanish Version STAAR and STAAR L 2012
Average % Correct
Average Raw Score
Average % Correct
Average Raw Score
Average % Correct
Average Raw Score
Average % Correct
Average Raw ScoreGradeCampus Name
Reading/ELA Math Writing ScienceTotal** Tested
Gregg 03 2 * * * *04 36 73 32 76 37
Gregory‐Lincoln ES 03 12 41 16 42 19Grissom 03 58 64 26 72 33
04 39 69 30 66 32 67 30Gross 03 38 53 21 60 28Harris, J. R. 03 26 50 20 58 27Harris, R. P. 03 45 50 20 52 24
04 20 49 22 51 24 57 25Harvard 03 17 67 27 65 30Helms 03 50 57 23 63 29
04 45 68 30 65 31 62 27Henderson, J. P. 03 76 62 25 68 31
04 59 70 31 76 36 64 28Herod 03 29 57 23 66 30
04 23 74 32 73 35 61 2705 1 * * * * * *
Herrera 03 69 56 22 57 2604 67 53 23 50 24 51 2305 2 * * * * * *
Hines‐Caldwell 03 34 58 23 59 2704 59 66 29 67 32 69 31
Hobby 03 46 64 26 71 3304 34 78 34 83 40 73 32
Janowski 03 59 64 25 63 2904 51 64 28 64 31 62 27
Jefferson 03 26 52 21 64 29Kennedy 03 60 63 25 62 29
04 50 66 29 79 38 65 28
HISD Research and Accountability *Fewer than 5 students tested; ** Total tested represents total tested in reading with STAAR and L C‐4
Appendix C: STAAR 3‐8 Average Raw Score and Percent Correct by Grade and Campus: Spanish Version STAAR and STAAR L 2012
Average % Correct
Average Raw Score
Average % Correct
Average Raw Score
Average % Correct
Average Raw Score
Average % Correct
Average Raw ScoreGradeCampus Name
Reading/ELA Math Writing ScienceTotal** Tested
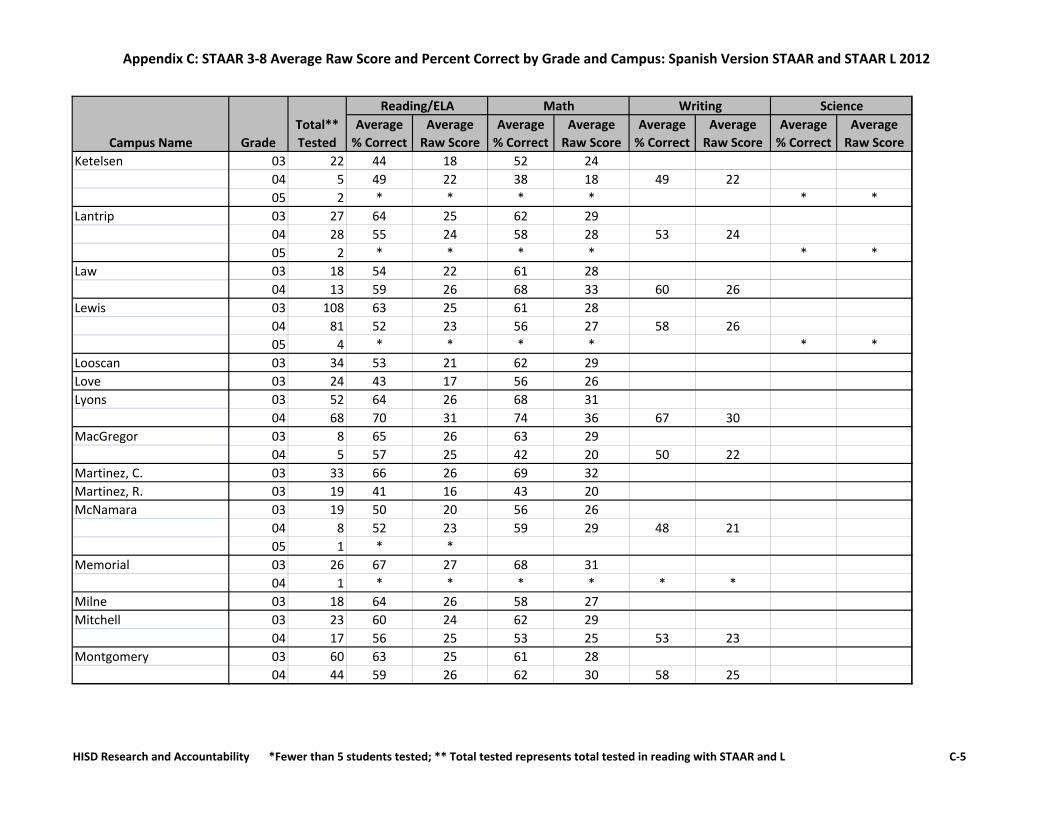
Ketelsen 03 22 44 18 52 2404 5 49 22 38 18 49 2205 2 * * * * * *
Lantrip 03 27 64 25 62 2904 28 55 24 58 28 53 2405 2 * * * * * *
Law 03 18 54 22 61 2804 13 59 26 68 33 60 26
Lewis 03 108 63 25 61 2804 81 52 23 56 27 58 2605 4 * * * * * *
Looscan 03 34 53 21 62 29Love 03 24 43 17 56 26Lyons 03 52 64 26 68 31
04 68 70 31 74 36 67 30MacGregor 03 8 65 26 63 29
04 5 57 25 42 20 50 22Martinez, C. 03 33 66 26 69 32Martinez, R. 03 19 41 16 43 20McNamara 03 19 50 20 56 26
04 8 52 23 59 29 48 2105 1 * *
Memorial 03 26 67 27 68 3104 1 * * * * * *
Milne 03 18 64 26 58 27Mitchell 03 23 60 24 62 29
04 17 56 25 53 25 53 23Montgomery 03 60 63 25 61 28
04 44 59 26 62 30 58 25
HISD Research and Accountability *Fewer than 5 students tested; ** Total tested represents total tested in reading with STAAR and L C‐5
Appendix C: STAAR 3‐8 Average Raw Score and Percent Correct by Grade and Campus: Spanish Version STAAR and STAAR L 2012
Average % Correct
Average Raw Score
Average % Correct
Average Raw Score
Average % Correct
Average Raw Score
Average % Correct
Average Raw ScoreGradeCampus Name
Reading/ELA Math Writing ScienceTotal** Tested
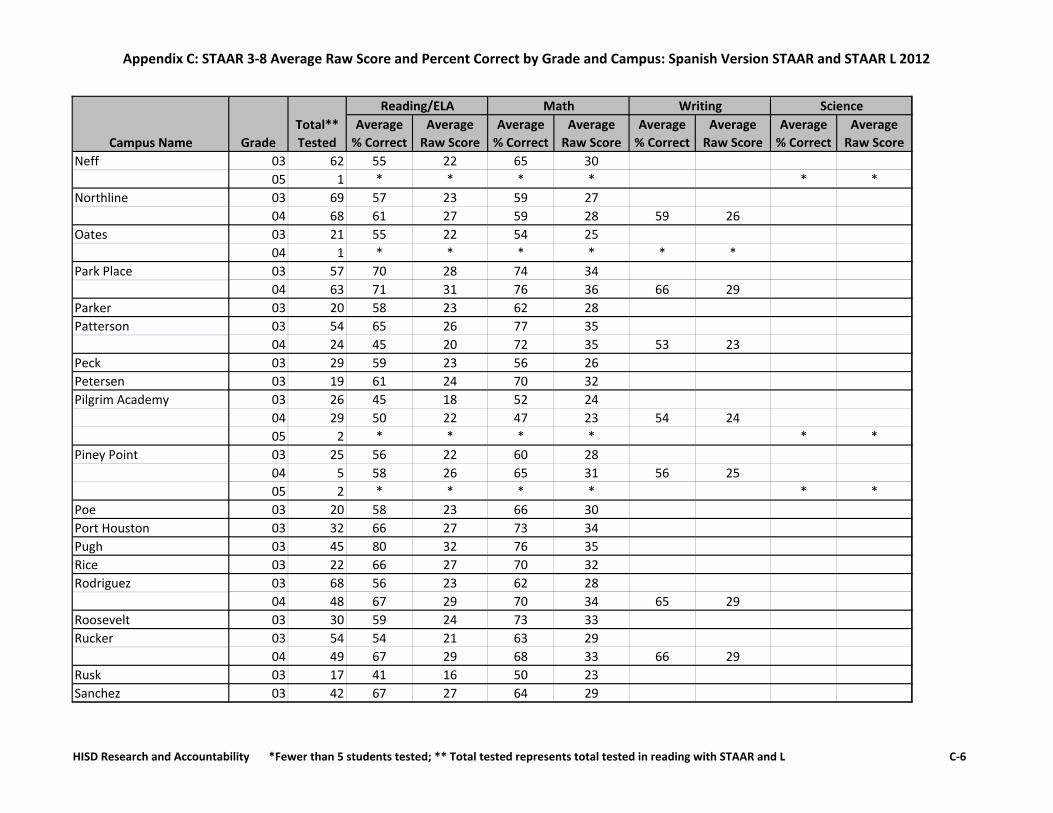
Neff 03 62 55 22 65 3005 1 * * * * * *
Northline 03 69 57 23 59 2704 68 61 27 59 28 59 26
Oates 03 21 55 22 54 2504 1 * * * * * *
Park Place 03 57 70 28 74 3404 63 71 31 76 36 66 29
Parker 03 20 58 23 62 28Patterson 03 54 65 26 77 35
04 24 45 20 72 35 53 23Peck 03 29 59 23 56 26Petersen 03 19 61 24 70 32Pilgrim Academy 03 26 45 18 52 24
04 29 50 22 47 23 54 2405 2 * * * * * *
Piney Point 03 25 56 22 60 2804 5 58 26 65 31 56 2505 2 * * * * * *
Poe 03 20 58 23 66 30Port Houston 03 32 66 27 73 34Pugh 03 45 80 32 76 35Rice 03 22 66 27 70 32Rodriguez 03 68 56 23 62 28
04 48 67 29 70 34 65 29Roosevelt 03 30 59 24 73 33Rucker 03 54 54 21 63 29
04 49 67 29 68 33 66 29Rusk 03 17 41 16 50 23Sanchez 03 42 67 27 64 29
HISD Research and Accountability *Fewer than 5 students tested; ** Total tested represents total tested in reading with STAAR and L C‐6
Appendix C: STAAR 3‐8 Average Raw Score and Percent Correct by Grade and Campus: Spanish Version STAAR and STAAR L 2012
Average % Correct
Average Raw Score
Average % Correct
Average Raw Score
Average % Correct
Average Raw Score
Average % Correct
Average Raw ScoreGradeCampus Name
Reading/ELA Math Writing ScienceTotal** Tested
Scroggins 03 51 63 25 69 3204 12 47 21 52 25 52 2305 2 * * * * * *
Seguin 03 53 67 27 71 3304 2 * * * * * *05 1 * * * * * *
Shadowbriar 03 20 52 21 43 2004 4 * * * * * *05 2 * * * * * *
Shearn 04 1 * * * *05 1 * * * *
Sherman 03 50 60 24 69 32Sinclair 03 9 62 25 66 30
04 15 76 34 87 42 73 32Smith, K. 03 44 63 25 72 33
04 8 54 24 48 23 47 21Southmayd 03 42 62 25 70 32
04 1 * * * * * *Stevens 03 20 50 20 55 25Sutton 03 99 61 25 61 28
04 60 66 29 66 32 65 29Tijerina 03 41 54 21 57 26
04 41 60 26 56 27 60 2705 1 * * * * * *
Travis 05 1 * * * * * *Twain 03 19 79 32 80 37
04 25 76 33 78 37 66 29Valley West 03 32 57 23 62 28Wainwright 03 45 54 22 71 33
04 37 59 26 69 33 56 24
HISD Research and Accountability *Fewer than 5 students tested; ** Total tested represents total tested in reading with STAAR and L C‐7
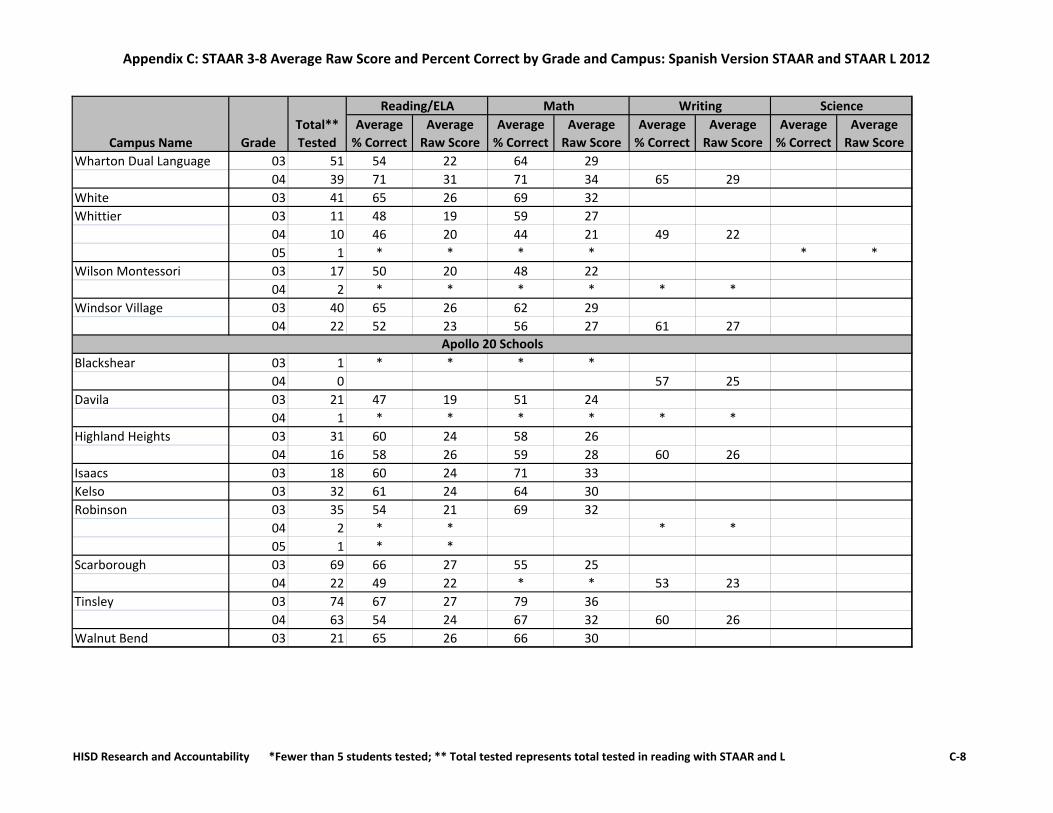
Appendix C: STAAR 3‐8 Average Raw Score and Percent Correct by Grade and Campus: Spanish Version STAAR and STAAR L 2012
Average % Correct
Average Raw Score
Average % Correct
Average Raw Score
Average % Correct
Average Raw Score
Average % Correct
Average Raw ScoreGradeCampus Name
Reading/ELA Math Writing ScienceTotal** Tested
Wharton Dual Language 03 51 54 22 64 2904 39 71 31 71 34 65 29
White 03 41 65 26 69 32Whittier 03 11 48 19 59 27
04 10 46 20 44 21 49 2205 1 * * * * * *
Wilson Montessori 03 17 50 20 48 2204 2 * * * * * *
Windsor Village 03 40 65 26 62 2904 22 52 23 56 27 61 27
Blackshear 03 1 * * * *04 0 57 25
Davila 03 21 47 19 51 2404 1 * * * * * *
Highland Heights 03 31 60 24 58 2604 16 58 26 59 28 60 26
Isaacs 03 18 60 24 71 33Kelso 03 32 61 24 64 30Robinson 03 35 54 21 69 32
04 2 * * * *05 1 * *
Scarborough 03 69 66 27 55 2504 22 49 22 * * 53 23
Tinsley 03 74 67 27 79 3604 63 54 24 67 32 60 26
Walnut Bend 03 21 65 26 66 30
Apollo 20 Schools
HISD Research and Accountability *Fewer than 5 students tested; ** Total tested represents total tested in reading with STAAR and L C‐8