2012 domestic uranium production report - u.s. energy
TRANSCRIPT

2017 Domestic Uranium Production Report
May 2018
Independent Statistics & Analysis
www.eia.gov
U.S. Department of Energy
Washington, DC 20585

This report was prepared by the U.S. Energy Information Administration (EIA), the statistical and analytical agency within the U.S. Department of Energy. By law, EIA’s data, analyses, and forecasts are independent of approval by any other officer or employee of the United States Government. The views in this report therefore should not be construed as representing those of the Department of Energy or other federal agencies.

ii
Contacts This report was prepared by the staff of the Power and Uranium Operations Team, Office of Electricity, Renewables, and Uranium Statistics. If you have questions about the preparation and content of this report, email us at [email protected].
iii
Contents Contacts ........................................................................................................................................................ ii
Introduction ............................................................................................................................................. 6
Drilling ...................................................................................................................................................... 6
Mining, production, shipments, and sales ............................................................................................... 6
Facility status (mills, heap leach plants, and in-situ leach plants) ........................................................... 6
Employment ............................................................................................................................................. 7
Expenditures ............................................................................................................................................ 7
Reserve estimates .................................................................................................................................... 7

iv
Tables Table 1. U.S. uranium drilling activities, 2003–17 ................................................................................................ 8 Table 2. U.S. uranium mine production and number of mines and sources, 2003–17 ...................................... 10 Table 3. U.S. uranium concentrate production, shipments, and sales, 2003–17 ............................................... 10 Table 4. U.S. uranium mills and heap leach facilities by owner, location, capacity, and operating status at end of the year, 2012–17 ........................................................................................................................................... 11 Table 5. U.S. uranium in-situ leach plants by owner, location, capacity, and operating status at end of the year, 2012–17 .................................................................................................................................................... 12 Table 6. Employment in the U.S. uranium production industry by category, 2003–17 ..................................... 13 Table 7. Employment in the U.S. uranium production industry by state, 2003–17 ........................................... 14 Table 8. U.S. uranium expenditures, 2003–17 .................................................................................................... 14 Table 9. Summary production statistics of the U.S. uranium industry, 1993–2017 ........................................... 16 Table 10. Uranium reserve estimates at the end of 2016 and 2017 .................................................................. 19
v
Figures Figure 1. U.S. uranium drilling by number of holes, 2005–17 .............................................................................. 8 Figure 2. U.S. uranium drilling, 2005–17............................................................................................................... 9 Figure 3. Employment in the U.S. uranium production industry by category, 2005–17 .................................... 13 Figure 4. U.S. uranium expenditures, 2005–17 .................................................................................................. 15 Figure 5. U.S. mine production of uranium, 1993–2017 .................................................................................... 17 Figure 6. U.S. uranium concentrate production and shipments, 1993–2017 .................................................... 17 Figure 7. Employment in the U.S. uranium production industry, 1993–2017 .................................................... 18

6
Introduction The U.S. Energy Information Administration (EIA) provides detailed data on U.S. uranium production activities from 2003 through 2017 and summary data back to 1993 in this report.
Data in this report are based primarily on information reported on Form EIA-851A, Domestic Uranium Production Report (Annual), and some information reported on Form EIA-858, Uranium Marketing Annual Survey. The Form EIA-851A survey collects data on uranium milling and in-situ leach processing, feed sources, mining, employment, drilling, expenditures, and reserve estimates. The Form EIA-858 survey includes data collected on uranium contracts and deliveries.
Previous editions of this report are available on our website.
Definitions for terms in this report are available in EIA’s Energy Glossary. Drilling
Total uranium drilling was 420 holes with total footage of 0.2 million feet, which is 64% fewer holes than in 2016. Expenditures for uranium drilling in the United States were $4 million in 2017, an 82% decrease compared with 2016.
Mining, production, shipments, and sales
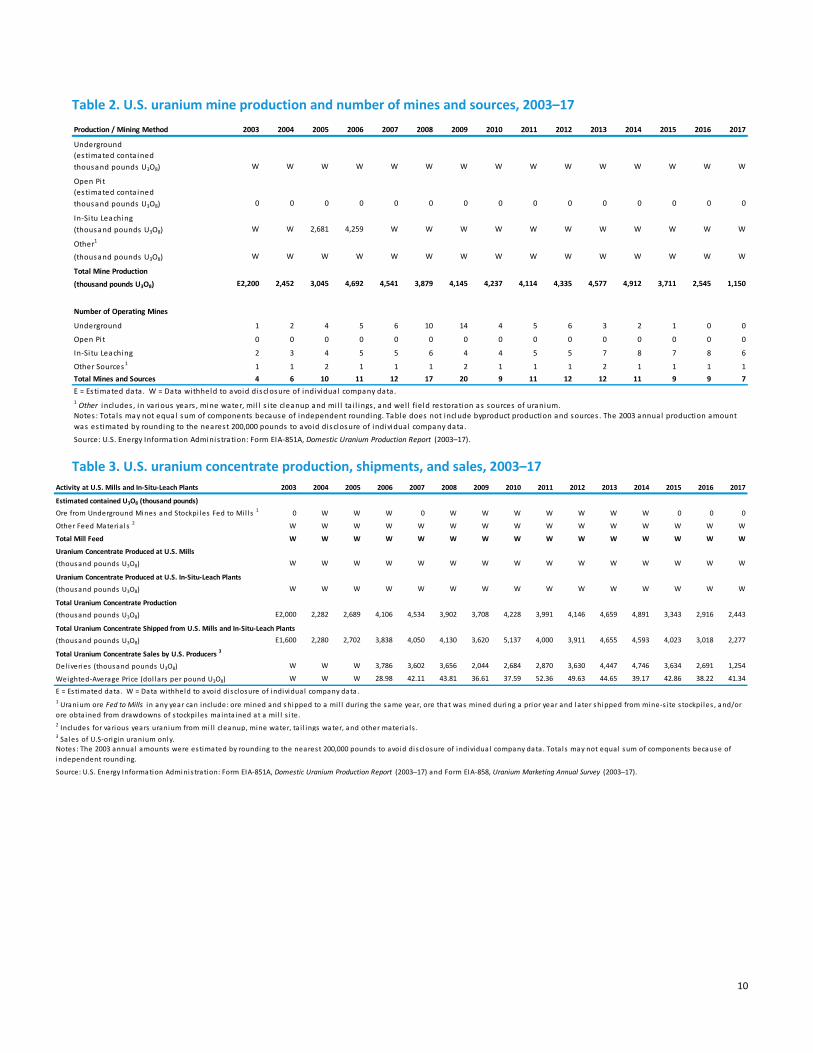
U.S. uranium mines produced 1.2 million pounds of triuranium octoxide (U3O8), or uranium concentrate1, in 2017, 55% less than in 2016. The production of uranium concentrate is the first step in the nuclear fuel production process, preceding the conversion of U3O8 into UF6, to enable uranium enrichment, then fuel pellet fabrication, and finally fuel assembly fabrication. Six in-situ leach (ISL) mining operations produced solutions containing uranium in 2017, two fewer than in 2016.
Total production of U.S. uranium concentrate in 2017 was 2.4 million pounds U3O8, 16% less than in 2016, from seven facilities: one mill in Utah (White Mesa Mill) and six in-situ leaching (ISL) plants in Nebraska and Wyoming (Crow Butte Operation, Lost Creek Project, Nichols Ranch ISR Project, Ross CPP, Smith Ranch-Highland Operation and Willow Creek Project).
Total shipments of uranium concentrate from U.S. mill and ISL plants were 2.3 million pounds U3O8 in 2017, 25% less than in 2016. U.S. producers sold 1.3 million pounds U3O8 of uranium concentrate in 2017 at a weighted average price of $41.34 per pound U3O8.
Facility status (mills, heap leach plants, and in-situ leach plants)
At the end of 2017, the White Mesa Mill in Utah was operating with a capacity of 2,000 short tons of material per day. Shootaring Canyon Uranium Mill in Utah and Sweetwater Uranium Project in Wyoming were on standby with a total capacity of 3,750 short tons of material per day. One mill is planned for Colorado (Pinon Ridge Mill), and one heap leach plant is planned for Wyoming (Sheep Mountain).
1A yellow or brown powder obtained by the milling of uranium ore, processing of in-situ leach mining solutions, or as a byproduct of
phosphoric acid production.

7
At the end of 2017, six U.S. uranium ISL plants were operating with a combined capacity of 12.2 million pounds U3O8 per year (Crow Butte Operation in Nebraska and Lost Creek Project, Nichols Ranch ISR Project, Ross CPP, Smith Ranch-Highland Operation, and Willow Creek Project in Wyoming). Four ISL plants were on standby as of the end of 2017, and six ISL plants were planned for three states: New Mexico, South Dakota, and Wyoming.
Employment
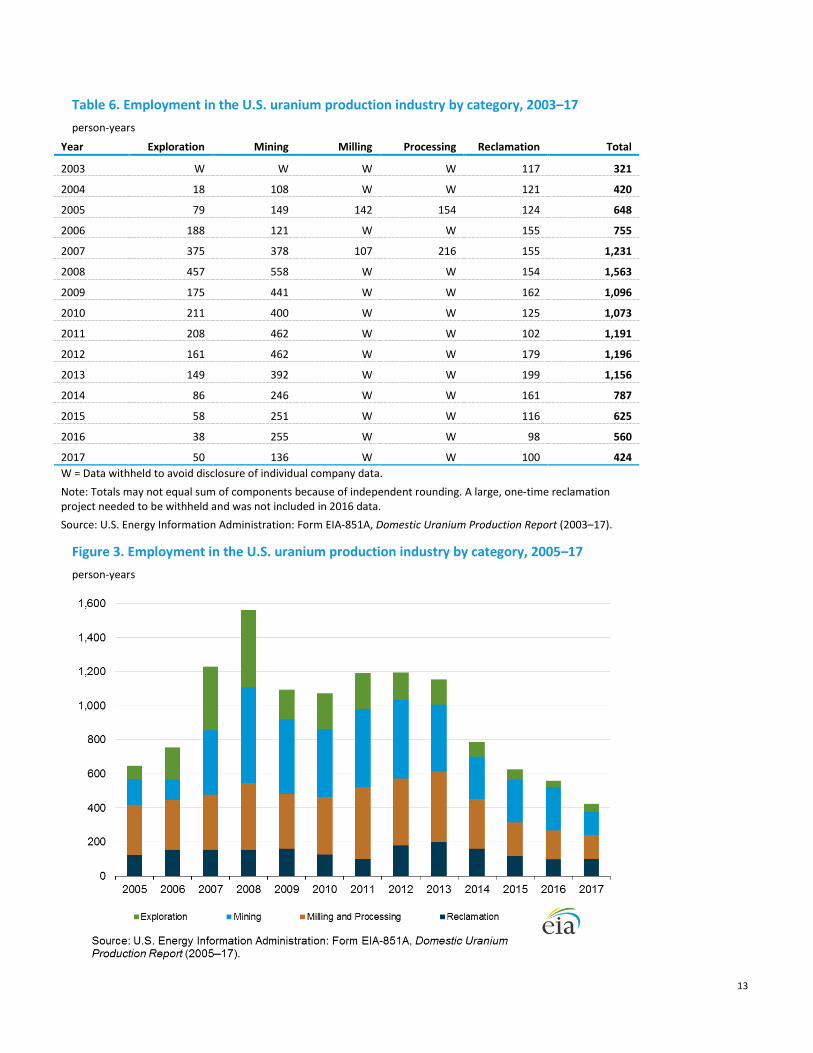
Total employment in the U.S. uranium production industry was 424 full-time person-years in 2017, a decrease of 24% from the 2016 total and the lowest level since 2004. Exploration employment was 50 person-years, a 32% increase from the 2016 total. Mining employment was 136 person-years, a 47% decrease from 2016. Reclamation employment increased 2% to 100 person-years from 2016 to 2017. Uranium production industry employment for 2016 was in 8 States: Alaska, Colorado, Nebraska, New Mexico, Texas, Utah, Washington, and Wyoming. Wyoming accounted for 58% of total employment in the U.S. uranium production industry in 2017.
Expenditures Total expenditures for land, exploration, drilling, production, and reclamation were $123 million in 2017, 28% less than in 2016 and the lowest total since 2004. Expenditures for U.S. uranium production, including facility expenses, were the largest category of expenditures at $78 million in 2017, down 20% from the 2016 level and the lowest total since 2006. Uranium exploration expenditures were $3.7 million in 2017, up 48% from 2016 but the second-lowest total since at least 2006. Expenditures for land were $9 million in 2017, a 10% decrease compared with 2016. Reclamation expenditures were $28 million, a 26% decrease compared with 2016 and the lowest total since at least 2006.
Reserve estimates
At the end of 2017, reported estimated uranium reserves were 45 million pounds U3O8 at a maximum forward cost of up to $30 per pound. At up to $50 per pound, reported estimated reserves were 182 million pounds U3O8. At up to $100 per pound, reported estimated reserves were 362 million pounds U3O8. These estimates are a fraction of likely total domestic uranium reserves. Inferred resources that were not reported because of a lack of cost estimates or the reserves not being located on actively managed properties are not included in these totals.
The uranium reserve estimates presented here cannot be compared with the much larger historical data set of uranium reserves published in the July 2010 report U.S. Uranium Reserves Estimates. Those reserve estimates were made by EIA based on data collected by EIA and data developed by the National Uranium Resource Evaluation (NURE) program, operated out of Grand Junction, Colorado, by DOE and predecessor organizations. The EIA data covered approximately 200 uranium properties with reserve estimates, collected from 1984 through 2002. The NURE data covered approximately 800 uranium properties with reserve estimates, developed from 1974 through 1983. Although the data collected on the Form EIA-851A survey covers a much smaller set of properties than the earlier EIA data and NURE data, EIA believes that within its scope the EIA-851A data provides more reliable estimates of the uranium recoverable at the specified forward cost than estimates derived from 1974 through 2002. The NURE data have not been comprehensively updated in many years and are no longer considered a current data source.

8
Table 1. U.S. uranium drilling activities, 2003–17
Year
Exploration Drilling Development Drilling Exploration and
Development Drilling
Number of Holes
Feet (thousand)
Number of Holes
Feet (thousand)
Number of Holes
Feet (thousand)
2003 NA NA NA NA W W
2004 W W W W 2,185 1,249
2005 W W W W 3,143 1,668
2006 1,473 821 3,430 1,892 4,903 2,713
2007 4,351 2,200 4,996 2,946 9,347 5,146
2008 5,198 2,543 4,157 2,551 9,355 5,093
2009 1,790 1,051 3,889 2,691 5,679 3,742
2010 2,439 1,460 4,770 3,444 7,209 4,904
2011 5,441 3,322 5,156 3,003 10,597 6,325
2012 5,112 3,447 5,970 3,709 11,082 7,156
2013 1,231 919 4,013 2,926 5,244 3,845
2014 W W W W 1,752 1,299
2015 W W W W 1,518 878
2016 W W W W 1,158 757
2017 W W W W 420 196 NA = Not available. W = Data withheld to avoid disclosure of individual company data. Note: Totals may not equal sum of components because of independent rounding. Source: U.S. Energy Information Administration: Form EIA-851A, Domestic Uranium Production Report (2003–17).
Figure 1. U.S. uranium drilling by number of holes, 2005–17 number of holes

9
Figure 2. U.S. uranium drilling, 2005–17
thousand feet
10
Table 2. U.S. uranium mine production and number of mines and sources, 2003–17
Table 3. U.S. uranium concentrate production, shipments, and sales, 2003–17
Production / Mining Method 2003 2004 2005 2006 2007 2008 2009 2010 2011 2012 2013 2014 2015 2016 2017
(estimated conta ined thousand pounds U3O8) W W W W W W W W W W W W W W W
(estimated conta ined thousand pounds U3O8) 0 0 0 0 0 0 0 0 0 0 0 0 0 0 0
(thousand pounds U3O8) W W 2,681 4,259 W W W W W W W W W W W
(thousand pounds U3O8) W W W W W W W W W W W W W W W
(thousand pounds U3O8) E2,200 2,452 3,045 4,692 4,541 3,879 4,145 4,237 4,114 4,335 4,577 4,912 3,711 2,545 1,150
Underground 1 2 4 5 6 10 14 4 5 6 3 2 1 0 0
Open Pi t 0 0 0 0 0 0 0 0 0 0 0 0 0 0 0
In-Si tu Leaching 2 3 4 5 5 6 4 4 5 5 7 8 7 8 6
Other Sources 1 1 1 2 1 1 1 2 1 1 1 2 1 1 1 1Total Mines and Sources 4 6 10 11 12 17 20 9 11 12 12 11 9 9 7
Number of Operating Mines
Source: U.S. Energy Information Adminis tration: Form EIA-851A, Domestic Uranium Production Report (2003–17).
Total Mine Production
E = Estimated data . W = Data withheld to avoid disclosure of individual company data .
Notes : Tota ls may not equal sum of components because of independent rounding. Table does not include byproduct production and sources . The 2003 annual production amount was estimated by rounding to the nearest 200,000 pounds to avoid disclosure of individual company data .
1 Other includes , in various years , mine water, mi l l s i te cleanup and mi l l ta i l ings , and wel l field restoration as sources of uranium.
Other1
Underground
Open Pi t
In-Si tu Leaching
Activity at U.S. Mills and In-Situ-Leach Plants 2003 2004 2005 2006 2007 2008 2009 2010 2011 2012 2013 2014 2015 2016 2017
Ore from Underground Mines and Stockpi les Fed to Mi l l s 1 0 W W W 0 W W W W W W W 0 0 0
Other Feed Materia ls 2 W W W W W W W W W W W W W W W
Total Mill Feed W W W W W W W W W W W W W W W
(thousand pounds U3O8) W W W W W W W W W W W W W W W
(thousand pounds U3O8) W W W W W W W W W W W W W W W
(thousand pounds U3O8) E2,000 2,282 2,689 4,106 4,534 3,902 3,708 4,228 3,991 4,146 4,659 4,891 3,343 2,916 2,443
(thousand pounds U3O8) E1,600 2,280 2,702 3,838 4,050 4,130 3,620 5,137 4,000 3,911 4,655 4,593 4,023 3,018 2,277
Del iveries (thousand pounds U3O8) W W W 3,786 3,602 3,656 2,044 2,684 2,870 3,630 4,447 4,746 3,634 2,691 1,254
Weighted-Average Price (dol lars per pound U3O8) W W W 28.98 42.11 43.81 36.61 37.59 52.36 49.63 44.65 39.17 42.86 38.22 41.34
Notes : The 2003 annual amounts were estimated by rounding to the nearest 200,000 pounds to avoid disclosure of individual company data . Tota ls may not equal sum of components because of independent rounding.
Source: U.S. Energy Information Adminis tration: Form EIA-851A, Domestic Uranium Production Report (2003–17) and Form EIA-858, Uranium Marketing Annual Survey (2003–17).
Total Uranium Concentrate Sales by U.S. Producers 3
E = Estimated data . W = Data withheld to avoid disclosure of individual company data .1 Uranium ore Fed to Mills in any year can include: ore mined and shipped to a mi l l during the same year, ore that was mined during a prior year and later shipped from mine-s i te s tockpi les , and/or ore obta ined from drawdowns of s tockpi les mainta ined at a mi l l s i te.2 Includes for various years uranium from mi l l cleanup, mine water, ta i l ings water, and other materia ls .3 Sa les of U.S-origin uranium only.
Total Uranium Concentrate Shipped from U.S. Mills and In-Situ-Leach Plants
Estimated contained U3O8 (thousand pounds)
Uranium Concentrate Produced at U.S. Mills
Uranium Concentrate Produced at U.S. In-Situ-Leach Plants
Total Uranium Concentrate Production

11
Table 4. U.S. uranium mills and heap leach facilities by owner, location, capacity, and operating status at end of the year, 2012–17
Capacity(short tons of
ore per day) 2012 2013 2014 2015 2016 2017
Anfield Resources
Shootaring Canyon Uranium Mi l l Garfield, Utah 750 Standby Standby Standby Standby Standby Standby
EFR White Mesa LLC White Mesa Mi l l San Juan, Utah 2,000 Operating
Operating-Process ing
Al ternate Feed
Operating-Process ing
Al ternate Feed
Operating-Process ing
Al ternate Feed
Operating-Process ing
Al ternate Feed
Operating-Process ing
Al ternate Feed
Energy Fuels Wyoming Inc Sheep Mounta in
Fremont, Wyoming 725 - Undeveloped Undeveloped Undeveloped Undeveloped Undeveloped
Kennecott Uranium Company/Wyoming Coal Resource Company
Sweetwater Uranium Project
Sweetwater, Wyoming 3,000 Standby Standby Standby Standby Standby Standby
Pinon Ridge Resources Corporation Pinon Ridge Mi l l
Montrose, Colorado 500
Partia l ly Permitted And
LicensedPermitted And
LicensedPermitted And
LicensedPermitted And
LicensedPermitted And
LicensedPermitted And
Licensed
Total Capacity: 6,975
Notes : Capaci ty for 2017. An operating s tatus of Operating indicates the mi l l usual ly was producing uranium concentrate at the end of the period.
Source: U.S. Energy Information Adminis tration: Form EIA-851A, Domestic Uranium Production Report (2012–17).
- = No data reported.1 Heap leach solutions : The separation, or dissolving-out from mined rock, of the soluble uranium consti tuents by the natura l action of percolating a prepared chemica l solution through mounded (heaped) rock materia l . The mounded materia l usual ly conta ins low grade minera l i zed materia l and/or waste rock produced from open pi t or underground mines . The solutions are col lected after percolation i s completed and processed to recover the va lued components .
Owner
Mill and Heap
Leach1 Facility Name
County, State (existing and planned locations)
Operating Status at End of the Year

12
Table 5. U.S. uranium in-situ leach plants by owner, location, capacity, and operating status at end of the year, 2012–17
2012 2013 2014 2015 2016 2017
AUC LLC Reno Creek Campbell, Wyoming 2,000,000 - Developing Developing
Partially Permitted and
Licensed
Partially Permitted and
Licensed
Partially Permitted and
Licensed
Azarga Uranium Corp Dewey Burdock Project
Fall River and Custer, South Dakota 1,000,000 Developing Developing
Partially Permitted And
Licensed
Partially Permitted And
Licensed
Partially Permitted And
Licensed
Partially Permitted And
Licensed
Cameco Crow Butte Operation Dawes, Nebraska 1,000,000 Operating Operating Operating Operating Operating Operating
Hydro Resources, Inc. Church RockMcKinley, New Mexico 1,000,000
Partially Permitted And
Licensed
Partially Permitted And
Licensed
Partially Permitted And
Licensed
Partially Permitted And
Licensed
Partially Permitted And
Licensed
Partially Permitted And
Licensed
Hydro Resources, Inc. CrownpointMcKinley, New Mexico 1,000,000
Partially Permitted And
Licensed
Partially Permitted And
Licensed
Partially Permitted And
Licensed
Partially Permitted And
Licensed
Partially Permitted And
Licensed
Partially Permitted And
Licensed
Lost Creek ISR LLC Lost Creek ProjectSweetwater, Wyoming 2,000,000
Under Construction Operating Operating Operating Operating Operating
Mestena Uranium LLC Alta Mesa Project Brooks, Texas 1,500,000 Producing Producing Producing Standby Standby Standby
Power Resources Inc., dba Cameco Resources
Smith Ranch-Highland Operation Converse, Wyoming 5,500,000 Operating Operating Operating Operating Operating Operating
South Texas Mining Venture Hobson ISR Plant Karnes, Texas 1,000,000 Operating Operating Operating Operating Standby Standby
South Texas Mining Venture La Palangana Duval, Texas 1,000,000 Operating Operating Operating Operating Standby Standby
Strata Energy Inc Ross CPP Crook, Wyoming 375,000
Partially Permitted And
Licensed
Partially Permitted And
LicensedUnder
Construction
Changing License to
Operational Operating Operating
URI, Inc. Kingsville Dome Kleberg, Texas 1,000,000 Standby Restoration Restoration Restoration Restoration Restoration
URI, Inc. Rosita Duval, Texas 1,000,000 Standby Restoration Restoration Reclamation Reclamation Reclamation
URI, Inc. Vasquez Duval, Texas 800,000 Restoration Restoration Restoration Restoration Restoration Restoration
Uranerz Energy Corporation
Nichols Ranch ISR Project
Johnson and Campbell, Wyoming 2,000,000
Under Construction
Under Construction Producing Operating Operating Operating
Uranium Energy Corp.Goliad ISR Uranium Project Goliad, Texas 1,000,000
Permitted And Licensed
Permitted And Licensed
Permitted And Licensed
Permitted And Licensed Standby Standby
Uranium One Americas, Inc. Jab and Antelope
Sweetwater, Wyoming 2,000,000 Developing Developing Developing Developing Developing Developing
Uranium One Americas, Inc. Moore Ranch Campbell, Wyoming 500,000
Permitted And Licensed
Permitted And Licensed
Permitted And Licensed
Permitted And Licensed
Permitted And Licensed
Permitted And Licensed
Uranium One USA, Inc.
Willow Creek Project (Christensen Ranch and Irigaray)
Campbell and Johnson, Wyoming 1,300,000 Producing Producing Operating Operating Operating Operating
Total Production Capacity: 26,975,000- = No data reported.Notes: Production capacity for 2017. An operating status of Operating indicates the in-situ-leach plant usually was producing uranium concentrate at the end of the period. Hobson ISR Plant processes uranium concentrate that came from La Palangana. Hobson and La Palangana are part of the same project. ISR stands for in-situ recovery. Christensen Ranch and Irigaray are part of the Willow Creek Project. Uranerz Energy has a tolling arrangement with Cameco Resources. Uranium is first processed at the Nichols Ranch plant and then transported to the Smith Ranch-Highland Operation plant for final processing into Uranerz’s uranium concentrate. CPP stands for central processing plant.Source: U.S. Energy Information Administration: Form EIA-851A, Domestic Uranium Production Report (2012–17).
Table 5. U.S. uranium in-situ leach plants by owner, location, capacity, and operating status at end of the year, 2012–17
In-Situ Leach Plant OwnerIn-Situ-Leach Plant Name
County, State (existing and planned locations)
Production Capacity
(pounds U3O8
per year)
Operating Status at End of the Year
13
Table 6. Employment in the U.S. uranium production industry by category, 2003–17 person-years
Year Exploration Mining Milling Processing Reclamation Total
2003 W W W W 117 321
2004 18 108 W W 121 420
2005 79 149 142 154 124 648
2006 188 121 W W 155 755
2007 375 378 107 216 155 1,231
2008 457 558 W W 154 1,563
2009 175 441 W W 162 1,096
2010 211 400 W W 125 1,073
2011 208 462 W W 102 1,191
2012 161 462 W W 179 1,196
2013 149 392 W W 199 1,156
2014 86 246 W W 161 787
2015 58 251 W W 116 625
2016 38 255 W W 98 560
2017 50 136 W W 100 424 W = Data withheld to avoid disclosure of individual company data. Note: Totals may not equal sum of components because of independent rounding. A large, one-time reclamation project needed to be withheld and was not included in 2016 data. Source: U.S. Energy Information Administration: Form EIA-851A, Domestic Uranium Production Report (2003–17).
Figure 3. Employment in the U.S. uranium production industry by category, 2005–17 person-years
14
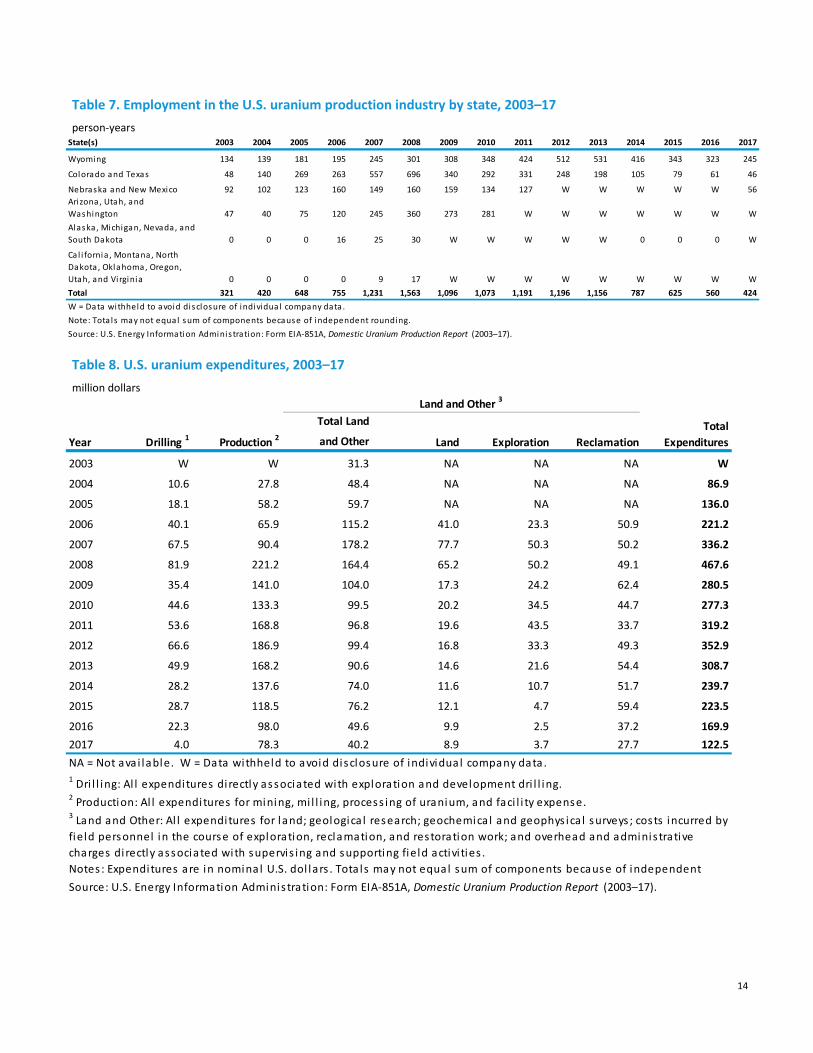
Table 7. Employment in the U.S. uranium production industry by state, 2003–17 person-years
Table 8. U.S. uranium expenditures, 2003–17 million dollars
State(s) 2003 2004 2005 2006 2007 2008 2009 2010 2011 2012 2013 2014 2015 2016 2017
Wyoming 134 139 181 195 245 301 308 348 424 512 531 416 343 323 245
Colorado and Texas 48 140 269 263 557 696 340 292 331 248 198 105 79 61 46
Nebraska and New Mexico 92 102 123 160 149 160 159 134 127 W W W W W 56Arizona, Utah, and Washington 47 40 75 120 245 360 273 281 W W W W W W WAlaska, Michigan, Nevada, and South Dakota 0 0 0 16 25 30 W W W W W 0 0 0 W
Cal i fornia , Montana, North Dakota, Oklahoma, Oregon, Utah, and Virginia 0 0 0 0 9 17 W W W W W W W W WTotal 321 420 648 755 1,231 1,563 1,096 1,073 1,191 1,196 1,156 787 625 560 424
Source: U.S. Energy Information Adminis tration: Form EIA-851A, Domestic Uranium Production Report (2003–17).
W = Data withheld to avoid disclosure of individual company data .Note: Tota ls may not equal sum of components because of independent rounding.
Total Land
and Other
2003 W W 31.3 NA NA NA W
2004 10.6 27.8 48.4 NA NA NA 86.9
2005 18.1 58.2 59.7 NA NA NA 136.0
2006 40.1 65.9 115.2 41.0 23.3 50.9 221.2
2007 67.5 90.4 178.2 77.7 50.3 50.2 336.2
2008 81.9 221.2 164.4 65.2 50.2 49.1 467.6
2009 35.4 141.0 104.0 17.3 24.2 62.4 280.5
2010 44.6 133.3 99.5 20.2 34.5 44.7 277.3
2011 53.6 168.8 96.8 19.6 43.5 33.7 319.2
2012 66.6 186.9 99.4 16.8 33.3 49.3 352.9
2013 49.9 168.2 90.6 14.6 21.6 54.4 308.7
2014 28.2 137.6 74.0 11.6 10.7 51.7 239.7
2015 28.7 118.5 76.2 12.1 4.7 59.4 223.5
2016 22.3 98.0 49.6 9.9 2.5 37.2 169.92017 4.0 78.3 40.2 8.9 3.7 27.7 122.5
Year Drilling 1 Production 2
Land and Other 3
Total ExpendituresLand Exploration
Notes : Expenditures are in nominal U.S. dol lars . Tota ls may not equal sum of components because of independent Source: U.S. Energy Information Adminis tration: Form EIA-851A, Domestic Uranium Production Report (2003–17).
Reclamation
NA = Not ava i lable. W = Data withheld to avoid disclosure of individual company data .1 Dri l l ing: Al l expenditures di rectly associated with exploration and development dri l l ing.2 Production: Al l expenditures for mining, mi l l ing, process ing of uranium, and faci l i ty expense.3 Land and Other: Al l expenditures for land; geologica l research; geochemica l and geophys ica l surveys ; costs incurred by field personnel in the course of exploration, reclamation, and restoration work; and overhead and adminis trative charges di rectly associated with supervis ing and supporting field activi ties .

15
Figure 4. U.S. uranium expenditures, 2005–17 million dollars

16
Table 9. Summary production statistics of the U.S. uranium industry, 1993–2017
Exploration and Development
Surface
Exploration and Development
DrillingMine Production of
Uranium Uranium Concentrate
Production Uranium Concentrate
Shipments Employment
YearDrilling
(mi l l ion feet)
Expenditures 1
(mi l l ion dol lars )
(mi l l ion pounds U3O8)
(mi l l ion pounds U3O8)
(mi l l ion pounds U3O8) (person-years )
1993 1.1 5.7 2.1 3.1 3.4 871
1994 0.7 1.1 2.5 3.4 6.3 980
1995 1.3 2.6 3.5 6.0 5.5 1,107
1996 3.0 7.2 4.7 6.3 6.0 1,118
1997 4.9 20.0 4.7 5.6 5.8 1,097
1998 4.6 18.1 4.8 4.7 4.9 1,120
1999 2.5 7.9 4.5 4.6 5.5 848
2000 1.0 5.6 3.1 4.0 3.2 627
2001 0.7 2.7 2.6 2.6 2.2 423
2002 W W 2.4 2.3 3.8 426
E2003 W W 2.2 2.0 1.6 321
2004 1.2 10.6 2.5 2.3 2.3 420
2005 1.7 18.1 3.0 2.7 2.7 648
2006 2.7 40.1 4.7 4.1 3.8 755
2007 5.1 67.5 4.5 4.5 4.0 1,231
2008 5.1 81.9 3.9 3.9 4.1 1,563
2009 3.7 35.4 4.1 3.7 3.6 1,096
2010 4.9 44.6 4.2 4.2 5.1 1,073
2011 6.3 53.6 4.1 4.0 4.0 1,191
2012 7.2 66.6 4.3 4.1 3.9 1,196
2013 3.8 49.9 4.6 4.7 4.7 1,156
2014 1.3 28.2 4.9 4.9 4.6 787
2015 0.9 28.7 3.7 3.3 4.0 625
2016 0.8 22.3 2.5 2.9 3.0 560 2017 0.2 4.0 1.2 2.4 2.3 424 E = Estimated data , except for employment. W = Data withheld to avoid disclosure of individual company data .1 Expenditures are in nominal U.S. dol lars .Note: The 2003 annual production and shipment amounts were estimated by rounding to the nearest 200,000 pounds to avoid disclosure of individual company data . A large, one-time reclamation project needed to be withheld and was not included in 2016 data .
Source: U.S. Energy Information Adminis tration: 1993–2002 data taken from Uranium Industry Annual 2002 (May 2003), Table H1 and Table 2. 2003-2017 data from Form EIA-851A, Domestic Uranium Production Report (2003–17).
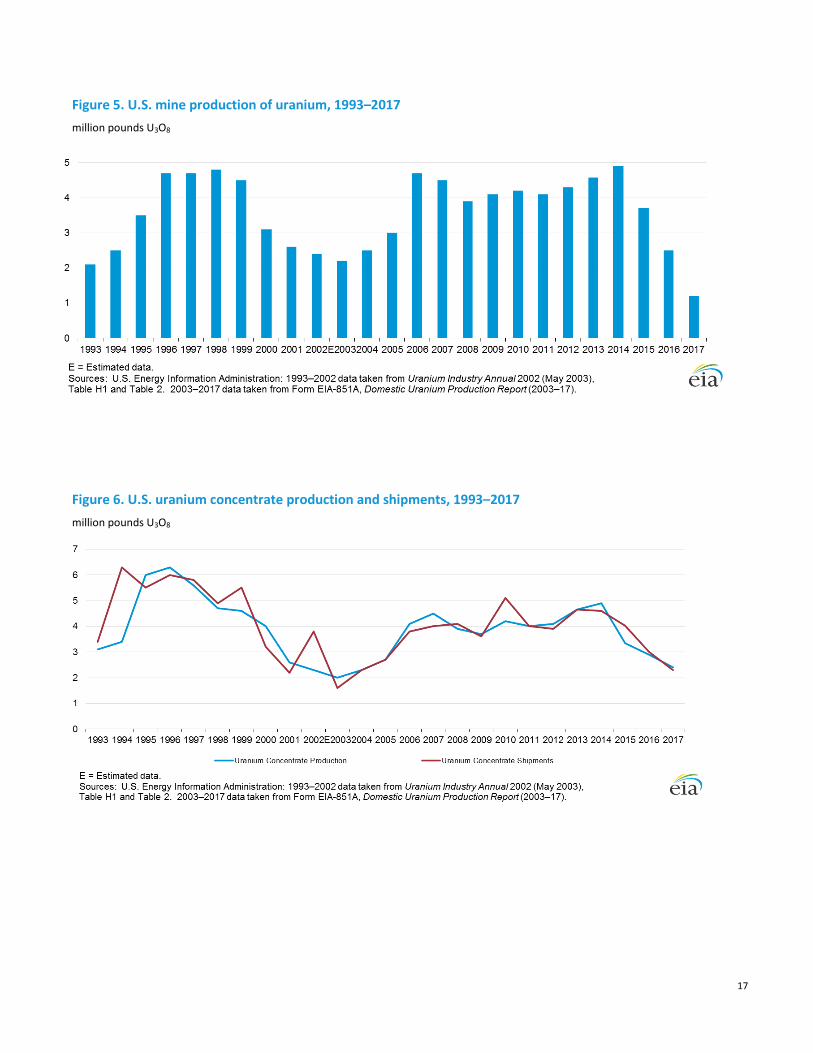
17
Figure 5. U.S. mine production of uranium, 1993–2017 million pounds U3O8
Figure 6. U.S. uranium concentrate production and shipments, 1993–2017 million pounds U3O8

18
Figure 7. Employment in the U.S. uranium production industry, 1993–2017 person-years

19
Table 10. Uranium reserve estimates at the end of 2016 and 2017 million pounds U3O8
$0 to $30 per pound
$0 to $50 per pound
$0 to $100 per pound
$0 to $30 per pound
$0 to $50 per pound
$0 to $100 per pound
Properties with Exploration Completed, Exploration Continuing, and Only Assessment Work 24.3 W 136.9 21.4 109.0 163.3
Properties Under Development for Production and Development Dri l l ing W W W W W W
Mines in Production 17.1 W W W 17.3 W
Mines Closed Temporari ly, Closed Permanently, and Mined Out W 28.4 W W W W
Total 59.9 159.5 339.2 45.4 181.8 361.7
In-Si tu Leach Mining W 115.3 W W 138.8 W
Underground and Open Pi t Mining W 44.2 W W 43.0 W
Total 59.9 159.5 339.2 45.4 181.8 361.7
Arizona, New Mexico and Utah 0 W 209.6 0 W 163.7
Colorado, Nebraska and Texas W 39.2 W W W W
Wyoming W W W W W WTotal 59.9 159.5 339.2 45.4 181.8 361.7
Note: Tota ls may not equal sum of components because of independent rounding.
Uranium Reserve Estimates1 by Mine and Property Status, Mining Method, and State(s)
Source: U.S. Energy Information Adminis tration: Form EIA-851A, Domestic Uranium Production Report (2016–17).
Forward Cost 2
1 These uranium reserve estimates cannot be compared with the much larger his torica l data set of uranium reserves that were publ i shed in the July 2010 report U.S. Uranium Reserves Estimates . Reserves , as reported here, do not necessari ly imply compl iance with U.S. or international government defini tions for purposes of investment disclosure.
W = Data withheld to avoid disclosure of individual company data .
2 Forward Cost: The operating and capi ta l costs s ti l l to be incurred in the production of uranium from in-place reserves . By us ing forward costing, es timates for reserves for ore depos i ts in di ffering geologica l settings and s tatus of development can be aggregated and reported for selected cost categories . Included are costs for labor, materia ls , power and fuel , roya l ties , payrol l taxes , insurance, and appl icable genera l and adminis trative costs . Excluded from forward cost estimates are prior expenditures , i f any, incurred for property acquis i tion, exploration, mine development, and mi l l construction, as wel l as income taxes , profi t, and the cost of money. Forward costs are nei ther the ful l costs of production nor the market price at which the uranium, when produced, might be sold.