u.s. uranium production costs and schedule...2018/09/27 · u.s. uranium production costs and...
TRANSCRIPT

>
Registration Unit 09/27/2018 3:58:53 PM
ENERGY RESOURCES INTERNATIONAL, INC. E;Rl-2010-1801
U.S. Uranium Production Costs and Schedule
This material is disseminated by Energy Resources International, Inc., a registered foreign agent, on behalf of Tenam Corporation. Additional information is available at the Department of Justice, Washington, DC.
101518TH Street, N.W., Suite 650 Washington, DC 20036 U.S.A.
Telephone: 202-785-8833 Facsimile: 202-785-8834
Received by NSD/F ARA Registration Unit 09/27/2018 3:58:53 PM

Registration Unit 09/27/2018 3:58:53 PM
ENERGY RESOURCES INTERNATIONAL, INC. ERl-2010-1801
U.S. Uranium Production Costs and Schedule
© 2018 Energy Resources International. Inc. All Rights Reserved.
Prepared by:
Thomas B. Meade Eileen M. Supko
September 2018
1015 18TH Street, N.W., Suite 650 Washington, DC 20036 U.S.A.
Telephone: 202-785-8833 Facsimile: 202-785-8834
Received by NSD/FARA Registration Unit 09/27/2018 3:58:53 PM

Received by NSD/FARA Registration Unit 09/27/2018 3:58:53 PM
NOTICE
Energy Resources International, Inc. ("ERi") believes the information in this report to be accurate and the analysis to be representative of U.S. uranium production costs and schedules. However, ERI does not mal;:e any warranty, express or implied, nor assume any legal liability or responsibility for the accuracy, completeness, or usefulness of any information contained herein, nor for any consequent loss or damage of any nature arising from any use of this information.
ERI-2010-1801 Ill Energy Resources International, Inc.
Received by NSD/FARA Registration Unit 09/27/2018 3:58:53 PM

Received byNSD/FARA Registration Unit 09/27/2018 3:58:53 PM
PREFACE
ERi was commissioned by Tenam Corporation ("Tenam''), a Maryland corporation, to provide an independent review of the expected costs and production schedules for U.S. uranium mines if production frorn said mines is increased in response to proposed quotas in the Section 232 Petition now under consideration by the U.S. Department of Commerce ("DOC"). The projection of expected costs, production schedules and conclusions made are ERi's and were rnade independently. °These projections are based on ERi's on-going involvement in analyzing all segments of the nuclear fuel supply industry. ERi's intent in preparing this White Paper is to (1) identify those factors.that can have the greatest impact on the prices needed to incentivize U.S. uranium production by applying the various resources and methods that are available to support ERi's analysis and (i) determine the schedule necessary to increase U.S. uranium production to meet the proposed quotas in the Section 232 Petition.
ERI-2010-1801 IV Energy Resources Internation~l, Inc.
Rec\!ived by NSD/FARA Registration Unit 09/27/2018 3:58:53 PM

Received by NSD/FARA Registration Unit 09/27/2018 3:58:53 PM
TABLE OF CONTENTS
Notice .................................................................................................................. lll
Preface ......•........................... , .................. , ............................................................. IV
Executive Summary .•................................•................................................................... ES-1
1. Section 232 National Security Investigation of Imports of Uranium ........................ I
2. U.S. Requirements for Natural Uranium ................................................................. 3
3. U.S. Mil)ing Industry Overview· ............................................................................. 5 3.1 Energy Fuels Resources (USA) Inc ........................................................................ 5
3.1.1 White Mesa Mill .............................................................................. 6. 3.1.2 Nichols Ranch .................................................................................. 6 3. I .3 Alta Mesa ........... , ............................................................................ 7 3.1.4 Conventional Uranium Mines ........................................................... 8
3.2 Ur-Energy ............................................................................................................. 8 3._2.1 Lost Creek ....................................................................................... 8 3.2.2 Shirley Basin .................................................................................... 9
3.3 Azarga Uranium Corporation ................................................................................. 9 3.3.1 Dewey Burdock Uranium Project.. .................................................... 9 3.3.2 Other Projects ................................................................................ 10
3.4 Cameco ............................................................................................................... 11 3 .4.1 Smith Ranch - Highland ISL Mines ................................................ 11 3.4.2 Crow Butte ISL Mirte ................................. ; ................................... 11
3 .5 Laramide Resources, Limited ............................................................................... 12 3.5.1 Church Rock and Crownpoint Projects ............................................ 12 3.5.2 La Sal Project. ................................................................................ 13
3.6 Peninsula Energy Limited ............................................ : ....................................... 13 3.7 Uranium One ....................................................................................................... 13
3.7.1 Willow Creek/Christensen Ranch ................................................... 13 3.7.2 Moore.Ranch ................................................................................. 14 3. 7 .3 Ludeman Project ............................................................................ 14 3. 7.4 Other Properties ............................................................................. 15
3.8 Uranium Energy Corporation ............................................................................... 15 3.8.1 Palangana & Hobson Project ............ , ............................................. 15 3.8.2 Reno Creek .................................................................................... 16 3.8.3 Other Properties ............................................................................. 16
3. 9 Westwater Resources ........................................................................................... 16
ERI-20 I 0-180 I V Energy Resources International, Inc.
Received by NSD/FARA Registration Unit 09/27/2018 3:58:53 PM

Received by NSD/FARA Registration Unit 09/27/2018 3:58:53 PM
TABLE OF CONTENTS (continued)
4. . Costs for U.S. Uranium Production ...................................................................... I 7 4.1 Schedule ................................................... : .......................................................... 17 4.2 Schedule to Rea.ch Production Levels Needed to Meet Quota ................................ 22 4.3 Individual Mine Costs .............................................................•............................ 23 4.4 Supply Curve and Cleating Price ......................................................................... 24 4.5 Base Cleating Price .....................•....................................................................... 25
5. Factors Impacting U.S.-Origin Uranium Clearing Prices ........................................ 26 5. I Production Schedule ............................................................................................ 26 5.2 JSR Restoration Costs ................................................. , ......................................... 28 5 .3 Quota Lev.el. ........................................................................................................ 31 5 .4 Rate of Return ..................................................................................................... 32 5 .5 Schedule Delays with Higher Restoration Costs ................................................... 33
6. Summary ............................................................................................................. 34
Appendix - About Energy Resources International, Inc ................................................. A-1
ERI-2010,1801 Vl EQ~rgy Resources lnternation_al, Inc.
Received by NSD/FARA Registration Unit 09/27/2018 3:58:53 PM

Received by NSD/FARA Registration Unit 09/27/2018 3:58:53 PM
Table I
Table 2 Table 3 Table 4
Table 5 Table 6 Table 7
Figure I Figure 2 Figure 3 Figure 4 Figure 5 Figure 6 Figure 7 Figure 8 Figure 9 Figure 10
ERI-2010-1801
LIST OFT ABLES
U.S. Requirements for Natural Uranium Concentrates and Projected Requirements Subject to Proposed Section 232 Remedy .............................. 4 Historical and Potential Production at U.S. Mines ...................................... 19 U.S. NRC Licensed Uranium Recovery Facilities and Conventional Mines 20 Uranium Recovery Facility and Conventional Mine Licensing in ................. . Agreement Stat es ............. , ........................................................................ 21 Potential Schedule Delays ......................................................................... 27 Selected !SR Restoration Costs Provided in Technical Studies ................... 28 Summary of Scenarios Examined .............................................................. 34
LIST OF FIGURES
Uranium 232 Petition Timeline .................................................. , .............. 17 Comparison of Maximum Domestic Production to Quota .............. · ............. 22 U.S. Uranium Supply Curve in 2023 .............................. , ..... , ........ , ........... 24 Base U.S.-Origin Clearing Price 2019-2030 ............................. , .................. 25 Clearing Price with Schedule Delays ......... , ................................................ 27 JSR Production Schedule Showing Restoration Activities ..... , ........ , ........ , .. 29 Clearing Price with Higher Restoration Costs ............................. , .............. 31 Clearing Price with Lower Quota Levels, .................... , ............................. 32 Clearing Price with 15% Rate of Return., .............. , ........ , .......................... 32 Clearing Price with Schedule Delay and Higher Restoration Costs····'·"····· 33
VII Energy Resources International, Inc.
Received by NSD/FARA Registration Unit 09/27/2018 3:58:53 PM

Received by NSD/F ARA Registration Unit 09/27/2018 3:58:53 PM
EXECUTIVE SUMMARY
As a result of the Section :232 petition regarding uranium imports into the U.S., which was filed in January 2018 by Energy Fuels Resources, Inc. and Ur-Energy, Inc. ("petitioners"), on July 25, 2018, the U.S. Department of Commerce ("DOC"), Bureau of Industry and Security, published a notice in the Federal Register entitled, "Notice of Request for Public Comments on Section 232 National Security Investigation of Imports of Uranium." The petitioners proposed to DOC a two,part remedy to protect the domestic uranium industry that includes:
I. DOC should impose a quota on uranium imports that would reserve 25% of U.S. uranium requirements of commercial nuclear power plants for U.S. production; and
2. DOC should require that U.S: government utilities and agencies purchase their uranium needs from domestic sources.
The uranium import restrictions proposed as a remedy by the petitioners would require that U.S. uranium production cent_ers be capable of supply up to an estimated 14 million pounds of uranium concentrates ("U,Os") per year- a significant leap from 2017 production' of2.4 million pounds ofU,Os. This leads to a number of questions, namely:
1. Can U8. uranium production be ramped up to 14 million pounds of U30s per year, a_nd if so, how long would it take to reach this production level?
2. What would be the "all in" cost to produce 14 million pounds of U3Os per year?
The purpose of this White Paper on U.S. Uranium Production Cost and Schedule is to answer these questions through an analysis of existing and planned U.S. uranium production centers.
The :232 Petition on uranium was accepted by DOC for review on July 25, 2018. The DOC has 270 days to provide a report to the President, the President has 90 days to make a decision, and then 15 days to implement the remedy (if any). The resulting timeline shows that the President's decision must be made by July 20, 2019, This white paper assuinesthat the President announces his decision to impose the requested remedy by June 30, 2019. June 30,2019 is also assumed.to be the date on which U.S. uranium producers would then be able to make the "go decision" to start the investments and activities necessary to increase U.S. uranium production.
A market clearing' price methodology has been employed to determine the prices required by U.S. uranium production facilities to increase U.S. production to the levels proposed in the 232
1 Tota_l 2017 uran_ium concentrates production of 2.44 million pounds consisted of both mine production and processing of alternate feed at the White Mesa mill. Production from mines was just 1.15 million pounds in 2017. 2 In ariy particular yeat, the market cleariilg price (or equilibriu01 pri_ce) for uranium concentrates is based on the cost of production of the last increment of uranium that must be supplied by th,e market in order to provide the total quantity of uranium concentrates that is demanded by the market during that year.
ERI-2010-1801 ES - I Energy Resources International, Inc.
Received by NSD/FARA Registration Unit 09/27/2018 3:58:53 PM

Received by NSD/FARA Registration Unit 09/27/2018 3:58:53 PM
Petition remedy. ER! chose the market clearing methodology because it assumes an efficient allocation of resources in a competitive market and is consistent with the view that long term prices are determined by production costs and future supply-demand forecasts. This is the same methodology employed by ER! for the market analysis in a 2016 report' to DOE in support of the 2017 Secretarial Determination for the Sale or Transfer of Uranium.
A Base clearing price projection was developed. Factors which influence the development of future U.S.-origin uranium clearing prices were examined and include (I) production schedule, (2) in-situ recovery ("ISR") restoration costs, (3) quota level and (4) rate of return.
A summary of the clearing price projections examined is provided in Table ES-I. These results indicated that if the "Buy American Quota" is enacted by the President next year, Base clearing prices for U.S.-origin uranium can be expected to average in the low to mid $70s per pound through 2030. As noted in Section 4, clearing prices can be expected to peak in the upper $80s per pound in the early 2020s, with the potential for even higher prices if a quota is not phased in consistent with actual U.S. production capability. As described in more detail in Section 5, ERI examines additional factors impacting ERi's Base clearing prices such as schedule delays in production, higher costs associated with !SR restoration, and changes in rate of return. In addition, if a quota is set at a lower level than the "Buy American" requested by the petitioners, U.S.-origin uranium prices will be correspondingly
_ lower, averaging in the mid $60s per pound, but still well above the current market price.
ERI projects that it will take 5 years for U.S. uranium production to reach the Buy American Quota of approximately 14 million pounds annually, using the conservative Base assumptions - that is by 2023. If potential delays discussed are encountered, U.S. uranium production will not be able to meet the full Buy Arnerican Quota until 2025.
Weighted Average Price $9enario · '2019-'2030
($/lb Ll:iOa) l;l;is!! Clearing Price _ - $70 !i6 --
Schedule Del!!Y $74.67 Higher Restoration Costs $72.35
Schedule Delay and $76.25
Higher Restoration Costs 25% of U.S. Total Quota $62.54
6 MJIJlon Pound Ql/ofa $5544 15% Rate of Return $6376 Current Spot Price $2!).40
Table ES-I Summary of Scenarios Examined
3 ERl-2142.20-1701, "Analysis of the Potential Effects on the Domestic Uranium Mining, Conversion, and Enrichment Industries of the Introduction of DOE Excess Uranium Inventory During CY io 17 Through 2026", January 12, 2017.
ERl-2010-1801 ES-2 Energy Resources International, Inc.
Received by NSD/F ARA Registration Unit 09/27/2018 3:58:53 PM

Received by NSD/FARA Registration Unit 09/27/2018 3:58:53 PM
1. SECTION 232 NATIONAL SECURITY INVESTIGATION OF IMPORTS OF. URANIUM
On January 16, 2018 two U.S. uranium producers, Energy Fuels Resources (USA) Inc. ("Energy Fuels") and Ur-Energy, Inc. ("Ur-Energy") ("petitioners"), jointly filed a Section 232 Petition with the U.S. Commerce Department ("DOC") to investigate effects of uranium imports on U.S. national security, Petition for Relief under Section 232 of the Trade Expansion Act of I 962 from Imports of Uranium Products that Threaten National Security ("Section 232 petition")'. In the petition, the petitioners stated that due to "the current low price of uranium and the steady decline in the volume of uranium purchased by U.S. utilities from domestic sources, they face a "situation in which it will soon be uneconomic to continue operations." The petitioners requested that DOC establish an import quota on foreign uranium in order to reserve 25% of the U.S. nuclear market for U.S. uranium production, claiming that limiting imports is important to national security. A more detailed summary of the petitioners' proposed remedy and a discussion of.the issues raised by the petitioners is set forth below.
As a result of the Section 232 petition filed in January, on July 25, 2018, the DOC, Bureau of Industry and Security, published a notice in the Federal Register entitled, "Notice of Request for Public Comments on Section 232 National Security Investigation of Imports of Uranium." The Federal Register notice advised that the Secretary of Commerce initiated an investigation to "determine the effects on the national security of imports of uranium.';' This investigation has been initiated under Section 232 of the trade Expansion Act of 1962, as amended.
The petitioners proposed to DOC a two-part remedy to protect the domestic uranium industry that includes:
I. DOC should impose a quota on uranium imports that would reserve 25% of U.S. uranium requirements of commercial nuclear power plants for U.S. production; and
2. DOC should require that U.S. government utilities and agencies purchase their uranium needs from domestic sources.'
The uranium import restrictions proposed as a remedy by the petitioners would require that U.S. production be capable of supplying up to an estimated 14 million pounds of uranium
4 Energy Fuels Resources (USA) Inc. and Ur-Energy USA Inc., Petitioners, ''Petition for Relief under Section 232 of the Trade Expansion Act of 1962 from Imports of Uranium Products that Threaten National Security Before the U.S. Department of Commerce," January 16, 2018. http://www.energyfuels.com/wp-contenl/uploads/2018/01/20I7.01.16-Signed-Petition.pdf 5 U.S. Dcp.artmcnt of<:;ommcrce, Bureau oflndustry and Security, Office of Technology Evaluation, Notice of Request for Public Comments on Section 232 National Security Investigation of Imports of Uranium, U.S. Federal Register, Volume 83, Number 143, July 25, 2018. https:/ /www .gpo.gov/fdsys/pkg/FR-2018-07-25/pdf/2018-15891.pdf 6 Section 232 petition, at Section Vil. Remedy, pp. 88-98
ERl-2010-1801 Energy Resources Intetnational, Inc.
Received by NSD/F ARA Registration Unit 09/27/2018 3:58:53 PM

Received by NSD/FARA Registration Unit 09/27/2018 3:58:53 PM
concentrates ("triuranium octoxide", or "U3Qg'') per year - a significant leap from 2017 production' of 2.4 million pounds of U3Os. This leads to a number of questions, namely:
I. Can U.S. uranium production be ramped up to 14 million pounds of U308 per year, and if so, how long would it take to reach this production level?
· 2. What would be the "all in" cost to produce 14 million pounds ofU3Os per year?
The purpose of this White Paper on U.S. Uranium Production Cost and Schedule is to answer these questions through an analysis of existing and planned U.S. uranium production centers.
7 Total 2017 uranium concentrates production of2A4 million pounds consisted of both mine production and processing of alteffiate feed at the White Mesa mill. Pr'oduction from mines was just 1.15 million pOlinds in 2017.
ERI-2010-1801 2 Energy Resolirces lntetnational, Inc.
Received by NSD/FARA Registration Unit 09/27/2018 3:58:53 PM

Received by NSD/FARA Registration Unit 09/27/2018 3:58:53 PM
2. U.S. REQUIREMENTS FOR NATURAL URANIUM
As noted above, the petitioners proposed a two-part remedy to protect the domestic uranium industry that includes:
I. DOC should impose a quota on uranium imports that would reserve 25% of U.S. uranium requirements of commercial nuclear power plants for U.S. production; and
2. DOC should require that U.S. government utilities and agencies purchase their uranium needs from domestic sources.'
Regarding the first part of the remedy, which would reserve 25% of U.S. uranium requirements for natural uranium newly produced in the U.S., the petitioners suggest that the ''total annual U.S. market consumption for uranium will be determined by using a moving average of reactor consumption for the preceding three calendar years derived from public data." The petitioners suggest using data publ_ished annually by the U.S. Department of Energy (''DOE") Energy Information Administration ("EIA") in its Uranium Marketing Annual Report. For example, in EIA's 2017 Uranium Marketing Annual Report, the total natural uranium equivalent contained in fuel assemblies loaded into U.S. commercial nuclear power plants between 2015 and 2017 averaged, 44.9 million pounds U3Os equivalent.'· 10
The second part of the remedy would require that U.S. government utilities and agencies purchase I 00% of their uranium requirements from U.S. production sources. This would include nuclear power plants operated by the Tennessee Valley Authority (''TV A") and Energy Northwest. Thus, uranium requirements associated with TVA and Energy Northwest nuclear power plants must be separated from the total U .S requirements for natural uranium.
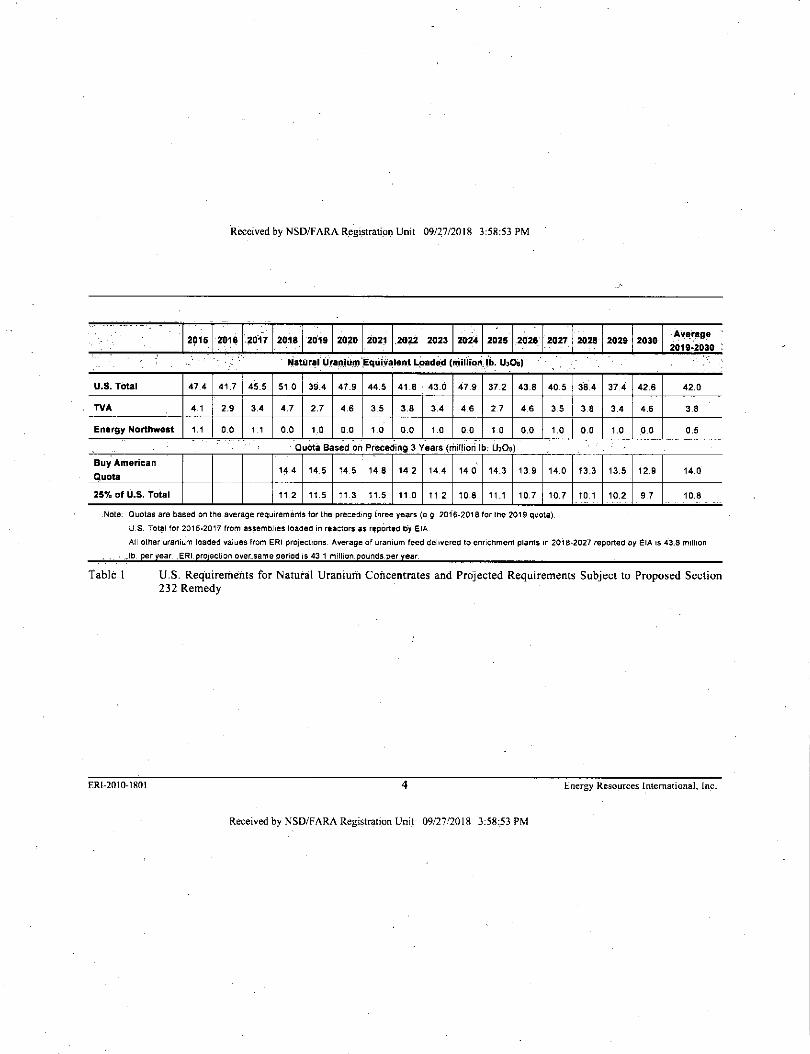
Recognizing that several companies have announced the early closure of nuclear power plants through approximately 2025, ERI has projected U.S. requirements for uranium concentrates through 2030 in order to provide a baseline for establishing the amount of uranium that would be reserved for U.S. production by the proposed remedy. Table I provides a projection of total U.S. U,Os requirements and requirements for TVA and Energy Northwest reactors. From this, one can calculate the total U.S. U,Os requirements that would be subject to the two-part remedy proposed by the petitioners as shown in Table I and labeled "Buy American Quota". Table I also provides 25% of the trailing three-year average of uranium loaded into U.S. reactors (labeled "25% of U.S. Total"). As shown in Table I, the proposed remedy "Buy A_merican Quota" averages 14 m_illion pounds annually over the period 20 I 9 to 2030.
8 Section 232 petition, at Section VII. Remedy, pp. 88-98 9 Use of the term "U308 equivalent" recognizes that uranium in fuel assemblies is low enriched uranium ('"LEU"). The U,O, equivalent value represents the natural uranium feed component, as U30,, of the LEU. 10 U.S. DOE, EIA, 20!7 Uranium Marketing Annual Report, May 2018, Table 18, p. 48. https://www.eia.gov/uranium/marketing/pdf/umar20l 7.pdf
ERI-20I0-1801 3 Energy Resou_rces lnternat_ional, Inc.
Received by NSD/FARA Registration Unit 09/27/2018 3:58:53 PM
Received by NSD/FARA R_egistrati_on Unit 09/27/2018 3:58:53 PM
.. - . '
2915 ·201& .2011 201a 201a 2020 202, .2022: 2023 202~ 202s 2021_· 2021 2028- 2029 2030
Natural Lfrarilum ·Eq1ii'-Va1ent L0aded (fflillioll 1b. U308)
U.S. TOtal 47.4 41.7 45.5 51.0 39.4 47.9 44.5 41.B 43.0 47.9 37.2 43.8 40.5 38.4 37.4 42.6
TVA 41 2.9 3.4 4.7 2.7 4.6 35 3.8 3.4 46 2 7 4.6 35 3.8 3.4 4.6 --- -
Energy Northwest 1.1 0.0 11 0.0 1.0 0.0 1.0 0.0 1.0 00 1 0 0.0 1.0 0.0 1.0 0.0
Quota Based on Preceding 3 Years (l'Tlifliori lb LI Ca) ' Buy Arilerican
1~.4 14.5 14.5 14.8 14.2 14.4 14.0 14.3 13.9 14.0 13.3 13.5 12 9 Quota
25% of U.S. Total 11.2 11.5 11.3 11.5 11.0 11 2 10.8 11.1 10.7 10.7 10.1 10.2 9.7
Note Quotas are based on the average requirements tor the preceding three years {e.g. 2016-2018 for the 2019 quota).
U.S. Tot~I for 2015-2017 from H!,emblies loaded in reactors as r•pOrted Dy EIA
Average
2019-2030
42.0
3.8
0.5
14.0
10.8
All other uranium loaded values from ERi proiections. Average of uranium feed delivered to enrichment plants 1n 2018-2027 reported by EIA is 43.8 million
lb per year .ERi projection over.same period is 43.1 million pounds per.year
Table 1 U.S. Requirements for Natural Uranium Concentrates and Projected Requirements Subject to Proposed Section 232 Remedy ·
ERI-2010-1801 4 Energy Resources International, Inc.
Received by NSD/FARA Registration Uni_t 09/27/2018 3:58:53 PM

Received by NSD/FARA Registration Unit 09/27/2018 3:58:53 PM
3. U.S. MINING INDUSTRY OVERVIEW
Natural uranium is mined from the earth through either: (1) conventional underground or open pit mining, or (2) in-situ recovery ("JSR") process. With conventional mining, following extraction of uranium ore from the earth, the uranium ore is refined at a uranium mill, where it is crushed, ground into a powder and dissolved using a chemical process to extract the uranium. The uranium is concentrated to produce uranium ore concentrates. Another uranium recovery process from conventional mining is the heap leach process, in which uranium ore is placed on an engineered barrier and sprayed with acid. The uranium dissolves into solution and is collected. The solution undergoes additional chemical processing to produce uranium ore concentrates.
In the !SR process, uranium is dissolved underground and is pumped to the surface in a liquid · leachate solution. Uranium leachate undergoes additional processing and concentration to
produce uranium ore concentrates. The majority of U.S. uranium production facilities licensed over the past decade use the !SR process.''
For conventional ·uranium mining, the individual States where the mines are located have regulatory responsibility. Land managed by the U.S. Bureau of Land Management ("BLM") or U.S. Forest Service ("USFS") require evaluations under the National Environmental Policy Act (''NEPA") by the agencies. The U.S. Nuclear Regulatory Commission ("NRC") has licensing responsibility in uranium recovery operations when the ore is processed and chemically altered. This happens either in a uranium mill following extraction of uranium ore from a conventional mine, during the heap leaching process or the !SR process. NRC regulates !SR facilities, urantum mills, facilities that use heap-leach processing, and the disposal of liquid and solid wastes from uranium recovery operations. Currently, the NRC regulates active uranium recovery operations in Wyoming, New Mexico, and Nebraska. NRC does not directly regulate the active uranium recovery operations in Texas, Colorado, and Utah, as they are Agreement States, meaning that they have entered into strict agreements with the NRC to exercise regulatory authority over this type of material. 12 Wyoming is expected to be granted Agreement State status by October I, 2018."
U.S uranium production facilities, which are operating, on standby, and planned, are discussed below. Assumptions regarding uranium production costs and schedules for uranium production from these facilities are used in this White Paper by ERi.
3.1 Energy Fuels Resources (USA) Inc.
Energy Fuels is a wholly-owned subsidiary of Energy Fuels, Inc., which is incorporated in Ontario, Canada. Energy Fuels owns conventional uranium mines, !SR facilities, and the
11 U.S. NRC. Uranium Recove_ry Extraction Methods, https://www.nrc.gov/materials/urariium-recovery/eX.tractionmethods.html 12 U..S. NRC, Uranium Recovery, https://www.nrc.gov/materials/uranium-recovery.html 13 U .. S. NRC~ Wyoming Agreeme_nt, https://w~.nrc.gov/abo~t,.nr~/state-tribal/agreement-st_ates/wyoming.html
ERl-2010-1801 5 Energy Resources International, Inc.
Received by NSD/FARA Registration Unit 09/27/2018 3:58:53 PM

Received by NSD/FARA Registration Unit 09/27/2018 3:58:53 PM
only operational uranium mill in the U.S. - the White Mesa Mill, which is located in southeastern Utah near the town of Blanding. Fully permitted JSR facilities include Nichols Ranch and Alta Mesa, which has been on standby since 2013. In addition, other JSR projects and conventional mines are in various stages of development."
3.1.1 White Mesa Mill
Energy Fuels acquired all of Denison Mines Corporation's U.S. assets in 2012, which included White Mesa, which processes uranium and vanadium, and several regional mining prpperties. White Mesa Mill, which is located in San Juan County, Utah, was originally licensed by the NRC as a source material license under IO CFR Part 40 on March 31, 1980. It was renewed by the NRC in I 987 and again in I 997. After the State of Utah became an Agreement State for uranium mills in August, 2004, the license was reissued as a State of Utah Radioactive Materials License on February 16, 2005. The mill operates under a ground water discharge permit and radioactive materials license issued by the State of Utah.''
The White Mesa Mill has historically operated on a campaign basis with mill feed sourced from the La Sal Project, Daneros Project and Tony M mines in Utah and the Arizona I and Pinenut mines in Arizona. All of these mines are now on standby due to market conditions or are depleted. White Mesa also processes alternative feed, generally uranium bearing waste material from other facilities, but also from its own waste ponds. Energy Fuels owns two JSR facilities, one in operation and one on standby.
While White Mesa Mill has a licensed production capacity of 2,000 tons of ore per day and processing of 8 million pounds ofUiOs per year, it has operated well below this level for the past ten years. Peak production from conventional ore of 1.3 million pounds occurred in 2012. In 2017, White Mesa Mill produced 1.3 million pounds, which was all from alternate feed sources. 16 In order to operate at higher production levels, the mill requires uranium ore from conventional mines which are all on standby or in various stages of permitting.
3.1.2 Nichols Ranch
In June 2015, Uranerz Energy Corporation and its Nichols Ranch !SR operation were acquired by Energy Fuels via an exchange of stock. The Nichols Ranch JSR project is l.ocated in Wyoming's Powder River Basin.'' The original owner, Uranerz, submitted a license application to the NRC in November 2007 and received a license for the Nichols Ranch JSR facility in July 2011. The facility commenced operation in April 2014. The Nichols Ranch project includes the Nichols Ranch plant and wellfield and the Jane Dough and .Hank properties. The Hank satellite plant and wellfield were licensed by NRC as part of the
14 Energy Fuels, Annual Report Pursuant to Section 13 or l S(d) of the Securities Exchange Act of l 934, for the Fiscal Year Ended. December 31, 2017, pp 38-l l l ("Energy Fuels 2017 Annual Report"). 15 State of Utah, Department of Environmental Quality, https://deg.utah.gov/legacy/businesses/e/energy-fuelsresources-usa/white-mesa-uranium-mill.htrn 16 Energy Fuels; http://www.energyfuels.com/project/white-mesa-mill/ 17 Energy Fuels 2017 Annual Report, p.44.
ERla20lO-l80l 6 Energy Resources International, Inc.
Received by NSD/FARA Registration Unit 09/27/2018 3:58:53 PM

Received by NSD/FARA Registration Unit 09/27/2018 3:58:53 PM
Nichols Ranch licensing in 201 I. The NRC approved a license fot expansion of Nichols R_a_nch/Jane Dough i_n M_arch 2017. 18 ·The yellowcake is dried and packaged at the White Mesa mill. In order to save cash and resources, additional wellfield development is being deferred until uranium prices recover. Production peaked at 0.34 million pounds in 2016 and is expected to decline to 0.15 million pounds in 2018 due to th_e halt in new well field installation.
The central processing plant (CPP) is licensed for a capacity of 2 mi.Ilion pounds per year. It is planned that this facility will process uranium-bearing wellfield solutions from Nichols Ranch, as well as uranium-load~d resin from nearby satellite.deposits that may be developed on the Company's other Powder River Basin properties. Nichols Ranch has !Ileasured and indicated resources of 2.8 million pounds at a grade of 0.13%. Satellite properties, which would process uranium-bearing wellfield solutions at the Nichols Ranch Ci>P, include the fully licensed Hank project, which hl)s indicated resources of0.9 million pounds at grade of 0.10%; and the Jane Dough deposit, which has indicated resources of 3.6 million poµnds at a grade of 0.11 %. 19
3.1.3 Alta Mesa"
Energy Fuels announced its agreement to purchase Mestena Uranium, L.L.C. and the Alta Mesa !SR project in March 2016. 21 The facility completed permitting and received its radioactive material license from the Texas Commission on Environmental Quality in 2003. Mestena brought the Alta Mesa !SR project into operation in October 2005 and produced a total of 4.6 million pounds between 2004 and 2013. Alta Mesa was placed on standby in 2013 and has not produced since that time.
The !SR facility has a licensed capacity of 1.5 million pounds per year and actually produced 1.0 million pounds annually over two years when uranium prices were high. New well field installation halted and production ramped down as market prices declined. Alta Mesa has 3.6 million pounds of measured and indicated resources grading 0.11% and 16.8 million pounds of inferred resources grading 0.12%.
18 U.S. NRC, Nichols Ranch ISR Project, https://www.nrc.gov/info-finder/materials/uranium/licensedfacilities/nichols-ranch.html: Energy Fuels 2017 Annual Report, p. 49. 19 Energy Fu_els, h!tp://w'Yw.en_ergyfuels.com/operations(i_n-situ-op~ratiOns/; Energy Fue_k2017 Ani:iual Report, pp. 44a53. ~o Enctgy Fuels, http://ww"w.energyfuels.com/project/alta-rnesa-isr-mine-plant/; Energy Fuels 2017 Annual Report, pp. 55-. 21 Energy Fuels, Energy Fue_ls to Increase Lower-Cost ISR Uranium Production Profile Through Acquisition of Mesteila Uranium, March 7, 2016.
ERl-2010-1801 7 Energy Reso_urces International, Inc.
Received by NSD/FARA Registration Unit 09/27/2018 3:58:53 PM

Received by NSD/FARA Registration Unit 09/27/2018 3:58:53 PM
3.1.4 Conventional Uranium Mines
Energy Fuels owns a number of conventional underground and open pit uranium mining projects." Many are fully permitted and are currently on standby. Others require additional permitting in order to begin operation as summarized below:
• Henry Mountain/Tony M, Garfield County, Utah - fully permitted and on standby • Henry Mountain/Bullfrog, Garfield County, Utah - in advanced stages of permitting • Roca Honda, McKinley County, New Mexico - in advanced stages of permitting • Sheep Mountain, Fremont County, Wyoming - in advanced stages of permitting • Canyon Mine, Coconino County, Arizona - fully permitted, partial underground
development • LaSal Complex (Beaver, Pandora, LaSal and Snowball properties}, San Juan County,
Utah - fully permitted and on standby • Wate Project, Arizona - permitting on hold. . • Whirlwind Project, Mesa County, Colorado, and Grand County, Utah - on standby .
. 3.2 Ur-Energy
3.2.1 Lost Creek
On October 30, 2007, Lost Creek JSR, LLC, a subsidiary of Ur-Energy, Inc. submittecl a license application to the NRC to construct and operate the Lost Creek Project in Sweetwater County, Wyoming. Following receipt of a license from the NRC in August 2011, the Lost Creek project began operation i.n the third quarter of 2013. 23 Nameplate design and NRC · licensed capacity of the Lost Creek CPP is 2 111illion pounds per year, of which approximately I million pounds per year may be produced from the Lost Creek wellfields. 24 Lost Creek has measured and indicated resources of 13.3 million pounds U3Os at an average grade of0.046% and inferred resources of 6.4 million pounds. 15
Production ramped up to 0. 73 million pounds U3Os in 20 I 5 but then fell to 0.56 million pounds in 2016 and 0.25 million pounds in 2017. Production in 2018 is expected to range between 0.25 and 0.30 million pounds, as Lost Creek is limiting production and fulfilling most of its commitments under existing term contracts with spot market purchases, as allowed by the contracts. During 2017, Ur-Energy purchased 0.52 million pounds on the spot market, equivalent to 67% of customer deliveries." Ur-Energy has stated that any product sales beyond currently contracted levels will be made solely on a discretionary basis, with excess production from Lost Creek being held in inventory for either future delivery
22 Energy Fuels 20 l 7 Annual Report. 23 Ur-Energy, http://www.U:r-energy.com/lost-creek/ 24 Ur-Energy, Annual Report Pursuant to Section 13 or l S(d) of the Securities Exchange Act of 1934, for the Fiscal Year Ended December 31, 2017, p.lL 25 lbid, p.15. 26 Ibid, p.50.
ERJ-2010-1801 8 Energy Resources International, Inc.
Received by NSD/F ARA Registration Unit 09/27/2018 3:58:53 PM

Received by NSD/F ARA Registration Unit 09/27/2018 3:58:53 PM
obligations or to complete discretionary spot transactions. When market conditions improve, facility output will be increased. Previously, Ur-Energy indicated that, at a spot-price of $50 per pound, annual production could increase to I million pounds. 27
3.2 .. 2 Shirley Basin
Shirley Basin project, which. is located in Carbon County, Wyoming, was acquired by UrEnergy as a part of the Pathfinder Mines Corporation transaction in December 2013. Conventional mining at Shirley Basin was halted by Pathfinder in the 1990s. Ur-Energy completed a Preliminary Economic Assessment for the project in January 2015. Baseline studies necessary for permitting and licensing of the project are complete. Ur-Energy has submitted a Wyoming Department of Environmental Quality ("WDEQ") application for a permit to mine the property. Once the State of Wyoming becomes an NRC Agreement State, expected in late 2018, Ur-Energy plans to submit an application for a source material license to the Wyoming Uranium Recovery Program ("URP"). The project is expected to utilize the !SR process." At present, the Shirley Basin property includes a 6.3-million-pound resource."
3.3 Azarga Uranium Corporation
3.3.1 i>ewey Burdock Uranium Project'°
Azarga Uranium Corporation ("Azarga"), formerly Powertech Uranium Corporation, owns the Dewey Burdock Uranium Project, which is located in Fall River and Custer Counties, South Dakota on the Wyoming border. The Dewey Burdock Uranium Project contains measured uranium resources of 4.1 million pounds at 0.33% U3Os and indicated resources of 4.5 million pounds at 0.21 % UJOs. The project has had an extended licensing process due to intervention in the NRC licensing process.
Azarga submitted a license application to the NRC to construct and operate the Dewey Burdock !SR project in February 2009. The applicant withdrew the application and resubmitted it with additional documentation in August 2010. While the NRC issued a license for the facility in April 2014, the final contentions raised by interVenors must be resolved before opera hons can commence, as discussed below. Azarga also received_ a Section I 06 programmatic agreement ("PA") in April 2014, which was executed by the Advisory Council on Historic Preservation, the NRC, the South Dakota State Historic Preservation Office and the BLM."
27 R_eu_ters, "Low-cost U.S. µraniuIJJ miners awa_it priCe sign.al to boost o~tput", Marci). 2, 2015. https:/ /www.reuters.com/article/mining-pdac-litanium-usa"idUSL 1 NOV 612U20150302 28 Ur-Energy, lnc., Fonn 10-K, Annual Report Pursuant to Section 13 or l 5(D) of the Securities Exchange Act of 1934 for the Fiscal Year Ended December 31, 2017. 29 Ur-Energy Inc., http://www.ur-energy.com/shirley-basin/ 30 Azarga Uranium, http://azargat1ranium.com/projects/us'1Jdewey~burdock/ "U.S. NRC, Dewey-Burdock ISR.ProJect.Documents Pertaining io Section 106 of the National Historic Preservation Act, https://www.nrc.gov/ihfo-finder/materials/uranium/licensed-facilities/dewey-burdock.html
ERl-2010-1801 9 Energy Resources International, Inc.
Received by NSD/FARA Registration Unit 09/27/2018 3:58:53 PM

Received by NSD/FARA Registration Unit 09/27/2018 3:58:53 PM
The Dewey Burdock licensing proceeding at NRC has been tied up by contentions raised by intervenors and the Oglala Sioux Tribe. The NRC's Atomic Safety and Licensing Board ("ASLB") filed in favor of Azarga on a number of contentions. However, the ASLB ruled
. that additional consultation efforts were required between the Oglala Sioux Tribe and the NRC staff regarding the two contentions relating to the identification and protection of historic and cultural resources. Azarga expected that the final contention would be resolved in 2018; however, the Oglala Sioux Tribe filed an appeal of the decision made by the NRC to the U.S. Court of Appeals for the District of Columbia Circuit, which may delay the final NRC licensing decisions." ·
Prior to being able to begin construction and operation at the project, Azarga still needs to obtain regulatory approvals from the U.S. Environmental Protection Agency ("EPA") and South Dakota Department of Environment and Natural Resources ("SD DENR"). EPA approval is needed for final Class III and Class V Underground Injection Control ("UIC") permits and three state permits· are needed from SD DENR (Groundwater Disposal Plan (''GDP"), Water Rights ("WR") and Large Scale Mine Plan ("LSM") permits). Additional requirements that need to be addressed prior to commencing construction and operations at the Dewey Burdock Uranium Project include: meeting the pre-operational licensing conditions in its NRC license; the development and implementation of mitigation plans Jor protection of cultural resources under the PA, including resolution of the one outstanding contention related to the NEPA.33
Subject to improved market conditions, Azarga plans to restart the regulatory process with the South Dakota DENR once the final EPA Class III and Class V UIC permits have been issued.
3.3.2 Other Projects"
The Centennial Uranium Project is located in Weld County, Colorado. More than 3,500 holes and 300,000 meters were drilled between 1970 and 2009. A preliminary economic assessment completed _in 20 IO indicated that the Centennial Uranium Project can be developed using ISR methods. The project includes indicated uranium resources of 10.4 million pounds at 0.09% UJOs. Azarga expects annual production of0.7 million pounds and a 14-year mine. This project is unlikely to be developed due to regulations imposed by the State of Colorado.
32 Azarga Uranium; http://azargauranium.com/orojects/usa/dewey-burdock/ 31 Ibid. 34 Az_arga Uranium, h~tp://azargaun:~nium.co~p~ojects/
ERl-2010-1801 IO Energy Resources International, Inc.
Received by NSD/FARA Registration Unit 09/27/2018 3:58:53 PM

Received by NSD/F ARA Registration Unit 09/27/2018 3:58:53 PM
3.4 Cameco
Cameco Corporation ("Cameco"), a Canadian company with headquarters in Saskatchewan Province, Canada, owns the Smith Ranch-Highlands !SR project, which is an !SR project in Wyoming, through its subsidiary Power Resources, Inc. ("PR!"), and Crow Butte Resources, Inc., which is an JSR project in Nebraska. Cameco operates as Cameco Resources in the U.S. As recently as 2016, Cameco was the largest U.S. producer, but market conditions have resulted in the halt of new well field installation and the decline of U.S. production levels.
3.4.1 Smith Ranch - Highland ISL Mines
PR! owns and operates the Smith Ranch and Highland !SR centers in Wyoming, which are operated as a combined operation including the North Butte-Brown Ranch property. Commercial scale operations were first authorized at the Highland portion of the facility in July 1987 and at Smith Ranch in March 1992. In August 2003, these facilities were combined into one license."
Production in 2017 amounted to 0.3 million pounds, down 68% from 2016. The Smith Ranch-Highland CPPs have combined licensed al)nual production capacities of 5.5 million pounds UiOs, although the Highland facility has been idle for a number of years. The licensed wellfield capacity is 3.0 million pounds per year. New wellfield development is possible at the nearby Reynolds Ranch. However, at present new wellfield instaUation has been deferred and the facility will be placed on standby in 2018.
Smith Ranch has measured and indicated resources of 24.9 milli.on pounds UiOs at an average grade of 0.06% and North Butte has 10.0 million pounds UiOs at an average grade of 0.07%. The two sites contain an additional 7.9 mill.ion poul)ds of inferred resources. 36
Site production has been as high as 2.1 million pounds in 2014 and could return to this level if warranted by market conditions.
3.4.2 Crow Bµtte ISL Mine
Cameco Corporation owns I 00% of Crow Butte Resources, Inc. !SR project, located in Nebraska. The Crow Butte project produced 0.1 million pounds in 2017 (down 67% from 2016) and is not expected to produce in 2018 as the head grade continues to decline and no new production wells are being developed. Production at Crow Butte will be minimal in 2018 and the facility will be placed in care and maintenance by the end of 2018. Production was typically in the range of0.7 to 0.8 million pounds per year in 2000 to 2013. The Crow Butte CPP and wellfields are licensed for up to 2 million pounds UiOs per year. Measured and indicated resources are 15.5 million pounds U3Os, with an average grade of 0.22%.37
Additional satellite facilities are possible - the NRC has evaluated requests for amendments
35 U.S. NRC, Smith Ranch Site, https:l/www.nrc.gov/info-finder/materials/uranium/licensed-facilities/smithtanch.htrnl 36 Cameco Corporation, Management's Discussion and Analysis, February 9, 2018. 37 Cameco Corporation, Management's Discussion and Analysis, February 9, 2018.
ERl-2010-1801 1 i Energy Resources International, Inc.
Received by NSD/FARA Registration Unit 09/27/2018 3:58:53 PM

Received by NSD/FARA Registration Unit 09/27/2018 3:58:53 PM
to Cameco's source material license for expansions at the North Trend Expansion Area, the Three Crow Expansion Area and the Marsland Expansion .Area. If market conditions
. improve the expansions could be developed, allowing the production of 0.6 to 0.8 million pounds per year for the long-term, pending NRC approval of the license amendment requests.
3.5 Laramide Resources, Limited
Laramide Resources Limited ("Laramide") is a Canadian company with ISR and conventional uranium mining projects in the U.S. - Churchrock and Crownpoint ISR projects and the La Sal conventional mining project. In January 2017, Laramide acquired Hydro Resources Inc. from Uranium Resources, Inc., including all mineral interests, mining claims and other assets that comprise the Church Rock and Crownpoint mining projects."
3.5.1 Church Rock and Crownpoint Projects
The Crownpoint Project is located 25 miles from the Church Rock Project in New Mexico. NRC issued a license to Hydro Resources in 1998 for uranium production at the Crownpoint Uranium Project using the ISR method. After the license was issued in 1998, the NRC's licensing decision was subject to a lengthy NRC ASLB review, Commission review, and Federal Court review. All legal reviews were completed in November 2010. The Crownpoint Project area includes an NRC permit for a 3 million pounds of U3Os per year processing plant. Oh February 5, 2014 and September 16, 2014, Hydro Resources requested additional time to complete its discussions with the Navajo Nation Council prior to submitting a revised license renewal application. In November 20 I 4, the NRC staff placed its review of the license renewal application in abeyance until further notice. The application remains on hold. The Church Rock project and Crownpoint project have never operated."
Laramide characterizes Church Rock as a production-ready asset with initial production at Sections 8 & 17, with many licenses and permits in hand40
• A feasibility study was completed for Section 8 in 2012. Church Rock could be developed with low initial capital and a staged ramp up. The updated inferred mineral resource estimate is 33.9 million tons at an average grade of 0.075% U3Os for a contained resource of 50.8 million pounds. 41
38 https://laramide.com/201 7 /0 l /06/laramide-resources-tloses-churchrock-and-ctoWnpoint-acguisition/ 39 U.S. NRC, Crownpoint Uranium Project, https://www.nrc.gov/info-finder/rnatcrials/uranium/licensed-facilities/iscrown-point.pdf 40 Laramide Resources, Investor Presentation, August 2018, https://laramide.com/wp-content/uploads/2018/08/2018-08"09.,CP LAM.pdf 41 Latamide Resources, Churchrock and ISR Projects, https://laramide.coin/projects/church-rock-and-isr"'projects/
ERl-2010-1801 _ 12 Energy Resources Intem"ational, Inc.
Received by NSD/FARA Registration Unit 09/27/2018 3:58:53 PM

Received by NSD/F ARA Registration Unit 09/27/2018 3:58:53 PM
3.5.2 La Sal Project
The La Sal Project, in Utah, is a ha:rd rock mine, which has limited permits to allow the start of a bulk sample program. It is located near Energy Fuels' White Mesa Mill in Blanding, Utah. Additioilal permitting is requited to bring the property into operation.
3.6 Peninsula Energy Limited
Peni.nsula Energy Limited subsidiary, Strata Energy, commenced operations at the Lance Project (Ross) in Crook County, Wyoming, in December 2015. Ross is the fully-permitted flagship of the Lance Project. Peninsula submitted a license application to the NRC in January 20 I I and received a license in April 2014.42
Total production for 2017 was 0.12 million pounds UJOs, down 5% from 2016. The Lance project was originally licensed to use alkaline solutions, as is the case with other U.S. ISRs, although not the rest of the world. Peninsula submitted an application to amend its WDEQ Permit to Mine to allow for the use of a low-pH recovery solution ( e.g. acid-based) in the Ross Permit Area of the Lance Projects. Peninsula expects to receive the required approvals to commence low pH operations by mid-2019. During May 2018 suspension of alkaline based production activity within the first mining unit at the Lance Projects (MUI) took place. Alkaline !SR based production operations will continue in the second mining unit (MU2) at the Lance Projects where head grades are higher. Production in 2018 is expected to be about 0.15 million pounds and could decline to 0.10 million pounds in 2019. Production will ramp back up once low pH operations begin. Stage 2 and Stage 3 expansions could enter operation in 2024 and 2026, respectively, allowing production to increase to 3.0 million pounds annually in the late 2020s". The Lance Project has measured and indicated resources of 17 .0 million pounds U3Os at an average grade of 0.047% and inferred ,resources of 36.5 million pounds grading 0.046%.44
3.7 Uranium One
3.7.1 Willow Creek/Christensen Ranch
Uranium One acquired the licensed and permitted Irigaray processing and Christensen Ranch wellfield facilities in the Wyoming Powder River Basin in January 2010. The projects are referred to as Uranium One's Willow Creek Project." NRC approved the return to active
42 U.S. NRC, Ross Site, https://WWw.nrc.gov/ii1fo-finder/inaterials/urahiUril/licel1sed-facilities/ross.html 43 Peninsula Energy, "Feasibility Study Confirms Robust Economics of Low PH Operation at Lance", September 17, 2018. http://www.pel.net.au/images/peninsul---roeyahnair.pdf 44 Peninsula Energy, http://www.pel.net.au/projects/lance projects wyoming usa.phtml Strata Energy, https://stratawyo.com/projects/ross,..isr-project/lance-isr-projects 45 U.S. NRC, WHiow Creek Project, ht1ps:·//Www.niC.gov/inf0-finder/in3.teria1s/uranium/licensedfacilities/christensei1-ranch.html
ERI-2010-1801 13 Energy. Resources International, Inc.
Received by NSD/FARA Registration Unit 09/27/2018 3:58:53 PM

Received by NSD/FARA Registration Unit 09/27/2018 3:58:53 PM
uranium recovery operations at the Willow Creek Project in December 2010. The Willow Creek center started up in 20 I I and has a design capacity of 1.3 million pounds pet year. 46 The Willow Creek CPP has a licensed capacity of2.5 million pounds per year, which will require installation of additional equipment to reach this capacity. Uranium One halted new wellfield installation in June 2013 due to market <;onditions. As a. result, Willow Creek production has declined from 940,000 pounds in 2013 to just 101,000 pounds in 2017 (up from 60,000 pounds in 2016). On July 9, 2018, uranium production was halted and the Willow Cree.k lll_ine is currently transitioning to care and maintenance. Resumption of wellfield construction activities remains possible pending higher market prices. Willow Creek has measured and indicated resources of 15. 7 million pounds at an average grade of 0.075% a_nd proven and probable reserves of 6._1 million pounds at an average grade of 0.043% as of December 31, 2016. 47
3.7.2 Moore Ranch
The Moore Ranch ISR facility is located in Campbell County, Wyoming. Uranium One submitted a licen.se application to the NRC in October 2007 and received a license from the NRC in September 2010. To date, the facility has no active operations. Operations are planned to occur in two wellfields.48 While licensed for its own CPP, Uranium One plans to operate Moore Ranch as a satellite to the Irigaray CPP located 30 miles away.
3.7.3 Ludeman Project"
In Oecelllber 2011, Ura.nium One submitted a license amendment request to the NRC to amend its Willow Creek Project Source Material License SUA-1341 to authorize construction and operation of the Ludeman Project ISR expansion at a separate location in Converse County, Wyoming. In April 2013, Uranium One submitted a "change of design" request, which reduced the number of satellite facilities from three to one in addition to other changes. NRC issued a final SER and license amendment in August 2018. · The WDEQ is expected to issue a Permit to Mine in late 2018, which will include the aquifer exemption.
Uranium One plans to operate the Ludeman Project as a satellite to the Willow Creek Project and intends to ship the uranium laden resin to the Willow Creek CPP for tl).e yellowcake production. Uranium One has not proposed an increase in the yellowcake production capacity for the Willow Creek CPP, which will remain at 2.5 million pounds annually in accordance with the Willow Creek Source Material license SUA-1341. Ludeman has estimated res.ources of 6.3 million pounds at"an average grade of 0.097%.
46 Uranium One,http://www.uraniuml.com/our-operations/#united-states 47 Uranium One, http://www.uranium l .com/our-operations/#united-states 48 ll.S. NRC, Moore. Ranch, https://www.nrc.gov/info,finder/materials/uranium/licensed-facilities/moore-ranch.html 49 U.S. NRC, Safety Eva.luation Report, L_icense Amendment for the Ludeman Project to the Willow Creek In Situ Recovery Project, Converse County, Wyoming, Revision 1, Uranium One USA Corporation, Materials License No. SUA-1341, Docket No. 040-08502, August 2018.
ERI-2010-1801 14 Energy Resources lnter'r1ational, Inc.
Received by NSD/F ARA Registration Unit 09/27/2018 3:58:53 PM

Received by NSD/FARA Registration Unit 09/27/2018 3:58.:53 PM
3. 7.4 Other Properties
Uranium One has additional potential satellite JSR projects in the Powder River Basin of Wyoming which would transport loaded resins to Irigaray for final processing. These properties include: Allemand-Ross and Barge.
Uranium One also has additional uranium JSR projects in the Great Divide Basin of Wyoming. The projects include the Antelope, Cyclone Rim, CroQks Creek, JAB, Twin Buttes and West JAB properties. Combinecl, the six properties are called the Antelope Project Area: A license application for Antelope/JAB was submitted in 2008, but later withdrawn due. to sage grouse questions, which have since been resolved. The license applications have riot been re-submitted due to market conditions.
3.8 Uranium Energy Corporation
3.8.1 Pala11gana & Hobson Project
Uranium Energy Corp ("UEC") is the I 00% owner of the Palangana project located in South Texas. The project is an JSR operatioll located approximately 100 miles south of the company's Hobson processing plant. The uranium-bearing resins produced at Palangana are shipped to Hobson for further processing into UiOs. The Hobson project production averaged less than 0.2 m.illion pounds annually during 2011 - 2013, and then declined to 29,000 pounds in 2014, 6,000 pounds in 2015 and zero thereafter: This is the result ofUEC's September 2013 decision to slow production and new wellfield development at Palangarta due to market conditions.
UEC cites measured and indicated resources at Palangana of 1.1 million pounds at an average grade of 0.14% UiOs located in two zones, and an additional inferred resource of 1.2 million pounds at an average grade of 0.18% located in six exploration zones.'°
UEC has other properties in South Texas and will utilize the. Hobson processing facility as the hub. The Goliad measured, indicated and inferred resources are 7 .0 million pounds grading 0.05% UiOs and Burke Hollow has inferred resources of7.I million pounds grading 0.09%. Goliad's first production area is fully permitted. Burke Hollow is in the permitting and expansion stage."
50 UEC, http://www.uraniumenergy.com/projects/texas/palangana-minc/ SI UEC, http://www.uraniumenergy.com/projects/project-directory/
ERl-2010-1801 15 Energy Resources International, Inc.
Received by NSD/FARA Registration Unit 09/27/2018 3:58:53 PM

Received by NSD/FARA Registration Unit 09/27/2018 3:58:53 PM
3.8.2 Reno Creek
In May 2017, UEC purchased the Reno Creek JSR project, which was fully licensed in February 2017.52 Reno Creek could produce up to ).5 million pounds per year if developed and has resources of 22 million pounds grading 0.041 % U3Os."
3.8.3 Other Properties
In May 2011, UEC acquired the Anderson property after their merger with Concentric Energy Corporation. The Anderson property, which would use conventional mining methods, is located in Yavapai County, Arizona. UEC has not performed any drilling at the Anderson Project. Based oil prior drilling programs, indicated resources using open pit mining are 15.5. million pounds at 0.028% UJOs and inferred resources are 2.5 million pounds at 0.024% U3O8• Additional exploration aild drilling will be required at the property." Underground mining could increase the resources by 11 million pounds.
3,9 Westwater Resources"
Westwater Resources owns the Cebolleta Project, which is located in Cibola County, New Mexico. The project area includes the former L-Bar uranium mine of Sohio Western Mining and the fotmer St. Anthony opeil pit and underground mines of United Nuclear Corporation. The project is iil an exploration stage, with inferred mineral resources of a combined 19 million pounds at 0.17% UJOs in the four deposits that have been modeled to date. Further exploration is required.
Westwater also owns the Juan Tafoya Project, which is located in Cibola, McKinley and Sandoval Counties, New Mexico. The property has two uranium deposits, Marquez and Southeast. The deposits were subject to historical construction including a concrete lined production shaft at the Marquez deposit before construction was halted in the early 1980s. No uranium production has occurred at the site. The project is suitable for the preparation of a preliminary economic analysis.
Westwater also owris additional properties in New Mexico including: Nose Rock and West Largo/Ambrosia Lake. Properties in Texas include the Rosita and Kingsville Dome processing facilities, which are licensed for production but ate on standby and Butler Ranch Project, which would likely be developed as an JSR facility.
52 UEC, Technical Report and Audit of Resources at the Reno Creek (SR Project, July 31, 2016, http://www uraniumenergy.com/ resources/reports/I 2-181 ~A UC-RenoaCreck-Update-Report-FINAL-20160825 .pdf 53 UEC, http://www.uraniumenergy.cOm/projects/projett-directory/ 54 UEC, http://www.uraniumenergy.com/projects/project-directory/; http://www.uraniumenergy.com/ resources/reports/UEC AndersonProject Nl43 l 0 I Final l 9June20121.pdf 55 Westwater Resource$, http://www.west~aterr~s~urces.n~t/projec~/uranium
ERl-20I0-!80! 16 Energy Resources International, Inc.
Received by NSD/FARA Registration Unit 09/27/2018 3:58:53 PM

Received by NSD/FARA Registration Unit 09/27/2018 3:58:53 PM
4. COSTS FOR U.S. URANIUM PRODUCTION
4.1 Schedule
As noted in Section I, t.h.e 232 Petition on uranium was accepted by DOC for review on July 25, 2018. Figure I provides a timeline for the 232 process in which DOC has 270 days to provide a report to the President, the President has 90 days to make a decision, and then 15 days to implement the remedy (if any). The timelit\e shows that the President's decision must be made by July 20, 2019. This white paper assumes that the President announces his decision to impose the requested remedy by June 30, 2019. June 30, 2019 is also assumed to be the date on which U.S. uranium producers wou.ld then be able to make the "go decision" to start the investments and activi_ties necessary to increase U.S. uranium production.
Petition Filed: 1/16/2018
-/i
DOC Accepts Petition: 7/25/2018
~ co' 'ments Deadline:
I 9/10/2018
+
Implementation of Remedy (if any) by:
8/04/2019
DOC Report to I President by: 4/21/2019
,;· President's /q&cision . . by: 7/20/2019 ~:
11112018 41212018 712,12018 101112018 1213112018 412/2019 71212019 101112019 1213112019
Figure I Uranium 232 Petition Timeline
A total of 29 U:S. uranium production centers (mines) have been examined for this white paper. the projected production at each facility through the year 2030 is presented in Table 2. Historical production in 2016 and 2017 is also presented. At present, none of the operable !SR facilities in the U.S. are currently installing new wellfields. Production at existing wellfields is still taking place at several ISRs but is ramping down without new wellfield installation. Others have ceased production altogether and have been placed in "care and maintenance" mode. No conventional mines are in operation, but the 'White Mesa is processing alternate feed material. Total !SR production in 2018 is expected to be 0. 7 million pounds, augmented by about 0.5 million pounds from the White Mesa alternate feed.
The production levels shown in Table 2 for 2019 to 2030 are based on ERi's estimate of the earliest date that existing production centers could ramp up production as well as the earliest
-
ERI-2010-1801 Energy Resource·s International, Inc.
Received by NSD/FARA Registration Unit 09/27/2018 3:58:53 PM

Received by NSD/FARA Registration Unit 09/27/2018 3:58:53 PM
date that potential new production centers could enter into production. The schedules assume that investments and activities necessary for the production centers to increase production do not start until mid-2019, consistent with the uranium 232 petition timeline shown in Figure I. ·
An important factor in the ability to increase U.S. uranium production is the licensing status of individual production. Table 3 lists the uranium recovery facilities licensed by the NRC. The time to fully license facilities under NRC jurisdiction has averaged more than 5 years as shown in Table 3, varying from as little as 3 years to as much as IO years. The facilities with longer licensing duration have typically been subject to licensing litigation initiated by area environmental organizations and N alive American groups. While facilities in Wyoming are shown in Table 3, it is noted that Wyoming will become an Agreement state by October l, 2018 and assume regulatory responsibility for both existing and new licensees.
Table 4 lists the uranium recovery facilities and conventional mines in Agreement States, where the NRC has ceded its licensing responsibilities to the state. The time to fully permit JSR facilities in Agreement states is seen to average about 4.5 years in Table 4, varying from as little as 3 years to as much as 7 years, The time involved in gaining permits for conventional mines appears to take at least 4 years and can take 6 to 8 years, or longer, if approval is needed from BLM or USFS and there is intervention in the NEPA process. As an example, in 2010, Denison Mines, the former owner of the La Sal Complex, submitted a proposed Plan of Operations for expansion of the property. In 2014, the BLM and USFS issued an Environmental Assessment ("EA") draft Decision Notice, and a Finding of No Significant Impact ("FONS!") for public comment regarding the expansion of the La Sal Compkx. Based on public comments received, USFS required that additional analysis was needed before the proposed expansion could be approved. An expanded EA was completed by the agencies in September 2017. In February 2018, the agencies issued a final EA, final Decision Records, and a final FONS! approving the expansion of the La Sal Complex, conditional upon Energy Fuels completing certain requirements and having a reclamation bond in place. 56 This permitting timeline spanned more than 7 years.
"United States Department of the Interior, Bureau of Land Management, United States Department of Agriculture, Forest Service, Environ11Jental Assessment to Approve Plan of Operations Amendment at La Sal Mines Complex, San Juan County, Utah,DOI-BLM-UT-Y0I0-2011-0048-EA, February 2018
ERI-20 l0-180 I 18 Energy Resources Int_ernational, Inc.
Received by NSD/FARA Registration Unit 09/27/2018 3:58:53 PM

Received by NSD/FARA Registration Unit 09/27/2018 3:58:53 PM
. . .. ·-F'l'IXllction Center .... .. ~
~r-~duction (Mi!Uon pounds !J:30s)
.. Type .2016 2017., 201a: "'" 2020 ""' 2022 ·2023· 2024 202S 2026 2027 202B 2029 2030 : ~-- T= ISR Ener<'.111 Fuels 0.5· TO ·1.0 1:0 ,0 ,0 .. 1.0 1.0 1.0 ,o ,.o
Ariderscn Ari~na OP UEC 0.2 ,o ,.2 12 ', ,. " Elurke Hi:iltow·1 t-blison - .. Texas ISR UEC 0.7 07 0.7 0.7 07 0.7 0.7 0.7
Cebole!a NewMeldco UC w,...,,, 17. 1.7. .. 1.7. . 1.7 ,., ,., Cen!ennial Cdorndo ISR A,ama 04 07 0.-7
• CF lridUstrie:i Pieri! Ci"' Florida BP. Canieco __ 09 0.9 09 09 0.9 0.9 0.9 0.9 Chnstensen I Willow C/'eek omm" ISR Uranium One· 0:1 o., 00 0.5 ,0 ,o 10 10 " .1.0 .1.0 .1.0 .1.0 1.0
Churchrock -... - ISR Latamide 0.2 ,o 0.9 " 0.8 04 CrOWB\Jlle Netiraska ISR camaeo 0.3 " 0.3 0.6 0.8 0.8 0.8 0.8 0.8 0.8 0.8 0.8 0.8
D -Burdoc:k So"1h0akola ISR A,arna o., 0.5 ,o ,.o .1.0 ,o 10 ,o ,.o Gas lils Wvomim:, ISR A,ama 0.5 ,o ,0 ,o ,o 10 ·0:1
Goiild"I t-bbscn T.., ~ ISR UEC 0.7 0.7 0.7 07 ·0.1 0.7 0.7 0.7 Honrv M:iunta1n-Bulffroa ''" UC Enl!ra.i fue!!i ... 0.5 1.0 1.0· ,o ,0 ,o Hon~ M:iuntain-Tonv M utah UC Enerav Fuels 0.2 0.5 05 0.5 0.5 0.5 0.5 05 05 0.5 0.5 H1nhland/Snirlh Rarich .Wvoirnnn ISR Carrieco 0.9 03 0.' 05 ,. 2.2 2.2 22 2.2 2.2 2.2 22 22 72
Juan 1' • NewMelOco UC Wesl'Mitei' " .1.1 " 1, 1, " LI Palan al Hobson T= ISR UEC 0.2 0.4 0.4 02 Lance omin" ISR · Peninsula o., o., o., o., 0.4 04 ,., ,.o ,.4 L6 2.7 3.0 3.0 3.0 2.9
Lost Creek Wvominr, ISR '-'·'"' 0.6 03 0.3 o• ,o _ .1.0 ,o ,.o 10 ,.o ,.o ,.o ,.o ,o 10
'""""" omin" ISR Uranium Ole 0.3 0.5 ,0 .. fO ,o .1.0 0:3 .•. .Moore Ranch Wvominr, ISR Uranium O,,e 03 05 0.5 05 0.5 0.5 0.5 0.5
Nictiol9 Ranch Hank Jane Doullh · WVomirio ·IsR Ellerffll: F.UE!li . 03 0.3 0.2 0.5 08 0.S 08 08 0.8 0.8 Reno Creek Wvorrino ISR UEC 05 ,., f5 " L5 L5 ,.5 " " Roca Honda NewMelCico UC Enerav Fuels 1, 2.7 26 32 3.7 3.2 2.7 2,
Sh - !'lr:>Unlaui W\lomiria OP En~erav Fuels 08 0.S 17 1.5 ,. L5 Shirley Basin amino ISR Ur-Ena 0:1 ,0 10 ,.o 0.9 0.9 0.7 0.6.
.wtrite Mesa Mill - canvon Arjtona UC Enerav Fuels 0.3 0.S 0.6 0.6 0.3 While Mesi Mill. LaSal utah UC Enie""' Fuiels 0.6 0.6 0.6 06 06 0.6 06
White Mesa Mill- Whirlwnd Colorado UC Enemu Fuels 0.2 o., 0:4 o., .. 0·4 0.4 0.4 0.4 0.2 . -.Write Mesa" MiU 1A1t F UWh UC Enernw Fuels 0.7 " 0.5 05 0.5 0.5 05 0.5
- - -- .. .. T~~I . . 2._9 2, ,2 L5 5.9 10.0 13.7 18.9 220 26.8 28.2 211.0 28.8 i5A 23.5
Table 2 Historical and Potential Production at U.S. Mines
ERI-2010-1801 19 Energy Resources International, Inc.
Recc_ived by NSD/FARA Registration Unit 09/27/2018 3:58:53 PM

R_eceived by )';SD/FARA Registration Unit 09/27/2018 3:58:53 PM
~
~~ny ... ..... NR<:M Tjpe, Ucenslng Appll<atlon · llcensed - Current slatus ..... Actloit Dale lsaued (Months) -NRC license is.sued 4/2014 bu!
Dewey Burdock South Dalcota NRC ISR New license Feb-2009 124 • pending resalulloo of NRC licensing Azania Uran,u_m corrtenliona and local permb
Ga's Hills Wyoming NRC'' ISR Resa11ces ~ioi:r,-en1
-Nichofs Ra"nch· Project NRC" ISR Nov-2007 Ju~2011 44
We'lfield dewloprrm hi!Jlled Wyoming New license
Nich_ols R~n~ - Hank Licensed but not constructed
Energy Fuels Nichols Rantn - Jan1;1 Dough Wyoming NRC .. 1sR Eicparlsion -
May-2014 Mar-2017. 34 Licensed but not constructeu
Ro~J-l'!.n~!1 N_ew Me_xi_~ N~C UG Newli~n_s_~ 2op ,,. In actvar,cd siage of perrrittmg
Sheep Mountain Wyoming NRC ... u·G10P New license . 2010 ·113. Ir, ad\laneed stage of permt'l:ing.
Smith Ranch- Highlands Wyoming NRC .. ISR Origin~ !1ceil~ _J_l:Jl--1~_7 ~ellfield_~~~"!.h~d _
Crow Butte Nebraska NRC ISR Ongmal license Oec-1989 WeOfield de-..elopTlent halted cameco Resources. Inc
Safety evaluation cQl'1'lllele """ Crow Butte - North Trend Nebraska NRC ISR Expansion Jun-2007 ren"ested ....,_An• bean!
Crow Butte - Marsland Nebraska NRC ISR Expansron Jun-2012 May-2018 71 Wetlfield deYelo?Ten1 halbild
Laram-1de Resources Church Rock New Mexico NRC ISR Original license Jan-1998 Lieei'ISe rene-MII on hold.
Peninsula Energy /Stijlta lance/Ross Wyoming NRC'" ISR New license Jan-2011 Apr-2014 39 Operating
Uranium Energy Corporation Reno Creek Wyoming NRC" isR New license ·oct-2612 Feb-2017 52 No acti-.e operations
- Willow Creek reques1 to return to
W1IIOW cre·ek Wyoming NRC•• ISR Retum to operalion filed in January 2010 and
operating status appro-.ed in De)::errtler 2010, wellfield development hatted
Uranium One Ludeman Wyoming NRC•• ISR ucense
Dec-2011 .A.ug-2018 80 NRC 1i:el'lSeissued·81201s, WDEQ
Ammendment a~roval ---ected late 2018
~~or_e_!~~nch_ Wy91'!_11ng NRC•• ISR New lici!nSe O~ct-2007 S_ep-2010 35 No ach-.e operat,o_ns.
Jab and Antelope Wyoming NRC'' ISR Oigiri_al NRC. J_Lire ·2ooa applicatioo v,it,drawl
Lost Cre~ Wye.ming NRC- ISR New license Oct-2007 .A.ug-2011 46 Operaling -Ur-Energy
LC East and KM Honmn Wyoming -NR·C•• 1sR Mar-2017 EicpansIon l..Jcense pending
Average Duration 85
• J!Bsumai fuUy p,,rmlled June 2019 - Sta!,:io!Wyoming regulabor,as ~ 1Q11J20111.
~~-• r-F!C regulm>n II hlSlp leach o;i,on _is used tt Ore ll"""""!W!d at ~C l"'ensed Swe_,., mill then Shl!ep Mountan ~-er slate ~on ·
Table 3 U.S. NRC Licensed Uranium Recovery Facilities and Conventional Mines
ERI-2010-1801 20 Energy Resources rnternational, Inc.
Received by ~SD/FARA Registration Unit 09/27/2018 3:58:"53 PM

Received by NSD/FARA Registration Unit 09/27/2018 358:-53 PM
. - ~. Ful~. co•inpan·y ... ..... NRCQ!
1)-pe Application Duration
CummtStatus .· . s~ Date Permitted (Morlths) .. . : .. .. ·-
Azarga Uraniu'ri, Centerinial Colorado State ISR ~l~~_s!39~ .. Alta Mesa Tems State JSR 1999 2002 36 0,-dby
~enry: ~O\J~!81-n.19ul1frog L:Jtah S~_te Und.ergrpUn_d In pemitbng stage
Henry Mountain/Tony M Utah State Undergrou_nd Fully permitted o, Standby
Canyon Arimna State - Underground 2_011 2015 " $urface infrastructure a,d production shaft Substantial"' c-~-'eted
Energy Fuels LaSafcon-Q)lex (Pandora. Beaver, LaSal, Utah stat, Underground Dec-2010 Feb-2018 86 Fuly permitted. 0, Standby
Snowball' La Sal Corrq;ilex (Energy
Utah State Underground Additional P'.9rmJ(ing required Queen, Redd Block)
'Miirtwind Colorado State Und~rground Fuly pemitted a, Standby
Palangana Texas State ISR Jul-2ci06 Jan-2010 43 o,_~,tar,dl;rY. .
_a\Jrxe Hou.ow _ Texas State ISR Pf;lr-2014 57 ·1 Amanced permitting stage U_ranium Energy Corpora_tion
Go-lfad Texas $late ISR Aug-2007 May-201_2 57 FuUy pE!rmitted
Anderson Arizona State .. Open Pit Elcploratiori s1ag·e .
Average Duration 54 • Assume(! luiy i:,emitted June 2019
- No NRC regulahOn since milling tc take ptace at WMe Mesa
Table 4 Uraniuin Recovery Facility and Conventional Mine Licensing in Agteetn.ent States
ERI-20i0-t801 21 Energy Resources International, Inc.
Received by NSD/FARA Registration Unit 09/27/2018 3;58:53 PM

Received by NSD/FARA Registration Unit 09/27/2018 3:58:53 PM
In determining the production schedules shown in Table 2, the following assumptions were made:
• The time to first production starts on June 30, 2019. • Announcements of time needed to increase existing or bring new facilities into
production made by producers were considered. 57·"
• New permitting and licensing requires 36 months." • Site development is consistent with schedules published in individual facility NI 43-
101 technical reports and preliminary economic assessments ("PEAs").
4.2 Schedule to Reach Production Levels Needed to Meet Quota
Figure 2 compares the maximum domestic production to the projected Buy American Quota by year. It will take 5 years (from 2018) for U.S. uranium production to reach the Buy American Quota of approximately 14 million pounds annually, using the conservative Base assumptions - that is by 2023. If potential delays are encountered, as discussed in Section 5.1, U.S. uranium production will not be able to meet the full Buy .American Quota u_ntil 2025.
25
' ~ '
=-:::aMaxirhurh Domestic
~ Production
~ :: e_------- . .,.• ... ••· ••O••Delaysin
Domestic Production
g I = -------~ 10
C> •••
........ -~-~----------- . --·"· - ---·- ... ------------.. •· 5+---7.f..:cr'-'-----~-----------
o-+--~-~-~-~-~---~--------
--- 232 Qutoa including Buy American
--- 25% of U.S. Total Loaded
2019 2020 2021 2022 2023 2024 2025 2026 2027 '2028 2029 2030
Figure 2 Comparison of Maximum Domestic Production to Quota
57 Cameco stated 18 to 24 months to bring U.S. facilities hack to full production. Nuclear Fuel, July 30, 2018, p.l l. "Energy Fuels August 2018 presentation stated 6 months for Nichols Ranch and La Sal; 12 months for Alta Mesa, Ca_nyon, Tony M and Whirlwind; 48 months for Roca Honda; and 72 months for Bullfrog and Sheep Mountain. httmllwww.energyfuels.com/wp-contentluploads/2018/08/20 l 8-8-Com-Pres-FIN AL.pdf 59 This is loitger than the 24 months often cited In NI 43'-l O 1 rcp011s, but still Opt.imistic when compared to avail.al)le historical performance provided in Tables 3 and 4. ·
ERl-2010-1801 22 Energy Resources International, Inc.
Received by NSD/FARA Registration Unit 09/27/2018 3:58:53 PM

Received by NSD/FARA Registration Unit 09/27/2018 3:58:53 PM
4.3 Individual Mine Costs
In order to calculate individual mine costs, ERi gathers available information such as initial capital costs, capital cost impairments taken, depreciation and amortization of initial capital costs, cash operating costs, reclamation costs, ongoing capital requirements including wellfield development, surety bond costs, corporate general and administrative ("G&A") costs, exploration costs, income tax rates, severance and ad valorem taxes, royalties, interest rates, facility lifetime and production rate, et.c. for each uranium production facility. Discounted cash flow ("DCF") analyses are then performed for each uranium production facility to determine the levelized, constant dollar ptice which will generate the after-tax rate of return ("ROR") necessary to ince!}livize the supply. Adjustments are made to account for historical inflation. Sources of cost information include regulatory filings such as NI 43-10'1 technical reports, preliminary economic assessments, company financial reports, presentations at conferences, etc. The quality and timeliness of the available sources of cost information can vary. Information may be limited for some individual supply increments.
The DCF analysis performed for each production center includes a number of important Base assumptions:
• The base operating and capital cost information is restated in 2018 dollars using changes in the GDPIPD from the year in which the costs were originally stated.
• The DCF ignores sunk costs, e.g. capital costs incurred prior to 2019.
• The after-tax ROR is 25% (nominal basis). This value recognizes the more restrained level of competition expected among the limited number of U.S. producers operating under a quota. 60
.. • The "price" or "all-in cost" resulting from the DCF for each individual production
center includes the profit and income taxes resulting from the assumed ROR. U.S. mines will not resume and increase production unless incentivized, that is, unless assured of earning a financial return on the required investments.
• Existing !SR centers have stopped wellfield installation and several are in care and maintenance mode. It is assumed that the costs to re-staff, train and start increasing production at these facilities will be equivalent to one year's worth of cash operating costs.
60 ERI traditionally has ass·umed a i 5% ROR for a nuclear fuel market with normal competition. If a Buy American Quota is imposed, the U.S. market Would·no lqnger Opera.te with norm.al competition.
ERl-2010-1801 23 Energy Re_sources I_ntern~_tional, Inc.
Received by NSD/FARA Registration Unit 09/27/2018 3:58:53 PM
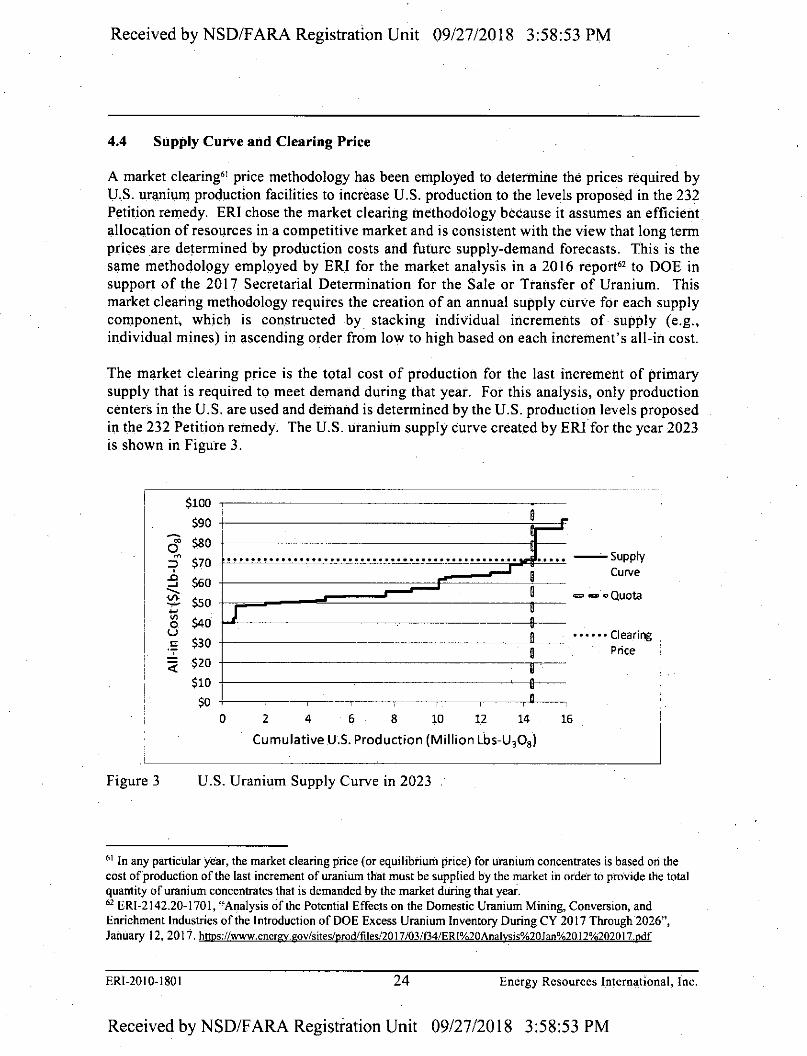
Received by NSD/FARA Registration Unit 09/27/2018 3:58:53 PM
4.4 Supply Curve and Clearing Price
A market clearing" price methodology has been employed to detennine the prices required by U.S. uranium production facilities to increase U.S. production to the levels proposed in the 232 Petition remedy. ERi chose the market clearing methodology because it assumes an efficient allocation of resources in a competitive market and is consistent with the view that long term prices are determined by production costs and future supply-demand forecasts. This is the same methodology employed by ERi for the market analysis in a 20 I 6 report" to DOE in support of the 20 I 7 Secretarial Determination for the Sale or Transfer of Uranium. This market clearing methodology requires the creation of an annual supply curve for each supply component, which is con.structed by stacking individual increments of supply ( e.g., individual mines) in ascending order from low to high based on each increment's all-in cost.
The market clearing price is the total cost of production for the last increment of primary supply that is required to meet demand during that year. For this analysis, only production centers in the U.S. are used and demand is determined by the U.S. production levels proposed in the 232 Petition remedy. The U.S. uranium supply curve created by ERi for the year 2023 is shown in Figure 3.
$100
$90 9 ---;;; $80 0
M
$70 :;i .c $60 ....I
----<I> $50
~
"' $40 0 u C $30 :z
$20 <(
$10
$0
_[_ ___ ·--~--- _______________ __,._ __ --1' • ._,._._ • ._, .. ._._ • ._, .. ._,._._ .. ._,._._ • ._, .. ._._ • ._, •• ._,._._ • ._, .. ._._ • ._, .. ._,._._ .. ._,._._ • ._, .. ._, • ._, .. ._,._._ • ._, .. ._._ • ._, .. ._.._._ .. ._,.'-'.. :.i• l"t"'-'-'-'-'- ........_ Supply
::::::;;;;~:::'.:::~~~==•=t= CuNe - - oQuota I
-1-----------------------"--~ ••••••Clearing Price
I i
! ; i 1 !
7
0 2 4 6 8 10 12 14 16
Cumulative U.S. Production (Million Lbs-U30 8 )
Figure 3 U.S. Uranium Supply Curve in 2023
61 In any particular ye·a:r, the market clea'ring price (or equilibrium price) for U:raniuril concentrates is based on the cost of production of the last increment of uranium that must be supplied by the market in order to provide the total quantity of uranium concentrates that is demanded by the market during that yeai. 62 ERl-2142.20-1701, ''Analysis of the Potential Effects on the Domestic Uranium Mining, Conversion, and Enrichment Industries of the Introduction of DOE Excess Uranium Inventory During CY 2017 Through 2026", January 12, 2011. https://www.energy.gov/sites/prod/files/2017/03/f34/ERI%20Anal~is%20Jan%2012%2020l 7.pdf
ERl-2010-1801 24 Energy Resources I_ntcrnational, Inc.
Received by NSD/FARA Registration Unit 09/27/2018 3:58:53 PM

Received by NSD/FARA Registration Unit 09/27/2018 3:58:53 PM
An important assumption made for the construction of the supply curve concerns individual production center availability factor. It is assumed th.at the annual production values shown in Table 2 are adjusted by factors of 97.5% in 2019, 95% in 2020, 9:1.5% in 2021 and 90% in 2022 and later. The application of availability factors is consistent with overall industry behavior. 63
4.5 Base Clearing Price
The clearing price analysis has been performed for each of the years 2019 through 2030 under the Base assumptions described previously in this section. The resulting clearing prices are shown in Figure 4. It is seen that the clearing price quickly rises to the high $80s per pound over the 2020-2022 period before declining to the mid $60s per pound in 2024-2028 and then increasing to. $73 by 2030. The weighted average clearing price over 2019-2030 is $70.56 per pound. All of the clearing prices are stated in constant 2018 dollars. For comparison, the spot uranium indicator64 is currently reported as $26.40 per pound.
$100 ---------------------
0 $90 t--;;===~------------M
::::> ' .0
...J
~ --------~.,,,,=~ -Base Clearing
~ $60 +'---------------------·;:: ~ $50 --~ ----------------------
Price
"' ·;:: $40 -'--------------------- =8/31/2018 "' D $30 t;;;:::;;;:::;;:::;;:;;:::;;::;;;;:::;;;:::;;:;;:;;:;;:;;;;;;::;::;;;:;;:;;;;;;;;;:;;:;;:;;:;;:;;:;;:;;:;;:;;:;;:;;:;;:;;:;;;;;;;;; Spot Price 0.0 ·;:: 0
Figure 4
$OJ_ ___________________ _
2019 2020 2021 2022 2023 2024 2025 2026 2027 2028 2029 2030
Base U.S.-Origin Clearing Price 2019-2030
As not_ed in Section 4.2, production froin U.S. uranium centers will not be able to fill the proposed quota in the near-term - prior to 2023 for the Buy American Quota. For these early years, the clearing price is assumed to be consistent with the highest priced increment of supply that is in production that year. This assumption is consistent with a phased-in approach for the quota. If the full quota proposed by the petitioners is not phased in, nearterm prices for U.S.-origin uranium could spike well above the high $80s shown in Figure 4.
63 ERi assumes that-, on average, ininc production wi_ll_ be 90% of nomin_al capa_city over the long term due to production interruptions from Un:foreseen events such as.accidents, floods, equipment failures, etc. 64 TradcTcch, Nuclear Market Review, August 31, 2018. http://www.uraniutn.info.
ERI-2010-1801 25 Energy Resources International, Inc.
Received by NSD/FARA Registration Urtit 09/27/2018 3:58:53 PM

Received by NSD/FARA Registration Unit 09/27/2018 3:58:53 PM
5. FACTORS IMPACTING U.S.-ORIGIN URANIUM CLEARING PRICES
There are several factors which influence the development of future U.S.-origin uranium clearing prices:
• Production Schedule • ISR Restoration Costs • Quota Level • Rate of Return
These factors are examined below.
5.1 Produ.ction Schedule
As stated in Section 4.1, the production schedules consistent with Table I and used for the Base clearing price projection are optimistic. Historically, licensing duration has been longer than the 36 months assumed for the Base clearing price projection. It is therefore reasonable to expect delays in production from centers which are not already fully licensed and permitted. Some existing centers need to have licenses extended or new production areas approved; for example, the North Trend and Marsland at Crow Butte, and LC East at Lost Creek. The Lance/Ross project is awaiting approval to switch to low-pH recovery solution (e.g. acid-based) from the current alkaline-based solution used at virtually all other U.S. !SR facilities. While approval from Wyoming is expected in mid-2019, delays are certainly possible. Even without any licensing issues, most U.S. producers may not be in a position to rapidly increase production without firm contracts in hand to support the needed investments. Entering into new sales agreements and arranging financing could result in delays of six to twelve months. Table 5 displays potential additional schedule delays which could be experienced by individual projects. This results in a delay in reaching the full Buy American Quota of 14 million pounds from 2023 to 2025. ·
The resulting clearing price projection if the schedule delays shown in Table 5 take place are provided in Figure 5. The weighted average price in 2019-2030 is $74.67 per pound or $4
· per pound higher than the Base clearing price. When compared to the Base clearing price projection, the schedule delays result in the clearing price remaining in the high-$80s per pound for three extra years - through 2025.
Elll-2010-1801 26 Energy Resources International, Inc.
Received by NSD/FARA Registration Unit 09/27/2018 3:58:53 PM

Received by NSD/F ARA Registration Unit 09/27/2018 3 :58:53 PM
Table 5
00
0 M
::::i ' .c ... ---~
Qj u ·.:::
c,_ OJ) C:
·.::: n, Qj
u OJ) "i: 0 Vl :::l
Figure 5
P_r:odUCtiOO Center Stale Mjne
ONner Delay (Mcinll)s), . funo · AltaMesa Texas ISR Enernu Fuels 12 - . . Ander50n Arizona OP UEC 24
Burke Hollow/ Hobson Texas ISR UEC 12 Ceboleta New Mexico UG Westwaler 24
- Centennial Colorado ISR harn• 24 CF Industries PlantCi!v Florida BP Carreco 24
Christensen fWiilo.N Creek -\11.i.,aniinn ISR Uranium Ole Churchtock New Me>cico ISR Laramide 24 Crow Bulle Nebraska ISR Carreco 12
D~·-·-·surdock Soutt, Dakota ISR Afarrua 24 .. Gas HI~ \Aluonina ISR Azaraa 24
Goliad I Hobson tms ·- ·isR·· . -UEC
Henrv Mountain-Bulif'""'"' Utah UG Ene~· Fuels 12 Henrv ""1ountain-To .... M Utah UG Ene ........ Fuels Hi-L--lancifSmith Ranch 1"-"•omi-- ISR Carreco 12
Juan Tafova New Me>cico . UG Westwater 24 la Palanaana / Hobson Texas ISR UEC
Lance \Aluon,j..,.. ISR Peninsula 12 Lost Creek omi- ISR Ur-.Ener ..... -Luden181'1
... om- ISR Uranium One 24 IVloore Ranch om-- ISR Uranium One 24
Niches Ranch, Hank, Jane Douoh Wvomina ISR Enerov Fuels . Renoc..- \Aluorrinn ISR UEC
Roca Honda. . - New Me>cico . UG Ener-• Fuels 24 S .......... ~ Mountain '-1\"•om- - OP tne;....., Fuels ·24
Shirlev Basin '""·on,inn ISR Ur-Ene ........ 24 While IVesa Mill° Canvon Arizona UG Enernu Fuels White Mesa MIii: l.aSal Utah UG Enemu Fuels
. While Mesa Mill - Whirlwind Colorado UG Ener"'" Fuels While Mesa Mill' Alt Feed> Utah UG Erie~· Fu·e1s·
Potential Schedule Delays
$100 -------~ ----------------------
$90 I
$80 I
$70 I
$60 i
$50 I
$40
$30
$20
$10
$0
·••0•••4•••-G ' ·. ·. ·. o •. ,,
•••• •• •O
i
- Base Clearing i Price
• • o • • Schedule Delay
=8/31/2018 Spot Price
2019 2020 2021 2022 2023 2024 2025 2026 2027 2028 2029 2030
Clearing Price with Schedule Delays
ERI-2010-1801 27 Ene'rgy Resources International, lite.
Received by NSD/FARA Registration Unit 09/27/2018 3:58:53 PM

Received by NSD/FARA Registration Unit 09/27/2018 3:58:53 PM
5.2 ISR Restoration Costs
Restoration costs are considered to be a small component of JSR costs as shown in Table 6. The table provides the projected restoration and closure cost.s for a number ofISR production centers on a $ per pound basis. The costs are drawn from technical reports published for each project, and have been adjusted to constant 2018 dollars (by ERi) and are . seen to average $2.41 per pound.
D&D and Restoration Costs ($/lb U30a)
Ceote1111ial $1.71 Dewev Burdock $1.36 Lance $2.00 Leist Creek $2.80 NJchols Ranch $2.67 Reno Creek $2.31
. Shirlev Basin $4.02
Averaae $2.41
Table 6 Selected JSR Restoration Costs Provided in Technical Studies
Despite the relatively low JSR restoration costs shown in Table 6, it is expected that actual costs will, in fact, be higher. A typical JSR production schedule" is shown in Figure 6. The proj.ect consists of three mine units. When production finishes at a mine unit, restoration activities begin immediately.
The Shirley Basin PEA restoration consists of four phases:
I. Groundwater Restoration (12 months) 2. Groundwater Stability Monitoring (12 months) 3. Regulatory Approval (6 months) 4. Surface Reclamation (12 months)
65 Preliminary Economic Assessment, Shirley Basin Project, Report for NI 43-10 I, January 27, 2015, p. 77.
ERJs2Q]Os]8Q] 28 Energy Resources In_ternational, Inc.
Received by NSD/FARA Registration Unit 09/27/2018 3:58:53 PM

Received by NSD/FARA Registration Uni_t 09/27/2018 3:58:53 PM
-~---
'"'' "'" "'" 20,e "'" """ =• = ""' ,.,. .,,,
""" ,027 2028 ""' 00 o,o ~o olo ~ olo o ~lololo ololofo ~o o,o ~o 00 000 10 ~ 00 0~ 00 00 00 0~ 00 00 ci 0 o elol:Olri ri o = ... ,,
' ' ' ' .... , ,·
·-'-- '-- '--- -'-- 1·T1 I I I MU-2
· I I I I . I ·t ~~ • ~ , .. : I I I I T ' ' ' "'" 111 II! · I I II ' ' ' ' .. •• ' ' ' .
Figure 6 I~R Prod1,1ction Scf:iedul_e Showing Restora~ion Activities
ERI-2010-1801 29 Energy Resources International, Inc.
Received by NSD/FARA Registratiori Unit 09/27/2018 3:58:53 PM

Received by NSD/FARA Registration Unit 09/27/2018 3:58:53 PM
The total reclamation and closure costs were stated to be $23.6 million, estimated to be $18.4 million for the three mine units plus $5.2 million for the central plant. Unfortunately, there is evidence that the groundwater restoration and monitoring phases at individual mine units will take far longer than the combined 24 month shown above. The restoration and monitoring periods assumed above are consistent with returning the groundwater used in !SR mining to the same ba.seline or quality of use (typically industrial) that the groundwater had prior to the onset of mining. Since the groundwater normally does not meet drinking water standards prior to the start of mining, extensive restoration is not assumed to be necessary.
The !SR may also apply for an Alternate Concentration Limit ("ACL") allowing higher values for hazardous constituents" if modeling shows the higher ACLs will not harm potable water outside of the wellfield areas. Actual experience in Wyoming and Nebraska indicates that the restoration process is taking much longer than previously indicated. An April 2018 submittal" to the NRC for the Crow Butte !SR for five mine units indicates that groundwater restoration is taking far longer than 12 months, averaging more than ten years for each mine unit. Stability monitoring is better, taking about 24 months rather than 12. Similarly, extended restoration periods are shown in a July 2016 submittal" to the NRC for the Smith Ranch !SR. Regulatory approval h.as also taken longer than shown above. The report for regulatory approval of restoration at Christensen Ranch Mine Units 2 - 6 was submitted in 2008, but the units have still not been granted regulatory approval." Historically, restoration work in Texas has not experienced these delays. Overall, restoration costs are likely to )le higher than estimated in technical reports (and used in the Base clearing price). Based on the !SR restoration cost information shown in the Shirley Basin PEA and the delays discussed above, ERi estimates that actual !SR restoration costs could be at least $3 per pound higher than assumed in the costs used in the Base Price projection'°.
The resulting clearing price projection if there is a $3 per pound increase in !SR costs due to long groundwater restoration times is provided in Figure 7. The weighted average price in 2019-2030 is $72.35 per pound or $2 per pound higher than the Base clearing price. When compared to the Base clearing price projection, the clearing price is higher in 2023 and later. This is because JSR projects are setting the clearing price in 2023 - 2030, while conventional projects are setting the clearing price in 2020 - 2022.
66 Hazt.1,rdous constituents an_d ACLs arc a_ddressed in the regul_ations under Title l 0, Part 40, Appendix A, Criterion 5(8)(6). https://www.nrc.gov/reading-rrnldoc.collectionslcfr/part040/part040-appa.html 67 U.S. NRC, ML18102A539 68 U.S. NRC, ML16203Al32 69 U.S. NRC, MLI 7349A933 and ML18159A50 70 ISR restoration costs in Texas are not assumed to increase.
ERJ-2010-1801 30 Energy Resources International, Inc.
Received by NSD/F ARA Registration Unit 09/27/2018 3:58:53 PM

Received by NSD/FARA Registration Unit 09/27/2018 3:58:53 PM
$100 ~ $90 0 m
::::, $80 ' ..0 ....I
I "-I ~-. -...__ $70
~ 7 ........_•0•••0••_•4••·--··••0'.7
--- Ba_se Clearing Price
., $60 u ·;:: "- $50 "" C:
$40 ·;::
"' ., $30 0
"" $20 "i:: 0 V) $10 ::::,
$0
,w
-
-
• • -c ••Higher Restoration Cos_ts
=8/31/2018 Spot Price
2019 2020 2021 2022 2023 2024.2025 2026 2027 2028 2029 2030
Figure 7 Glearing Price with Higher Restoration Costs
5.3 Quota Level
The clearing price projections have assumed a demand for U.S.-origin uranium consistent with the two-part remedy proposed by the petitioners and referred to in Table I as the "Buy American Quota". While it does not appear likely that a quota level higher than that requested by the petitioners would be recommended, DOC may decide a lower quota is more appropriate. A lower quota of U.S.-origin uranium would result in lower clearing prices, as mote expensive production would not be required. Clearing prices for two other quota levels h_ave been projected:
I. "25% of U.S. Total" shown in Table 1 where there is no buy American requirement, averaging I 0. 7 million pounds per year in 2019-2030, and
2. A level of 6 million pounds per year (if av.ii lab le), which is consistent with the highest U.S. production levels in the last 25 years."
The resulting clearing price projections are provided in Figure 8. The "25% of U.S. Total'' weighted average is $62.54 per pound or $8 per pound lower than the clearing price for the "Buy American Quota". The 6 million pound quota weighted average is $55.44 per pound or $15 per pound lower than the "BuyAmerican Quota". The "25% of U.S. Total" production level and a 6 million pound production level can be reached by 2022 and 2021, respectively.
71 U.S. production averaged 6.0 million pounds per year over 1995-1997 and has not exceeded 4.9 million pounds since. U.S. Energy Informati_oIJ Ad_mi_Q.i_stration, Domestic Uranium Production Report 2nd Quarter 2018, August 2018. U.S. Energy lnformation Administration, Uranium Industry Annual 1996, DOE/EIA--0478(96), April 1997.
ERl-2010-1801 31 Ene_rgy Resources International, Inc.
Received by NSD/FARA Registration Unit 09/27/2018 3:58:53 PM
- I

Received by NSD/FARA Registration Unit 09/27/2018 3:58:53 PM
$100 --------------------
a $9ot-o=~;;;;;;:------------~
~$80 !\. ... , .
.o / \ '- - B1iy Arilerica_n -:( $70 +.c,t--"--'i'.--'-:. c----' ..... :---------~--7"-~ ~ , / \ -•···o. ....,. ,, Quota ~ $60 -;-,1 \\. •· "G••••-•••• .. •••O ••O•• 25%ofU.S. ·- J.f <=:o~ ••·•0•••-0••••• T t I
~ " 0 ~ ----~----------=-==== oa ~ · = = = 6 Million Lbs ·;: $40 +-------~------------
"' l3 $30 t;;;;:;;:;;;:;;;;;;;::;;;;;::;;;;;::;;;;:;;:;;:;;;;:;;;;;:;;;;:;;:;;;;;:;;;;;;:;;;;;::;;;;;;:;;;;;;:;;;;:;;:;;;;::;;;;:;;:;;:; = 8/31/2018 l ~: E ~ __ Spot Price ,
so2019 2020 20'21 2022 20·23 2024 202s 2d26 2~21 202s 2~29 2d30 ~ Figure 8 Clearing Price with Lower Quota Levels
5.4 Rate of Return
For the sake of completeness, the clearing price projection if a 15% ROR is considered sufficient to incentivize an increase in U.S. uranium production is shown in Figure 9. The clearing price projection averages $63. 76 per pound in 2019-2030, or $7 per pound lower than the Ba_se clearing price. As noted in Section 4.2, ERi believes the higher ROR is more appropriate for the conditions expected in the market fot U.S.-origin uranium if a quota is enacted as this would be a market that is not governed by normal competition.
$100 --------------------
0 $90 1,===;_-------------£ $80 . L ... o ... .o;'-~ $70 f_: ··\.._ - - Base Clearing
Price v>_ , ... . : v...... ,, W$60' •••· .... -'"••••• '-' ,,.. ...0 ............. 11•·· i ,,_ ___________________ ••.O••15%ROR OD $50 , C ·;:
"' QJ
u OD ·.:: 0
Figure 9
$40+---------------------
$30 ,i··· ;;:;;;;;;;:;;;;:;;;;;;:;;;;;;;::;;;;;::;;;;:;;:;;;:;;:;;;:;;:;;;:;;:;;;:;;:;;;;::;;;;;::;;;;;::;;;;:;;;;:;;;:;;:;;;;::;;;:; --, 8/31/2018 F Spot Price
$20
2019 2020 2021 2022 2023 2024 2025 2026 2027 2028 2029 2030
Clearing Price with 15% Rate of Return
ERl-20 I 0-180 I 32 Energy Resources International, Inc.
Received by NSD/F ARA Registration Unit 09/27/2018 3:58:53 PM

Received by NSD/FARA Registration Unit 09/27/2018 3:58:53 PM
5.5 Schedule Delays with Higher Restoration Costs
A final scenario was examined where the schedule delays of Section 5.1 were combined with the higher restoration costs of Section 5 .. 2. The resulting clearing price projection is provided in Figure 10. The weighted average price in 2019-2030 is $76.25 per pound ot $6 per pound higher than the Base clearing price.
~ 0
M ::i· ' .0
...I
---~ 0/ u
·.:: 0. Oil
"' ·.:: ro .0/
D Oil ·.:: 0 V,
::i
$100
$90
$80
$70
$60
$50
$40
$30
$20
$10
$0
·••0•••4•••-0. . +--t----------~~.-------- - Base Clearing i
t-;1--------"'-.:--------"ao-···--- . ___ . Price ··•9., .. 0, .o, ... o
---
• • 0" Schedule Delay w~h Higher Restoration Costs
2019 2020 2021 2022 2023 2024 2025 2026 2027 20.28 2029 2030
Figure 10 Clearing Price with Schedule Delay and Higher Restoration Costs
ERl-2010-1801 33 Energy Resources lntetn.ational, Inc.
Received by NSD/FARA Registration Unit 09/27/2018 3:58:53 PM

Received by NSD/FARA Registration Unit 09/27/2018 . 3:58:53 PM
6. SUMMARY
A summary of the clearing price projections examined is provided in Table 7. These results indicated that if the "Buy :American Quota" is enacted by the President next year, prices for U.S.-origin uranium can be expected to average in the low to mid $70s per pound through 2030. As noted in Section 4, clearing prices can be expected to peak in the upper $80s per pound in the early 2020s, with the potential for even higher prices if a quota is not phased in consistent with actual U.S. production capability. If a quota is set at a lower level than the "Buy American" requested by the petitioners, U.S.-origin uranium prices will be correspondingly lower, but still well above the current market price.
-~ -.
Weighted Average Price . $c:enariQ 2019-2030
' ($/It> U:iOa) C
Base Clearino Price $70.56 .
Schedule Delay $74.67 Hiaher Restoration Costs $72.35
Schedule Delay and $76.25 ' !ii1Jh_u _Restoration Costs
25% of l).S, 10\a[Quota $62.54 6 Million Pound Quota $5SA4 15% Rate of Return $63.76 Current Spot Price $26.40
..
Table 7 Summary of Scenarios Examined
ERi projects tbat it will take at least 5 years for U.S. uranium production to reach the Buy American Quot11 of approximately 14 million pounds annually, using the conservative Base assumptions~ that is by 2023. If potential delays discussed are encountered, U.S. uranium production will not be able to meet the full Buy American Quota until 2025.
ERl-2010-1801 34 E_nergy Resources Internati_onal, Inc.
Received by NSD/FARA Registration Unit 09/27/2018 3:58:53 PM

Received by NSD/FARA Registration Unit 09/27/2018 3:58:53 PM
Appendix - About Energy Resources International, Inc.
E~I was established in January 1989 to provide consulting services to electric utility companies, suppliers of nuclear fuel materials and services, private industry, government agencies, investment banks, and industry associations in the U.S. and worldwide. It has done this successfully for the past 29 years. ERi is not affiliated through ownership or joint venture arrangements with any nuclear fuel supply company or nuclear power plant operating company. ER! is an independent consultancy and has never brokered or traded nuclear fuel products.
Since its inception, ERi and its staff have been providing its highly diversified base of clients with consulting support in the areas of commercial, financial, econornic, market risk analyses, cost benefit analyses, strategic and operational financial planning, as well as support of regulatory activities associated with the U.S. and world market fot nuclear fuel.
ERi's Principal Consultants who lead this project, Mr. Thomas Meade and Ms. Eileen Supko, together have more than 60 years of expertise in the nuclear fuel market, including providing clients with consulting services relevant to rriarket research related to nuclear fuel, including all of the nuclear fuel components (uranium, conversion services, enrichment services and fuel fabrication), and the ways and means of procuring these services and mat.erials. Both Mr. Meade and Ms. Supko have advised utility companies and international organizations regarding the markets for and procurement of nuclear fuel and its components (uranium, conversion services, enrichment services and fuel fabrication).
Both Mr. Meade and Ms. Supko .are recognized as experts in the international nuclear fuel market, including the international market for uranium as well as all other nuclear fuel components. Mr. Meade and Ms. Supko are the primary authors ofERI's Nuclear Fuel Cycle Supply and Price Report, which has been published by ERi annually since 1989 and has been purchased by subscription by nuclear operating companies, fuel suppliers, trading companies, investment banks, and government agencies. Mr. Meade and Ms. Supko are also the primary authors of recent analyses performed under contract to the U.S .. Department of Energy to assess the potential effects on the domestic uranium mining, conversion and enrichment industries of the introduction of DOE inventories into commercial markets.72 ·
72 ERJ-2142.20-1701, "Analysis of the Potential Effects on the Domestic Uranium Mining, Conversion, and Enrichment Industries of the Introduction of DOE Excess Uranium Inventory During CY 2017 Through 2026", January 12, 2017. ·
ER!-20!0-1801 A-i Energy ResourC:cs International, Inc.
Received by NSD/F ARA Registration Unit 09/27/2018 3:58:53 PM

Received by NSD/FARA Registration Unit 09/27/2018 3:58:53 PM
2013 - Present
2004 - 2012 1989 - 2003
Thomas B. Meade Curriculum Vitae
Energy Resources International, Inc. Principal Owner and Chairman of the Board Vice President Senior Consultant
Mr. Meade is a principal owner and serves as Chairman of the Corporate Board of Directors at Energy Resources International, Inc. (ERi), a Washington, D.C: based nuclear fuel cycle consulting firm. Previous positions in the Corporation include Vice President and Senior Consultant. He has provided consulting services to electric utility companies, suppliers, industry associations, and government agencies on an international basis since the early 1980s. His areas of involvement have included market analyses for all components of the nuclear fuel cycle, including uranium supply, conversion services, uranium enrichment services, uranium ·and mixed-oxide (MOX) fuel fabrication, reprocessing and disposal of high-level nuclear waste. In each of these areas, Mr. Meade has also provided a broad range of assistance. to his clients in policy formulation, strategic planning, commercial and economic evaluation, and technical analyses.
Mr. Meade is a primary author of a major annual report covering all aspects of the nuclear fuel cycle, subscribed to by a significant number of international nuclear operating companies and nuclear fuel suppliers. He has performed viability assessments and due diligence reviews of major fuel supply companies, developed and supported the implementation of fuel procurement strategies for nuclear operating companies, evaluated strategic inventory policies, reviewed commercial, economic and technical aspects of vendor proposals, and assisted clients in contract negotiations. He has reviewed and provided comments to DOE/NNSA regarding elements of a draft manufacturing services agreement and proposed MOX. pricing, and has provided support to DOE/NNSA during vendor negotiations. He has extensive experience analyzing the impacts of government actions on commercial markets, including the implications of government inventory releases as well as the implications of proposed uranium and enrichment legislation. Mr. Meade has supported applicants in federal regulatory hearings associated with the need for new uranium enrichment facilities. He has also performed analyses of historical and future impacts of different energy sources on electric power sector emissions of greenhouse gases in the U.S. a_nd internationally and has evaluated the -impact of SO2, NO, and CO2 emission allowance trading on their economic competitiveness. In addition to his other consulting activities, Mr. Meade has authored numerous articles on ·commercial aspects of the nuclear fuel cycle and h_as co-authored industry handbooks on uranium, enrichment services and conversion services.
Mr. Meade has extensive experience in the development, implementation and modification of analytical computer models covering a variety of fuel supply and energy sector activities, These include nuclear fuel cycle planning and accounting, price projection and market·
ERl-2010-1801 A-2 Energy Resources International, Inc.
Received by NSD/FARA Registration Unit 09/27/2018 3:58:53 PM

Received by NSD/FARA Registration Unit 09/27/2018 3:58:53 PM
analysis, nuclear fuel supplier production cost profiles, dem.and projection, economic competitiveness of available energy sources, CO,, SO2 and NO, em1ss10n projections, uranium, enrichment and spent fuel storage project economics, and spent fuel generation, storage and shipping. He is also the lead for ERI's FUELMACS© software product, a comprehensive nuclear fuel management and accounting system used by a number of electric utility companies.
1983 - 1989 Pickard, Lowe and Garrick, Inc.
Mr. Meade began his career with Pickard, Lowe and Garrick, Inc., a nuclear energy consulting firm in Washington, D.C., where his activities covered the full range of nuclear fuel management and consulting. He developed numerous computer-based analytical models including a probabilistic fuel cycle cost model; a nuclear fuel transaction and reporting system with accounting detail; a spent nuclear fuel generation, storage and shipping model; a comprehensive enrichment services pricing model and a simplified nuclear fuel planning model. He was also responsible for a comprehensive fuel cycle scheduling and economic analysis code in use at a number of utilities. He performed spent fuel storage pool criticality analyses. He also took part in a variety of risk assessment and consequence analysis activities including quality assurance of a comprehensive meteorological dose assessment system, performed spent fuel pool criticality analyses, and a.ssisted in demonstrating compliance with radiological effluent technical specifications.
Education:
Graduate Level Courses in Nuclear Engineering, University of Virginia, 1982-1983 B.S., Nuclear Engineering, University of Virginia, 1981
ERl-20 I 0-180 I A-3 Energy Resources International, Inc.
Received by NSD/FARA Registration Unit 09/27/2018 3:58:.53 PM

Received by NSD/F ARA Registration Unit 09/27/2018 3:58:53 PM
2013 - Present
2004 - 2012 1990 - 2003
Eileen M. Supko Curriculum Vitae
Energy Resources International, Inc. Principal Owner and President
Vice President Senior Consultant
Ms. Supko is a Principal Owner and President of Energy Resources International, Inc. (ERi), a Washington, D.C. based nuclear fuel cycle consulting firm. She provides consulting services to clients the areas of nuclear fuel management, radioactive materials transport, and nuclear waste management. In each of these areas, Ms. Supko provides a broad range of assistance to her clients"in policy formulation, strategic planning, commercial and economic evaluation, and regulatory and technical analyses. Her clients include nuclear power plant operating companies, U.S. government agencies, foreign governments, nuclear industry organizations, and private companies.
Nuclear Fuel Management: Ms. Supko provides nuclear fuel management consulting services to nuclear operating companies, including development of nuclear fuel procurement strategies, commercial bid evaluation related activities, and review and audit of nuclear fuel procurement practices and strategic plans. She has experience in analyzing the market and pricing implications of legislation and government policies, such as the introduction of excess U.S. government inventories into the civilian nuclear fuel cycle. She has assisted nuclear industry clients in the development of strategies for uranium inventory management and in assessing optimized nuclear fuel inventory levels. .She has served as a nuclear fuel management expert witness in nuclear fuel contract disputes. Ms. Supko performed costbenefit analyses to support the licensing of a nuclear fuel cycle facility. She has assessed the impacts of regulations on .schedules for licensing and construction of fuel cycle facilities. Ms. Supko is co-author of a major annual ERi report that addresses all aspects of the nuclear fuel cycle.
Radioactive Materials Transport: Ms. Supko provides analysis and consultation regarding radioactive materials transport including review and analysis of proposed changes to U.S. Nuclear Regulatory Commission, U.S. Department of Transportation, and International Atomic Energy Agency regulations for the transport of radioactive materials. She is the principal representative in North America for the World Nuclear Transport Institute, an internati.onal association of companies involved in the transport ofradioactive materials. She was the principal investigator and author of Spent Nuclear Fuel Transportation - An Overview on behalf of the Electric Power Research Institute (EPRI), to summarize the technical, regulatory and policy framework for transporting sp.ent nuclear fuel.
U.S. and International Waste Management Programs: Ms. Supko provides consultation and analysis to support U.S. industry clients regarding the U.S. Department of Energy's long-
ERl-2010-1801 A-4 Energy Resources International, Inc.
Received by NSD/FARA Registration Unit 09/27/2018 3:58:53 PM

Received by NSD/FARA Registration Unit 09/27/2018 3:58:53 PM
term program for management of spent nuclear fuel and radioactive waste. These activities broadly include review of repository and consolidated storage facility designs, review of licensing analyses and schedules, and analysis of legislative proposals for development of a federal waste management system. She provides technical, regulatory, and economic evalu.ation of dry Spent fuel storage and transportation technologies. She has provided support to commercial clients through due diligence reviews and viability assessments of companies that provide nuclear fuel storage and transport services.
1985 - 1990 Carolina Power and Light Company Nuclear Services Department Nuclear Fuel Projects Engineer, In core Analysis Engineer
Responsibilities included participation in nuclear fuel procurement activities (preparation of bid specifications, co-ordination of bid evaluations, and evaluation of economic and commercial contract terms); nuclear power plant reload core design and analysis.
Education:
B.S., Nuclear Engineering, Pennsylvania State University, 1985
Memberships, Licenses and Honors:
2009 Outstanding Engineering Alumni, Nuclear Engineering, Awarded qy the College of Engineering, Pennsylvania State University
Past member and chairman (2012), Mechanical and Nuclear Engineering Division, Industrial and Professional Advisory Council to the Pennsylvania State University's College of Engineering, 1998 to 2004; 2008-2013.
Founding Member, Board of Directors (2003-2005), Pennsylvania State University, Nuclear Engineering Society
Member, American Nuclear ·society, U.S, Women in Nuclear, and Women's Council on Energy and the Envi_ronment
ERl-2010-1801 A-5 Energy Resources International, Inc.
Received by NSD/FARA Registration Unit 09/27/2018 3:58:53 PM