2012 - investbank.jo · and raouf abu jaber, khalil al talhouni, amin al hasan, bassam atari,...
TRANSCRIPT

201230th Annual Report


The Thirtieth Annual Report Content: Board of Directors Recommendations Introduction Chairman of Board StatementMajor Financial Indicators
The Board of Directors recommends to its shareholders the following, based on what was presented:
1. Ratification of the Bank’s financial data for the year 2012 and the clearance of the Board of Directors for the period of that year.
2. Approval of the Board of Director’s recommendation to distribute profits to the shareholders in the amount of 8 million JOD (eight million Jordanian Dinars), or 8% of the capital.
On this occasion, the Board of Directors wishes to thank the shareholders and all clients of the Bank for their confidence and support, and recognizes all employees for their loyal and dedicated service that secured the continued success of the Bank.

INVESTBANK… Three decades of Growth and Success
In 2012, the INVESTBANK concluded three decades of banking service, moving into the fourth decade with the vitality of youth, years of experience and sustained success, after making a mark supported by improving results, year after year, and decade after decade, in spite of all the crises, difficulties and challenges. It was a new addition to the banking sector thanks to a number of pioneers, headed by the late Nizar Abdul Raheem Jardaneh, all of whom understood that this bank has a role to play in prudent banking.
Here, we highlight important landmarks in the bank’s history throughout the last three decades, starting with the formation of the first Board of Directors with Nizar Jardaneh as Chair, Khaled Abu Al Soud as Vice Chair, and Raouf Abu Jaber, Khalil Al Talhouni, Amin Al Hasan, Bassam Atari, Jaafar Al Shami, Michel Marto, Hassan Mango, Nabil Al Qaddoumi as members, and Basel Jardaneh as General Manager. This Board guaranteed the birth of a successful bank because of the entrepreneurship of its members and their focus that it shall soar in disciplined banking horizons.
The second of these was working as a company, for about seven years, before turning into a bank later. In 1989, pursuant to terms that restricted its activities, including prohibiting it from accepting, in the period 1982 until 1989, commercial deposits, opening current accounts, or offering credit facilities, as well as imposing a limit of no less than six months on the discount duration of promissory notes, advances, and loans, and the inability to finance external commercial operations, issuing letters of credit, or issuing bonds, except to entities that had previously received credit facilities from the company. These terms, however, did not prevent it from achieving successes and continuing to rise in banking work with patience and poise.
These inputs and others launched the Bank towards its third phase, which was the transformation into an INVESTBANK according to new terms and instructions issued by the Central Bank at the time. This was on the first of September 1989, and it has since then proceeded with its banking work

according to new rules and mechanisms that allowed for overcoming the difficulties and obstacles of the previous phase. Thus, it was allowed to use financial and banking services, attract current deposits, and grant checkbooks to its clients. This phase slowly brought it closer to the work of commercial banks in operation at that time, although it remained restricted from offering banking facilities, both in the form of current debit or traditional commercial activities.
The upholding of these restricting terms on its activities was strong motivation for the bank to move on the fourth phase, its transformation into a commercial bank. Thus, turning a new corner its path and whose results we still see today as it reaffirms its place as a pioneering local bank in the offering of banking services and products to its clients according to their needs and serving the national economy, individuals, and small and medium companies, as well as allowing a higher added value to its family of shareholders, clients and employees.
The Bank has achieved much over these last three decades, including the establishment of the Jerusalem Bank for Development and Investment as an ally Bank in Palestine, the introduction of the concept of foreign investment through supporting companies interested in this field, investing in the Amman Stock Exchange, establishing new companies, such as Emaar and United, two real estate companies, and CLEARIUNS for credit card operations, contributing to the establishment of the Free Markets Company, and developing its services and products through its new institutional identity, and building its relationship with the community by offering support and patronage to many of its institutions and activities on the premise of its social responsibility, and finally establishing subsidiary companies of the Bank in the areas of brokerage, leasing and supply chains.
A quick look at the Bank’s data throughout the three decades of its work – according to the first annual report and compared with its thirtieth annual report – the volume of sizeable development is clear. The total budget rose from 20.5 million JD to 708.5 million JD. Deposits grew from 14.7 million JD to 469 million JD, credit grew from 8.7 million JD to 446 million JD, revenues grew from 1.5 million JD to 61.4 million JD, net profit grew from

0.38 million JD to 11.252 million JD, property rights from 3.2 million JD to 134 million JD, capital from 6 million JD to 100 million JD, the number of employees from 25 to 404 employees, and the number of branches from one main branch to nine branches.
Certainly, following the path of the founders and moving with persistent steps to elevate its achievements will lead to greater success in the fourth decade of its life towards creative and innovate banking.
Thirtieth Annual Report 2012
Chairman of Board statement
Dear Shareholders,
It is my pleasure to submit to you, on behalf of the Board of the INVESTBANK, the Thirtieth Annual Report of 2012.
Thirty years of distinguished service!
The INVESTBANK celebrates thirty years of success in banking this year, during which it has seen qualitative developments in services, products and institutional identity, in spite of the internal and external challenges that have impacted various economic sectors. In view of these issues, the INVESTBANK has continued to establish a strong capital base that rose to 100 million JD to support our standing as an advanced bank in terms of services, products, employees and studied competitiveness. This has also reflected on its expansion and its banking, commercial and investment role as well as its future aspirations.
Jordanian Economy
There was a lot of hope tied to the return of activity to the Jordanian economy in 2012. However, the economy growth continued to hover at less than 3%, debt rose to 16.3 billion JD, and unemployment and poverty rates remained around 13 and 14% consecutively. The budget deficit also reached critical levels. In addition to this, the energy bill rose to 4.5 billion JD and foreign reserves reached the limit of 6.6 billion JD. However, all this did not prevent some positive signs, such as rising tourism returns and improved expatriate remittances and the accompanying new approach for

subsidies after floating fuel prices, in order to correct the flaws resulting from the arbitrary subsidies system in the past.
The countries of the Gulf Cooperation Council are also to be applauded for their support to Jordan, by spending on various vital development and economic projects, which will have a positive impact on the economic process and the improved investment climate. This makes us more optimistic that many economic and social challenges in 2013.
Safe Umbrella
In view of all the surrounding circumstances, the banking sector has remained the most capable in adapting to the various challenges, under the safe umbrella of the Central Bank of Jordan, which entrenched stability based on in-depth experience enabling Jordan and the banking sector to overcome the risks and deal with the events professionally and prudently, thus, deepening confidence in its policies and contributing to the maintenance of the dinar’s stability.
Thirtieth Annual Report 2012
Escalating Performance
We are pleased within this context to reaffirm the path of escalating success at the INVESTBANK as revealed by its general results in terms of profits after tax. It reached 11.25 million JD, an increase of 17.2% compared with 2011, rise of assets to a total of 708.5 million, a growth of 2.4% compared with last year, and the facilities that reached 446 million JDs, an increase of 15.4% compared with 2011. Client deposits also reached 458 million JD and returns on shareholder rights were 8.37%. All these positive indicators entrenched its vision that its means to overcome challenges were the path to more success.
Continuing Path
The non-banking problems that faced the Bank are no secret, they were announced immediately as it believes in the principles of transparency and clarity. We have moved quickly to contain the circumstances, correct them, and address their causes. The Bank has also taken the necessary measures to address this issue in the third quarter of 2012. The Board

of Directors and the Executive Board continue to communicate with the Central Bank and the monitoring bodies, in addition to taking all measures to fortify the bank by improving its efficiency in terms of risk management according to best international practices. The Board of Directors and Executive Board have also spared no effort to recover all the Bank’s rights.
Promising Future
The Bank, dear shareholders, works according to its strategic plan, and is continuously improving its organizational structure and banking and technology policies, in order to achieve more entrepreneurship that has distinguished its presence and its work methodology. It is achieving the highest levels of quality in service, competitiveness in achievement, vitality in performance, and quality in client interaction and the prediction of their banking needs.
Thank you
Continuously, the value of the Bank is not the level it has reached but rather what it aspires to reach. This is the spirit of our Bank as it aspires as a Board of Directors and Executive Board to greater achievement, higher-level performance and more sustainable presence. It has enjoyed a large family of dedicated shareholders, clients and employees, all of whom have been concerned with preserving the institution a fruitful and prosperous one, without seeking praise or failing to announce its vision and achieve its goals.
God bless,,
Bisher Mohammad Jardaneh
Chair of the Board of Directors

His Hashemite Majesty King Abdullah the Second Ibn Al Hussein (may God protect him)

His Hashemite Majesty King Abdullah the Second Ibn Al Hussein (may God protect him)

His Royal Highness Crown Prince Hussein Bin Abdullah (may God protect him)

His Royal Highness Crown Prince Hussein Bin Abdullah (may God protect him)

Ann
ual R
epor
t 201
2
14
30th
Ann
ual R
epor
t

Ann
ual R
epor
t 201
2
15
30th
Ann
ual R
epor
t
COMPREHENSIVE FINANCIAL STATEMENTS ENDING BY DECEMBER 31ST, 2013
1. Independent Auditor,s Report
2. Comprehensive Auditor,s Financial Statement
3. Comprehensive Income Statement4. Comprehensive Gross Income Statement5. Changes In Shareholder
,s Equity Statement
6. Comprehensive Cash Flow Statement7. Comprehensive Financial Statement Notes

Ann
ual R
epor
t 201
2
16
30th
Ann
ual R
epor
t
INDEPENDENT AUDITOR’S REPORT
AM/ 31664To the Shareholders of
INVESTBANK
Amman – The Hashemite Kingdom of Jordan
Report on the Consolidated Financial Statements
We have audited the accompanying consolidated financial statements of INVESTBANK (a public shareholding company), which comprise of the consolidated statement of financial position as of December 31, 2012, and the consolidated statements of income, other comprehensive in-come, changes in owners’ equity and cash flows for the year then ended, and a summary of significant accounting policies and other explanatory information.
Management’s Responsibility for the Consolidated Financial State-ments
Management is responsible for the preparation and fair presentation of these consolidated financial statements in accordance with International Financial Reporting Standards, and for such internal control as manage-ment determines necessary to enable the preparation of consolidated financial statements that are free from material misstatement, whether due to fraud or error.
Auditor’s Responsibility
Our responsibility is to express an opinion on these consolidated financial statements based on our audit. We conducted our audit in accordance with International Standards on Auditing. Those standards require that we comply with ethical requirements and plan and perform the audit to obtain reasonable assurance whether the consolidated financial state-ments are free from material misstatement.
An audit involves performing procedures to obtain audit evidence about the amounts and disclosures in the consolidated financial statements. The procedures selected depend on the auditor’s judgment, including the assessment of the risks of material misstatement of the consolidat-ed financial statements, whether due to fraud or error. In making those risk assessments, the auditor considers internal control relevant to the Bank’s preparation and fair presentation of the consolidated financial

Ann
ual R
epor
t 201
2
17
30th
Ann
ual R
epor
t
statements in order to design audit procedures that are appropriate in the circumstances, but not for the purpose of expressing an opinion on the effectiveness of the Bank’s internal control. An audit also includes evaluating the appropriateness of accounting policies used and the rea-sonableness of accounting estimates made by management, as well as evaluating the overall presentation of the consolidated financial state-ments.
We believe that the audit evidence we have obtained is sufficient and ap-propriate to provide a basis for our audit opinion.
Opinion
In our opinion, the consolidated financial statements present fairly, in all material respects, the consolidated financial position of INVESTBANK as of December 31, 2012, and its consolidated financial performance and its consolidated cash flows for the year then ended in accordance with International Financial Reporting Standards.
Emphasis of a matter
Without qualifying our opinion and as noted in Note (13) to the consolidat-ed financial statements, the bank was exposed to irregular activities in the bank’s cash accounts at other banks and financial institutions which led to a loss of around JD 12.9 million as of December 31, 2012. The bank’s management believes that the related provision booked in the consolidated financial statements is adequate against any losses result-ing from these irregular activities.
Report on Regulatory Requirements
The Bank maintains proper accounting records and the accompanying consolidated financial statements are in agreement therewith and with the consolidated financial statements presented in the Board of Direc-tors’ report. We recommend that the General Assembly of Shareholders approve these consolidated financial statements.
The accompanying consolidated financial statements are a translation of the statutory financial statements which are in the Arabic language to which reference should be made.
Amman – Jordan Deloitte & Touche (M.E.) – Jordan
April 15, 2013

Ann
ual R
epor
t 201
2
18
30th
Ann
ual R
epor
t
CONSOLIDATED STATEMENT OFFINANCIAL POSITION Statement (A)
NoteDecember 31,
2012 2011ASSETS JD JD Cash and balances at the Central Bank 4 47,545,437 39,366,571Balances at banks and financial institutions 5 70,630,082 79,108,582Deposits at banks and financial institutions 6 230,778 3,942,065Financial derivatives 37 - 4,380Financial assets at fair value through profit or loss 7 9,589,936 11,778,182
Direct credit facilities - net 10 404,311,268 350,008,522Financial assets at fair value through other comprehensive income 8 12,174,711 13,406,061
Financial assets at amortized cost 9 105,394,480 143,208,743Property and equipment - net 11 21,488,869 26,387,692Intangible assets 12 1,918,827 2,074,410Deferred tax assets 19 4,552,123 2,131,456Other assets 13 30,677,584 20,355,310 TOTAL ASSETS 708,514,095 691,771,974
LIABILITIES AND OWNERS' EQUITYLIABILITIES Banks and financial institutions deposits 14 11,044,231 18,270,292Customers deposits 15 458,081,546 469,626,566Cash margins 16 56,336,663 53,517,975Borrowed funds 17 33,822,859 3,623,862Sundry provisions 18 588,506 952,789Provision for income tax 19 3,564,655 3,880,629Deferred tax liabilities 19 616,660 925,740Other liabilities 20 9,225,958 9,076,655 TOTAL LIABILITIES 573,281,078 559,874,508
OWNERS' EQUITYBank's ShareholdersAuthorized capital 21 100,000,000 100,000,000Subscribed and paid-up capital 21 100,000,000 85,250,000Payments on capital increase 21 - 14,116,574Statutory reserve 22 16,055,800 14,710,442General banking risks reserve 22 3,805,907 3,180,766Fair value reserve - net 23 330,893 1,035,208Retained earnings 24 14,315,943 13,129,048 TOTAL OWNERS' EQUITY (Bank Shareholders) 134,508,543 131,422,038Non-Controlling Interest 26 724,474 475,428 TOTAL OWNERS' EQUITY 135,233,017 131,897,466 TOTAL LIABILITIES AND OWNERS' EQUITY 708,514,095 691,771,974
THE ACCOMPANYING NOTES FROM (1) TO (47) CONSTITUTE AN INTEGRAL PART OF THESE CONSOLIDATED FINANCIAL STATEMENTS AND SHOULD BE READ WITH THEM.

Ann
ual R
epor
t 201
2
19
30th
Ann
ual R
epor
t
COMPREHENSIVE INCOMESTATEMENT Statement (B)
For the Year EndedDecember 31,
Note 2012 2011
JD JD
Interest income 27 45,587,043 41,458,023 Less: Interest expense 28 19,212,605 16,728,896 Net Interest Income 26,374,438 24,729,127 Net commissions income 29 4,922,370 4,309,221 Net Interest and Commissions Income 31,296,808 29,038,348 Income from foreign currency exchange 30 3,144,390 3,201,430 Income from financial assets at fair value through profit or loss 31 82,795 2,224,924
Cash dividends from financial assets at fair value through 626,311 515,445 Income from sale of financial assets at amortized cost
- 212,054
Other income 32 6,994,834 1,300,090 Gross Income 42,145,138 36,492,291
Employees expenses 33 8,843,199 7,100,213 Depreciation and amortization 11 & 12 1,942,118 1,570,810 Other expenses 34 4,756,331 4,391,094 Provision for impairment in direct credit facilities
10 2,943,308 11,168,207
Sundry provisions 13 &18 10,071,217 (1,388,000)Total Expenses 28,556,173 22,842,324
Net Income before Income Tax 13,588,965 13,649,967 Less: Income tax 19 2,336,594 4,054,414 Income for the Year 11,252,371 9,595,553
Attributable to:
Bank's Shareholders 11,218,390 9,594,044 Non-Controlling Interest 26 33,981 1,509
11,252,371 9,595,553
Basic and diluted earnings per Share 35 - /113 - /112
THE ACCOMPANYING NOTES FROM (1) TO (47) CONSTITUTE AN INTEGRAL PART OF THESE CONSOLIDATED FINANCIAL STATEMENTS AND SHOULD BE READ WITH THEM.

Ann
ual R
epor
t 201
2
20
30th
Ann
ual R
epor
t
CONSOLIDATED STATEMENT OF COMPREHENSIVE INCOME
For the Year Ended
20112012
JD JD
9,595,55311,252,371Income for the Year
Other Comprehensive Income Items:
(200,467)(775,699)Change in fair value reserve - net after tax
- 10,388 Income from sale of financial assets through other comprehensive income
9,395,08610,487,060Total Other Comprehensive Income for the Year
Total Other Comprehensive Income attributable to
9,393,577 10,453,079 Bank shareholders
1,509 33,981 Non-controlling interest
9,395,08610,487,060
THE ACCOMPANYING NOTES FROM (1) TO (47) CONSTITUTE AN INTEGRAL PART OF THESE CONSOLIDATED FINANCIAL STATEMENTS AND SHOULD BE READ WITH THEM.
CO
NSO
LIDA
TED STA
TEMEN
T OF C
HA
NG
ES IN O
WN
ER'S EQ
UITY
Paid-up
Capital
Paym
entson C
apitalIncrease
Reserves
Cum
ulative C
hange in Fair
Value
Fair Value R
eserve R
etainedEarnings
Total Sahreholders
Equity A
ttributable To
Bank
Shareholders
Non-
Controlling Interest
Total Statutory
General
Banking R
isks
For the Year Ended Decem
ber 31, 2012JD
JDJD
JDJD
JDJD
JDJD
JD
Balance - beginning of the year
85,250,000 14,116,574
14,710,442 3,180,766
- 1,035,208
13,129,048 131,422,038
475,428 131,897,466
Income for the year
- -
- -
- -
11,218,390 11,218,390
33,981 11,252,371
Net change in the fair value reserve
- -
- -
- (775,699)
- (775,699)
- (775,699)
Gains
from
sale of
financial assets
through other comprehensive incom
e -
- -
- -
71,384 (60,996)
10,388 -
10,388
Total Other C
omprehensive Incom
e for the Year
- -
- -
- (704,315)
11,157,394 10,453,079
33,981 10,487,060
Non-C
ontrolling interests -
- -
- -
- -
- 215,065
215,065 Increase in paid-up capital (N
ote 21) 633,426
- -
- -
- -
633,426 -
633,426 Transferred to paid-up capital (N
ote 21)14,116,574
(14,116,574) -
- -
- -
- -
- D
ividends ( Note 24)
- -
- -
- -
(8,000,000)(8,000,000)
- (8,000,000)
Transferred to reserves -
- 1,345,358
625,141 -
- (1,970,499)
- -
- B
alance - End of the Year 100,000,000
- 16,055,800
3,805,907 -
330,893 14,315,943
134,508,543 724,474
135,233,017 For the Year Ended D
ecember 31, 2011
Balance - beginning of the year
77,500,000 -
13,331,959 3,211,949
3,630,749 -
9,746,611 107,421,268
173,919 107,595,187
Effect of early adoption of IFRS (9)
- -
- -
(3,630,749)1,235,675
2,885,693 490,619
- 490,619
Adjusted balance - beginning of the year
77,500,000 -
13,331,959 3,211,949
- 1,235,675
12,632,304 107,911,887
173,919 108,085,806
Income for the year
- -
- -
- -
9,594,044 9,594,044
1,509 9,595,553
Net change in the fair value reserve
- -
- -
- (200,467)
- (200,467)
- (200,467)
Total Other C
omprehensive Incom
e for the Year
- -
- -
- (200,467)
9,594,044 9,393,577
1,509 9,395,086
Non-C
ontrolling interests -
- -
- -
- -
- 300,000
300,000 Transferred to paid-up capital (N
ote 21)7,750,000
- -
- -
- (7,750,000)
- -
- P
rivate offering
for capital
increase (N
ote 21) -
14,116,574 -
- -
- -
14,116,574 -
14,116,574
Transferred to / (from) reserves
- -
1,378,483 (31,183)
- -
(1,347,300) -
- -
Balance - End of the Year
85,250,000 14,116,574
14,710,442 3,180,766
- 1,035,208
13,129,048 131,422,038
475,428 131,897,466
- Included in retained earnings is an amount of JD
4,552,123 as of Decem
ber 31, 2012 restricted by the instructions of the Central B
ank of Jordan against deferred tax assets (JD
2,131,456 as of Decem
ber 31, 2011).
- Retained earnings include an am
ount of JD 1,598,599 as of D
ecember 31, 2012 w
hich represents the effect of the early adoption of IFRS (9). These am
ounts are restricted and cannot be utilized unless realized through actual sale as instructed by the Jordan Securities C
omm
ission.
- Use of the general banking risks reserve is restricted and requires the prior approval of the C
entral Bank of Jordan.
THE A
CC
OM
PA
NYIN
G N
OTES FR
OM
(1) TO (47) C
ON
STITUTE A
N IN
TEGR
AL
PA
RT O
F THESE C
ON
SOLID
ATED
FINA
NC
IAL STA
TEMEN
TS AN
D SH
OU
LD B
E REA
D W
ITH TH
EM.
Statement (C)

CO
NSO
LIDA
TED STA
TEMEN
T OF C
HA
NG
ES IN O
WN
ER'S EQ
UITY
Paid-up
Capital
Paym
entson C
apitalIncrease
Reserves
Cum
ulative C
hange in Fair
Value
Fair Value R
eserve R
etainedEarnings
Total Sahreholders
Equity A
ttributable To
Bank
Shareholders
Non-
Controlling Interest
Total Statutory
General
Banking R
isks
For the Year Ended Decem
ber 31, 2012JD
JDJD
JDJD
JDJD
JDJD
JD
Balance - beginning of the year
85,250,000 14,116,574
14,710,442 3,180,766
- 1,035,208
13,129,048 131,422,038
475,428 131,897,466
Income for the year
- -
- -
- -
11,218,390 11,218,390
33,981 11,252,371
Net change in the fair value reserve
- -
- -
- (775,699)
- (775,699)
- (775,699)
Gains
from
sale of
financial assets
through other comprehensive incom
e -
- -
- -
71,384 (60,996)
10,388 -
10,388
Total Other C
omprehensive Incom
e for the Year
- -
- -
- (704,315)
11,157,394 10,453,079
33,981 10,487,060
Non-C
ontrolling interests -
- -
- -
- -
- 215,065
215,065 Increase in paid-up capital (N
ote 21) 633,426
- -
- -
- -
633,426 -
633,426 Transferred to paid-up capital (N
ote 21)14,116,574
(14,116,574) -
- -
- -
- -
- D
ividends ( Note 24)
- -
- -
- -
(8,000,000)(8,000,000)
- (8,000,000)
Transferred to reserves -
- 1,345,358
625,141 -
- (1,970,499)
- -
- B
alance - End of the Year 100,000,000
- 16,055,800
3,805,907 -
330,893 14,315,943
134,508,543 724,474
135,233,017 For the Year Ended D
ecember 31, 2011
Balance - beginning of the year
77,500,000 -
13,331,959 3,211,949
3,630,749 -
9,746,611 107,421,268
173,919 107,595,187
Effect of early adoption of IFRS (9)
- -
- -
(3,630,749)1,235,675
2,885,693 490,619
- 490,619
Adjusted balance - beginning of the year
77,500,000 -
13,331,959 3,211,949
- 1,235,675
12,632,304 107,911,887
173,919 108,085,806
Income for the year
- -
- -
- -
9,594,044 9,594,044
1,509 9,595,553
Net change in the fair value reserve
- -
- -
- (200,467)
- (200,467)
- (200,467)
Total Other C
omprehensive Incom
e for the Year
- -
- -
- (200,467)
9,594,044 9,393,577
1,509 9,395,086
Non-C
ontrolling interests -
- -
- -
- -
- 300,000
300,000 Transferred to paid-up capital (N
ote 21)7,750,000
- -
- -
- (7,750,000)
- -
- P
rivate offering
for capital
increase (N
ote 21) -
14,116,574 -
- -
- -
14,116,574 -
14,116,574
Transferred to / (from) reserves
- -
1,378,483 (31,183)
- -
(1,347,300) -
- -
Balance - End of the Year
85,250,000 14,116,574
14,710,442 3,180,766
- 1,035,208
13,129,048 131,422,038
475,428 131,897,466
- Included in retained earnings is an amount of JD
4,552,123 as of Decem
ber 31, 2012 restricted by the instructions of the Central B
ank of Jordan against deferred tax assets (JD
2,131,456 as of Decem
ber 31, 2011).
- Retained earnings include an am
ount of JD 1,598,599 as of D
ecember 31, 2012 w
hich represents the effect of the early adoption of IFRS (9). These am
ounts are restricted and cannot be utilized unless realized through actual sale as instructed by the Jordan Securities C
omm
ission.
- Use of the general banking risks reserve is restricted and requires the prior approval of the C
entral Bank of Jordan.
THE A
CC
OM
PA
NYIN
G N
OTES FR
OM
(1) TO (47) C
ON
STITUTE A
N IN
TEGR
AL
PA
RT O
F THESE C
ON
SOLID
ATED
FINA
NC
IAL STA
TEMEN
TS AN
D SH
OU
LD B
E REA
D W
ITH TH
EM.

Ann
ual R
epor
t 201
2
22
30th
Ann
ual R
epor
t
CONSOLIDATED STATEMENT OF CASH FLOWS
Note
For the Year EndedDecember 31,
2012 2011 JD JD
CASH FLOWS FROM OPERATING ACTIVITIES: Income for the year before income tax 13,588,965 13,649,967 Adjustments: Depreciation and amortization 11&12 1,942,118 1,570,810 Provision for impairment in credit facilities 10 2,943,308 11,168,207 Provision for employees end-of-service indemnity 18 1,427 - (Surplus) provision for lawsuits against the bank 18 (111,997) (1,465,000) (Recovered from) provision for contingent liabilities 18 (253,713) 77,000 Provision against balances related to irregular activities 13 10,435,500 - (Gains) on sale of property and equipment 32 (4,350,855) (3,273) (Gains) from sale of assets seized by the bank 32 (591,935) (13,524) Unrealized losses from valuation of financial assets at fair value through profit or loss 31 403,359 965,945
Net (income) interest expense (36,515) 95,561 Effect of exchange rate fluctuations on cash and cash equivalents 30 (102,127) (152,524)
Income before Changes in Assets and Liabilities 23,867,535 25,893,169 Net Changes in Assets and Liabilities: Decrease in deposits at banks and financial institutions (due after 3 months) 3,711,287 1,500,169 Decrease in financial asset at fair value through profit or loss 1,784,887 935,804 Decrease in financial derivatives 4,380 3,511 (Increase) in direct credit facilities (57,246,054) (10,902,415) (Increase) in other assets (18,442,221) (3,239,961) (Decrease) increase in customers deposits (11,545,020) 20,330,693 Increase in cash margins 2,818,688 15,191,617 (Decrease) increase in other liabilities (1,537,799) (3,241,174) Net Cash Flows (used in) from Operating Activities before Tax (56,584,317) 46,471,413 Income tax paid 19 (5,080,466) (6,264,040) Net Cash Flows (used in) from Operating Activities (61,664,783) 40,207,373
CASH FLOWS FROM INVESTING ACTIVITIES:Decrease in financial assets at fair value through other comprehensive income 164,189 -
Decrease in financial assets at amortized cost 37,814,263 13,780,803 and equipment and projects under construction 11 (1,171,177) (2,445,079)Proceeds from sale of property and equipment 9,131,865 27,880 (Purchases) of intangible assets 12 (497,545) (978,766)Net Cash Flows from Investing Activities 45,441,595 10,384,838
CASH FLOWS FROM FINANCING ACTIVITIES: Capital increase 633,426 - Dividends (8,000,000) - Proceeds from capital increase - 14,116,574 Increase (decrease) in borrowed funds 12,277,526 (3,933,782) Non- controlling interest 215,065 300,000 Net Cash Flows from Financing Activities 5,126,017 10,482,792 Effect of exchange rate fluctuations on cash and cash equivalents 30 102,127 152,524 Net (Decrease) Increase in Cash and Cash Equivalents (10,995,044) 61,227,527 Cash and cash equivalents - beginning of the year 100,204,861 38,977,334 Cash and Cash Equivalents - End of the Year 36 89,209,817 100,204,861
THE ACCOMPANYING NOTES FROM (1) TO (47) CONSTITUTE AN INTEGRAL PART OF THESE CONSOLIDATED FINANCIAL STATEMENTS AND SHOULD BE READ WITH THEM.
Ann
ual R
epor
t 201
2
23
30th
Ann
ual R
epor
t
NOTES TO THE CONSOLIDTAED FINANCIAL STATEMENTS
1. General
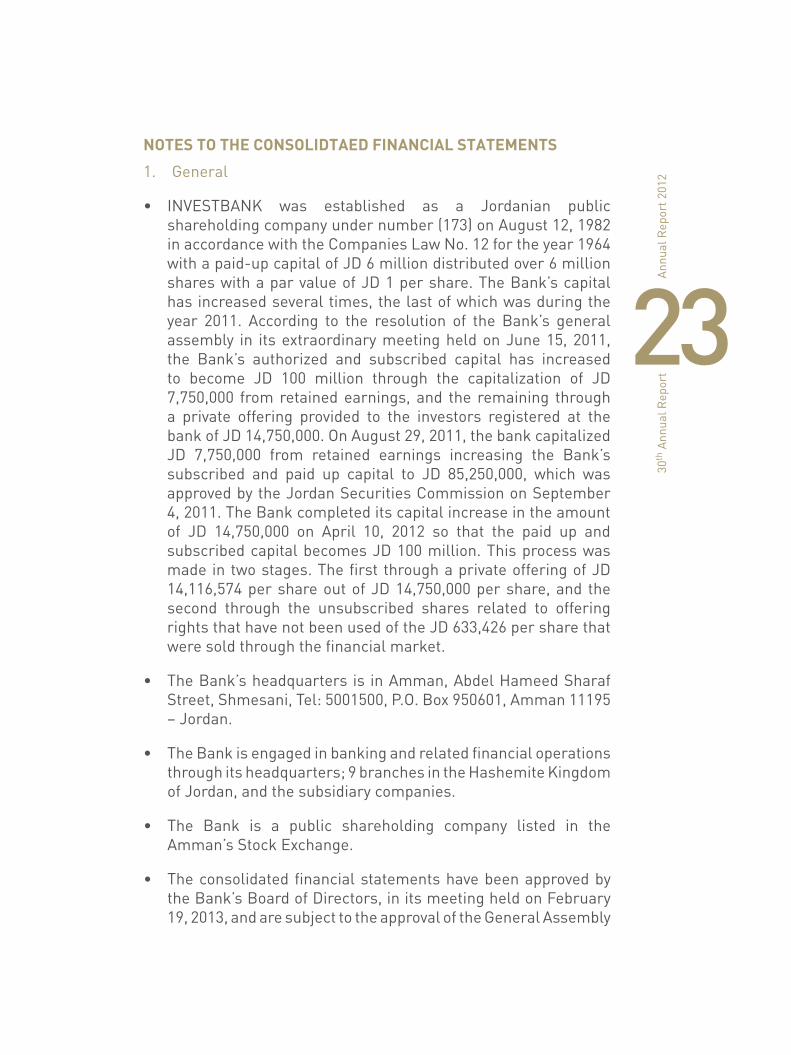
• INVESTBANK was established as a Jordanian publicshareholdingcompanyundernumber(173)onAugust12,1982inaccordancewiththeCompaniesLawNo.12fortheyear1964withapaid-upcapitalofJD6milliondistributedover6millionshareswithaparvalueofJD1pershare.TheBank’scapitalhasincreasedseveraltimes,thelastofwhichwasduringtheyear 2011. According to the resolution of the Bank’s generalassembly in itsextraordinarymeetingheldonJune15,2011,the Bank’s authorized and subscribed capital has increasedto become JD 100 million through the capitalization of JD7,750,000 fromretainedearnings, and the remaining througha private offering provided to the investors registered at thebankofJD14,750,000.OnAugust29,2011,thebankcapitalizedJD 7,750,000 from retained earnings increasing the Bank’ssubscribed and paid up capital to JD 85,250,000, which wasapprovedbytheJordanSecuritiesCommissiononSeptember4,2011.TheBankcompleteditscapitalincreaseintheamountof JD 14,750,000 on April 10, 2012 so that the paid up andsubscribedcapitalbecomesJD100million.Thisprocesswasmadeintwostages.ThefirstthroughaprivateofferingofJD14,116,574pershareoutofJD14,750,000pershare,and thesecond through the unsubscribed shares related to offeringrightsthathavenotbeenusedoftheJD633,426persharethatweresoldthroughthefinancialmarket.
• TheBank’sheadquarters is inAmman,AbdelHameedSharafStreet,Shmesani,Tel:5001500,P.O.Box950601,Amman11195–Jordan.
• TheBankisengagedinbankingandrelatedfinancialoperationsthroughitsheadquarters;9branchesintheHashemiteKingdomofJordan,andthesubsidiarycompanies.
• The Bank is a public shareholding company listed in theAmman’sStockExchange.
• TheconsolidatedfinancialstatementshavebeenapprovedbytheBank’sBoardofDirectors,initsmeetingheldonFebruary19,2013,andaresubjecttotheapprovaloftheGeneralAssembly

Ann
ual R
epor
t 201
2
24
30th
Ann
ual R
epor
t
ofShareholders.
2. Significant Accounting Policies
Basis of Presentation
• TheaccompanyingconsolidatedfinancialstatementsoftheBankanditssubsidiarycompaniesarepreparedinaccordancewiththestandardsissuedbytheInternationalAccountingStandardsBoard (IASB), interpretations issuedby theCommittee of theIASB,prevailinglocallawsandregulationsoftheCentralBankofJordan.
• The consolidated financial statements are prepared underthe historical cost convention except for financial assets atfair value throughprofitor loss,financial assetsat fair valuethroughothercomprehensiveincomeandfinancialderivativesthataremeasuredatfairvalueatthedateofpreparationoftheconsolidated financial statements. Moreover, hedged assetsandliabilitiesarestatedatfairvalue.
• ThereportingcurrencyoftheconsolidatedfinancialstatementsistheJordanianDinar,whichisalsothefunctionalcurrencyoftheBank.
• TheaccountingpoliciesforthecurrentyearareconsistentwiththoseusedintheyearendedDecember31,2011,exceptfortheeffectofadoptionofthenewandmodifiedstandardasinnote(47–a).
Basis of Consolidation
• The consolidated financial statements include the financialstatements of the Bank and the wholly owned subsidiarycompaniescontrolledby it.ControlexistswhentheBankhastheabilitytocontrolthefinancialandoperatingpoliciesofthesubsidiarycompaniesinordertoachievefinancialbenefitsoutof theiroperations.All inter-company transactions,balances,revenuesandexpensesbetweentheBankanditssubsidiariesareeliminated.

Ann
ual R
epor
t 201
2
25
30th
Ann
ual R
epor
t
Company’s Name Paid-up Capital Ownership Nature of
Operations Location Date of Acquisition
Al - Mawared for FinancialBrokerage Company
10,000,000 100٪Financial Brokerage Amman 2006
Tamkeen Leasing Company 5,000,000 90٪
Financial Leasing Amman 2006
Al Istethmari Letamweel
Selselat Al Imdad3,000,000 94٪
Management and Operation of Bonded Stores
Amman 2010
Jordan Factoring * 30,000 100٪
Factoring Accounts Receivable
Amman 2011
* The Company was established on December 21, 2011 and did not execute its operations yet at the date of the consolidated financial statements.
• The financial statements of the subsidiary relating to thesamefinancialyearoftheBankarepreparedusingthesameaccountingpoliciesadoptedbytheBank.IncasetheaccountingpoliciesappliedbythesubsidiarycompaniesaredifferentfromthoseadoptedbytheBank, thenecessaryadjustmentstothefinancialstatementsofthesubsidiarycompaniesaremadetocomplywiththeaccountingpoliciesusedbytheBank.
• Results of operations are consolidated in the consolidatedstatement of income from the date of acquisition whichrepresentsthedatewhencontroloverthesubsidiarycompaniesispassedontotheBank.Moreover,resultsofoperationsofthedisposed of subsidiary companies (if any) are consolidated intheconsolidatedstatementof incomeuntil thedisposaldate,whichrepresentsthedatewhentheBanklosescontroloverthesubsidiarycompanies.
• Non-controllinginterestrepresentsthatpartofthesubsidiary’sequitynotownedbytheBank.

Ann
ual R
epor
t 201
2
26
30th
Ann
ual R
epor
t
Segment Information
• Abusinesssegment isagroupofassetsoroperations jointlyengagedinprovidinganindividualproduct,serviceoragroupof related products or services subject to risks and returnsdifferentfromthoseofotherbusinesssegments.ItismeasuredaccordingtothereportsusedbytheGeneralManagerorotherkeydecision-makersattheBank.
• A geographical segment is a distinguishable component ofan entity engaged in providing products or services within aparticulareconomicenvironmentsubjecttorisksandreturnsdifferentfromthoseofcomponentsoperatinginothereconomicenvironments.
Financial Assets at Fair Value through Profit or Loss
• ItisthefinancialassetsheldbytheBankforthepurposeoftradinginthenearfutureandachievinggainsfromthefluctuationsinmarketpricesintheshorttermortradingmargins.
• Financialassetsatfairvaluethroughprofitorlossareinitiallystated at fair value at acquisition date (purchase costs arerecorded at the consolidated statement of income uponacquisition)andsubsequentlymeasuredatfairvalue.Moreover,changesinfairvaluearerecordedintheconsolidatedstatementof income including the change in fair value resulting fromtranslationofnon-monetaryassetsstatedatforeigncurrency.Gainsorlossesresultingfromthesaleofthesefinancialassetsaretakentotheconsolidatedstatementofincome.
• Dividendsandinterestsfromthesefinancialassetsarerecordedintheconsolidatedstatementofincome.
• Itisnotallowedtoreclassifyanyfinancialassetsto/fromthiscategoryexceptforthecasesspecifiedinInternationalFinancialReportingStandards.
• Itisnotallowedtoclassifyanyfinancialassetsthatdonothavepricesinactivemarketsandactivedealingsintheseitems.
• DirectCreditFacilities
• Representsfinancialassetsthathavefixedoragreedpayments

Ann
ual R
epor
t 201
2
27
30th
Ann
ual R
epor
t
thebanksubmittedinthefirstplaceandthesefinancialassetsdonothavequotedpricesinfinancialmarkets.
• Direct credit facilities are recorded at amortized cost afterdeductingtheprovisionforthedirectcreditfacilitiesandinterestandcommissionsinsuspense.
•
• A provision for the impairment in direct credit facilities isrecognizedwhen it is obvious that thefinancial assets of theBankcannotberecovered,thereisanobjectiveevidenceoftheexistenceofaneventnegativelyaffectingthefuturecashflowsofthedirectcreditfacilities,andtheimpairmentamountcanbeestimated.Theprovisionistakentotheconsolidatedstatementofincome.
• Interest and commissions on non-performing credit facilitiesaresuspendedinaccordancewiththeregulationsoftheCentralBankofJordan.
• Impaired credit facilities, for which specific provisions havebeen taken,arewrittenoffbycharging theprovisionafteralleffortshavebeenmade to recover theassets.Anysurplus intheprovisionsistakentotheconsolidatedstatementofincome,whiledebtrecoveriesaretakentoincome.
Financial Assets at Fair Value through Other Comprehensive Income
• Those financial assets represent the investments in equityinstrumentsheldforalongterm.
• Financial assets at fair value through other comprehensiveincomeareinitiallystatedatfairvalueplustransactioncosts.Subsequently, they are measured at fair value with gainsand losses arising from changes in fair value recognized inthe consolidated statement of other comprehensive incomeand within owner’s equity, including the changes in fairvalue resulting from translation of non-monetary assetsstated at foreign currency. Gain or loss from the sale ofthese investments should be recognized in the consolidatedstatementofcomprehensiveincomeandwithinowner’sequity,and the balance of the evaluation reserved for these assets

Ann
ual R
epor
t 201
2
28
30th
Ann
ual R
epor
t
shouldbe transferreddirectly to the retainedearningsnot totheconsolidatedstatementofincome.
• Noimpairmenttestingisrequiredforthoseassets.
• Dividendsarerecordedintheconsolidatedstatementofincome.
Financial Assets at Amortized Cost
• FinancialassetsatamortizedcostarethefinancialassetstheBank’smanagement intends according to its businessmodeltoholdforthepurposeofcollectingthecontractualcashflowswhichcomprisethecontractualcashflowssolelypaymentsofprincipalandinterestontheprincipaloutstanding.
• Financial assets are recorded at cost upon purchase plusacquisitionexpenses.Moreover,theissue’spremium/discountis amortized using the effective interest rate method, andrecorded to interest account. Provisions associated with thedecline in value of these investments leading to the inabilityto recover the investment or parts thereof arededucted.Anyimpairment is registered in the consolidated statement ofincome and should be presented subsequently at amortizedcostlessanyimpairmentlosses.
• Theamountoftheimpairmentlossrecognizedisthedifferencebetweentheasset’scarryingamountandthepresentvalueofestimatedfuturecashflowsdiscountedattheoriginaleffectiveinterestrate.
• It isnotallowedtoreclassifyanyfinancialassetsfrom/tothiscategoryexceptforcertaincasesspecifiedattheInternationalFinancialReportingStandards(andinthecaseofsellingthoseassetsbeforeitsmaturitydate,theresultsshouldberecordedinaseparateaccountintheconsolidatedstatementofincome.DisclosuresshouldbemadeinaccordancetotherequirementsofInternationalFinancialReportingStandards).
Fair Value
Fair value represents the closing market price (Acquisition of assets/Sale of liabilities) of financial assets and derivatives on the date of the consolidated financial statements. In case the declared market prices do not exist, active trading of some financial assets and derivatives is not available, or the market is inactive, fair value

Ann
ual R
epor
t 201
2
29
30th
Ann
ual R
epor
t
is estimated by one of several methods including the following:
• Comparisonwiththefairvalueofanotherfinancialassetwithsimilartermsandconditions.
• Analysisoftheestimatedfuturecashflowsanddiscountedcashflowsatcurrentratesapplicablefor itemswithsimilartermsandriskcharacteristics.
• Adoptionoftheoptionpricingmodels.
• Evaluation of long-term assets and liabilities that bears nointerestinaccordancetodiscountedcashflowsusingeffectiveinterest rate, premiums and discounts are amortized withininterest revenueor expense in the consolidated statement ofincome.
The evaluation methods aim to provide a fair value reflecting the expectations of the market, and take into consideration market factors, risks and expected benefits, at the time of evaluation of the financial instruments. In case the fair value of an investment cannot be measured reliably, it is stated at cost less any impairment.
Financial assets, the fair value of which cannot be reliably measured, are stated at cost less any impairment.
Impairment in the Value of Financial Assets
The Bank reviews the values of financial assets on the date of the consolidated statement of financial position in order to determine if there are any indications of impairment in their value individually or in the form of a portfolio. In case such indications exist, the recoverable value is estimated in order to determine the impairment loss.
Impairment is determined as follows:
• Impairment in financial assets recorded at amortized costrepresents the difference between the book value and thepresent value of the expected cash flows discounted at theoriginalinterestrate.
• mpairment in financial assets available for sale recorded atfairvalue(policyappliedbefore1January2011)representsthedifferencebetweenbookvalueandfairvalue.
Ann
ual R
epor
t 201
2
30
30th
Ann
ual R
epor
t
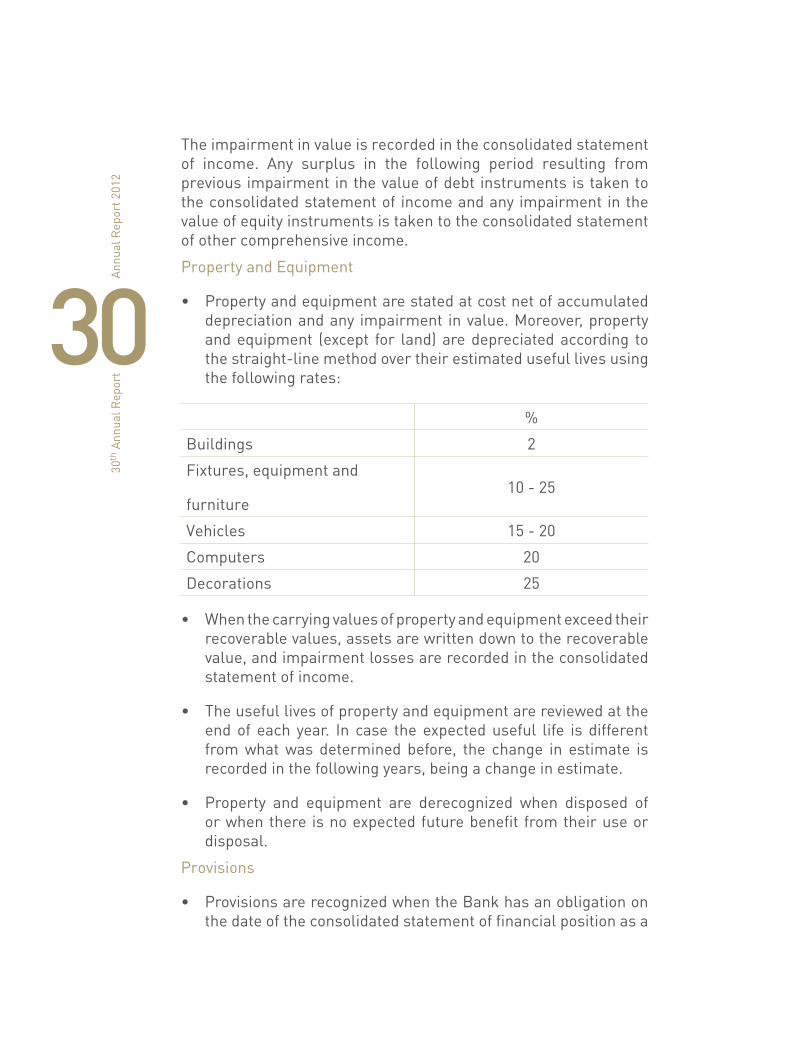
The impairment in value is recorded in the consolidated statement of income. Any surplus in the following period resulting from previous impairment in the value of debt instruments is taken to the consolidated statement of income and any impairment in the value of equity instruments is taken to the consolidated statement of other comprehensive income.
Property and Equipment
• Propertyandequipmentarestatedatcostnetofaccumulateddepreciationandany impairment invalue.Moreover,propertyandequipment (except for land)aredepreciatedaccording tothestraight-linemethodovertheirestimatedusefullivesusingthefollowingrates:
%
Buildings 2
Fixtures, equipment and
furniture10 - 25
Vehicles 15 - 20
Computers 20
Decorations 25
• Whenthecarryingvaluesofpropertyandequipmentexceedtheirrecoverablevalues,assetsarewrittendowntotherecoverablevalue,andimpairmentlossesarerecordedintheconsolidatedstatementofincome.
• Theusefullivesofpropertyandequipmentarereviewedattheend of each year. In case the expecteduseful life is differentfromwhatwas determined before, the change in estimate isrecordedinthefollowingyears,beingachangeinestimate.
• Property and equipment are derecognized when disposed oforwhenthere isnoexpectedfuturebenefit fromtheiruseordisposal.
Provisions
• ProvisionsarerecognizedwhentheBankhasanobligationonthedateoftheconsolidatedstatementoffinancialpositionasa

Ann
ual R
epor
t 201
2
31
30th
Ann
ual R
epor
t
resultofpastevents,itisprobabletosettletheobligation,andareliableestimateoftheamountoftheobligationcanbemade.
• ProvisionforEmployeesEnd-of-ServiceIndemnities
• The employees’ end-of-service indemnities provision iscalculatedatarateofonemonthperserviceyearforcontractedemployeesolderthan60yearsold.
• The required provision for end-of-service indemnities forthe year is recorded in theconsolidatedstatementof incomewhilepaymentstodepartingemployeesaredeductedfromtheprovisionamount.
• CostofIssuingorPurchasingBankShares
• Costs thatresult frompurchasingor issuingbanksharesarecharged to retainedearnings (netof the taxeffect relating tothose costs, if any). If the underwriting process or purchaseprocess was incomplete, these costs are charged to theconsolidatedstatementofincome.
Income Tax
• Income tax expenses represent accrued taxes and deferredtaxes.
• Incometaxexpensesareaccountedforonthebasisoftaxableincome.Moreover,taxableincomediffersfromincomedeclaredin the consolidated financial statements because the latterincludes non-taxable revenue or tax expenses not deductiblein the current year but deductible in subsequent years,accumulatedlossesacceptablebythetaxauthorities,anditemsnotacceptedfortaxpurposesorsubjecttotax.
• Taxes are calculated on thebasis of the tax rates prescribedaccordingtotheprevailinglaws,regulations,andinstructionsinJordan.
• Deferredtaxesaretaxesexpectedtobepaidorrecoveredasaresultoftemporarytimingdifferencesbetweenthevalueoftheassetsand liabilities in the consolidatedfinancial statementsandthevalueofthetaxableamount.Deferredtaxiscalculatedonthebasisoftheliabilitymethodintheconsolidatedstatementoffinancialpositionaccordingtotheratesexpectedtobeapplied

Ann
ual R
epor
t 201
2
32
30th
Ann
ual R
epor
t
whenthetaxliabilityissettledortaxassetsarerecognized.
• Deferredtaxassetsarereviewedasofthedateoftheconsolidatedfinancialstatements,andreducedincaseitisexpectedthatnobenefitwillarisetherefrom,partiallyortotally.
Accounts Managed on Behalf of Customers
This item represents the accounts managed by the Bank on behalf of its customers and is not part of the Bank’s assets. The fees and commissions for managing these accounts are shown in the consolidated statement of income. Furthermore, a provision is taken against the decline in the value of capital-guaranteed portfolios managed on behalf of customers.
Offsetting
Financial assets and financial liabilities are offset, and the net amount is reflected in the consolidated statement of financial position only when there are legal rights to offset the recognized amounts, the Bank intends to settle them on a net basis, or assets are realized and liabilitiesaresettledsimultaneously.
• RealizationofIncomeandRecognitionofExpenses
• Interestincomeisrealizedandexpensesarerecognizedusingthe effective interest rate method, except for interest andcommissiononnon-performingloanswhicharenotrecognizedas revenue but recorded in the interest and commission insuspenseaccountuntiltheyarereceivedincash.
• Expensesarerecognizedontheaccrualbasis.
• Commissionisrecordedasrevenuewhentherelatedservicesareprovided.
• Dividends are recorded when realized (decided upon by theGeneralAssemblyofShareholders).
Recognition of Financial Assets
Financial assets are recognized on the trading date which is the date the Bank commits itself to purchase or sell the financial assets.
Financial Derivatives and Hedge Accounting

Ann
ual R
epor
t 201
2
33
30th
Ann
ual R
epor
t
For hedge accounting purposes, financial derivatives are stated at fair value. Hedges are classified as follows:
• Fairvaluehedge:
Hedge for the change in the fair value exposures of the Bank’s assets andliabilities.
When the conditions of effective fair value hedge are met, theresulting gainor loss fromre-measuring the fair valuehedge isrecognizedintheconsolidatedstatementofincome.
Whentheconditionsofeffectiveportfoliohedgearemet,thegainor loss resulting from the revaluationof thehedging instrumentatfairvalueaswellasthechangeinthefairvalueoftheassetsorliabilitiesportfolioare recorded in theconsolidatedstatementofincomeforthesameperiod.
• Cashflowhedge:
Hedge for the change in the current and expected cash flow exposuresoftheBank’sassetsandliabilities.
Whenthe conditions of effective cash flow hedge are met, the gain or lossofthehedginginstrumentsisrecognizedintheconsolidated statement of other comprehensive income in owners’ equity.Suchgainor loss istransferredtotheconsolidatedstatementofincomeintheperiod inwhichthehedgetransaction impactstheconsolidatedstatementofincome.
• Hedgefornetinvestmentinforeignentities:
When the conditions of the hedge for net investment in foreignentitiesaremet,fairvalueismeasuredforthehedginginstrumentof the hedged net assets. In case of an effective relationship,the effective portion of the loss or profit related to the hedging instrument is recognized in the consolidated statement of othercomprehensive income and in owner’s equity. The ineffectiveportion is recognized in the consolidated statement of income.Theeffectiveportionisrecordedintheconsolidatedstatementofincomewhentheinvestmentinforeignentitiesissold.
When the conditions of the effective hedgedonot apply, gain orloss resulting from the change in the fair value of the hedging

Ann
ual R
epor
t 201
2
34
30th
Ann
ual R
epor
t
instrument is recordedintheconsolidatedstatementofincomeinthesameperiod.
Financial Derivatives for Trading
Thefairvalueoffinancialderivativesfortradingsuchasforwardforeign currency contracts, future interest rate contracts, swapagreements, and foreign currency options is recorded in theconsolidatedstatement of financial position under other assets or other liabilities as the casemaybe.Fairvalueismeasuredaccordingto theprevailingmarketprices,and if theyarenotavailable, themeasurementmethodshouldbedisclosed.Thechangeintheirfairvalueisrecognizedintheconsolidatedstatementofincome.
Repurchase and Resale Agreements
• Assets sold with a simultaneous commitment to repurchasethem at a future date continue to be recognized in theconsolidated financial statements as a result of the Bank’scontinuouscontrolover theseassetsandastherelatedrisksandbenefitsaretransferredtotheBankuponoccurrence.Theyalsocontinuetobemeasuredinaccordancewiththeadoptedaccountingpolicies.Amountsreceivedagainstthesecontractsare recorded within liabilities under borrowed funds. Thedifferencebetweenthesalepriceandtherepurchaseprice isrecognizedasaninterestexpenseamortizedoverthecontractperiodusingtheeffectiveinterestratemethod.
• Purchased assets with corresponding commitment to sell ata specific future date are not recognized in the consolidatedfinancialstatementsbecausetheBankhasnocontroloversuchassetsandtherelatedrisksandbenefitsarenottransferredtotheBankuponoccurrence.Paymentsrelatedtothesecontractsare recorded under deposits with banks and other financialinstitutionsorloansandadvancesinaccordancewiththenatureofeachcase.Thedifferencebetween thepurchasepriceandresalepriceisrecordedasinterestrevenueamortizedoverthelifeofthecontractusingtheeffectiveinterestratemethod.
Assets Seized by the Bank
Assets seized by the Bank are shown under «other assets» attheacquisition value or fair value, whichever is lower. As of the consolidated financialstatementsdate,theseassetsarerevalued

Ann
ual R
epor
t 201
2
35
30th
Ann
ual R
epor
t
individuallyat fair value.Anydecline in theirmarketvalue is taken to theconsolidated statement of income, whereas any such increase is notrecognized.Asubsequentincreaseistakentotheconsolidatedstatementofincometotheextentitdoesnotexceedthepreviouslyrecordedimpairment.
Intangible Assets
• Intangibleassetspurchasedinanacquisitionarestatedatfairvalueatthedateofacquisition.Intangibleassetspurchasedotherthanthroughacquisitionarerecordedatcost.
• Intangible assets are to be classifiedon thebasis of eitherdefinite orindefiniteusefullife.Intangibleassetswithdefiniteusefuleconomiclivesareamortizedovertheirusefullivesandrecordedasanexpenseintheconsolidatedstatementofincome.Intangibleassetswithindefinitelivesarereviewedforimpairmentasoftheconsolidatedfinancialstatementsdate, and impairment loss is treated in the consolidated statement ofincomeasanexpensefortheperiod.
• NocapitalizationofinternallygeneratedintangibleassetsresultingfromtheBank’soperationsismade.Theyareratherrecordedasanexpenseintheconsolidatedstatementofincomefortheperiod.
• Anyindicationsofimpairmentinthevalueofintangibleassetsasoftheconsolidatedfinancial statementsdateare reviewed.Furthermore, theestimatedusefullivesoftheimpairedintangibleassetsarereassessed,andanyadjustmentismadeinthesubsequentperiod.
• The following is the accounting policy for each item of the intangibleassetsownedbytheBankanditssubsidiaries:
• Softwaresandcomputerprogramsareamortizedover theirestimatedusefuleconomiclivesatarateof20%annually.
Foreign Currency
• Transactions in foreigncurrenciesduring the yearare recordedat theexchangeratesprevailingatthedateofthetransaction.
• Financialassetsandfinancialliabilitiesdenominatedinforeigncurrenciesare translated at the average rates prevailing on the consolidatedstatementoffinancialpositiondateanddeclaredbytheCentralBankofJordan.
• Non-monetaryassetsand liabilitiesdenominated in foreigncurrencies

Ann
ual R
epor
t 201
2
36
30th
Ann
ual R
epor
t
andrecordedatfairvaluearetranslatedonthedatewhentheirfairvalueisdetermined.
• Gainsorlossesresultingfromforeigncurrencytranslationarerecordedintheconsolidatedstatementofincome.
• Translationdifferencesonnon-monetaryassetsandliabilitiesdenominatedinforeigncurrenciesarerecordedaspartofthechangeinfairvalue.
• CashandCashEquivalents
CashandcashequivalentscomprisecashbalanceswiththeCentralBankofJordan and balances with banks and financial institutions maturing within three months, less balances due to banks and financial institutionsmaturingwithinthreemonthsandrestrictedfunds.
3.Accounting Estimates
Preparation of the consolidated financial statements and theapplicationoftheaccountingpoliciesrequiretheBank’smanagementtoperformassessmentsandassumptionsthataffecttheamountsoffinancialassetsandliabilities,fairvaluereserveandthedisclosureof contingent liabilities. Moreover, these assessments and assumptions affect revenues, expenses, provisions, and changes in the fairvalueshownwithintheconsolidatedstatementofothercomprehensive income. In particular, this requires the Bank’smanagement to issue significant judgments and assumptionsto assess future cashflowamountsand their timing. Moreover,thesaidassessmentsarenecessarilybasedonassumptionsandfactorswithvaryingdegreesofconsiderationanduncertainty. Inaddition, actual resultsmay differ from assessments due to thechangesresultingfromtheconditionsandcircumstancesofthoseassessmentsinthefuture.
• AprovisionissetagainstthelawsuitsraisedagainsttheBank.Thisprovision is subject to anadequate legal studypreparedby the Bank’s legal advisors. Moreover, the study highlightspotentialrisksthattheBankmayencounterinthefuture.Suchlegalassessmentsarereviewedperiodically.
• Aprovisionforperformingandnon-performingloansistakenonthebasesandestimatesapprovedbytheBank’smanagement

Ann
ual R
epor
t 201
2
37
30th
Ann
ual R
epor
t
inconformitywithInternationalFinancialReportingStandards(IFRS).TheoutcomeofthesebasesandestimatesiscomparedagainsttheadequacyoftheprovisionsaspertheCentralBankof Jordan’s instructions. The strictest outcome that conformsto International Financial Reporting Standards is used fordeterminingtheprovision.
• Impairment loss (if any) is booked after sufficient and recentevaluations of the assets seized by the Bank have beenconducted by approved surveyors. The impairment loss isreviewedperiodically.
• Managementperiodicallyreassessestheeconomicusefullivesoftangibleandintangibleassetsforthepurposeofcalculatingannual depreciation and amortization based on the generalcondition of these assets and the assessment of their usefuleconomiclivesexpectedinthefuture.Impairmentloss(ifany)istakentotheconsolidatedstatementofincome.
• Management frequently reviews thefinancial assets statedatcosttoestimateanydeclineintheirvalue.Impairmentloss(ifany) is taken to the consolidated statement of income as anexpensefortheyear.
• Managementestimatestheimpairment infairvaluewhenthemarketvaluereachesacertainlimitindicativeoftheamountofimpairment loss,whichdoesn’t conflictwith the InternationalFinancial Reporting Standards and the instructions of theRegulatoryauthorities.
• FairValueHierarchy
• TheBankdeterminesanddiscloses the level in the fairvaluehierarchyintowhichthefairvaluemeasurementsarecategorisedin their entirety, segregating fair value measurements inaccordance with the levels defined in IFRS. Differentiatingbetween Level 2 and Level 3’s fair valuemeasurements, i.e.,assessing whether inputs are observable and whether theunobservableinputsaresignificantmayrequirejudgmentanda careful analysis of the inputs used to measure fair value,includingconsiderationoffactorsspecifictotheassetorliability.
• Webelievethatourestimatesadoptedinthepreparationoftheconsolidatedfinancialstatementsarereasonable.
4. Cash and Balances at the Central Bank

Ann
ual R
epor
t 201
2
38
30th
Ann
ual R
epor
tThis item consists of the following:
December 31,
2012 2011
JD JD
Cash in vaults 6,158,075 5,348,665
Balances at the Central Bank:
Current and demand accounts 5,997,217 -
Term and notice deposits 4,000,000 6,500,000
Mandatory cash reserve 31,390,145 27,517,906
Total 47,545,437 39,366,571
- Except for the mandatory cash reserve, there are no restricted balances as of December 31, 2012 and 2011.
5. Balances at Banks and Financial Institutions This item consists of the following:
DescriptionLocal Banks & Financial
Institutions December 31,
Banks & Financial Institutions Abroad
December 31,
TotalDecember 31,
2012 2011 2012 2011 2012 2011
JD JD JD JD JD JD
Current and demand accounts
61,169 63,131 27,920,687 36,975,132 27,981,856 37,038,263
Deposits due within 3 months
13,545,000 18,545,000 29,103,226 23,525,319 42,648,226 42,070,319
Total 13,606,169 18,608,131 57,023,913 60,500,451 70,630,082 79,108,582
- Non-interest bearing balances at banks and financial institutions amounted to JD 14,516,645 as of December 31, 2012 against JD 8,536,930 as of December 31, 2011.
- There are no restricted balances as of December 31, 2012 and 2011.

Ann
ual R
epor
t 201
2
39
30th
Ann
ual R
epor
t
6. Deposits at Banks and Financial Institutions
This item consists of the following:
Description
Local Banks & Financial Institutions
December 31,
Banks & Financial Institutions Abroad
December 31,
TotalDecember 31,
2012 2011 2012 2011 2012 2011
JD JD JD JD JD JD
Deposits - - 230,778 3,942,065 230,778 3,942,065
Total - - 230,778 3,942,065 230,778 3,942,065 - There are no restricted deposits as of December 31, 2012 and 2011.
7. Financial Assets at Fair Value through Profit or Loss
This item consists of the following:
December 31,
2012 2011
JD JD
Companies shares 6,182,164 6,998,040
Bonds 3,173,006 4,546,002
Investment funds * 234,766 234,140
Total 9,589,936 11,778,182
* This item represents investment in funds located in Britain, Bahrain and Luxemburg and is not capital guaranteed.
8. Financial Assets at Fair Value through Other Comprehensive Income
This item consists of the following:
December 31,
2012 2011
JD JD
Quoted shares 10,265,971 11,364,385
Unquoted shares * 1,908,740 2,041,676
Total 12,174,711 13,406,061
* The fair value of the unquoted shares has been valued using the equity method which

Ann
ual R
epor
t 201
2
40
30th
Ann
ual R
epor
t
is considered the best method to valuate such investments.
- Cash dividends on investments amounted to JD 626,311 for the year ended December 31, 2012 ( JD 515,445 for the year ended December 31,2011)
- Realized losses on the sale of shares at fair value through other comprehensive income amounted to JD 60,996 for the year ended December 31, 2012 which was directly recorded under retained earnings in owner’s equity.
9. Financial Assets at Amortized Costs
The details of this item are as follows:
December 31,
2012 2011
JD JD
Quoted financial assets:
Governmental bills * 87,127,200 99,024,247
Governmental bonds or bonds guaranteed by the government - 17,500,804
Total Quoted Available-for-sale Financial Assets 87,127,200 116,525,051
Unquoted Financial Assets:
Governmental bills 4,617,258 12,634,109
Governmental bonds or bonds guaranteed by the government 2,001,358 2,002,078
Companies bonds and debentures 11,648,664 12,047,505
Total Unquoted Financial Assets 18,267,280 26,683,692
Total Financial Assets at Amortized Cost 105,394,480 143,208,743
Bonds and Bills analysis:
Fixed return 105,394,480 143,208,743
Total 105,394,480 143,208,743

Ann
ual R
epor
t 201
2
41
30th
Ann
ual R
epor
t
* Governmental bills include an amount of JD 17.9 million for bonds used against borrowings from the Central Bank of Jordan as per the repurchase agreement which is used for temporary financing activities due on January 6, 2013.
10 . Direct Credit Facilities - Net
This item consists of the following:
December 31,
2012 2011
JD JD
Overdraft 10,203,411 11,698,281
Loans and promissory notes* 26,073,742 29,423,289
Credit Cards 2,441,044 1,682,340
Real estate loans 72,299,850 60,882,502
Companies
Large Companies
Overdraft 61,568,158 55,834,119
Loans and promissory notes* 223,725,569 195,075,296
Medium and small companies
Overdraft 12,522,958 10,366,955
Loans and promissory notes* 37,163,542 20,723,575
Government and public sector - 891,122
Total 445,998,274 386,577,479
Less: Provision for impairment in direct credit facilities 33,894,449 31,315,775
Suspended interest 7,792,557 5,253,182
Net Direct Credit Facilities 404,311,268 350,008,522
* Net after deducting interest and commissions received in advance of JD 4,470,815 as of December 31, 2012 against JD 5,008,566 as of December 31, 2011.
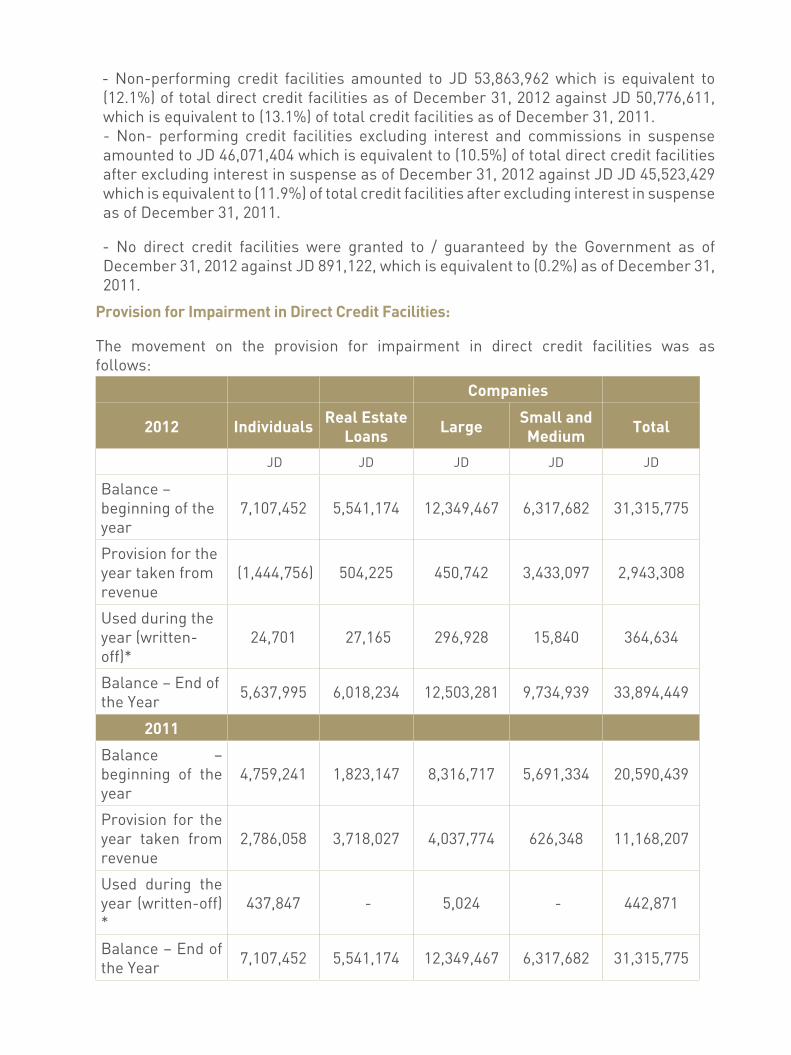
- Non-performing credit facilities amounted to JD 53,863,962 which is equivalent to (12.1%) of total direct credit facilities as of December 31, 2012 against JD 50,776,611, which is equivalent to (13.1%) of total credit facilities as of December 31, 2011. - Non- performing credit facilities excluding interest and commissions in suspense amounted to JD 46,071,404 which is equivalent to (10.5%) of total direct credit facilities after excluding interest in suspense as of December 31, 2012 against JD JD 45,523,429 which is equivalent to (11.9%) of total credit facilities after excluding interest in suspense as of December 31, 2011.
- No direct credit facilities were granted to / guaranteed by the Government as of December 31, 2012 against JD 891,122, which is equivalent to (0.2%) as of December 31, 2011.
Provision for Impairment in Direct Credit Facilities:
The movement on the provision for impairment in direct credit facilities was as follows:
Companies
2012 Individuals Real Estate Loans Large Small and
Medium Total
JD JD JD JD JD
Balance – beginning of the year
7,107,452 5,541,174 12,349,467 6,317,682 31,315,775
Provision for the year taken from revenue
(1,444,756) 504,225 450,742 3,433,097 2,943,308
Used during the year (written-off)*
24,701 27,165 296,928 15,840 364,634
Balance – End of the Year 5,637,995 6,018,234 12,503,281 9,734,939 33,894,449
2011
Balance – beginning of the year
4,759,241 1,823,147 8,316,717 5,691,334 20,590,439
Provision for the year taken from revenue
2,786,058 3,718,027 4,037,774 626,348 11,168,207
Used during the year (written-off) *
437,847 - 5,024 - 442,871
Balance – End of the Year 7,107,452 5,541,174 12,349,467 6,317,682 31,315,775

- The provisions no longer needed due to settlements or repayments of debts and transferred against other debts amounted to JD 9,739,536 against
JD 4,610,121 for the previous year.
- The provision for impaired credit facilities representing underwatch and non-performing loans is calculated based on the individual customer and not the portfolio.
Interest in Suspense
- The movement on the interest in suspense is as follows:
2012 IndividualsReal
EstateLoans
CompaniesTotal
Large Small and Medium
Balance – beginning of the year 1,167,208 1,169,623 1,934,111 982,240 5,253,182
Add: Interest in suspense for the year 403,898 1,501,153 1,529,183 291,261 3,725,495
Less: Interest taken to income 322,436 200,934 56,536 81,308 661,214
Interest in suspense written-off * 6,612 - 491,680 26,614 524,906
Balance - End of the Year 1,242,058 2,469,842 2,915,078 1,165,579 7,792,557
2011
Balance – beginning of the year 786,762 289,014 959,500 915,899 2,951,175
Add: Interest in suspense for the year 487,216 914,681 1,034,345 93,949 2,530,191
Less: Interest taken to income 78,741 34,072 59,734 27,608 200,155
Interest in suspense written-off * 28,029 - - - 28,029
Balance - End of the Year 1,167,208 1,169,623 1,934,111 982,240 5,253,182
* As per the decision of the board of directors and the board of directors of Al-Mawared (subsidiary company), non-performing credit facilities with their related interest in suspense have been written off for the amount of JD 889,540 during the year 2012 against JD 470,900 for the year 2011.
- Net credit facilities according to Geographical distribution and economic sector:

Ann
ual R
epor
t 201
2
44
30th
Ann
ual R
epor
t
Inside the Kingdom
December 31,
2012 2011
JD JD
Financial 107,629,460 50,538,268
Industrial and mining 77,356,891 85,890,976
Trading 103,561,715 102,369,887
Real estates 47,223,511 20,776,739
Constructions 34,602,702 47,306,949
Agricultural 6,895,033 5,136,606
Tourism, restaurants and public 28,664,444 25,657,430
Shares 23,240,183 27,767,593
Individuals / others 16,824,335 20,241,909
Government and public sector - 891,122
Total 445,998,274 386,577,479

11. Property and Equipment - Net
The details of this item are as follows:
Land Buildings
Furniture, Fixtures and Equipment Vehicles Computers Total
Year 2012
Cost:
Balance - beginning of the year 10,976,945 10,518,761 4,171,928 314,749 1,163,039 27,145,422
Additions - - 587,406 22,500 187,484 797,390
Disposals 3,983,196 1,610,706 118,931 30,000 - 5,742,833
Transfers - - 957,229 - 2,787 960,016
Balance - End of the year 6,993,749 8,908,055 5,597,632 307,249 1,353,310 32.159.995
Accumulated Depreciation:
Balance - beginning of the year - 1,225,758 2,225,708 148,720 409,096 4,009,282
Additions - 180,521 838,673 48,005 221,791 1,288,990
Disposals - 836,664 107,765 17,394 - 961,823
Balance - End of the year - 569,615 2,956,616 179,331 630,887 4,336,449
Net Book Value of Fixed Assets 6,993,749 8,338,440 2,641,016 127,918 722,423 18,823,546
Down payment for purchasing fixed assets & projects under construction*
- 1,418,431 1,246,892 - - 2,665,323
Net property & equipment 6,993,749 9,756,871 3,887,908 127,918 722,423 21,488,869
Year 2011
Cost:
Balance - beginning of the year 6,030,272 2,329,765 3,166,415 331,864 570,959 12,429,275
Additions - - 366,252 22,885 136,540 525,677
Disposals - - 17,030 40,000 - 57,030
Transfers 4,946,673 8,188,996 656,291 - 455,540 14,247,500
Balance - End of the year 10,976,945 10,518,761 4,171,928 314,749 1,163,039 27,145,422
Accumulated Depreciation:
Balance - beginning of the year - 1,082,608 1,498,767 115,470 247,635 2,944,480
Additions - 143,150 741,219 51,395 161,461 1,097,225
Disposals - - 14,278 18,145 - 32,423
Balance - End of the year - 1,225,758 2,225,708 148,720 409,096 4,009,282
Net Book Value of Fixed Assets 10,976,945 9,293,003 1,946,220 166,029 753,943 23,136,140
Down payment for purchasing fixed assets & projects under construction*
- 1,418,431 1,830,334 - 2,787 3,251,552
Net Book Value of Fixed Assets 10,976,945 10,711,434 3,776,554 166,029 753,730 26,136.140
- Property and equipment include an amount of JD 5,141,403 as of December 31, 2012 for fully depreciated assets against JD 5,311,293 as of December 31, 2011. * This item represents down payments for the purchase of furniture, fixtures and equipment for the purposes of the banks branch at Shmesani (new location) and its two branches at Emar Towers and abdoun which are still under construction as of the statement of financial position date.
Ann
ual R
epor
t 201
2
46
30th
Ann
ual R
epor
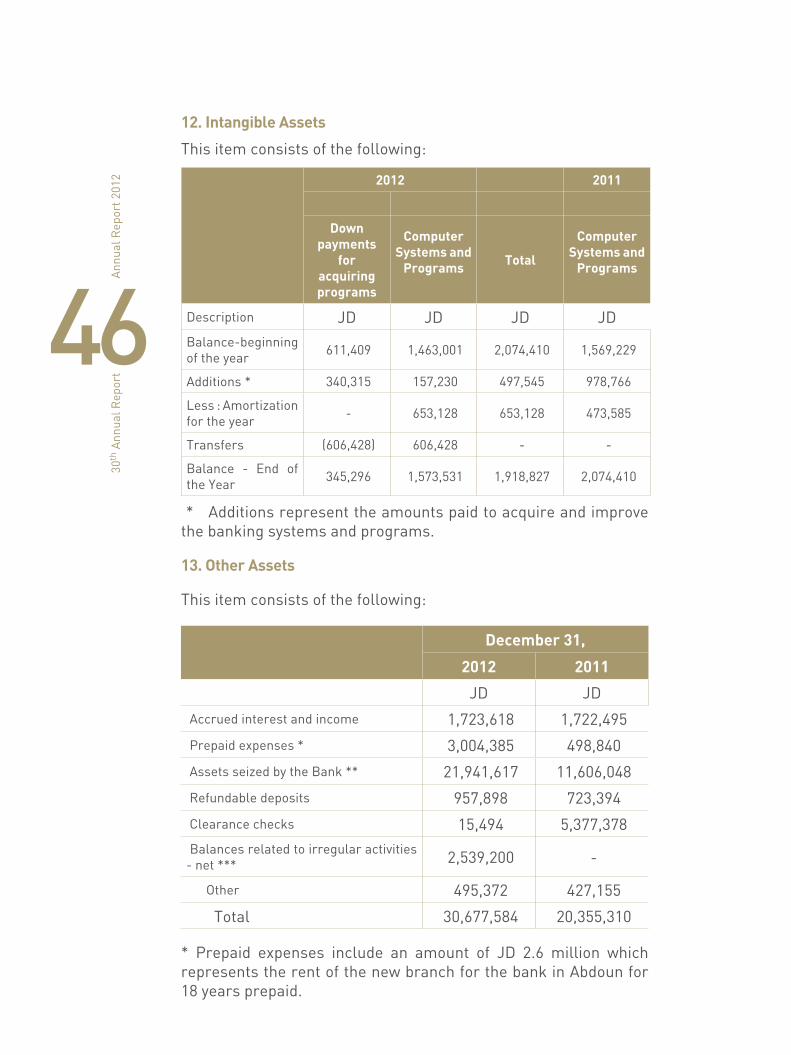
t12. Intangible Assets
This item consists of the following:
2012 2011
Down payments
for acquiring programs
Computer Systems and
Programs Total
Computer Systems and
Programs
Description JD JD JD JDBalance-beginning of the year 611,409 1,463,001 2,074,410 1,569,229
Additions * 340,315 157,230 497,545 978,766
Less : Amortization for the year - 653,128 653,128 473,585
Transfers (606,428) 606,428 - -
Balance - End of the Year 345,296 1,573,531 1,918,827 2,074,410
* Additions represent the amounts paid to acquire and improve the banking systems and programs.
13. Other Assets
This item consists of the following:
December 31,
2012 2011
JD JD
Accrued interest and income 1,723,618 1,722,495
Prepaid expenses * 3,004,385 498,840
Assets seized by the Bank ** 21,941,617 11,606,048
Refundable deposits 957,898 723,394
Clearance checks 15,494 5,377,378 Balances related to irregular activities - net *** 2,539,200 -
Other 495,372 427,155
Total 30,677,584 20,355,310
* Prepaid expenses include an amount of JD 2.6 million which represents the rent of the new branch for the bank in Abdoun for 18 years prepaid.

** According to the Banks Law, buildings and plots of land seized by the Bank against debts due from customers are to be sold within two years from the ownership date. For exceptional cases, the Central Bank of Jordan can extend this period for two consecutive years at maximum.
- The movement on assets (properties) seized by the Bank was as follows:
2012 2011
JD JD
Balance - beginning of the year 11,606,048 9,991,387
Additions 15,135,404 2,054,578
Disposals 4,885,479 492,296Retained of impairment of assets seized by the Bank 85,644 52,379
Balance - End of the Year 21,941,617 11,606,048
*** This item represents the net balances related to unusual transactions after deducting the provision booked against these balances as follows:
2012 2011
JD JD
Balance related to unusual transactions 12,974,700 - Less: Provision booked against this balance 10,435,500 -
2,539,200 -
- The bank was exposed to irregular activities in the cash accounts of the bank at other banks and financial institutions leading to the loss of amounts estimated in around JD 12,9 million which is mainly due to the probability of collusion between some of the bank’s employees and override of the control procedures and internal regulations.
The necessary legal procedures were taken by the bank’s management and a provision of JD 10,4 million was booked after deducting the estimated recoverable amount and the foreclosed assets.

14. Banks and Financial Institutions Deposits
This item consists of the following :
December 31, 2012 December 31, 2011
InsideJordan
OutsideJordan Total Inside
JordanOutsideJordan Total
JD JD JD JD JD JD
Current and demand accounts 879,944 3,164,287 4,044,231 1,096,146 2,256,146 3,352,292
Time deposits * - 7,000,000 7,000,000 - 14,918,000 14,918,000
Total 879,944 10,164,287 11,044,231 1,096,146 17,174,146 18,270,292
* This account does not include any amount due within a period exceeding 3 months as of December 31, 2012 and 2011.
15. Customers Deposits
This item consists of the following :
December 31, 2012
Individuals Large Companies
Small and Medium
Companies
Public Sector Total
JD JD JD JD JDCurrent and demand accounts 71,746,087 45,163,645 16,414,695 584,137 133,908,564
Saving deposits 5,078,819 104,734 96,956 874 5,281,383
Time deposits subject to notice 171,047,638 136,405,548 5,479,119 5,876,477 318,808,782
Deposits certificates - 82,817 - - 82,817
Total 247,872,544 181,756,744 21,990,770 6,461,488 458,081,546
December 31, 2011
Individuals Large Companies
Small and Medium
Companies
Public Sector Total
JD JD JD JD JD
Current and demand accounts 76,145,676 33,804,838 18,229,534 1,131,209 129,311,257
Saving deposits 874,907 9,760 65,945 857 951,469
Time deposits subject to notice 181,502,644 81,455,193 39,006,758 31,726,828 333,691,423
Deposits certificates 2,752,876 2,839,981 79,560 - 5,672,417
Total 261,276,103 118,109,772 57,381,797 32,858,894 469,626,566
- Public sector deposits inside Jordan amounted to JD 6,461,488 which is equivalent to (1.4%) of total customers deposits as of December 31, 2012 against JD 32,858,894, which is equivalent to (7%) of total customers deposits as of December 31, 2011.

- Non-interest bearing deposits amounted to JD 105,220,442 which is equivalent to (23%) of total customers deposits as of December 31, 2012 against JD 68,357,249, which is equivalent to (14.5%) of total customers deposits as of December 31, 2011.
- Restricted deposits amounted to JD 12,635,866, which is equivalent to (2.8%) of total customers deposits as of December 31, 2012 against JD 12,129,092, which is equivalent to (2.6)% as of December 31, 2011.
- Frozen deposits amounted to JD 16,617,976 as of December 31, 2012 against JD 12,199,986 as of December 31, 2011.
16. Cash Margins
This item consists of the following:
December 31,
2012 2011
JD JD
Cash margins on direct credit facilities 26,686,327 16,015,121Cash margins on indirect credit facilities 15,576,057 15,900,181
Marginal deposits 14,074,279 21,602,673
Total 56,336,663 53,517,975
Ann
aul R
epor
t 201
3
49
30th
Ann
ual R
epor
t

17. Borrowed Funds
This item consists of the following:
Number of Installments
Amount Total Remaining Frequency of Installments Guarantees Interest
Rate
Year 2012 JD JD %
Revolving loans - Jordan Ahli Bank * 3,140,061 1 1
One payment after 9 month from financing
- 8
Revolving loan - Abu Dhabi National Bank * 1,681,142 1 1 One payment
within May,2013 - 8
Overdraft - Jordan Capital Bank * 2,100,472 1 1 One payment on
May 25, 2013 - 8.5
Overdraft - Abu Dhabi National Bank * 479,713 1 1 One payment on
August 31, 2013 - 8
Jordan Mortgage Refinance Company * 500,000 1 1 One payment on
August 28, 2013 - 7.5
Jordan Mortgage Refinance Company 8,000,000 1 1
One payment on December 24,
2013
Treasury bills 8.45
Borrowing from the Central Bank of Jordan - As per the repurchase agreement
17,921,471 1 1 One payment on January 6, 2013
Treasury bills
4.25
Total 33,822,859
Year 2011
Revolving loan (Ahli Bank) 1,850,433 1 1
One payment after 9 month from financing
- 8
Overdraft (Abu Dhabi National Bank) 693,429 1 1 One payment on
August 31, 2012 - 8
Revolving loan (Abu Dhabi National Bank) 1,080,000 1 1 One payment
within May,2013 - 8
Total 3,623,862
- This item represents credit facilities overdraft accounts and revolving loans granted to the subsidiary companies (Al Mawared for Financial Brokerage, Tamkeen Leasing Company and Al-Istethmari LeTamweel Selselat Al Imdad) against the guarantee of the Company’s networth. - Fixed interest loans amounted to JD 26,421,471 and non-fixed interest loans amounted to JD 7,401,388.

18. Sundry Provisions
This item consists of the following:
Beginning Balance Additions Additions Returned
to IncomeEnding
Balance
JD JD JD JD JD
Year 2012Provision for employees end-of-service indemnity 3,823 1,427 - - 5,250
Provision for lawsuits against the Bank (Note 46/A) 695,253 185,503 - 297,500 583,256
Provision for contingent liabilities 253,713 - - 253,713 -
Total 952,789 186,930 - 551,213 588,506
Year 2011Provision for employees end-of-service indemnity 3,823 - - - 3,823
Provision for lawsuits against the Bank (Note 46/A) 2,160,253 300,000 - 1,765,000 695,253
Provision for contingent liabilities 176,713 77,000 - - 253,713
Total 2,340,789 377,000 - 1,765,000 952,789
19. Income Tax
A. Provision for income tax:
The movement on the provision for income tax was as follows:
2012 2011
JD JD
Beginning balance 3,880,629 5,430,588
Total income tax paid (5,080,466) (6,264,040)
Prior years' income tax 173,100 100,000
Income tax for the year 4,591,392 4,614,081
Ending Balance 3,564,655 3,880,629

Ann
ual R
epor
t 201
2
52
30th
Ann
ual R
epor
t
- Income tax for the year consists of the following:
2012 2011
JD JD
Income tax for the year 4,591,392 4,614,081
Prior years' income tax 173,100 100,000
Amortization of deferred tax liabilities (7,231) (544,380)
Deferred tax assets (3,455,708) (665,094)
Amortization of deferred tax assets 1,035,041 549,807
2,336,594 4,054,414
Tax status of the bank
- Income tax has been settled with the Income and Sales Tax Department up to the end of the year 2011. - Regarding the year 2012, the Bank has calculated the accrual income tax for the year and paid a percentage of semiannual income tax of JD 1,034,519. In the opinion of the bank’s management and its tax advisor, the tax liabilities do not exceed the provision booked as of December 31, 2012.
Tax status of Al-Mawared for financial brokerage company (subsidiary company)
- Income tax has been settled with the income and sales tax department up to the end of the year 2009. Moreover, the tax returns for the years 2010 and 2011 were submitted but the income and sales tax department has not yet reviewed the companys records. In the opinion of the bank’s management and its tax advisor, the tax liabilities do not exceed the provision booked. Regarding the year 2012, In the opinion of the bank’s management and its tax advisor, the tax liabilities do not exceed the provision booked as of December 31, 2012, the company has calculated the accrued income tax for the year and paid a percentage of semiannual income tax of JD 27,029. In the opinion of the company’s management and its tax advisor, the tax liabilities do not exceed the provision booked.
Tax status of Tamkeen Leasing Company (subsidiary company)
-Tamkeen Leasing company has not submitted its tax return for the period from inception on October 31, 2006 to December 31, 2007

Ann
ual R
epor
t 201
2
53
30th
Ann
ual R
epor
t
and for the years 2008 and 2009. In the opinion of management and the tax advisor, the Company will not have any
tax liabilities as it has not conducted any activities yet.
- The company submitted its tax return for the year 2010 and 2011 but the income and sales tax department has not yet reviewed the company,s records. In the opinion of management and the tax advisor, the Company will not have any tax liabilities as it has not conducted any activities yet.
Tax status of AL-Istethmari Letamweel Selselat Al Imdad (subsidiary company)
- The company has submitted its tax return for the period from inception on February 11, 2010 to December 31, 2010 and for the year 2011 but the income and sales tax department has not yet reviewed the company’s records. In the opinion of management and the tax advisor, the Company will not have any tax liabilities as it has incurred losses for the period.

b- Deferred Tax Assets / Liabilities:
The details of this item are as follows:
Accounts Included
2012 December 31,
Amounts 2011 2010
Beginning Balance Amounts
Released Additions EndingBalance
DeferredTax
DeferredTax
JD JD JD JD JD JD
1- Deferred Tax Assets
Provision for impairment in credit facilities ( before the year 2000) 513,316 - - 513,316 153,995 153,995
Provision for employees end-of-service indemnities 3,823 - 1,427 5,250 1,575 1,147
Provision for lawsuits against the Bank 695,253 297,500 185,503 583,256 174,977 208,576
Provision for debts under watch 3,262,454 3,066,993 - 195,461 58,638 978,736
Provision for impairment in assets seized by the Bank 846,920 85,643 - 761,277 228,383 254,076
Provision for impairment in financial brokerage 2,228,858 - 137,221 2,366,079 567,859 534,926
Provision against balances related to irregular activities - -
10,435,500
10,435,500 3.130.650
* -
Unpaid employees bonus for the year 2012 - - 706,320 706,320 211,896 -
Unpaid board of directors members bonus and ---- for the year 2012 - - 80,500 80,500 24,150 -
7,550,624 3,450,136 11,546,471 15,646,959 4,552,123 2,131,456
2- Deferred Tax Liabilities
Effect of early adoption of IFRS (9) 1,606,933 24,103 - 1,582,830 474,849 482,080
Change in fair value reserve 1,478,868 1,287,153 280,988 472,703 141,811 443,660
3,085,801 1,311,256 280,988 2,055,533 616,660 925,740
- Deferred tax liabilities include an amount of JD 141,811 as of December 31, 2012 (JD 443,660 prior year) which represents tax liabilities against gains on the evaluation of financial assets at fair value through other comprehensive income which is shown under fair value reserve in owners’ equity. In addition, there,s an amount of JD 474,849 as of December 31,2012 ( JD 482,080 prior year) for deferred tax liabilities on gain on financial assets at fair value through profit or loss which is shown under retained earnings as a result of the early adoption of IFRS (9).
* This item represents the deferred tax benefits expected from the provision booked against the balances related to the unusual transactions (note 13), and the management believes these amounts can be benefited from in the near futures.
- The movement on deferred tax assets / liabilities was as follows:

2012 2011
Assets Liabilities Assets Liabilities
JD JD JD JD
Beginning balance 2,131,456 925,740 2,016,169 1,556,035
Additions 3,455,708 84,296 770,177 316,909
Deductions 1,035,041 393,376 654,890 947,204
Ending Balance 4,552,123 616,660 2,131,456 925,740
C- The summary of the reconciliation between accounting profit and taxable profit is as follows:
2012 2011
JD JD
Accounting profit for the year 13,588,965 13,649,967
Non-taxable profit (11,885,050) (7,198,893)
Expenses not deductible for tax purposes 14,083,165 9,115,670
Taxable profit 15,787,080 15,566,744
Income tax percentage for the bank 30% 30%
Deferred taxes percentage for the bank 30% 30%
Income tax percentage for the subsidiary companies 24% 24%
Deferred tax percentage for the subsidiary companies 24% 24%

Ann
ual R
epor
t 201
2
56
30th
Ann
ual R
epor
t
20. Other Liabilities
This item consists of the following:
December 31,
2012 2011
JD JD
Brokerage receivable 1,063,231 722,132
Accepted and certified checks 1,070,866 1,145,357
Accrued interest 1,687,103 1,818,056
Various creditors 863,843 2,272,813
Shareholders' deposits 131,192 186,484
Deposits on safe deposit boxes 44,275 30,525
Credit accounts in suspense 20,886 21,935
Accrued expenses 1,112,962 1,032,525
Scientific research and vocational training 183,281 183,281
Scientific research and vocational training and technical fees
- 56,601
Board of Directors' remunerations 55,000 55,000
Other liabilities 2,993,319 1,551,946
Total 9,225,958 9,076,655
21. Paid-up Capital
Authorized and paid-up capital amounted to JD 100 million distributed over 100 million shares at a par value of JD 1 per share as of the end of the year 2012 (JD 88,250,000 million per share as of December 31, 2011).
The General Assembly decided in their extraordinary meeting held on June 15, 2011, to increase the bank’s capital up to the balance of the authorized and paid up capital from JD 85,250,000 per share to JD 100,000,000 million per share giving an increase of JD 14,750,000 through private offering of JD 14,750,000 shares at a par value of 1 JD per share for the registered investors at the bank. On April 10, 2012, the bank completed the capital increase in the amount of JD 14,750,000 to make the subscribed and paid up capital JD 100 million This process was made in two stages, the first throught a private offering of JD 14,116,574 per share out up JD 14,750,000 per share and the second through the unsubscribed shares related to offering rights that have not been used of JD 633,426 per share which were sold through the financial market.

Ann
ual R
epor
t 201
2
57
30th
Ann
ual R
epor
t
22. Reserves
The details of the reserves as of December 31, 2012 are as follows:
a- Statutory Reserve: This account represents the accumulated amount of appropriations from income before tax for prior years at 10% at the end of the year 2010 according to the Banks Law. This amount is not to be distributed to shareholders.
b- General Banking Risks Reserve T h i s item represents the general banking risks reserve according to the Central Bank of Jordan’s instructions.
c- The details of the restricted reserves are as follows:
ReserveDecember 31,
Nature of Restriction2012 2011
JD JD
Statutory reserve 16,055,800 14,710,442
Restricted according to the Banks Law
General banking risks
reserve3,805,907 3,180,766
Restricted according to the Central
Bank of Jordan
Regulations
23. Fair Value Reserve - Net
This item consists of the following:
December 31,
2012 2011
JD JD
Balance - beginning of the year 1,035,208 -
Effect of early adoption of IFRS (9) - 1,235,675
Deferred tax liabilities 301,849 85,915
Unrealized (losses) (1,077,549) (286,382)
Gains of sale of financial assets through other comprehensive income 71,384 -
Balance - End of the Year * 330,892 1,035,208
* The fair value reserve is presented as a net after deducting deferred tax liabilities of JD 141,810 as of December 31, 2012 against JD 443,660 as of December 31,2011.

Ann
ual R
epor
t 201
2
58
30th
Ann
ual R
epor
t
24. Retained Earnings
This item consists of the following:
December 31,
2012 2011
Balance - beginning of the year 13,129,048 9,746,611
Effect of early adoption of IFRS (9) - 2,885,693
Adjusted balance 13,129,048 12,632,304
Profit for the year 11,218,390 9,594,044
(Losses) of sale of financial assets through other comprehensive income (60,996) -
(Transferred) to reserves (1,970,499) (1,347,300)
Transferred to capital increase * - (7,750,000)
Dividends ** (8,000,000) -
Ending Balance 14,315,943 13,129,048
- Included in retained earnings is an amount of JD 4,552,123 restricted against deferred tax assets as of December 31, 2012 (JD 2,131,456 as of December 31, 2011).
- Retained earnings include an amount of JD 1,598,599 as of December 31, 2012 which represents the effect of early adoption of IFRS (9). These amounts are restricted amounts and cannot be utilized unless realized as instructed by the Jordan Securities Commission.
* During the year 2011, an amount of JD 7.75 million was capitalized from retained earnings, equivalent to 10.714% of capital as shares for the profits of 2010.
** The general assembly of shareholders decided to distribute dividends in an amount of JD 8 million from retained earnings for the year 2010.
25 - Proposed Dividends:
a. The Board of Directors decided to recommend to the General Assembly of Shareholders to distribute JD 8 million for the year 2012 equivalent to 8% of capital and is subject to the approval of the general assembly of shareholders. In addition, the General Assembly of Shareholders approved the Board of Directors’ recommendation in their extraordinary meeting to distribute JD 8 million for the year 2011, equivalent to 8% of capital.
26. Non-Controlling Interest
This item consists of the following:

Ann
ual R
epor
t 201
2
59
30th
Ann
ual R
epor
t
December 31, 2012 December 31, 2011
Non-Controlling
Interest Share
Non-Controlling
Interest Share of
Net Profit
Non- Controlling
Interest Share of
Net Assets
Non-Controlling
Interest Share
Non-Controlling
Interest Share of Net
(Loss)
Non- Controlling
Interest Share of
Net Assets
% JD JD % JD JDTamkeen leasing Company
10 20,963 527,638 10 (8,322) 291,678
Al-Istethmari LeTamweel Selselat Al Imdad
6 13,018 196,836 6 9,831 183,750
33,981 724,474 1,509 475,428
27. Interest Income
This item consists of the following:
2012 2011
JD JDDirect credit facilities:Individuals (retail):Overdraft 1,107,691 1,142,459Loans and promissory notes 3,100,839 3,272,588Credit cards 287,110 237,684
Real estate loans 5,719,720 5,123,583CompaniesLarge companiesOverdraft 6,729,639 5,071,767Loans and promissory notes 15,894,933 15,292,979Medium and small companiesOverdraft 1,606,684 1,314,483Loans and promissory notes 2,435,085 1,566,835Government and public sector 11,616 77,153Balances at the Central Bank of Jordan 47,455 - Balances and deposits at banks and financial institutions 432,609 337,989
Financial assets at fair value through profit or loss 202,647 267,678
Financial assets at amortized cost * 8,011,015 7,752,825 Total 45,587,043 41,458,023
* This item consists of JD 682,820 which represents the interest resulting from the repurchase agreement of the treasury bills.

Ann
ual R
epor
t 201
2
60
30th
Ann
ual R
epor
t
28. Interest Expense
This item consists of the following:
2012 2011
JD JD
Deposits at banks and financial institutions 555,476 548,555
Customers Deposits:
Current and demand accounts 1,506,870 1,674,879
Saving accounts 9,850 6,535
Time and notice deposits 14,642,200 12,249,067
Certificates of deposit 59,977 269,939
Cash margins 681,699 828,612
Borrowed funds * 804,761 219,103
Deposit guarantee fees 951,772 932,206
Total 19,212,605 16,728,896
* This item consist of JD 409,769 which represents the interest expense resulting from the repurchase agreement of the treasury bills.
29. Net Commissions Income
This item consists of the following:
2012 2011
JD JD
Commissions Income:
Direct credit facilities commissions 2,264,454 1,807,574
Indirect credit facilities commissions 1,968,416 1,807,537
Brokerage commissions 377,832 629,920
Other commissions 930,523 739,783
Total Commissions Income 5,541,225 4,984,814
Less: Commissions expense 618,855 675,593
Net Commissions Income 4,922,370 4,309,221

30. Income from Foreign Currency Exchange
This item consists of the following:
2012 2011
JD JD
Gains from foreign currencies trading / dealing 3,042,263 3,048,906
Gains from revaluation 102,127 152,524
Total 3,144,390 3,201,430
31. Income from Financial Assets at Fair Value through Profit or Loss
This item consists of the following:
Realized Gains Unrealized Dividends
(Losses) (Losses) Income Total
JD JD JD JD
Year 2012
Companies shares 60,630 (517,232) 404,956 (51,646)
Investment funds - (13,678) - (13,678)
Companies bonds and debentures 20,568 127,551 - 148,119
Total 81,198 (403,359) 404,956 82,795
Year 2011
Companies shares 2,772,671 (814,476) 424,170 2,382,365
Investment funds - (30,219) - (30,219)
Companies bonds and debentures (5,972) (121,250) - (127,222)
Total 2,766,699 (965,945) 424,170 2,224,924

32. Other Income
This item consists of the following:
2012 2011
JD JD
Rental of safe deposit boxes 18,930 14,210
Bonded income 482,778 432,122
Telex income 241,362 292,589
Income from sale of assets seized by the bank 591,935 13,524
Income from sale of property and equipment * 4,350,855 3,273
Recovered from written off debts 1,057,542 436,211
Other 251,432 108,161
Total 6,994,834 1,300,090
* A number of fixed assets for the bank have been sold which were represented in lands and buildings for the old head quarters for an amount of JD 9.1 million and which had a book value at the date of sale of JD 4.8 million for one of the Jordanian banks.
This transaction resulted in a gain of JD 4.3 million for the year ended December 31, 2012.
33. Employees Expenses
This item consists of the following:
2011 2010
JD JD
Salaries benefits, bonuses and employees' increments 7,691,934 6,172,342
Bank’s share in social security 711,630 558,366
Medical expenses 292,041 292,134
Per diems 6,823 3,895
Travel expenses 79,421 23,149
Training and research 36,421 30,685
Employees life insurance 24,929 19,642
Total 8,843,199 7,100,213

34. Other Expenses
This item consists of the following:
2012 2011
JD JD Rent 524,970 417,238 Stationery 153,662 113,432
Advertisements 495,205 461,270
Subscriptions and fees 532,173 637,984 Telecommunication and courier expenses 502,863 591,366 Maintenance, repair and programe liscences 866,686 311,401 Insurance expenses 64,820 55,636 Legal fees and expenses 118,419 116,155 Water, electricity and heating 350,322 173,818 Professional fees 219,671 272,271 Consultation expenses 180,552 453,378 Fine expenses 5,779 7,280 Board of Directors' transportation 66,890 55,821 Donations 112,990 83,331 Board of Directors' remunerations 55,000 51,667 Archiving expenses 38,400 45,980 Others 467,929 543,066 Total 4,756,331 4,391,094
35. Earnings Per Share for the Year Attributable Bank Shareholders
The details of this item are as follows:
2012 2011
Income for the year 11,218,390 9,594,044
Share Share
Weighted average number of shares * 99,155,174 85,250,000
JD/ Share JD/ Share
Earnings per share for the year attributable Bank shareholders - /113 - /112
* As mentioned in Note (1/A) the bank’s paid-up capital has been increased during the year ended December 31, 2012 to 100 million share on different periods and based on that, the weighted average number of shares has been calculated in accordance with IAS (33).

36. Cash and Cash Equivalents
The details of this items are as follows:
2012 2011
JD JD
Balances at the Central Bank due within 3 months 47,545,437 39,366,571
Add: Balances at banks and financial institutions due within 3 months 70,630,082 79,108,582
Less: Banks and financial institutions deposits due within 3 months 11,044,231 18,270,292
Borrowing from the Central Bank of Jordan due within three months 17,921,471 -
Cash and Cash Equivalents 89,209,817 100,204,861
37. Financial Derivatives
The details of financial derivatives outstanding at the end of 2012 is as follows:
Maturity of Nominal Value
Positive Fair Value
Negative Fair Value
Total Nominal Amounts
Within 3 Months
Form 3 Months up to 12 Months
From 1 Year up to
3 Years
More than 3 Years
Year 2012 JD JD JD JD JD JD JDTrading Derivatives:
Forward sales contracts in foreign currencies
- - - - - - -
- - - - - - -
Forward purchase contracts in foreign currencies
- - - - - -
- - - - - - -
Total - - - - - - -
- The nominal value represents the deals value outstanding at year-end and does not represent market risks or credit risks.
The details of financial derivatives outstanding at the end of 2011 is as follows:

Maturity of Nominal Value
Positive Fair Value
Negative Fair Value
Total Nominal Amounts
Within 3 Months
Form 3 Months up to 12 Months
From 1 Year up to
3 Years
More than 3 Years
Year 2011 JD JD JD JD JD JD JD
Trading Derivatives:
Forward sales contracts in foreign currencies
9,440 (293,270) 3,364,403 158,652 3,205,751 - -
9,440 (293,270) 3,364,403 158,652 3,205,751 - -
Forward purchase contracts in foreign currencies
297,430 (9,220) 3,366,052 158,616 3,207,436 -
297,430 (9,220) 3,366,052 158,616 3,207,436 - -
Total 306,870 (302,490) 6,730,455 317,268 6,413,187 - -
38. Related Parties Transactions
The consolidated financial statements include the financial statements of the bank and the subsidiary companies as follows:
Company’s Name Ownership Company›s Capital
2012 2011
% JD JD
Al-Mawared for financial brokerage 100 10,000,000 10,000,000
Tamkeen leasing Company 90 5,000,000 3,000,000
Al Istethemari Letamweel Selselat Al Imdad 94 3,000,000 3,000,000
Jordan factoring 100 30,000 -
The Bank entered into transactions with members of the Board of Directors, executive management, subsidiary companies and major shareholders within the normal banking practice ac ording to the commercial interest rates and commissions.All credit facilities granted to related party companies represent performing credit facilities and no provision has been taken thereon (except as mentione below). The following represents a summary of transactions with related parties during the year and previous year:

Total
Related Party December 31,
Subsidiary Companies
Board of Directors
Members and Executive
Management
Others (Employees, Employees Relatives, Relatives of Members
of the Board of Directors, Executive
Management and Controlled
Companies
2012 2011
JD JD JD JD JD
On-Financial Position Statement Items:
Credit facilities 1,141,564 8,154,182 36,545,983 45,841,729
43,062,043
Provision for impairment in credit facilities - - 1,140,254 1,140,254 1,087,856
Deposits and current accounts 1,119,314 3,864,066 27,067,475 32,050,855
23,483,842
Off-Financial Position Statement Items:
Letters of guarantee 46,721 - 1,039,726 1,086,447 1,289,576
Letters of credit 574,000 5,300 11,068,299 11,647,599
13,334,845
Statement of Income:
Interest and commissions received 66,226 593,043 3,059,128 3,718,397 2,764,205
Interest and commissions paid 68,212 128,865 936,341 1,133,418 904,320
Provision for impairment in credit facilities - 52,398 52,398 811,221
Additional Information
Underwatch credit facilities - - 13,833,087 13,833,087
14,481,609
Provision for underwatch credit facilities - - 207,496 207,496 217,125
Non-performing credit facilities - - 1,036,123 1,036,123 942,851
Provision for non-performing credit facilities - - 932,758 932,758 870,731
Interest in suspense - - 103,365 103,365 30,652
*Allthoseamountsandtransactionsareeliminatedfromtheconsolidatedfinancialstatementsandareshownforexplanatorypurposesonly.
Maximum credit interest rate 18% Maximum credit commission 1%
Minimum credit interest rate 3% noissimmoc tiderc muminim 0.5%
Maximum debit interest rate 4% Maximum debit Interest rate 0%

Thefollowingisasummaryoftheexecutivemanagementsalariesandbenefits
2012 2011
Salaries and benefits 1,350,101 1,313,298
39. Risk Management
General framework of Risk ManagementTheRiskManagementandComplianceCommitteehavesettheriskmanagementframeworkfortheBank.Moreover,theBoardofDirectorshasestablishedtheRiskManagementandComplianceCommittee,formedbytheBoardMembersandExecutiveManagement.Itsobjectiveistomonitorandcontrolthevariousrisks(creditrisks,operatingrisks,marketrisksandcompliancerisks)oranyotherriskstheBankmaygetexposedto.TheRiskManagementandComplianceCommittee’stasksareasfollows:1.Tosupervise themanagementof theriskpolicy,andensure that theRiskManagementand
ComplianceDepartmentachievesitsobjectivesaccordingtotheapprovedpolicies.2.To ensure appropriate and sufficient support for the Risk Management and Compliance
DepartmentinachievingitsobjectivesinaccordancewiththeapprovedpoliciesandproceduresandtheCentralBank’sinstructions.
3.To ensure the availability ofwork procedures for RiskManagement in compliancewith thevariousmanagementriskpoliciesattheBank.
4.Toverify theadoptionofnewmethods inmanagingandevaluatingtheBank’sriskssuchasstresstesting,what-ifanalysis,andeconomiccapital.
5.To determine the bases and principles of managing risks regarding risk acceptance, riskrejection,risktransferandriskmitigation.
6.ToreviewperiodicalreportsoftheRiskManagementandComplianceDepartment.7.ToensurethattheBankadherestotheCentralBankofJordaninstructions.The department manages the Bank’s various risks (credit risk, operating risk, market risk,compliancerisk,andotherrisks)withinthegeneralframeworkofRiskManagement.Theroleofthedepartmentcouldsummarizedasfollows:1.RiskIdentification.2.RiskAssessment.3.RiskControl/Mitigation.4.RiskMonitoring.InternalCapitalAdequacyAssessmentProcess:AccordingtotheinstructionsoftheCentralBankofJordan–BaselII(SecondPillar),andtoenabletheBanktoefficientlymanagetherisksitisexposedto,theBankhastoidentifytherisksmatrixthroughwhichtheacceptablerisk(riskappetite)foreachtypeofriskisspecified.TheamountoftheseriskswillbecalculatedaccordingtothemethodologyusedinBaselStandardII–i.e.tyingriskwithcapitalandspecifyingtheutilizedcapitalagainsteachtypeofrisk.Consequently,thehighertherisks,thegreatertheBank’sneedforcapitaltocovertheserisks.ThismethodologywillhelptheBankinconnectingriskappetitewithcapital,monitoringrisklimitstodeterminetheBank’sriskprofilesize,andperformamendmentstoreachthetargetedriskappetite.TheBankhasidentifiedtheriskstobemeasured,managed,andcontrolledasfollows:1.CreditRisk.2.MarketRisk.3.OperationalRisk.

Ann
ual R
epor
t 201
2
68
30th
Ann
ual R
epor
t
4.ConcentrationRisk:•CreditConcentrationRisk.•OtherConcentrationRisks
5.ResidualRisk:• From adopting credit risk mitigation through the standardmethod.•Fromapplyingthesimpleindicatormethodoftheoperatingriskaccount.•Fromusingthestandardmethodofthemarketriskaccount.
6.InterestRateRiskintheBankingBook.7.LiquidityRisk.8.StrategicRisk.9.ReputationRisk.10.BusinessCycle.11.ComplianceRisk.12.StressTest.
39. a. Credit RisksCreditrisksaredefinedastheprobabilityofnotfullyrecoveringthedebtorinterestinthespecifiedtimecausingfinanciallossestotheBank.Moreover, credit risk represents the major portion banks areexposedtoingeneral(representing60%or70%oftherisksbanksareexposedto).Inrecognitionofthisreality,theBankhasaccordedcredit risk management’s great significance through managingcreditrisksattheportfoliolevel,economicsectorlevel,grouplevel,orsinglecustomerlevel,takingintoconsiderationtheachievementofanappropriatereturnontheriskstheBankisexposedto.Toachievethis,basedontheriskmanagementstrategy,theBankhasperformedthefollowing:1. The risk appetite and ceilings are based on credit riskcommensuratewiththeacceptablerisklimitsadoptedbytheBoardofDirectorsandRisksandComplianceDepartment.Risklimitsaresetforeachclient,groupandeconomicsector,inordertomitigatetheBank’sexposuretocreditriskconcentrations.2.Ariskratingsystemisprepared. Itconsistsof12degreesandtakes into account all factors leading to increased credit risk fortheclient.Inaddition,ithelpstheBankdetectthecreditriskearlyonsothatitcanaddressandmitigatetheriskbeforeitincreases.Moreover, the Bank has signed an agreement with SUNGARDCompany for the purchase of an automated system to apply thissystem.

Ann
ual R
epor
t 201
2
69
30th
Ann
ual R
epor
t
3. Credit risk ismitigated through credit risk factors (collateralssuchasrealestate,sharesorother)commensuratewiththecreditriskfacedbytheBanktocoveranyunexpectedsubsequentevents.
4.Properlegalandcreditdocumentationisappliedforallconditionsassociatedwiththecreditfacilities.
Scheduled Debts:Thesedebtsaredebtspreviouslyclassifiedasnon-performingcreditfacilitiesbuttakenouttherefromaccordingtoproperscheduling.Theyhavebeenclassifiedas«debtsundercontrol»andamountedtoJD3,921,900asofDecember31,2012(againstJD14,895,919fortheyear2011).
Restructured Debts: Restructuring means rearranging credit facilities installmentsthrough increasing theirduration,postponingsome installments,or increasing the grace period. Restructured debts amounted toJD45,956,358fortheyear2012(againstJD17,334,040fortheyear2011).
3. Bonds, Bills, and DebenturesThefollowingtableillustratestheclassificationofbonds,bills,anddebenturesaccordingtoexternalratinginstitutions:
Total
Rating GradeRating
Institution
Within Financial Assets at
Fair Value through
Profit or Loss
Within Financial Assets at
Amortized Cost
JD JD JD
BB S&P 575,857 - 575,857
Unclassified 2,597,149 13,650,022 16,247,171
Governmental - 91,744,458 91,744,458
3,173,006 105,394,480 108,567,486

Ann
ual R
epor
t 201
2
70
30th
Ann
ual R
epor
t1. Credit risk exposure (less the impairment provision and interest in suspense and before guarantees and other risk - mitigating factors):
December 31,
2012 2011
On Financial Position statement Items: JD JD
Balances at the Central Bank 41,387,362 34,017,906
Balances at banks and financial institutions 70,630,082 79,108,582
Deposits at banks and financial institutions 230,778 3,942,065
Credit facilities:
Individuals 31,838,144 34,529,250
Real estate loans 63,811,774 54,171,705
Companies
Large companies 269,875,368 236,625,837
Small and medium institutions (SMEs) 38,785,982 23,790,608
Government and public sector - 891,122
Bonds, Bills and Debentures:
Financial assets at fair value through profit or loss 3,173,006 4,546,002
Financial assets at amortized cost 105,394,480 143,208,743
Financial derivatives instruments - 4,380
Other assets 5,685,901 2,944,729
Off Financial Position Statement Items:
Letters of guarantee 94,832,402 110,350,298
Letters of credit 24,482,091 23,968,299
Letters of acceptance 9,238,413 9,167,663
Unutilized facility ceilings 22,095,684 9,329,940
Total 781,461,467 770,597,129
To cover the above credit risk exposures, the Bank uses the following risk mitigating
factors within the conditions of the credit policy set by the Bank:
1. Cash collaterals.
2. Accepted bank letters of guarantee.
3. Real estate mortgages.
4. Listed shares collaterals.
5. Vehicles and equipment mortgages.

2. Credit exposures according to the degree of risk:
Credit exposures according to the degree of risk are distributed according to the following table:
Individuals Real
Estate Loans
Companies Government and Public
Sector
Banks and Other Financial
Institutions
Total Large Small and
Medium
December 31, 2012 JD JD JD JD JD JD JD Low risk 3,826,204 - 12,972,721 1,616,710 135,133,178 - 153,548,813
Acceptable risk 27,574,213 67,459,030 207,228,522 35,851,214 - 70,860,860 408,973,839
Of which is due:*
within 30 days 112,563 38,941 762,547 241,589 - - 1,155,640
from 31 to 60 days 205,628 418,647 1,652,368 304,859 - - 2,581,502
Under watch 2,022,082 1,256,317 49,851,824 2,983,047 - - 56,113,270
Non-performing:
Below level 123,974 336,256 26,980 583,806 - - 1,071,016
Allowance provided 32,211 38,569 474,778 2,751,855 - - 3,297,413
Bad debt 5,139,513 3,209,678 35,246,473 5,899,868 - - 49,495,532
Total 38,718,197 72,299,850 305,801,298 49,686,500 135,133,178 70,860,860 672,499,883
Less: Impairment provision 5,637,995 6,018,234 12,503,281 9,734,939 - - 33,894,449
Interest in suspense 1,242,058 2,469,842 2,915,078 1,165,579 - - 7,792,557
Net 31,838,144 63,811,774 290,382,939 38,785,982 135,133,178 70,860,860 630,812,877
- Credit exposures (financial assets and investments in financial assets) are distrusted according to the credit classification.
Credit Classification Government and public sector Financial institutions
(AAA to AA-) - 6,102,871
(A+to A-) - 36,096,524
(BBB+to B-) - 6,781,802
(BB+to B-) 135,133,178 13,682,079
Less than (B-) - -
not classified - 8,197,584
Total 135,133,178 70,860,860

Individuals Individuals
Real Estate Loans
Companies Government and Public
Sector
Banks and Other Financial
Institutions
Total Large Small and
Medium
December 31, 2011 JD JD JD JD JD JD JD Low risk 1,005,963 - 3,526,981 1,401,223 166,070,267 - 172,004,434
Acceptable risk 30,969,426 27,783,117 194,507,493 19,599,507 - 83,050,647 355,910,190
Of which is due:*
within 30 days 102,965 15,259 5,776,837 33,659 - - 5,928,720
from 31 to 60 days 74,896 235,092 1,121,151 78,562 - - 1,509,701
Under watch 2,594,929 20,443,048 48,195,834 4,424,840 - - 75,658,651
Non-performing:
Below level 542,185 374,890 137,633 196,056 - - 1,250,764
Allowance provided 1,370,171 1,055,898 5,403,667 920,391 - - 8,750,127
Bad debt 6,321,236 11,225,549 18,680,422 4,548,513 - - 40,775,720
Total 42,803,910 60,882,502 270,452,030 31,090,530 166,070,267 83,050,647 654,349,886
Less: Impairment provision 7,107,452 5,541,174 12,349,467 6,317,682 - - 31,315,775
Interest in suspense 1,167,208 1,169,623 1,934,111 982,240 - - 5,253,182
Net 34,529,250 54,171,705 256,168,452 23,790,608 166,070,267 83,050,647 617,780,929
- Credit exposures (financial assets and investments in financial assets) are distrusted according to the credit classification.
Credit Classification Government and public sector Financial institutions
(AAA to AA) - 28,573,085
(A+to A-) - 20,776,170
(BBB+to B-) - 8,379,479
(BB+ to B-) 166,070,267 -
Less than (B-) - -
not classified - 25,321,913
Total 166,070,267 83,050,647
* The whole debt balance becomes due when one of the installments or interest is due. Moreover, the overdraft account becomes due whenever it exceeds the ceiling.
- Credit exposures include credit facilities, balances and deposits at banks in addition to financial assets.

The following table breaks dow
n the fair value of collaterals held as security for credit facilities:
Com
panies
Total Individuals
Real
Estate Loans
Large Sm
all and M
edium
Governm
ent and P
ublic Sector
2012JD
JD
JD
JD
JD
JD
Gurantees against:
Low risk
3,826,204 -
12,972,721 1,616,710
- 18,415,635
Acceptable risk
14,620,162 46,953,211
97,346,683 3,365,269
- 162,285,325
Under w
atch 2,012,569
11,235,693 49,856,398
2,563,411 -
65,668,071
Non-perform
ing:
Below
level 65,365
653,987 2,956,365
985,636 -
4,661,353
Allow
ance provided 1,452,696
986,748 4,365,265
602,111 -
7,406,820
Bad debt
2,452,398 6,948,252
16,856,958 9,156,398
- 35,414,006
Total24,429,394
66,777,891184,354,390
18,289,535 -
293,851,210
Of it:
Cash m
argins 4,523,984
- 10,238,687
3,652,964 -
18,415,635
Accepted letters of
guarantee -
- -
- -
-
Real estate
13,652,698 66,777,891
163,689,837 13,625,045
- 257,745,471
Trade stocks 620,536
- 6,856,325
- -
7,476,861
Vehicles and equipment
5,632,176 -
3,569,541 1,011,526
- 10,213,243
Total24,429,394
66,777,891184,354,390
18,289,535293,851,210
4. Credit R
isk Exposure According to G
eographical Areas:

The following table breaks dow
n the fair value of collaterals held as security for credit facilities:
Com
panies
Total Individuals
Real
Estate Loans
Large Sm
all and M
edium
Governm
ent and P
ublic Sector
2011JD
JD
JD
JD
JD
JD
Gurantees against:
Low risk
1,005,963 -
3,526,981 1,401,223
- 5,934,167
Acceptable risk
14,526,966 41,647,111
86,125,368 5,633,258
- 147,932,703
Under w
atch 1,692,979
12,649,460 31,596,547
862,547 -
46,801,533
Non-perform
ing:
Below
level 75,896
489,667 516,847
- -
1,082,410
Allow
ance provided 1,789,652
853,694 2,563,964
633,389 -
5,840,699
Bad debt
2,011,589 1,523,647
11,027,741 8,255,636
- 22,818,613
Total 21,103,045
57,163,579 135,357,448
16,786,053 -
230,410,125
Of it:
Cash m
argins 1,005,963
- 3,526,981
1,401,223 -
5,934,167
Accepted letters of
guarantee -
- -
- -
-
Real estate
11,337,987 57,163,579
125,768,456 14,399,469
- 208,669,491
Trade stocks 3,906,400
- 4,365,425
- -
8,271,825
Vehicles and equipment
4,852,695 -
1,696,586 985,361
- 7,534,642
Total 21,103,045
57,163,579 135,357,448
16,786,053 -
230,410,125

Item
Geographical Area
TotalInside Jordan
Middle East
CountriesEurope Asia * America Other
Countries
JD JD JD JD JD JD JD
Balances at the Central Bank 41,387,362 - - - - - 41,387,362
Balances at banks and financial institutions 13,606,168 8,586,892 41,163,001 35,798 5,963,073 1,275,150 70,630,082
Deposits at banks and financial institutions - - 187,320 - - 43,458 230,778
Credit facilities:
Individuals 31,838,144 - - - - - 31,838,144
Real estate loans 63,811,774 - - - - - 63,811,774
Companies:
Large companies 269,875,368 - - - - - 269,875,368
Small and medium institutions (SMES) 38,785,982 - - - - - 38,785,982
Government and Public Sector - - - - - - -
Bonds, bills, and debentures:
Financial assets at fair value through profit or loss
575,857 2,249,739 - - - 347,410 3,173,006
Financial assets at amortized cost 105,394,480 - - - - - 105,394,480
Financial derivatives instruments - - - - - - -
Other assets 5,685,901 - - - - - 5,685,901
Total / the current year 570,961,036 10,836,631 41,350,321 35,798 5,963,073 1,666,018 630,812,877
Total / comparative figures 563,595,328 2,920,933 28,358,121 36,298 17,298,839 5,571,410 617,780,929
* Excluding Middle East Countries.

Exposure According to Econom
ic Sector:
Item
Economic Sector
TotalFinancial
IndustrialTrading and
ServicesR
eal Estate
Agricultural
SharesIndividuals
Governm
ent and P
ublic Sector
JDJD
JDJD
JDJD
JDJD
JD
Balances at the central bank
--
--
--
-41,387,362
41,387,362
Balances at banks and financial
institutions70,630,082
-70,630,082
Deposits at banks and financial
institutions230,778
--
--
--
-230,778
Credit facilities
99,965,63673,449,171
152,365,87538,212,365
6,109,53721,856,359
12,352,325-
404,311,268
Bonds, bills and debentures:
Financial assets at fair value through profit or loss
3,173,006-
--
--
--
3,173,006
Financial assets at amortized cost
998,664-
10,650,000-
--
-93,745,816
105,394,480
Financial derivatives instruments
--
--
--
--
-
Other assets
5,685,901-
--
--
--
5,685,901
Total for the current year180,684,067
73,449,171163,015,875
38,212,3656,109,537
21,856,35912,352,325
135,133,178630,812,877
Total/comparative figures
153,272,17383,514,156
110,798,46856,239,312
5,136,60614,193,316
28,556,633166,070,265
617,780,929
39. b. Operational R
isk
Operating risk is defined as “the loss resulting from
the failure or inadequacy of the internal procedures, the human factor and system
s, or from
external events including legal risks.
Operational risks at banks constitute from
15% to 20%
of the risks banks are exposed to. These risks directly or indirectly impact the
banks net profits through either decreasing the expected profits or increasing the expected expenses. To manage these risks, the B
ank has set up an autom
atic system for the identification of these risks, determ
ination of the adequacy of the internal control system and
procedures, and efficiency of the human elem
ent to mitigate these risks in addition to the identification of operating risks that confronted
the Bank or other banks in the past, and consequently, spotting the events causing them
. This is to enable the Bank to rem
edy them and
to benefit from the m
istakes causing these risks. In this regard, the Bank has im
plemented the follow
ing:

• Control & Risk Self Assessment (CRSA).
• Key Risk Indicator (KRI).
• Key Risk Driver (KRD).
Compliance Risk
This represents the risks that arise from the probability that the Bank may not comply with (violate / transgress) the prevailing laws, regulations, instructions, banks laws, and code of ethics issued by international and local regulatory authorities.
Compliance with the regulations and prevailing laws issued by the regulatory authorities represent one of the most important risks the Bank might be exposed to, due to the major financial losses resulting from the violation of the laws and instructions that affect the Bank's reputation. Moreover, the past few years witnessed many new regulations, instructions and laws organizing the work of the various institutions. Accordingly, the need for managing the compliance risk of the Bank is necessary. Moreover, compliance enhances the efficiency of managing risks and decreases the risk the Bank might be exposed to resulting from noncompliance with the prevailing laws and instructions.
39.c Market Risk
Market risk is potential losses that may arise from the changes in market prices such as the change in interest rates, foreign currency exchange rates, and prices of shares and products.
The Board of Directors has set limits for the acceptable risk levels for managing the financial portfolio market risks. Moreover, the Bank periodically applies the appropriate methodology to evaluate market risks and sets estimates for the probable economic losses based on a set of assumptions and changes in market conditions. The following are the methods used by the Bank to measure market risks:
1-Value at Risk (VaR)
2-Daily Earnings at Risk (DEaR)
3-Stress Testing
4- Scenario Analysis
c.1. Interest Rate Risk:
Interest rate risk results from the potential change in interest rates, and consequently, the potential impact on the cash flows or the fair value of financial instruments.
The Bank is exposed to interest rate risks as a result of the timing gaps of repricing assets and liabilities. These gaps are periodically monitored by the Assets and Liabilities Committee (ALCO). Moreover, various hedging methods are used to remain within the acceptable interest rate gap limits.
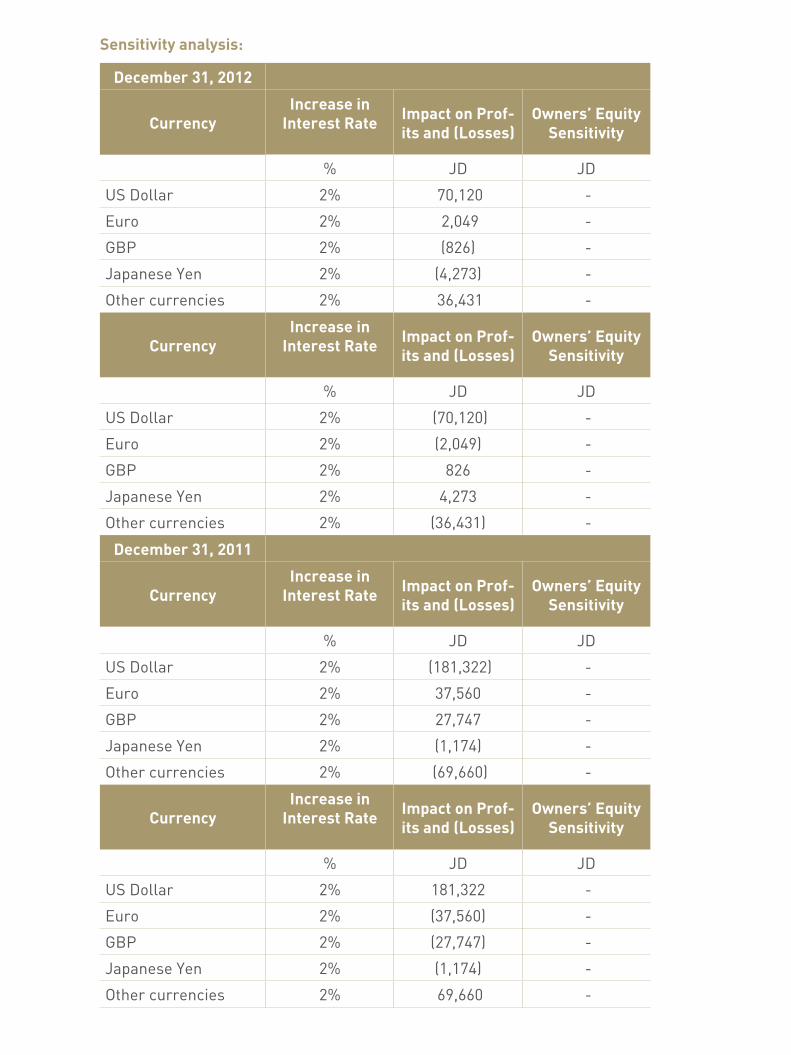
Sensitivity analysis:
December 31, 2012
CurrencyIncrease in
Interest Rate Impact on Prof-its and (Losses)
Owners’ Equity Sensitivity
% JD JD
US Dollar 2% 70,120 -
Euro 2% 2,049 -
GBP 2% (826) -
Japanese Yen 2% (4,273) -
Other currencies 2% 36,431 -
CurrencyIncrease in
Interest Rate Impact on Prof-its and (Losses)
Owners’ Equity Sensitivity
% JD JD
US Dollar 2% (70,120) -
Euro 2% (2,049) -
GBP 2% 826 -
Japanese Yen 2% 4,273 -
Other currencies 2% (36,431) -
December 31, 2011
CurrencyIncrease in
Interest Rate Impact on Prof-its and (Losses)
Owners’ Equity Sensitivity
% JD JD
US Dollar 2% (181,322) -
Euro 2% 37,560 -
GBP 2% 27,747 -
Japanese Yen 2% (1,174) -
Other currencies 2% (69,660) -
CurrencyIncrease in
Interest Rate Impact on Prof-its and (Losses)
Owners’ Equity Sensitivity
% JD JD
US Dollar 2% 181,322 -
Euro 2% (37,560) -
GBP 2% (27,747) -
Japanese Yen 2% (1,174) -
Other currencies 2% 69,660 -

c.2. Foreign Currencies Risk
a. The following table illustrates the currencies to which the Bank is exposed to, the potential and reasonable change in their rates against the Jordanian Dinar and the related impact on the consolidated statement of income. The currencies’ positions are monitored daily to ensure that they are within the determined limits. Moreover, the related reports are submitted to the Assets and Liabilities Committee and Board of Directors.
December 31, 2012
Currency
Change in Foreign
Currency Exchange Rate
Impact on Profits and
Losses
Impact on Owners’ Equity
% JD JD
Euro 5% 5,122 -
GBP 5% (2,064) -
Japanese Yen 5% (10,683) -
Other currencies 5% 91,078 -
December 31, 2011
Currency
Change in Foreign
Currency Exchange Rate
Impact on Profits and
Losses
Impact on Owners’ Equity
% JD JD
Euro 5% 93,902 -
GBP 5% 69,369 -
Japanese Yen 5% 2,935 -
Other currencies 5% 174,150 -

c.3. Risks of Changes in Shares Prices:
This represents the risk resulting from the decline in the fair value of the investment portfolio of the shares due to the changes in the value of the shares indicators and the change in the value of shares individually.
December 31, 2012
Indicator of Change in Indicator
Impact on Profit and Loss
Impact on Owners› Equity
JD JD
Amman Stock Exchange 5% 239,207 563,894
Palestine Stock Exchange 5% 44,215 44,842
December 31, 2011
Indicator of Change in Indicator
Impact on Profit and Loss
Impact on Owners› Equity
JD JD
Amman Stock Exchange 5% 325,268 472,339
Palestine Stock Exchange 5% 43,661 47,481

2012
Interest Rate R
epricing Gap
Less than O
ne Month
More than
1 Month U
p to 3 M
onths
3 Months
Up to 6
Months
More than
6 Months
Up to 1 Year
From 1
Year Up to 3
Years
More than 3 Years
Non-
Interest B
earing Item
s
Total
Assets:
JDJD
JDJD
JDJD
JDJD
Cash and balances at the central bank
- 4,000,000
- -
- -
43,545,43747,545,437
Balances at banks and financial institutions
56,113,437 -
- -
- -
14,516,64570,630,082
Deposits at banks and financial institutions
- -
187,320 43,458
- -
- 230,778
Financial assets at fair value through profit or loss -
- 680,807
- 1,911,379
580,820 6,416,930
9,589,936 Financial assets at fair value through other com
prehensive income
- -
- -
- -
12,174,711 12,174,711
Direct credit facilities - net
99,731,423 34,071,101
42,235,674 33,462,340
92,872,173100,965,889
972,668 404,311,268
Financial derivatives -
- -
- -
- -
- Financial assets at am
ortized cost 600,000
499,9212,999,891
23,233,26063,037,235
15,024,173 -
105,394,480 P
roperty and equipment - net
- -
- -
- -
21,488,86921,488,869
Intangible assets -
- -
- -
- 1,918,827
1,918,827 D
eferred tax assets -
- -
- -
- 4,552,123
4,552,123 O
ther assets -
- -
- -
- 30,677,584
30,677,584 Total A
ssets 156,444,860
38,571,022 46,103,692
56,739,058 157,820,787
116,570,882 136,263,794
708,514,095 Liabilities:D
eposits at banks and financial institutions11,044,231
- -
- -
- -
11,044,231 C
ustomers' deposits
157,234,79947,387,028
59,137,53190,012,598
- -
104,309,590458,081,546
Cash m
argins10,171,486
2,845,2125,727,750
2,467,474 32,223,702
- 2,901,039
56,336,663 B
orrowed funds
17,921,471 -
3,781,614 12,119,774
- -
- 33,822,859
Sundry provisions -
- -
- -
- 588,506
588,506 Incom
e tax provision -
- -
- -
- 3,564,655
3,564,655 D
eferred tax liabilities -
- -
- -
- 616,660
616,660 O
ther liabilities -
- -
- -
- 9,225,958
9,225,958 Total Liabilities
196,371,987 50,232,240
68,646,895 104,599,846
32,223,702 -
121,206,408 573,281,078
Interest Rate R
epricing Gap
(39,927,127) (11,661,218)
(22,543,203) (47,860,788)
125,597,085 116,570,882
15,057,386 135,233,017
2011 Total A
ssets 162,990,921
24,793,804 83,612,478
51,319,744 92,202,198
162,856,147 113,996,682
691,771,974 Total Liabilities
275,495,657 88,521,301
44,931,675 33,285,465
31,691,456 -
85,948,954 559,874,508
Interest Rate R
epricing Gap
(112,504,736) (63,727,497)
38,680,803 18,034,279
60,510,742 162,856,147
28,047,728 131,897,466

Concentration in foreign currencies risk:
2012 C
urrency (Equivalent in Jordanian Dinars)
US D
ollar Euro
Sterling P
ound Japanese
Yen O
thers Total
Assets
Cash and balances at the C
entral Bank
9,271,502 783,461
42,899 -
108,187 10,206,049
Balances at banks and financial institutions
40,600,287 3,509,990
15,115,575 26,158
1,316,903 60,568,913
Deposits at banks and financial institutions
43,457 187,320
- -
- 230,777
Financial assets at fair value through profit or loss 3,159,210
- 7,192
- 1,194,524
4,360,926 Financial assets at fair value through other com
prehensive incom
e 896,835
- -
- -
896,835
Direct credit facilities
45,699,938 3,044,609
- -
48,744,547
Other assets
13,050,086 17,515
16,245 12,489
6,312 13,102,647
Total Assets
112,721,315 7,542,895
15,181,911 38,647
2,625,926 138,110,694
Liabilities: 1,231,394
323,503 47,105
100 1,238,778
2,840,880
Deposits at banks and financial institutions
81,089,492 14,044,242
8,374,684 223,553
2,674,564 106,406,535
Custom
ers' deposits 23,212,981
- -
- -
23,212,981
Cash m
argins 213,425
1,794 4,534
- 7,145
226,898
Other liabilities
105,747,292 14,369,539
8,426,323 223,653
3,920,487 132,687,294
Total Liabilities
Net C
oncentration on-Financial Position for the C
urrent Year 6,974,023
(6,826,644) 6,755,588
(185,006) (1,294,561)
5,423,400 O
ff-Financial Position C
ontingent Liabilities for the Current
Year 48,506,276
12,222,139 1,246,450
3,692,435 1,184,452
66,851,752
2011
Currency (Equivalent in Jordanian D
inars)
US D
ollar Euro
Sterling P
ound Japanese
Yen O
thers Total
Assets:
Cash and balances at the C
entral Bank
8,147,385 494,186
185,318 -
68,232 8,895,121
Balances at banks and financial institutions
43,353,370 8,016,061
7,902,401 59,930
396,143 59,727,905
Deposits at banks and financial institutions
3,189,570 183,307
569,189 -
- 3,942,066
Financial assets at fair value through profit or loss
2,874,076 1,814,744
- -
1,044,829 5,733,649
Financial assets at fair value through other com
prehensive income
1,054,044 -
- -
- 1,054,044
Direct credit facilities
24,382,203 5,431,332
59 -
- 29,813,594
Other assets
735,589 100,754
22,219 -
6,923 865,485
Total Assets
83,736,237 16,040,384
8,679,186 59,930
1,516,127 110,031,864
Liabilities:
Deposit at banks and financial institutions
2,717,786 274,200
15,013 111
705,997 3,713,107
Custom
ers' deposits 63,066,803
13,300,790 7,203,333
1,122 4,254,151
87,826,199
Cash m
argins 26,994,906
585,483 68,964
- 22,100
27,671,453
Other liabilities
22,836 1,878
4,491 -
16,881 46,086
Total Liabilities 92,802,331
14,162,351 7,291,801
1,233 4,999,129
119,256,845
Net C
oncentration on-Financial Position for
the Current Year
(9,066,094) 1,878,033
1,387,385 58,697
(3,483,002) (9,224,981)
Off-Financial P
osition Contingent Liabilities
for the Current Year
123,783,702 30,691,157
219,750 -
1,733,016 156,427,625

Ann
ual R
epor
t 201
2
83
30th
Ann
ual R
epor
t
2011
Currency (Equivalent in Jordanian D
inars)
US D
ollar Euro
Sterling P
ound Japanese
Yen O
thers Total
Assets:
Cash and balances at the C
entral Bank
8,147,385 494,186
185,318 -
68,232 8,895,121
Balances at banks and financial institutions
43,353,370 8,016,061
7,902,401 59,930
396,143 59,727,905
Deposits at banks and financial institutions
3,189,570 183,307
569,189 -
- 3,942,066
Financial assets at fair value through profit or loss
2,874,076 1,814,744
- -
1,044,829 5,733,649
Financial assets at fair value through other com
prehensive income
1,054,044 -
- -
- 1,054,044
Direct credit facilities
24,382,203 5,431,332
59 -
- 29,813,594
Other assets
735,589 100,754
22,219 -
6,923 865,485
Total Assets
83,736,237 16,040,384
8,679,186 59,930
1,516,127 110,031,864
Liabilities:
Deposit at banks and financial institutions
2,717,786 274,200
15,013 111
705,997 3,713,107
Custom
ers' deposits 63,066,803
13,300,790 7,203,333
1,122 4,254,151
87,826,199
Cash m
argins 26,994,906
585,483 68,964
- 22,100
27,671,453
Other liabilities
22,836 1,878
4,491 -
16,881 46,086
Total Liabilities 92,802,331
14,162,351 7,291,801
1,233 4,999,129
119,256,845
Net C
oncentration on-Financial Position for
the Current Year
(9,066,094) 1,878,033
1,387,385 58,697
(3,483,002) (9,224,981)
Off-Financial P
osition Contingent Liabilities
for the Current Year
123,783,702 30,691,157
219,750 -
1,733,016 156,427,625

39. d. Liquidity Risk:
Liquidity risk represents the Bank’s inability to m
eet its obligations on their maturity dates. To w
ard off these risks, including the managem
ent of Assets and Liabilities,
matching and analyzing their m
aturities, matching the m
aturities of short and long-term assets and liabilities, diversifying sources of funds, and m
aintaining an adequate fund of cash and cash equivalents and m
arketable securities, liquidity is managed and review
ed periodically at different levels. According to the C
entral Bank
of Jordan instructions, the Bank m
aintains cash reserves to mitigate liquidity risks.
First : The following table illustrates the distribution of liabilities (undiscounted) on the basis of the rem
aining period to the contractual maturity at the date of the
financial statements.
Less than O
ne Month
More than 1
Month up to 3 M
onths
More than
3 Months up
to 6 Months
More than
6 Months up
to 1 Year
From 1 Year
Up to 3 Years
More than
3 Years
Non-Interest B
earing Item
s Total
2012JD
JDJD
JDJD
JDJD
JDLiabilities:D
eposits at
banks and
financial institutions 11,058,036
- -
- -
- -
11,058,036
Custom
ers' deposits 262,416,204
47,860,898 60,320,282
93,613,102 -
- -
464,210,486 C
ash margins
13,099,759 2,862,995
5,799,347 2,529,161
34,701,403 -
- 58,992,665
Borrow
ed funds 17,984,943
- 3,937,606
13,143,895 -
- -
35,066,444 Sundry provisions
- -
- -
- -
588,506 588,506
Income tax provision
3,564,655 -
- -
- -
- 3,564,655
Deferred tax liabilities
- 616,660
- -
- -
- 616,660
Other liabilities
5,807,265 1,980,594
1,438,099 -
- -
- 9,225,958
Total Liabilities313,930,862
53,321,147 71,495,334
109,286,158 34,701,403
- 588,506
583,323,410
Total Assets
221,896,14038,571,022
46,104,09256,739,058
157,820,787116,570,882
70,812,114708,514,095
Less than O
ne Month
More than 1
Month up to 3 M
onths
More than
3 Months up
to 6 Months
More than
6 Months up
to 1 Year
From 1 Year
Up to 3 Years
More than
3 Years
Non-Interest B
earing Item
s Total
2011JD
JDJD
JDJD
JDJD
JDLiabilities:D
eposits at
banks and
financial institutions 16,873,357
1,423,318 -
- -
- -
18,296,675
Custom
ers' deposits 318,395,830
85,244,447 40,280,312
29,533,487 -
- -
473,454,077C
ash margins
4,321,967 5,451,005
4,406,756 3,516,042
38,773,671 -
- 56,469,442
Borrow
ed funds -
- -
2,758,818 1,369,959
- -
4,128,777Sundry provisions
- -
- -
- -
952,789 952,789
Income tax provision
3,880,629 -
- -
- -
- 3,880,629
Deferred tax liabilities
- 925,740
- -
- -
- 925,740
Other liabilities
1,895,211 1,510,264
1,833,867 3,837,313
- -
- 9,076,655
Total Liabilities344,279,151
93,671,59545,676,721
38,209,04437,085,208
- 952,789
567,184,784
Total Assets
200,051,82924,793,804
83,612,47851,319,744
92,202,198162,856,147
76,935,774691,771,974
Second: Financial Derivatives
The following table summarizes the maturities of financial derivatives on the basis of the remaining period to the contractual maturity date from the date of the consolidated financial statements:
Up to One Month From One Month to 3 Months
From 3 Months to one Year Total
2012 JD JD JD JDTrading derivatives:
Currency derivatives - - - -
2011
Trading derivatives: Currency derivatives 220 - 4,160 4,380
Up to One Year From One Year to 5 Years
More than 5 Years Total
JD JD JD JD2012Letters of credit and acceptances 33,720,504 - - 33,720,504Unutilized credits 22,095,684 - - 22,095,684Guarantees 94,832,402 - - 94,832,402Operating lease contract liabilities 415,739 - - 415,739Capital liabilities 665,056 - - 665,056
Total 151,729,385 - - 151,729,385
2011Letters of credit and acceptances 33,135,962 - - 33,135,962Unutilized credits 9,329,940 - - 9,329,940Guarantees 110,350,298 - - 110,350,298Operating lease contract liabilities 306,507 - - 306,507Capital liabilities 277,949 - - 277,949
Total 153,400,656 - - 153,400,656
40. Sector Analysis
a. Information on the Bank Sectors Operation- The Bank is organized for managerial purposes into three major sectors. Moreover, the Bank owns three subsidiaries: one conducts financial brokerage, the other financial lease, and the third bonded stores operation and management.
- Individuals Accounts: include following up on individual customers accounts, and granting them loans, credit, credit cards, and other services.
- Corporate Accounts: include following up on deposits, credit facilities, and other banking services related to customers.- Treasury: includes providing dealing services and management of the Bank’s funds.
Third: Off-statement of financial position

The following table represents inform
ation on the Bank’s sectors according to activities:
Individuals C
orporations Treasury
FinancialB
rokerageFinancialLeasing
Bonded
Managem
ent O
thers
Total
For the Year Ended D
ecember 31,
20122011
JDJD
JDJD
JDJD
JDJD
JD
Gross incom
e5,315,205
23,813,8063,205,186
1,518,311780,125
1,044,2076,468,298
42,145,13836,492,291
Provision for direct credit facilities
1,581,977 (4,388,064)
- (137,221)
- -
- (2,943,308)
(11,168,207)
Sundry provisions -
- -
- -
- (10,071,217)
(10,071,217)1,388,000
Results of B
usiness Sector6,897,182
19,425,7423,205,186
1,381,090780,125
1,044,207 (3,602,919)
29,130,61326,712,084
Less: Undistributed Expenditures over
sectors -
- -
296,671 457,997
597,625 14,189,355
15,541,648 13,062,117
Income before Taxes
6,897,18219,425,742
3,205,1861,084,419
322,128446,582
(17,792,274)13,588,965
13,649,967
Less: Income tax
- -
- 269,246
43,059 70,360
1,953,929 2,336,594
4,054,414
Income for the Year
6,897,182 19,425,742
3,205,186 815,173
279,069 376,222
(19,746,203)11,252,371
9,595,553
For the Year Ended D
ecember 31,
20112010
Sector's Assets
65,568,122 306,466,962
239,403,341 13,677,223
10,866,831 8,832,193
- 644,814,672
636,558,849
Assets not distributed over sectors
- -
- -
- -
63,699,423 63,699,423
55,213,125
Total Assets
65,568,122 306,466,962
239,403,341 13,677,223
10,866,831 8,832,193
63,699,423 708,514,095
691,771,974
Sector's Liabilities247,872,544
209,067,438 11,044,230
1,383,899 5,592,963
5,552,032 -
480,513,106 493,091,108
Liabilities not distributed over sectors -
- -
- -
- 92,767,972
92,767,972 66,783,400
Total Liabilities247,872,544
209,067,438 11,044,230
1,383,899 5,592,963
5,552,032 92,767,972
573,281,078 559,874,508
Capital Expenditures
- -
- 5,057
27,711 9,286
1,626,668 1,668,722
3,423,845
Depreciation and am
ortization -
- -
6,622 20,121
38,280 1,877,095
1,942,118 1,570,810

Ann
ual R
epor
t 201
2
87
30th
Ann
ual R
epor
t
b. Information on the geographical allocation:
This note represents the geographical distribution of the Bank’s operations. The Bank performs its operations mainly in the Kingdom, and these operations represent the local operations. The following is the geographical distribution of the bank’s revenues, assets and capital expenditures according to geographical distribution:
Inside Jordan Outside Jordan Total
2012 2011 2012 2011 2012 2011
JD JD JD JD JD JD
Total Revenue 61,976,598 53,896,780 - - 61,976,598 53,896,780
Total Assets 708,514,095 691,771,974 - - 708,514,095 691,771,974
Capital Expenditures 1,668,722 3,423,845 - - 1,668,722 3,423,845
41. Capital Management
a. Description of CapitalAccording to the Central Bank of Jordan Law and in compliance with the capital adequacy requirements, capital consists of many parts:
• Primary capital made up of paid-up capital, declared reserves, (including statutory reserve, voluntary reserve, share premium (discount), treasury share premium, and other reserves), retained earnings, and non-controlling interest (if any) minus intangible assets, loss for the period, acquisition costs of treasury stock, provisions required by the Central Bank of Jordan, full amount of goodwill, and any restricted amounts.
• Supplementary capital provided that the general banking risk reserve does not exceed 1.25% of total credit risk weighted assets, subordinated debts, and the positive cumulative change in fair value at 45%, less the negative change balance provided that this part of capital does not exceed 100% of regulatory capital
• The third part consists of short-term subordinated loans to meet market risks. This part supplements capital and is utilized to face the potential losses from market risks.
Additionally, the Bank complies with Article (62) of the Bank Laws that requires the Bank to appropriate 10% of its net profits in the Kingdom and continue to do so until the reserve equals the Bank’s paid-up capital. Moreover, the bank have subtracted an amount equals to the value of the violated real-estate that is seized according to the Article no. (48) from the Bank Laws no (28) for the year 2000 and its amendments for regulatory capital.
b. Regulatory Authorities Requirements Concerning Capital and Method of Fulfilling Them

Ann
ual R
epor
t 201
2
88
30th
Ann
ual R
epor
t
The Bank considers the compatibility of the size of capital with the nature of risks it is exposed to, provided that paid-up capital is not less than the minimum required by the Central Bank of Jordan and regulatory capital is not less than 12% of the weighted value of credit and operating market risks. Furthermore, the minimum leverage ratio (equity to total assets) should not be less than 6%. Moreover, not less than 28.5% of market risks should be covered by regulatory capital.
e. The amount the Bank considers as capital and capital adequacy ratio are as follows:
December 31,
2012 2011
JD JD
Subscribed and paid-up capital 100,000,000 85,250,000
Payments on capital increase - 14,116,574
Statutory reserve 16,055,800 14,710,442
Retained earnings (net of restricted amounts) 4,717,344 3,513,576
Goodwill or any intangibles and deferred tax assets (6,470,950) (4,205,866)
Investments deducted from capital by 50% (3,236,884) (7,029,539)
Primary Capital 111,065,310 106,355,187
Fair value reserve as per IFRS (9) 148,901 465,844
General banking risks reserve 3,805,907 3,180,766
Investments deducted from capital by 50% (3,236,885) (3,646,610)
Additional Paid-up Capital 717,923 -
Total Capital Structure 111,783,233 106,355,187
Total risk weighted assets 673,569,266 589,763,583
Capital Adequacy Ratio (%) 16.59% 18.03%
Primary Capital Ratio (%) 16.49% 18.03%

Ann
ual R
epor
t 201
2
89
30th
Ann
ual R
epor
t
42. Accounts Managed on Behalf of Customers
There are no investment portfolios managed by the Bank on behalf of customers.
43. Analysis of the Maturities of Assets and Liabilities:
The following table illustrates the analysis of assets and liabilities according to the expected period of their recoverability or settlement:
2012 Up to One Year
More than One Year Total
JD JD JD
ASSETS
Cash and balances at the central bank 47,545,437 - 47,545,437
Balances at banks and financial institutions 70,630,082 - 70,630,082
Deposits at banks and financial institutions 230,778 - 230,778
Financial assets at fair value through profit or loss 7,097,737 2,492,199 9,589,936
Financial derivatives - - -
Direct credit facilities 209,500,538 194,810,730 404,311,268
Financial assets at fair value through other comprehensive income - 12,174,711 12,174,711
Financial assets at amortized cost 27,333,072 78,061,408 105,394,480
Fixed assets - 21,488,869 21,488,869
Intangible assets - 1,918,827 1,918,827
Deferred tax assets - 4,552,123 4,578,481
Other assets - 30,677,584 30,677,584
TOTAL ASSETS 362,337,644 346,176,451 708,514,095
LIABILITIES
Deposits at banks and financial institutions 11,044,231 - 11,044,231
Customers deposits 458,081,546 - 458,081,546
Cash margins 24,112,961 32,223,702 56,336,663
Borrowed funds 33,822,859 - 33,822,859
Sundry provisions - 588,506 588,506
Provision for income tax 3,564,655 - 3,564,655
Deferred tax liabilities 616,660 - 616,660
Other liabilities 9,225,958 - 9,225,958
TOTAL LIABILITIES 540,468,870 32,812,208 573,281,078
Net (178,131,226) 313,364,243 135,233,017
Off-Financial Position Contingent Liabilities

Ann
ual R
epor
t 201
2
90
30th
Ann
ual R
epor
t
2011 Up to One Year
More than One Year Total
JD JD JD
ASSETS
Cash and balances at the central bank 39,366,571 - 39,366,571
Balances at banks and financial institutions 79,108,582 - 79,108,582
Deposits at banks and financial institutions 3,942,065 - 3,942,065
Financial assets at fair value through profit or loss 9,046,924 2,731,258 11,778,182
Financial derivatives 4,380 - 4,380
Direct credit facilities 122,522,091 227,486,431 350,008,522
Financial assets at fair value through other comprehensive income 13,406,061 - 13,406,061
Financial assets at amortized cost 81,500,463 61,708,280 143,208,743
Fixed assets - 26,387,692 26,387,692
Intangible assets - 2,074,410 2,074,410
Deferred tax assets 2,131,456 - 2,131,456
Other assets 8,749,262 11,606,048 20,355,310
TOTAL ASSETS 359,777,855 331,994,119 691,771,974
LIABILITIES
Deposits at banks and financial institutions 18,270,292 - 18,270,292
Customers deposits 469,626,566 - 469,626,566
Cash margins 17,512,767 36,005,208 53,517,975
Borrowed funds 2,543,862 1,080,000 3,623,862
Sundry provisions - 952,789 952,789
Provision for income tax 3,880,629 - 3,880,629
Deferred tax liabilities 925,740 - 925,740
Other liabilities 9,076,655 - 9,076,655
TOTAL LIABILITIES 521,836,511 38,037,997 559,874,508
Net (162,058,656) 293,956,122 131,897,466

Ann
ual R
epor
t 201
2
91
30th
Ann
ual R
epor
t
44. Fair Value Hierarchy
The table below analyzes financial instruments carried at fair value by the valuation method. The different levels have been defined as follows: • Level 1: quoted prices (unadjusted) in active markets for identical assets or liabilities; • Level 2: inputs other than quoted prices included within level 1 that are observable for the asset or liability, either directly (i.e. as prices) or indirectly (i.e. derived from prices); • Level 3: inputs for the asset or liability that are not based on observable market data (unobservable inputs).
December 31, 2012 Level 1 Level 2 Level 2 Total
JD JD JD JD
Financial derivatives - - - - Financial assets through profit or loss 9,589,936 - - 9,589,936
Financial assets through other comprehensive income
10,265,971 1,908,740 - 12,174,711
19,855,907 1,908,740 - 21,764,647
December 31, 2011 Level 1 Level 2 Level 2 Total
JD JD JD JD
Financial derivatives 4,380 - - 4,380Financial assets through profit or loss 11,778,182 - - 11,778,182
Financial assets through other comprehensive income
11,364,385 2,041,676 - 13,406,061
23,146,947 2,041,676 - 25,188,623

Ann
ual R
epor
t 201
2
92
30th
Ann
ual R
epor
t
b. Contractual obligations:
45. Commitments and Contingent Liabilities (Off-Financial Position)
a. Credit commitments and contingencies:
December 31,
2012 2011
JD JD
Letters of credit 24,482,091 23,968,299
Acceptances and periodic withdrawals 9,238,413 9,167,663
Letters of guarantee:
Payments 31,816,812 29,969,509
Performance bonds 42,167,748 41,772,961
Other 20,847,842 38,607,828
Unutilized credit facilities 22,095,684 9,329,940
Total 150,648,590 152,816,200
December 31,
2012 2011
JD JD
Contracts to purchase property and equipment 354,062 15,470
Construction contracts 310,994 262,479
Total 665,056 277,949
c. Operating leases amounted to JD 415,739 with periods ranging from 1 to 12 months.
46. Lawsuits Against the Bank
a. The Bank is a defendant in lawsuits amounting to JD 10,694,759 as of the consolidated financial statements date against JD 9,665,704 in the prior year. The total provision booked against these lawsuits amounted to JD 583,256 as of December 31, 2012 (JD 695,253 as of December 31, 2011). As per the estimate of the management and the bank,s lawyer, no addition liabilities would arise against these lawsuit.
b. There were no lawsuits against the subsidiary companies, Tamkeen Leasing Company and Al Istethemari Letamweel Salselat Al Imdad as of December 31, 2012 and 2011.
c. There,s one lawsuit in the stated amount above that includes Al-Mawared for financial brokerage for an amount of JD 300,000. In the opinion of the management and legal advisor, no liabilities would rise against the Company

Ann
ual R
epor
t 201
2
93
30th
Ann
ual R
epor
t
47. Adoption of new and revised International Financial Reporting Standards (IFRSs)
53.a.Amendments to IFRSs applied with no material effect on the consolidated financial statements:The following new and revised IFRSs have been adopted in preparation for the consolidated financial statements for which they did not have any material impact on the amounts and disclosures of the financial statements. However, they may affect the accounting for future transactions and arrangements.
Amendments to IFRS 1 Severe Hyperinflation (Effective for annual periods beginning on or after 1 July 2011)
The amendments regarding severe hyperinflation provide guidance for entities emerging from severe hyperinflation either to resume presenting IFRS financial statements or to present IFRS financial statements for the first time.
Amendments IFRS 1 removal of Fixed Dates for First-time Adopters (Effective for annual periods beginning on or after 1 July 2011)
The amendments regarding the removal of fixed dates provide relief to first-time adopters of IFRSs from reconstructing transactions that occurred before their date of transition to IFRSs.
Amendments to IFRS 7 Disclosures – Transfers of Financial assets (effective for annual periods beginning on or after 1 July 2011)
The amendments to IFRS 7 increase the disclosure requirements for transactions involving transfers of financial assets. These amendments are intended to provide greater transparency around risk exposures of transactions where a financial asset is transferred but the transferor retains some level of continuing exposure of the asset.
derrefeD :21 SAI ot stnemdnemA gniylrednU fo yrevoceR – xaT sdoirep launna rof evitceffE) stessa yraunaJ 1 retfa ro no gninnigeb (2102
Amends IAS 12 Income Taxes to provide a presumption that recovery of the carrying amount of an asset measured using the fair value model in IAS 40 Investment Property will, normally, be through sale.
As a result of the amendments, SIC-21 Income Taxes — Recovery of Revalue Non-Depreciable Assets would no longer apply to investment properties carried at fair value. The amendments also incorporate into IAS 12 the remaining guidance previously contained in SIC-21, which is accordingly withdrawn.

Ann
ual R
epor
t 201
2
94
30th
Ann
ual R
epor
t
b. New and revised IFRSs issued but not yet effective
The Bank and its subsidiaries have not applied the following new and revised IFRSs that have been issued and are available for early application, but are not effective yet:
Effective for annual periods beginning on or after
IFRS 9 Financial Instruments 1 January 2015
Amendments to IFRS 7 1 January 2015
IFRS 10 Consolidated Financial Statements 1 January 2015
IFRS 11 Joint Arrangements 1 January 2015
IFRS 12 Disclosure of Interests in Other entities 1 January 2015
Amendments to IFRS 10, IFRS 11 and IFRS 12 Consolidated Financial Statements, Joint Arrangements and Disclosure of Interests in Other entities: Transition Guidance
1 January 2015
IAS 27 Separate Financial Statements (as revised in 2011)
1 January 2015
Amendments to IFRS 10, IFRS 11 and IFRS 12 Consolidated Financial Statements, Joint Arrangements and Disclosure of Interests in Other entities: Transition Guidance
1 January 2015
IAS 28 Investments in Associates and Joint Ventures (as revised in 2011)
1 January 2015
IFRS 13 Fair Value Measurement 1 January 2014.
Amendments to IFRS 1 Government Loans 1 January 2013.
Amendments to IFRS 7 Disclosures – Offsetting Financial Assets and Financial Liabilities
1 January 2013.
Annual Improvements to IFRSs 2009 – 2011 Cycle
1 January 2013.
IFRIC 20 Stripping Costs in the Production Phase of a Surface Mine
1 January 2013.
The Bank and its subsidiaries’ management anticipates that each of the above standards and interpretations will be adopted in the consolidated financial statements by its date mentioned above without having any material impact on the Bank’s consolidated financial statements.
2012Annual Report30th Annual

2012Annual Report30th Annual