2012 10 01 - mobile developer survey · 2 survey background wireless technology • participants.we...
TRANSCRIPT

11
Technology ResearchOctober 22, 2012
Wireless TechnologyQ3’12 Mobile Developer Survey
William V. Power, [email protected]
Steven J. [email protected]
Andrew T. [email protected]
Please refer to Appendix – Important Disclosures and Analyst Certification on pages 18-21.

22
Survey Background
Wireless Technology
• Participants. We contacted 4,300 mobile app developers and received over 130 complete or semi-complete responses. 60% of the developers we contacted worked at 1-5 person operations. 74% had 1-10 employees.
• Geography. 46% of our participants were located in North America, with 44% in Europe, 6% in the Asia Pacific region, 3% in South America, and 1% the Middle East.
• Large Android and iOS contingents. As with past surveys, our sample included sizeable Android and iOS contingents. The average number of smartphone platforms that our sample of developers supported was 2.5, consistent with our previous surveys.
Source: Baird Survey Data
Geographic Dispersion Developer Size (No. of Employees)Developer Sample by OS
75% 72%
25% 24%21%
12% 11%
5%2%
0%
10%
20%
30%
40%
50%
60%
70%
80%
60%
14%
5% 6% 5%2%
6%
0%
10%
20%
30%
40%
50%
60%
70%
1‐5 6‐10 11‐15 16‐25 26‐50 51‐99 100+

33
A Sliver of Hope for Blackberry 10?
Wireless Technology
• BlackBerry 10 outlook slightly better. Developers’ long-term view of BlackBerry 10 improved slightly sequentially this quarter, increasing from 3.8 to 4.3, though still down from previous quarters. We attribute this improvement in part to BlackBerry Jam series of events that RIM put on across the globe.
• Core BlackBerry OS outlook still weak. Unsurprisingly the outlook for BB OS continues to be weak. We would be surprised if the developer outlook improves going forward as the company transitions its focus toward BB10.
Source: Baird Survey Data
What is the long‐term outlook for BlackBerry OS and BlackBerry 10? (All developers)
Average
Poor

44
Nokia 920 Most Popular WP8 Device Among Developers
Wireless TechnologySource: Baird Survey Data
Does the announcement of the Lumia 920 increase your interest in developing for Windows?
• Nokia still the top Windows device. With the release of the Windows Phone devices from HTC, we wondered whether Nokia could lose favor in the WP8 ecosystem. However, among Wp7/8 developers, 68% think that the Nokia Lumia 920 will draw the most new users to the WP platform. Additionally, 44% of WP7/8 developers indicated that the Lumia 920 somewhat or dramatically increased their interest in the WP8 platform.
• WP7/8 outlook softens. Despite the interest in the Lumia 920, the long-term outlook for WP7/WP8 declined this quarter among all developers and among current WP7/8 developers, which we suspect may be due to lackluster early sales.
What is your long‐term outlook for WP7 and WP8? (All developers vs. WP7/8
developers)
Which device do you think will draw the most new users to WP8?
Excellent
Poor
55
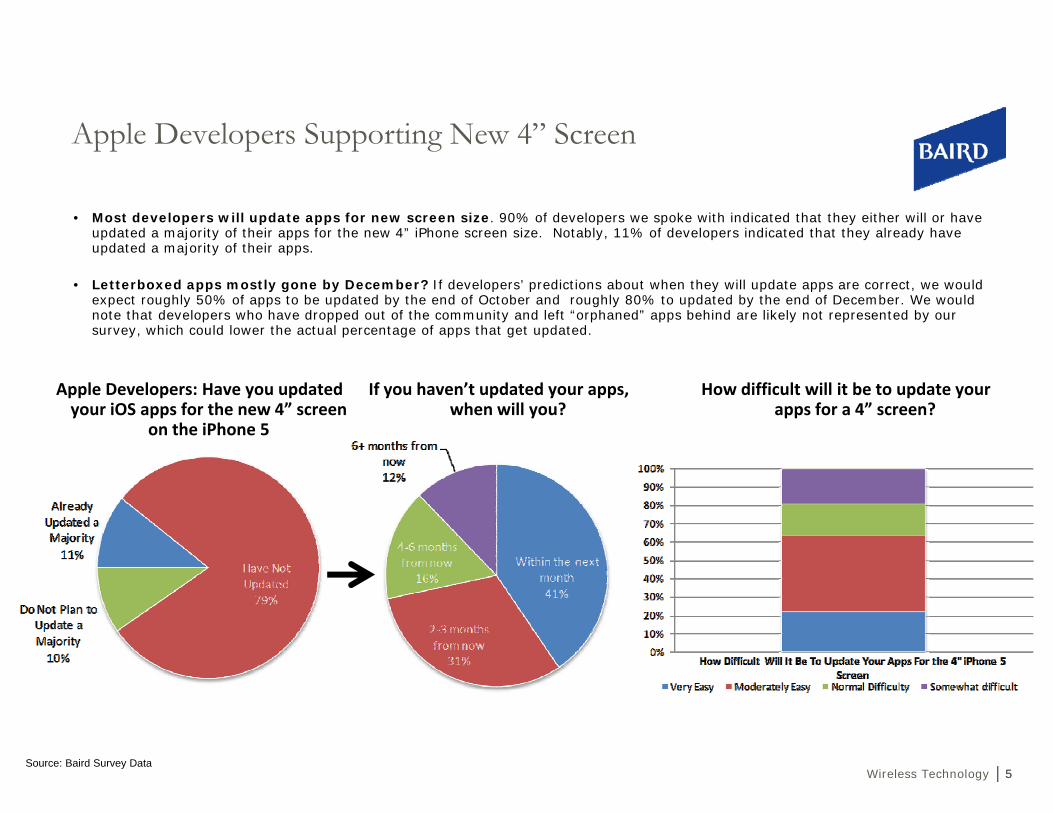
Apple Developers Supporting New 4” Screen
Wireless Technology
• Most developers will update apps for new screen size. 90% of developers we spoke with indicated that they either will or have updated a majority of their apps for the new 4” iPhone screen size. Notably, 11% of developers indicated that they already haveupdated a majority of their apps.
• Letterboxed apps mostly gone by December? If developers’ predictions about when they will update apps are correct, we would expect roughly 50% of apps to be updated by the end of October and roughly 80% to updated by the end of December. We would note that developers who have dropped out of the community and left “orphaned” apps behind are likely not represented by our survey, which could lower the actual percentage of apps that get updated.
Source: Baird Survey Data
Apple Developers: Have you updated your iOS apps for the new 4” screen
on the iPhone 5
If you haven’t updated your apps, when will you?
How difficult will it be to update your apps for a 4” screen?

66
Android Fragmentation Improving, but Concerns Remain
Wireless Technology
• Fragmentation remains a concern. 51% of developers we spoke with responded that Android fragmentation was a meaningful or significant problem, down from 59% last quarter. We view the continued fragmentation of the Android system as a disadvantage, though it doesn’t appear to have impacted sales.
• Amazon App Store porting update. Notably, 56% of Android developers stated that they are re-submitting apps to the Amazon store, which could be viewed as encouraging. On the other hand, that leaves 44% of Android developers who are not re-submittingapps to Amazon, limiting Amazon’s overall app. opportunity.
Source: Baird Survey Data
How big of a problem is Android fragmentation?
0%
5%
10%
15%
20%
25%
30%
35%
40%
45%
Not a Problem Somewhat of a Problem
A Problem Meaningful Problem
Significant Problem
Q2'12 Q3'12
Do you re‐submit Android apps to the Amazon App Store?

77
Apple Maps: Mixed Data
Wireless Technology
• Despite press coverage, majority of developers not worried about Apple mapping data though some are. 37% of developers indicated that they use mapping data as a part of their applications. Of this cohort, 55% were not concerned aboutApple’s mapping data, though a sizeable number of affected developers are using other map data.
• Waze and Google are top alternatives. Of the concerned developers, Google and Waze were top alternative source of mapping data.
Source: Baird Survey Data
Do you develop apps that use mapping data? Are you concerned that Apple’s new map data will be weaker than what Google provided?

88
Long-Term Outlook: iOS and Android Still Dominate
Wireless Technology
• iOS and Android hold top spots. Unsurprisingly, iOS and Android continue to lead other software platforms in terms of long-term outlook.
• WP8 maintains position as third OS, WP7 continues decline. WP8 maintained its position as the platform with the third-best long-term outlook, holding flat from Q2. The outlook on WP7 continued to slide this quarter, though we find that unsurprising in the face of the coming shift to WP8 by many hardware manufacturers.
• BB 10 recovers. The outlook on BlackBerry 10 improved this quarter after several quarters of flat to down trends. We attribute the improvement to the BlackBerry Jam tour undertaken by RIM.
Source: Baird Survey Data
How do you view the long‐term outlook for the following platforms?Excellent
Poor

99
New Quantitative Questions
Wireless Technology
• This quarter we asked a series of new quantitative questions focusing on downloads, revenue, new app starts, etc.
• Out of respect for our developers’ privacy, we asked for and display the data largely in percentages which mask individual responses.
• Additionally, we are not displaying data for platforms for which we believe our sample size is too small to accurately reflect the actual developer base.
Source: Baird Survey Data

1010
Monthly Downloads by App Store
Wireless Technology
• How to read this chart. This chart represents the number of downloads that responding developers have per platform (e.g., 11% of Android developers who responded to our survey indicated that they have 1-5 apps).
• The 10K barrier. The responses we received indicate that most developers, even on the most popular platforms, do not get over the 10K monthly download barrier. 43% of iOS developers achieved greater than then 10K monthly downloads, followed by 38% of Android, 36% of BlackBerry, 23% for BB10 and 10% for WP7/8.
• iOS and Android breaking 1 million. Only Android and iOS developers reported achieving 1 million downloads per month on average. As a percentage of our total developer base, less than 4% of respondents broke the 1 million download mark.
Source: Baird Survey Data
How many monthly downloads do you get by app store?
Android
iOSBlackBerry
BlackBerry 10WP7/8
0%
25%
50%
75%
100%
Freq
uency
Number of Downloads by OS
Android iOS BlackBerry BlackBerry 10 WP7/8

1111
Percent of Revenue by App Store
Wireless Technology
• How to read this chart. This chart represents the percentage of revenue that responding developers make per platform (e.g., 27% of iOS developers who responded to our survey indicated that they make 91-100% of their revenue from iOS).
• WP7/8 Not generating significant revenue. 57% of WP7/8 developers that responded to our survey indicated that they make 0-10% of their total revenue from WP7/8. Clearly the platform is still in its early growth stage. We would note that our WP7/8 developer sample is small and could be skewed as a result.
• BlackBerry 10, free apps reign. Despite the common perception that Android Apps are almost always free, 30% of BB10 developers indicated that their apps are free, when compared with just 11% for Android.
Source: Baird Survey Data
What percent of your revenue comes from each Platform?
AndroidiOSBlackBerryBlackBerry 10WP7/8
0%
25%
50%
75%
100%
Freq
uency
What percent of your revenue comes from each platfrom
Android iOS BlackBerry BlackBerry 10 WP7/8

1212
Comparing App Downloads to Revenue Generation
Wireless Technology
• How to read these charts. The X-axis represents the percent of revenue that a developer receives from a platform. The Y-axis represents the number of downloads the developer has received in the last 30 days from the same platform. The width of the bubble represents number of developers who picked the same X and Y options.
• i.e., A small bubble in the top right hand corner = few developers receive a lot of downloads and get a high % of revenue from a specific platform.
• Android. A significant number of Android devs who receive 10K-100K monthly downloads still earn a small percentage of their revenue from the platform. This can be seen in the grouping of large bubbles along the Y-axis. This trend largely supports the popular conception that Android users download a lot of apps, but are less interested in paying for the experience.
• iOS. In contrast to Android, iOS developers who break into the 10k-100k download bucket are more likely to earn nearly 100% of their revenue from the platform.
• Note, 0% of revenue is equivalent to “My apps are free,” and bubble width is not directly comparable between platforms.
Source: Baird Survey Data
10
100
1,000
10,000
100,000
1,000,000
10,000,000
‐20% 0% 20% 40% 60% 80% 100% 120%
Android Downloads to % of Revenue
10
100
1,000
10,000
100,000
1,000,000
10,000,000
‐20% 0% 20% 40% 60% 80% 100% 120%
iOS Downloads to % of Revenue

1313
Apps Per Developer Per App Store
Wireless Technology
• How to read this chart. This chart represents the number of apps that responding developers have per platform (e.g., 88% of WP7/8 developers who responded to our survey indicated that they have 1-5 apps).
• Number of Apps correlated to lifespan of platform. It seems obvious to point out that iOS and Android have the most developers in the 100+ bucket because those app stores are well known to have the largest app ecosystems. However, we would point out that BlackBerry OS has the largest percentage of developers in the 21-50 and 51-100 buckets. This, we believe, is due to long lifespan of the platform, which has given legacy developers time to create many apps for the ecosystem. It is imperative for the health of BB10 that RIM is able to convince legacy BBOS developers to move over to BB10.
Source: Baird Survey Data
How many apps do you have in each app store?
Android
iOSBlackBerry
BlackBerry 10WP7/8
0%
25%
50%
75%
100%
Freq
uency
Number of Apps by App Store
Android iOS BlackBerry BlackBerry 10 WP7/8

1414
New App Starts Per Store
Wireless Technology
• BlackBerry 10 Generation Strong, WP7/8 Weak. 79% of BlackBerry 10 developers indicated that they had started a new app in the past three months, above all other platforms. That said, the company did just release its SDK to developers in May, which could be the driver of recent starts. 47% of WP7/WP8 developers indicated that they started a new app in the last three months, which may be caused by the lack of a public WP8 SDK.
• Android and iOS likely still separating from the pack. Interestingly, more iOS and Android developers indicated that they started 5+ apps then competing platforms. This could be driven by the fact that large developer companies gravitate towards more entrenched ecosystems. Regardless of the cause, the greater number of starts for iOS and Android will likely expand the considerable gap in app store size between them and the runners up.
Source: Baird Survey Data
Have you created a new App in the previous three months? Yes, I have.
How many new apps have you started in the past three months?
Android
iOSBlackBerry
BlackBerry 10WP7/8
0%
25%
50%
75%
100%
1‐23‐5
5‐1010+
Freq
uency
Number of New Apps Started
Android iOS BlackBerry BlackBerry 10 WP7/8
66% 69%61%
79%
47%
0%
10%
20%
30%
40%
50%
60%
70%
80%
90%
Android iOS BlackBerry BlackBerry 10
WP7/8

1515
Maintenance
Wireless Technology
• How to read this chart. This chart represents the percentage of developers that conducted minor and major maintenance on their apps in the past 6 months (e.g., 26% of Android developers who responded to our survey indicated that they have done minor maintenance on 91-100% of their Android apps in the past six months).
• Minor maintenance = bug fixes, small aesthetic changes, etc.• Major maintenance = additional features, add-ons, etc.
• Android and iOS renewed frequently. Both Android and iOS developers indicated that they frequently conduct minor and major maintenance on a majority of their apps, while BBOS, BB10 and WP7/8 are receiving infrequent updates.
Source: Baird Survey Data
For what percentage of your apps have you done minor maintenance work in the last 6 months?
AndroidiOSBlackBerryBlackBerry 10WP7/8
0%
25%
50%
75%
100%
0‐10
%
11‐20%
21‐30%
31‐40%
41‐50%
51‐60%
61‐70%
71‐80%
81‐90%
91‐100
%
Freq
uency
Percentage of Apps with MajorMaintence Work
Android iOS BlackBerry BlackBerry 10 WP7/8
For what percentage of your apps have you done major maintenance work in the last 6 months?
AndroidiOSBlackBerryBlackBerry 10WP7/8
0%
25%
50%
75%
100%
0‐10
%
11‐20%
21‐30%
31‐40%
41‐50%
51‐60%
61‐70%
71‐80%
81‐90%
91‐100
%
Freq
uency
Percentage of Apps with MinorMaintence Work
Android iOS BlackBerry BlackBerry 10 WP7/8

1616
Valuation
Wireless Technology
• Apple (AAPL-$665.24-Outperform)• Current valuation. AAPL is currently trading at 14.7x our calendar 2012 EPS estimate and 11.7x 2013. That compares to the S&P 500 at
12.8x '13E. Ex. current cash, AAPL is trading at 12.0x our calendar 2012 EPS estimate and 9.6x 2013. The stock also trades at a 1.6% dividend yield.
• Target price. Our $740 target price is based on 13x our calendar 2013 EPS estimate of $57.02. A 13x multiple puts it at a 1x premium to the S&P 500 average, which we believe is justified by higher-than-average growth.
• HTC(2498.TW-$255.50-Neutral)• Current valuation. HTC is currently trading at 10.8x our 2012 EPS forecast and 10.3x 2013, vs. the big cap tech group at 10x '13E.• Target price. Our NT$275 target price is based on 11x '13E EPS, which puts it roughly in line with the big-cap tech group at 10x '13, which
we view as fair in light of increasing competitive risks and uncertainties.
• Nokia (NOK-$2.80-Underperform)• Current valuation. Nokia is currently trading at 0.2x our 2012 revenue forecast and 0.2x 2013, compared to ERIC, HTC and RIM, which are
trading at 0.7x, 0.6x and 0.2x '13E, respectively.• Target price. Our new $2 target price is based on a combination of projected 2013 net cash per share, assumed patent value, 0.5x Location
& Commerce revenue, and 0.25x proportionate NSN revenue. Our patent and revenue assumptions are based on public peers and recenttransactions.
• Research In Motion (RIMM-$7.84-Underperform)• Current valuation. RIM is trading at an EV/revenue ratio of 0.2x our fiscal 2013 revenue forecast, vs. Apple, HTC and Nokia at 2.1x, 0.6x
and 0.2x calendar '13E, respectively.• Target price. Our $7 target price is based on a sum-of-the-parts approach that includes $4 per share in current cash and $3 in patent
value.
Source: Baird Survey Data

1717
Risks
Wireless Technology
• Apple (AAPL-$665.24-Outperform)• Increasing Competition• Dependency on iPhone• Patent Litigation
• HTC(2498.TW-$255.50-Neutral)• Increasing Competition• Android Fragmentation• Patent Litigation
• Nokia (NOK-$2.80-Underperform)• Patent Value• Cash Balance• Acquisition Target
• Research In Motion (RIMM-$7.84-Underperform)• BB10 Launch• Acquisition Target
Source: Baird Survey Data

1818
Appendix – Important Disclosures and Analyst Certification

1919
Robert W. Baird & Co. Incorporated makes a market in the securities of AAPL, NOK and RIMM.
Robert W. Baird & Co. Incorporated and/or its affiliates expect to receive or intend to seek investment-banking relatedcompensation from the company or companies mentioned in this report within the next three months.
Robert W. Baird & Co. Incorporated may not be licensed to execute transactions in all foreign listed securitiesdirectly. Transactions in foreign listed securities may be prohibited for residents of the United States. Please contact aBaird representative for more information.
Investment Ratings: Outperform (O) - Expected to outperform on a total return, risk-adjusted basis the broader U.S.equity market over the next 12 months. Neutral (N) - Expected to perform in line with the broader U.S. equity marketover the next 12 months. Underperform (U) - Expected to underperform on a total return, risk-adjusted basis the broaderU.S. equity market over the next 12 months.
Risk Ratings: L - Lower Risk - Higher-quality companies for investors seeking capital appreciation or income with anemphasis on safety. Company characteristics may include: stable earnings, conservative balance sheets, and an establishedhistory of revenue and earnings. A - Average Risk - Growth situations for investors seeking capital appreciation with anemphasis on safety. Company characteristics may include: moderate volatility, modest balance-sheet leverage, and stablepatterns of revenue and earnings. H - Higher Risk - Higher-growth situations appropriate for investors seeking capitalappreciation with the acceptance of risk. Company characteristics may include: higher balance-sheet leverage, dynamicbusiness environments, and higher levels of earnings and price volatility. S - Speculative Risk - High-growth situationsappropriate only for investors willing to accept a high degree of volatility and risk. Company characteristics may include:unpredictable earnings, small capitalization, aggressive growth strategies, rapidly changing market dynamics, high leverage,extreme price volatility and unknown competitive challenges.
Valuation, Ratings and Risks. The recommendation and price target contained within this report are based on a timehorizon of 12 months but there is no guarantee the objective will be achieved within the specified time horizon. Pricetargets are determined by a subjective review of fundamental and/or quantitative factors of the issuer, its industry, and thesecurity type. A variety of methods may be used to determine the value of a security including, but not limited to,discounted cash flow, earnings multiples, peer group comparisons, and sum of the parts. Overall market risk, interest raterisk, and general economic risks impact all securities. Specific information regarding the price target and recommendation isprovided in the text of our most recent research report.

2020
Distribution of Investment Ratings. As of September 28, 2012, Baird U.S. Equity Research covered 678 companies,with 52% rated Outperform/Buy, 47% rated Neutral/Hold and 1% rated Underperform/Sell. Within these ratingcategories, 13% of Outperform/Buy-rated, 8% of Neutral/Hold-rated and 11% of Underperform/Sell rated companieshave compensated Baird for investment banking services in the past 12 months and/or Baird managed or co-managed apublic offering of securities for these companies in the past 12 months.
Analyst Compensation. Analyst compensation is based on: 1) The correlation between the analyst's recommendationsand stock price performance; 2) Ratings and direct feedback from our investing clients, our institutional and retail salesforce (as applicable) and from independent rating services; 3) The analyst's productivity, including the quality of theanalyst's research and the analyst's contribution to the growth and development of our overall research effort and 4)Compliance with all of Robert W. Baird’s internal policies and procedures. This compensation criteria and actualcompensation is reviewed and approved on an annual basis by Baird's Research Oversight Committee.
Analyst compensation is derived from all revenue sources of the firm, including revenues from investment banking. Bairddoes not compensate research analysts based on specific investment banking transactions.
A complete listing of all companies covered by Baird U.S. Equity Research and applicable research disclosures can beaccessed at http://www.rwbaird.com/research-insights/research/coverage/research-disclosure.aspx. You can also call 1-800-792-2473 or write: Robert W. Baird & Co., Equity Research, 24th Floor, 777 E. Wisconsin Avenue, Milwaukee, WI53202.
Analyst Certification
The senior research analyst(s) certifies that the views expressed in this research report and/or financial model accuratelyreflect such senior analyst's personal views about the subject securities or issuers and that no part of his or hercompensation was, is, or will be directly or indirectly related to the specific recommendations or views contained in theresearch report.
Disclaimers
Baird prohibits analysts from owning stock in companies they cover.
This is not a complete analysis of every material fact regarding any company, industry or security. The opinions expressedhere reflect our judgment at this date and are subject to change. The information has been obtained from sources weconsider to be reliable, but we cannot guarantee the accuracy.
ADDITIONAL INFORMATION ON COMPANIES MENTIONED HEREIN IS AVAILABLE UPON REQUEST The DowJones Industrial Average, S&P 500, S&P 400 and Russell 2000 are unmanaged common stock indices used to measureand report performance of various sectors of the stock market; direct investment in indices is not available.

2121
Baird is exempt from the requirement to hold an Australian financial services license. Baird is regulated by the UnitedStates Securities and Exchange Commission, FINRA, and various other self-regulatory organizations and those laws andregulations may differ from Australian laws. This report has been prepared in accordance with the laws and regulationsgoverning United States broker-dealers and not Australian laws.
Copyright 2012 Robert W. Baird & Co. Incorporated
Other Disclosures
The information and rating included in this report represent the Analyst’s long-term (12 month) view as described above.The research analyst(s) named in this report may at times, discuss, at the request of our clients, including Robert W. Baird& Co. salespersons and traders, or may have discussed in this report, certain trading strategies based on catalysts or eventsthat may have a near-term impact on the market price of the equity securities discussed in this report. These tradingstrategies may differ from the analysts’ published price target or rating for such securities. Any such trading strategies aredistinct from and do not affect the analysts’ fundamental long-term (12 month) rating for such securities, as describedabove. In addition, Robert W. Baird & Co. Incorporated and/or its affiliates (Baird) may provide to certain clients additionalor research supplemental products or services, such as outlooks, commentaries and other detailed analyses, which focus oncovered stocks, companies, industries or sectors. Not all clients who receive our standard company-specific researchreports are eligible to receive these additional or supplemental products or services. Baird determines in its sole discretionthe clients who will receive additional or supplemental products or services, in light of various factors including the size andscope of the client relationships. These additional or supplemental products or services may feature different analytical orresearch techniques and information than are contained in Baird’s standard research reports. Any ratings andrecommendations contained in such additional or research supplemental products are consistent with the Analyst’s long-term ratings and recommendations contained in more broadly disseminated standard research reports.
UK disclosure requirements for the purpose of distributing this research into the UK and other countries forwhich Robert W. Baird Limited holds an ISD passport.
This report is for distribution into the United Kingdom only to persons who fall within Article 19 or Article 49(2) of theFinancial Services and Markets Act 2000 (financial promotion) order 2001 being persons who are investment professionalsand may not be distributed to private clients. Issued in the United Kingdom by Robert W Baird Limited, which has offices atMint House 77 Mansell Street, London, E1 8AF, and is a company authorized and regulated by the Financial ServicesAuthority. For the purposes of the Financial Services Authority requirements, this investment research report is classified asobjective.
Robert W Baird Limited ("RWBL") is exempt from the requirement to hold an Australian financial services license. RWBL isregulated by the Financial Services Authority ("FSA") under UK laws and those laws may differ from Australian laws. Thisdocument has been prepared in accordance with FSA requirements and not Australian laws.

2222
Robert W. Baird & Co.www.rwbaird.com 800.RW.BAIRD
Equity Capital Markets and Private Equity Office Locations
*Baird and its operating affiliates have offices in the United States, Europe and Asia.
Robert W. Baird & Co. Incorporated. Member SIPC.Robert W. Baird Ltd. and Baird Capital Partners Europe are authorized and regulated in the UK by the Financial Services Authority.
©2012 Robert W. Baird & Co. Incorporated.
U.S. Offices
Atlanta One Buckhead Plaza3060 Peachtree Road Suite 1815 Atlanta, GA 30305888.792.9478
BostonOne Post Office SquareSuite 3617Boston, MA 02109888.661.5431
Charlotte4725 Piedmont Row DrivePiedmont Town Center TwoSuite 750Charlotte, NC 28210704.553.6600
Chicago 227 West Monroe StreetSuite 2100Chicago, IL 60606800.799.5770
Milwaukee777 East Wisconsin AvenueMilwaukee, WI 53202888.224.7326
Nashville2525 West End AvenueSuite 1000Nashville, TN 37203888.454.4981
Palo Alto1661 Page Mill RoadSuite APalo Alto, CA 94304650.858.3800
San Francisco 555 California StreetSuite 1350San Francisco, CA 94104415.627.3270
St. Louis8000 Maryland AvenueSuite 500St. Louis, MO 63105888.792.7634
Stamford100 First Stamford Place3rd FloorStamford, CT 06902800.380.3247
Tampa401 East Jackson StreetSuite 2900Tampa, FL 33602888.238.2672
Washington, D.C.Pinnacle Tower North1751 Pinnacle DriveSuite 1100McLean, VA 22102888.853.2753
International Locations*
FrankfurtNeue Mainzer Strasse 2860311 Frankfurt Germany011.49.69.13.01.49.0
Hong KongSuite 3304, 33/FBank of No.12 Central, 011.852.2827.8822
LondonMint House77 Mansell StreetLondon E1 8AFUK011.44.207.488.1212
ShanghaiRm 42-022, 42/F, Hang Seng Bank TowerNo.1000 Lujiazui Ring Road Pudong Shanghai 200120, China011.86.21.6182.0980