contentsphysics.wm.edu/physicsnew/undergrad/1999/dan_reid.… · · 2012-03-14contents table of...
TRANSCRIPT

1
CONTENTS
Table of Contents………………………………………………………………….1
Abstract……………………………………………………………………….…...2
I MOTIVATION…………………………………………………………………..2
II INTRODUCTION………………………………………………………………3
III OVERVIEW OF A TYPICAL KILN FIRING……………………………..…4
IV INTERPRETATION OF DATA FROM PREVIOUS KILNS…………….….5
V CHRONOLOGY OF DATA COLLECTION………………………………….8
VI THE INFRARED CAMERA…………………………………………….…..11
VII KILN CONSTRUCTION………………………………………………...….12
VIII THE KILN FIRING AND DATA COLLECTION…………………….…..17
IX THE FINITE ELEMENT MODEL……………………………………….….18
A The Basics of Finite Element Modeling………………………………19
B Dimensional and Structural Assumptions of the Model………………20
C Property Assumptions of the Model…………………………………..20
D Assumptions Concerning Conduction……………………………...…21
E Assumptions Concerning Convection…………………………………23
F Assumptions Concerning Radiation…………………………………...23
G Assumptions Concerning Heating………………………………….....24
X ANALYSIS OF INRARED DATA…………………………………………...31
XI CONCLUSIONS…………………………………………………………..…33
XII SUGGESTIONS FOR THE FUTURE……………………………………...33
APPENDIX A: BRIEF HISTORY OF BRICKMAKING……………………....34
APPENDIX B: NARRATIVE CHRONOLOGY OF 1998 KILN FIRING……..41
APPENDIX C: DATA FROM 1989 BURN………………………………….…46
APPENDIX D: DATA FROM 1994 BURN………………………………….…53
APPENDIX E: DATA FROM 1995 BURN………………………………….…63
APPENDIX F: DATA FROM 1996 BURN……………………………….……73
REFERENCES…………………………………………………………………..83
WORKS CONSULTED…………………………………………………………85

2
Non-invasive Evaluation and Modeling of a Colonial Brick Kiln
Daniel B. Reid
College of William & Mary
ABSTRACT
The firing of bricks in a kiln built by colonial interpreters is examined through the use of infrared thermography. Data
taken noninvasively with an infrared camera is compared to a computer model generated for this specific kiln structure in
an attempt to determine if infrared thermography could be used as a control measure to ensure the quality of bricks in
such a nonindustrial kiln. This model will augment the exisiting understanding of the brickmaking process as a way to increase the size of future colonial-style kilns without loss
of quality.
I MOTIVATION: A model of a brick kiln, coupled with the ability to make relatively
easy, noninvasive temperature measurements, would assist the Colonial
Williamsburg Foundation not only in obtaining a better understanding of
the process of firing, but also provide a measure of quality control that

3
would improve on the previously used method of using thermocouples.
An improved understanding of the heat flow through a typical kiln would
also allow less experienced colonial interpreters to fire the kiln, and allow
more bricks to be fired at once without loss of quality.
II INTRODUCTION :
The idea for this project grew from a related problem posed to
William & Mary's Applied Science Department in 1995: to determine
whether or not colonial interpreters were being placed at increased risk of
cataracts due to infrared radiation emanating from the open, blazing fires
of the kiln. That fear was quickly shown to be unfounded by taking
thermal readings of the kiln with an infrared camera, but that project led to
the concept of using thermography as a quality control measure in place
of the unsightly and distinctly non-colonial thermocouples and wires.

4
Figure 1- A colonial interpreter installing a thermocouple into a kiln wall1
In the seventeenth century, brickmaking was a business, and as such was
done on a large scale. As a result of this large scale, colonial
brickmakers would have been apprenticed and would have had the benefit
of many years’ experience to ensure brick quality. The colonial interpreter
of today, however, in his attempts to relearn the art of brickmaking, is
without such benefits of experience. To ensure that bricks will be of
practical use in the Colonial Williamsburg Foundation’s buildings, he is
forced to monitor the temperature, to affirm that the bricks have achieved
sufficient temperatures for the correct amount of time, with devices such
as thermocouples. The desire for a technique to monitor kiln temperature
without unsightly thermocouple wires while still maintaining quality control
measures suggested a deeper examination into the validity and feasibility
of using a thermographic model, coupled with infrared readings.

5
If a method could be devised which could monitor kiln temperatures using
a device as simple and noninvasive as an infrared detector, it would be
possible to make the firing of bricks much more foolproof. If bricks could
be made safely by less experienced interpreters, they could be made and
used more extensively, and perhaps even sold for profit, a concept of
obvious interest to the Colonial Williamsburg Foundation
Figure 2- Panoramic view of the brick yard in October, 1998
III OVERVIEW OF A TYPICAL KILN FIRING:
The brickmaking process begins in late fall by digging up a quantity
of suitable clay. Good brickmaking clay typically consists of mild clay,
meaning it contains 30 to 35 percent sand2. The actual quality of the clay
can be determined by testing a few bricks in a potters' kiln. The clay is left
exposed to allow the freeze and thaw cycle to break up chunks. After the
last freeze, the clay is deposited in a pit and mixed with water by treading
it barefoot. The clay is then molded into typical brick shapes with a mold
and left to dry in the sun for several weeks. In mid October, the kiln is
either built from the unfired bricks or, if a shell of fired bricks exists, it is

6
filled with unfired bricks and sealed up. Kiln size depends solely on the
number of bricks molded during the summer, and can vary from around
ten thousand bricks to well over ten times that.
Beneath the body of the kiln, tunnels, or "eyes" as they are called,
were constructed and in those fires were built in order to fire the bricks.
The firing takes approximately one week, the first two or three days of
which is devoted to drying the bricks at low heat. After the bricks have
thoroughly dried, the temperature of the kiln is increased slowly by
building the fires. The temperature needs to reach between 1850F and
2000F to allow the bricks to harden enough for use in an outer wall of a
structure3, and after those temperatures have been sustained for roughly
six hours, the kiln is sealed up with mud and allowed to cool slowly.
IV INTERPRETATION OF DATA FROM PREVIOUS KILNS:
In studying the data taken from various kilns fired over the previous
decade, a statistical picture of the evolution of a firing over a week was
developed. For example, analysis of the kilns fired in 1989 and 1996
yielded the thermocouple data visible in Figures 3 and 4. Data from the
thermocouple readings for 1989, 1994, 1995, and 1996 are reproduced in
full in the appendices. Both are taken from thermocouple readings done
by colonial interpreters over the course of a firing for the years indicated,
and both correspond to a point roughly two feet below the surface of the

7
kiln in the central upper portion of the south side, above the eyes of one
end.
It is important to note that since thermocouple readings were not
taken until the kiln began to warm up significantly, a period of time
corresponding to a typical drying period of two and a half days has been
added to the graphs to make them more easily understood in terms of the
1998 firing. The drying times for the kilns of those years was in fact a bit
shorter, on the order of one and a half days, but to keep the data
comparable, it was assumed to be of the length now used.
Figure 3- Plot of temperature vs. time for a given position in the 1989 kiln. Taken from readings done by interpreters in 1989.

8
Notice that although the 1996 kiln was fired over a longer period
and reached higher temperatures for a differing length of time than that of
the 1989 kiln, the same basic shape for the temperature curve is evident.
This general shape was used as a benchmark for what was to happen
during the 1998 firing and as a way to determine the portions of the week
that would be most productive to record data. For example, by realizing
that it would take roughly two and a half days to dry out the bricks, and
that the kiln would be brought up to peak temperature within a few days
after that, it was possible to plan trips to the kiln more effectively and
motivate the timing of those visits to coincide with steeper portions of the
temperature/time curve.
Figure 4-Plot of temperature vs. time for a given position in the 1996 kiln. Taken from readings done by interpreters in 1996.

9
V CHRONOLOGY OF DATA COLLECTION:
The months before October were spent becoming familiar with the
use and limitations of the instrumentation, an Inframetrics 600 Infrared
Camera System, and designing and constructing a mobile data collection
cart (Figure 5).
Figure 5- Custom data acquisition cart
Designed to facilitate the movement of the camera and related equipment
around the kiln, this cart enabled more data to be taken, simply because it
shortened setup time (Figure 6). Without the cart, the image processor,
monitor, camera, and all of the accompanying cables would have had to
be unpacked and mounted on tripods every time a reading was to be

10
taken. When it was realized that data might be necessary nearly every
hour, that became impossible.
Figure 6- Data cart in use at the kiln
The cart design, influenced by products available commercially,
was built around an industrial style hand truck with inflatable balloon tires.
The balloon tires were desirable because of the uneven terrain around the
kiln and the hand truck was needed simply for strength. The body of the
cart consisted of three shelves mounted to the hand truck and surrounded
by a custom made sheet metal casing. Holes were drilled in each shelf to
facilitate the passing of necessary cables from one shelf to another, and
each component: monitor, image processor, and video camera, was held
in place with custom fit webbing and buckles mounted to each shelf. The

11
extra space on each shelf was used to house other equipment, such as
notebooks and a handheld thermocouple.
The system was powered by a 12VDC automobile battery
connected to the camera through a cigarette lighter style connector. The
battery supplied sufficient power to enable a whole week of operation
without recharging. The setup, with a commercially available battery in
place of the implemented automobile battery is shown in Figure 7.

12
Figure 7- Diagram of Inframetrics 600 components as connected to a 12VDC source. 4

13
The motivation for the selection of an automobile battery as a power
source, as opposed to a rechargeable source available specifically for the
camera, was twofold. Primarily, it was an inexpensive, replaceable and
long lasting power source, but it also served as a weight to steady the cart
while standing upright without support. The video camera was the only
piece of equipment not operating on the automobile battery. The final
requirement of the system was a supply of liquid nitrogen to cool the
camera. This was provided by a 5 liter dewar which was left at the kiln
site and refilled periodically with a smaller container. A funnel was
employed as a means to fill the camera's reservoir from the dewar while
minimizing spillage of LNO2.
Throughout the firing period, the camera equipment was left on the
kiln site, covered in a tarp and kept in the tent used to store green bricks
before firing.
VI THE INFRARED CAMERA
The Inframetrics 600 is a Liquid nitrogen cooled
Mercury/Cadmium/Telluride (HgCdTe) detector, operating at 77 C. It has
a typical minimum measurable temperature difference of .1C, a -20C to
+400C range in the 8-12 micron range (up to +1500C in extended mode)
and an ambient operating temperature of -15C to +45C.5
The detector itself incorporates electromechanical servos to
perform both horizontal and vertical scanning. This means that during
operation, a magnetic field oscillates a mirror against a torsional spring

14
shaft under closed-loop electrical current. Horizontal scanning is
performed at 4KHz in a resonant mode (sinusoidal) and vertical scanning
is done in a sawtooth pattern, similar to that of a television set, at60Hz.6
The scanning mirrors are responsible for the audible whine emanating
from the camera while operational.
These mirrors are encased in a sealed, evacuated chamber to
increase efficiency, and motorized focus and optional filter mechanisms
are operated within the scanner case by the system through remote
controls. The lens of the camera is Germanium, since normal glass does
not transmit radiant energy with wavelengths longer than 4 microns.7
The radiant signal, whose path is visible in Figure 8,

15
Figure 8- Schematic of radiant signal path through Inframetrics 600. 8
is converted into an electric signal by the detector and amplified by the
enclosed solid state electronics. The amplified signal then drives a digital
readout, which in this case is displayed on a television style monitor in
either false color or grayscale.
VII KILN CONSTRUCTION:
The kiln itself was constructed entirely in the two weeks preceding
the firing. Built in the field behind the cabinet makers' workshop in colonial

16
Williamsburg, the kiln was constructed on a base of previously fired bricks,
stacked two thick to form a stable platform.
In previous years, the kiln has been built entirely of unfired bricks,
but in 1998, the kiln was constructed as three mortared walls, about two
feet thick, built with previously fired bricks. This method not only provided
a sort of insulation to keep heat in the kiln, but also allowed for a "kiln-like
structure" to be standing year-round to aid in the explanation of
brickmaking to tourists. The beginning of these walls are shown for the
1998 kiln in Figure 9 along with a view through an unfinished kiln eye from
a previous kiln in Figure 10.
Figure 9- The construction of the outer walls of the October 1998 kiln

17
Figure 10- construction of one of the kiln eyes. 9
Later, the kiln would be packed with unfired bricks (the tunnels are
continued with unfired brick) and the fourth wall would be assembled,
although not mortared. The fourth wall, however, was made a little thicker
and daubed with mud more heavily to compensate for its lack of mortar.
The process of filling the kiln is shown for a previously fired kiln in Figure
11.

18
Figure 11- Unfired bricks are stacked within the kiln with about a thumbs space between to facilitate heat flow. 10
The kiln is then covered in mud, or "daub," as it is called, and
covered with a canvas tarp until it is time to light the fires (See Figure 12).
19
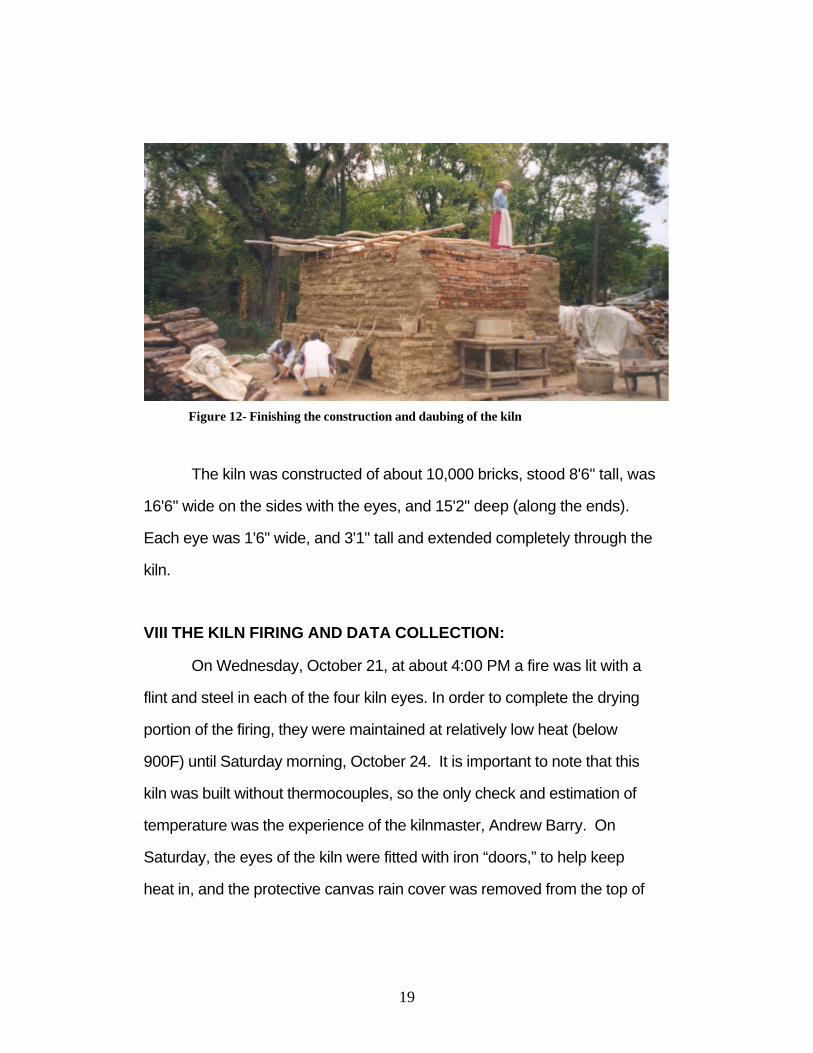
Figure 12- Finishing the construction and daubing of the kiln
The kiln was constructed of about 10,000 bricks, stood 8'6" tall, was
16'6" wide on the sides with the eyes, and 15'2" deep (along the ends).
Each eye was 1'6" wide, and 3'1" tall and extended completely through the
kiln.
VIII THE KILN FIRING AND DATA COLLECTION:
On Wednesday, October 21, at about 4:00 PM a fire was lit with a
flint and steel in each of the four kiln eyes. In order to complete the drying
portion of the firing, they were maintained at relatively low heat (below
900F) until Saturday morning, October 24. It is important to note that this
kiln was built without thermocouples, so the only check and estimation of
temperature was the experience of the kilnmaster, Andrew Barry. On
Saturday, the eyes of the kiln were fitted with iron “doors,” to help keep
heat in, and the protective canvas rain cover was removed from the top of

20
the kiln. The temperature of the fires was brought up slowly by adding an
increasing number of logs per hour, reaching a peak temperature about
Tuesday night and maintaining that until about 6:00AM Wednesday
morning when the kiln eyes were sealed up with daub. At this point the
kiln was allowed to sit with the canvas rain cover on until spring when the
bricks would be needed for construction projects.
Throughout this whole process, the kiln was attended around the
clock. The fires were stoked each hour and since the general trend of the
kiln temperatures had been established from previous burns, data was
taken in a manner commensurate with kiln activity. This resulted in a total
of 44 trips to the kiln in one week (an average of every two and a half
hours between Friday, October 23 and Wednesday, October 28), with
data being collected in the form of a video (VCR) recording of the output of
the Inframetrics camera.
Figures 13, 14,15 and 16 are representative examples of
thermograms of the kiln. Each is labeled according to date and time , and
designated as one of four sides (1 through 4). These are labels
constructed to keep track of the data during analysis. Side 1 is the side
with eyes closest to the drying tent, side 2 is the side without eyes furthest
from the tent, side 3 is the side with eyes closest to the footpath and side
4 is the side closest to the tent.

21
Figure 13- Saturday, 3:50AM, side 3
Figure 14- Monday 4:30AM, side 3
Figure 15- Tuesday, 5:45AM, side 3
Figure 16- Tuesday, 10:00 PM, side 4
IX THE FINITE ELEMENT MODEL:
The first step in understanding the kiln was to assemble a finite
element model that could match the kiln’s behavior. Finite element
models allow the calculation of quantities such as heat flow through
complicated geometries using initial boundary conditions.

22
A.THE BASICS OF FINITE ELEMENT MODELING
Finite element modeling, or FEM, is a computer driven technique to
aid in the analysis of structures and continua. Although the use of
classical methods is probably the best way to analyze simple structures,
when the geometry of a solid becomes complex, the complexity of
classical methods quickly becomes prohibitively difficult. In such cases, a
FEM is usually used to obtain a numerical solution.
The most important distinction between a classical solution and a
finite element solution is in the way each "looks" at the solid. Classical
approaches treat solids as continua whose behavior is governed by partial
or ordinary differential equations, while FEM solutions view the solid as an
assembly of finite sized particles. These particles are referred to as finite
elements and the points at which one element touches another is called a
node. The behavior of the particles (elements) and thus the overall
geometry, is obtained by formulating a system of algebraic equations that
can be solved by a computer.11
The use of classical methods is probably the best way to analyze
simple structures, but when the geometry becomes complicated, finite
element models become much more practical, if not necessary. A typical
finite element solution to a structural problem will consist of several steps.
The first step is to model, or discretize the structure. This consists of
drawing the geometry of the structure into the program and dividing it into
appropriately sized elements, or meshing the solid, as it is referred to.
Next, the elements are assigned appropriate properties, such as density,

23
specific heat capacity, or thermal conductivity. Loads, such as heat flux or
forces, are then applied and boundary conditions are assigned. A typical
boundary condition might be ambient temperature, or an immovable side
of a plate under stress. The last step is to solve the linear system of
algebraic equations generated by the aforementioned steps, and to
display the results in a meaningful way using images, plots, or data tables,
for example.12
A program called COSMOS/M was used to create just such a
model of the brick kiln. As might be expected, however, this model was
based on myriad assumptions. The following is an account of each and
how it contributed to the model. It is important to note here that only the
final geometries and values used are chronicled here. In fact, the model
described below is roughly the tenth consecutive model built in an attempt
to describe the kiln accurately.
B. DIMENSIONAL AND STRUCTURAL ASSUMPTIONS OF THE
MODEL
The model was made to scale in SI units from measurements taken
of the kiln and minor geometrical simplifications were made. The most
significant of these was the assumption that the tunnels were pointed at
the top and ended below the body of the kiln when in fact the tops were
corbeled and reached into the body nearly six inches. Another
simplification was to slightly enlarge the

24
the small vent holes intended to see pottery cones during the early stages
of the firing, and later sealed. This assumption was made because mesh
density of the model was too coarse (.25m x .25m x .25m) to allow smaller
holes to be constructed.
C. PROPERTY ASSUMPTIONS OF THE MODEL
The first, and perhaps most important, assumption made was to
consider the kiln as two separate but connected solid masses. The first of
these was the permanent, mortared kiln shell, while the other was the
mass of unfired bricks in the center of the kiln. Each of these had
different property values. For example, the loosely packed bricks in the
center transmitted heat much more readily than the mortared outer walls.
The assumption of solid volume was made to enable the COSMOS/M
HSTAR module to handle the necessary computations in a feasible
amount of time. In reality, the kiln is comprised of evenly spaced bricks in
orderly rows. This simplification from a solid with regular gaps to a
complete solid is similar to the assumption that the woven fabric of a shirt
can be assumed to be one type of material rather than an assemblage of
tiny strings.

25
Figure 17- Skeleton of FEM showing geometric assumptions
Following the geometrical assembly of the kiln in the modeling
program, it was necessary to determine which factors accounted for heat
transfer and heat loss.
D. ASSUMPTIONS CONCERNING CONDUCTION
Conduction is simply the transfer of energy from the more
energetic particles of a substance to those particles of the substance with
less energy. In solids, as is the case here, this transfer is due to
vibrations and free electron transport. The rate of conduction through a
layer of material is proportional to the temperature difference across the
layer, but inversely proportional to the thickness of the layer. This relation
can be described by:

26
an equation known as Fourier’s law of heat conduction. Q is defined as a
heat flux, through an area A, with a rate given by �T/�x. The constant of
proportionality, k, is known as thermal conductivity, and was one of the
parameters required by COSMOS/M in the design of the model. The
value for "common brick" was obtained from a table as .72 W/(m K).13
This value was scaled down to 80 per cent of its original value (.576) for
the mortared elements of the kiln to account for the fact that heat doesn't
propagate through the mortared walls as fast as through the main body.
This is due to the fact that the major mode of heat transfer was hot air
rising through the kiln, and there were no gaps for this current in the
mortared sections. The value for thermal conductivity of the central mass
of spaced bricks was .72 W/(m K) in both the x and z directions, but
increased to 7.2 in the y direction. This huge increase was to account for
the speed at which the heat propagated up through the kiln. This value
needed to be determined by experiment with the finite element model
because a value for thermal conductivity through unmortared bricks taken
as a solid obviously hasn't been determined experimentally. The
conductivity of the mortared bricks was assumed to be uniform in all
directions.
Since the kiln structure was simplified to a solid, by definition the
only way heat could transfer throughout the body of the kiln, at least as far
Qconduction = −kA∂T∂x

27
as the model was concerned, was conduction. This is also a simplification
because in the actual kiln, air could circulate between the bricks and there
would be convective heat exchange as well.
E. ASSUMPTION CONCERNING CONVECTION
Convection is the transfer of energy between a solid surface and an
adjacent liquid or gas that is in motion. The faster the motion, the greater
the energy transfer. For this model, natural convection is assumed, as
opposed to forced convection, which involves increasing the motion of the
surrounding gas artificially, and can be expressed by Newton’s law of
cooling:
where h is the convection heat transfer coefficient, A is the surface area,
Tsurface is the surface temperature and T� is the ambient atmosphere (fluid)
temperature. For the kiln model, h was assumed to be .1 W/(m2 K) across
the top of the kiln. Since the value of the heat transfer coefficient is
determined by the air around it and the orientation of the surface
(horizontal, vertical) and the shape of the surface (cylinder, plane), this
value was also chosen according to the behavior of the finite element
model. Convection was only considered on the top of the kiln, because
the top of the kiln was the only side on which the main body of the bricks
was open to the air. Radiation was the dominant heat transfer mode
Qconvection = hA(T surface − T∞)

28
elsewhere. Ts was calculated continuously by COSMOS/M and T� was
assumed to be 285K (55�F).
F. ASSUMPTIONS CONCERNING RADIATION
Radiation is energy emitted by matter in the form of
electromagnetic waves (photons) as a result of changes in the electronic
configurations of the atoms or molecules. Unlike conduction and
convection, radiation does not require a medium for transfer and can be
described by The Stefan-Boltzmann law
ε in this case is defined as emissivity, which, ranging between 0 and 1,
measures how closely a surface resembles a blackbody (1 being a perfect
emitter/absorber, 0 being a perfect reflector). The emissivity in this case
was taken to be .93, a value in keeping with information available for both
dried mud and brick faces.14 The Stefan-Boltzmann constant, σ, was
defined as 5.67x10⁻⁸ W/(m2 K2). The surrounding temperature was again
assumed to be a constant of 285K (55 F), and the surface temperature
was modeled roughly and estimated using a time curve generated from
data taken during the firing with a hand-held thermocouple. Thus, the
surfaces were not all considered to be radiating at the same rate and as a
result, as one would expect, the roof and portions of the kiln above the
eyes radiated much more heat than the sides of the kiln without eyes.
Qradiation = εσA(T
s
4 − Tsurrounding
4 ).

29
The density of all portions of the kiln was taken to be 1920kg/m3, 15
and the specific heat capacity of the bricks was taken to be 835J/kg K.16
These values were obtained from tables.
G. ASSUMPTIONS CONCERNING HEATING
Perhaps the most complicated part of the model was the
determination of how best to model the actual fires and the amount of heat
they expel. Because a fairly accurate account of the number of logs
thrown into each eye at a given phase of the firing was recorded, they
were the backbone of the fire model.
Given that birch has a density of 44 lbs/ft3 and maple has a density
of 38 lbs/ft3,17 it was assumed that the kiln was fired with typical hardwood
of density 40 lbs/ft3, 640 kg/m3. A cord of wood (nearly nine cords were
consumed throughout the burning) is 8 feet by 8 feet by 4 feet, but the
solid content of a stacked cord is only about 70% so it was assumed that a
cord of wood contains 2.5375 m3.18 Given that an average log thrown into
the kiln is roughly 16 inches long and 5 inches in diameter, the volume of
one average log was assumed to be .005 m3 and given the
aforementioned density of wood, the average log weighs 3.2 kg or roughly
3 kg (6.6lbs). Similarly, there are 1624 kg in a cord of wood. Now, it has
been assumed that the summits of the kiln tunnels would absorb about 80
percent of the heat from each log as it is burned and the remaining 20
percent would either be lost when the doors are opened or enter the side
walls of the tunnels. Given the dimensions of the kiln and the fact that

30
wood yields roughly 19,900 kJ/kg,19 a conservative estimate, it was
assumed that for each log burned, the top of the tunnels would experience
a heat flux of 467.0 W/m2 and the sides would experience a flux of
81.7W/m2. That correlates to 1842 Watts per log and assumes that each
log is burned completely in one hour.
These assumptions were then used in conjunction with a time curve
based on the number of logs burned per hour at the different eyes. A
fairly accurate picture was recorded of the heat flux in the kiln eyes during
the week of firing. Table 1 is a summary of the assumptions made for the
model. Value for kiln
shell Value for kiln body
DENSITY kg/m^3 1920 1920 THERMAL CONDUCTIVITY W/(m K)
in x direction
0.576 0.72
in y direction
0.576 7.2
in z direction
0.576 0.72
SPECIFIC HEAT J/(kg K) 835 835 General value DENSITY OF WOOD kg/m^3
640
MASS OF AVERAGE LOG kg
3
ENERGY PER LOG Watts
1842
Table 1- A summary of assumptions made about the kiln for the purposes of the finite element model.
The model was then executed for the entire week, producing the
following images. In looking at the images produced by the FEM, it is
important to remember the scales can differ from day to day, and that the

31
temperatures are given in Kelvin. The thermograms, however, were
recorded in Fahrenheit.
Figure 18-FEM temperature distribution for Wednesday noon. Temperature ranges from 285K (dark blue) to 2750K (red).
Figure 9- FEM temperature distribution for Thursday noon. Temperature ranges from 285K (dark blue) to 1710K (red).
Figure 20- FEM temperature distribution for Friday noon. Temperatures range from 286K (dark blue) to 869K (red).
Figure 21- FEM temperature distribution for Saturday noon. Temperatures range from 285K (dark blue) to 1300K (red).

32
Figure 22- FEM temperature distributions for Monday noon.

33
Figure 23- FEM temperature distribution for Tuesday noon. Temperatures range from 342K to 2820K.
Figure 24- FEM temperature distribution for noon on the second Wednesday. Temperatures range from 285K to 2750K.
Figure 25- FEM temperature distribution for noon on the second Thursday. Temperatures range from 286K to 1710K.
Figure 26- FEM temperature distribution for noon on the second Friday. Temperatures range from 286K to 1560K.
34
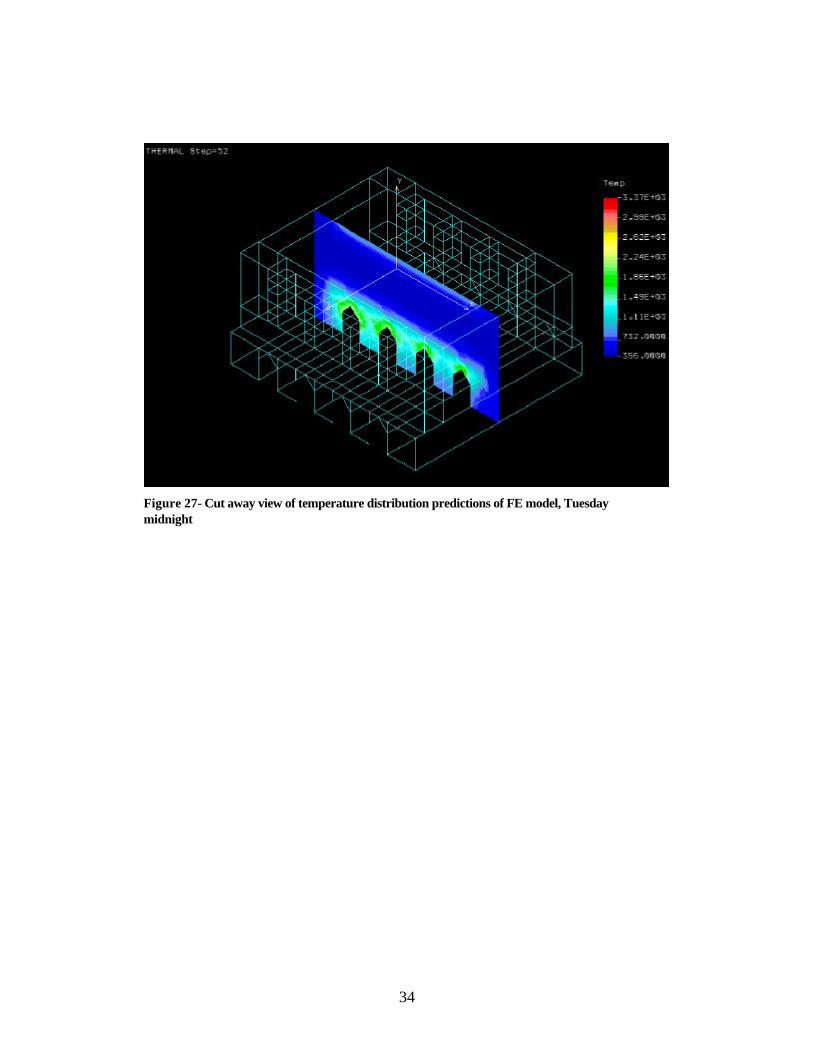
Figure 27- Cut away view of temperature distribution predictions of FE model, Tuesday midnight

35
Figure 28- End view of FEM predicted temperature distribution for side 1, Monday Noon
AD BC
36
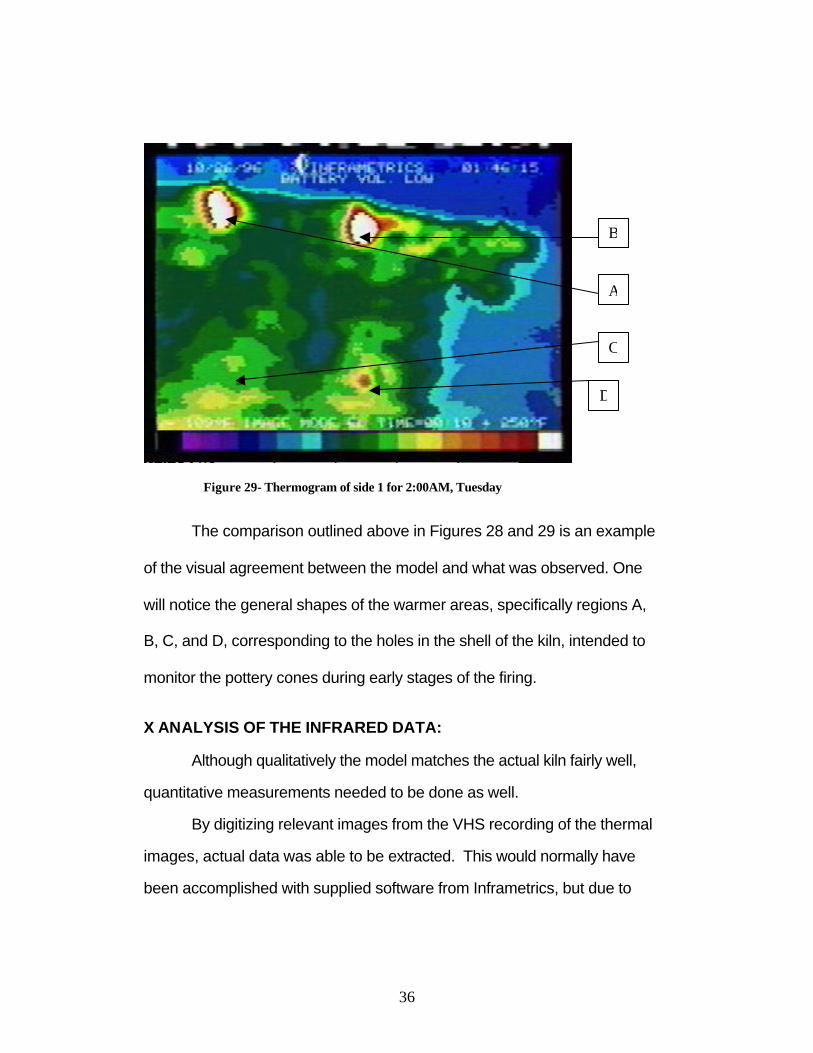
Figure 29- Thermogram of side 1 for 2:00AM, Tuesday
The comparison outlined above in Figures 28 and 29 is an example
of the visual agreement between the model and what was observed. One
will notice the general shapes of the warmer areas, specifically regions A,
B, C, and D, corresponding to the holes in the shell of the kiln, intended to
monitor the pottery cones during early stages of the firing.
X ANALYSIS OF THE INFRARED DATA:
Although qualitatively the model matches the actual kiln fairly well,
quantitative measurements needed to be done as well.
By digitizing relevant images from the VHS recording of the thermal
images, actual data was able to be extracted. This would normally have
been accomplished with supplied software from Inframetrics, but due to
B
A
C
D

37
the age of the system and accompanying computer, and the computer's
unreliability, the data was extracted by other means.
Using an image analysis program called IPLab,20 chosen because
of its availability and its ability to deal with color images, each thermogram
was converted to its hues. After this conversion, the images were inverted
and the scale across the bottom of each picture, unique to each, was used
to manually recalibrate the values of the pixels.
For example, for a thermogram with temperature ranging from102F
to 257F, in inverted hue form, the color corresponding to 102F would show
up on the image as a pixel value of 64 while that corresponding to 257F
would be 246. The pixel values could then be averaged over a relevant
area (a convenient feature of IPLab) and converted to their actual
temperature value. This conversion was accomplished with a hand
calculator, and the results were tallied by hand, and then entered into a
program for graphing.
Figures 30 and 31 are plots of time vs. temperature for two specific
positions on the kiln: the central region of side 1 and the upper right corner
of side 4. The solid lines represent the model's prediction, while the points
correspond to data taken from the thermograms at the same spots on the
kiln.

38
Figure 30- Temperature vs. time for both FEM predictions (solid line) and actual thermogram data (points) for the central region of side 1.
Figure 31- FEM predictions (solid) compared to actual data (points) for upper corner of side 4.
39
XI CONCLUSIONS:
From the comparisons and observations outlined in this paper, it
should be evident that a colonial style brick kiln can be modeled
accurately enough to provide insight into its workings and achieve a better
appreciation of heat flow through the body of a kiln. It is true that the 1998
burn was extremely successful, even without the help of technology, but it
would be a mistake to assume that colonial-style brickmaking has no use
for a nondestructive method for quality control based on that fact. The
ideas in this paper should be viewed as a beginning and the techniques
outlined in this paper are a positive first step towards the refinement of a
finite element model and improved infrared imaging procedures. These
improvements will lead to an even greater understanding of the
brickmaking process, increasing yield and safely permitting successfully
larger kilns to be constructed, without the necessity of experts to oversee
the process.
XII SUGGESTIONS FOR THE FUTURE:
If further steps are to be taken towards a standardized method of
nondestructive kiln evaluation, two areas should be focused upon as
areas in need of improvement: data acquisition and finite element model
assumptions.
Although the readings taken of the 1998 kiln were highly accurate
and detailed, it was challenging to extract relevant data due to the non-
standard manner in which the data was acquired. For example, during the

40
1998 burn, due to the bulkiness of the camera and the location of
obstacles like wood piles and uneven terrain, the kiln was often viewed
from different angles. At times the camera was also panned from side to
side and from top to bottom in order to cover the surface of the kiln. This
could be improved upon by using a snapshot style infrared camera and
taking data in a manner which would allow all of one side of the kiln to be
visible at one time. Thus, four images could be taken for each hour and
all of the images from each side could be easily compared. A method that
would allow on site evaluation of the data, through a laptop computer
would also be useful as a way to use the data being acquired to help the
kiln as it is being burned, instead of analyzing the burn after the fact.
The finite element model is another area receptive to improvement.
Making the geometry more realistic, improving the accuracy of the
constants involved, and making those constants dependent on
temperature would increase the effectiveness of the model. Specifically, a
better understanding of how best to model the body of the kiln would be a
great improvement. The 1998 kiln was modeled as a solid, transferring
heat through conduction. If this could be changed to a patterned solid with
gaps, convection could be considered inside the kiln.
With these suggestions and the material presented in this paper, it
is evident that if desired, a completely nondestructive, noninvasive
technique could be developed as a way to monitor the quality of bricks in a
colonial-style kiln and to further the understanding of heat transfer through
such a structure.

41
APPENDIX A: Brief History of Brickmaking
Before attempting to analyze a material such as brick, a process
like brickmaking, or a structure such as a kiln, it is important to understand
its history, especially given the fact that the kiln was built to be historically
accurate.
As the principal building material in the world today, bricks are
defined as a rectangular unit of clay and sand, either fired in a kiln or dried
in the sun. Bricks are also limited in size. As a rule of thumb, if you can
lift it with one hand, it is a brick. If it takes two hands to lift, it is a block, no
matter what material it is made of.21
Brickmaking has its roots in the mud huts of Mesopotamia around
5000 BCE.22 These mud huts dried slowly, shrank and cracked. To
alleviate this problem, the Mesopotamians mixed the mud with straw,
shaped this compound into manageable bricks, and left these primitive
bricks to dry in the sun before building with them. Evidence of the use of
these sun-dried bricks can be found in Europe, South America, India,
Africa, and Asia, as well as the Middle East and is in fact still used in some
areas where wood is unavailable as a fuel with which to fire the bricks.23
Sun-dried bricks, however useful, gave way to the stronger, more
useful kiln fired variety between 2500 and 2000 BCE.24 Brickmaking
flourished under the Sumerians until the collapse of the culture in roughly
1700 BCE, giving rise to the massive ziggurat of Ur and the Tower of
Babel. With the “loss” of brickmaking technology, it had to be relearned by

42
later civilizations, most notably the Romans. In fact, the Pantheon itself
owes much of its success to bricks, as well as concrete.25
Credit for the use of modern bricks, as opposed to the more flat
style favored by the Romans, however, should probably be given to the
Germans. Buildings built with the more familiar rectangular style of bricks
can be found in northern Germany as early as 1150. From Germany,
brickmaking spread through the agency of the Cistercians and the
Premonstratensians throughout Europe.26 Of particular importance is the
spread of brickmaking to Britain.
It is uncertain when or how brickmaking was introduced to England,
but it seems probable that the spread was a result of Britain’s trading links
to the Hanseatic league. It appears that along with the technology, bricks
mainly appeared in Britain as ballast on ships loaded with other goods.
There is evidence that very soon after bricks started arriving in Britain,
brickmakers from the continent, notably the Netherlands and Germany,
began arriving as well. As can be expected, brickmaking in England
gradually changed from a need-based operation to a speculative industry
and it is around this point in history that the story of Colonial brickmaking
begins.
It is often thought that the log cabin was the preferred form of early
North American dwellings, but in fact that style arrived with Swedish
settlers only as late as the end of the seventeenth century. Brick,
however, was a major building material from the beginnings of
colonization. Among the early Dutch and British settlers in the new world

43
brick construction was well known.27 Because of resistance to fire, brick
construction became more common as manufacturing became less
expensive.
To make bricks in a manner employed by early resident Virginians
is a long and at times delicate process. It is begun in the late fall, “before
Christmass” 28 by digging up a quantity of suitable clay. Suitable clay is
often characterized as a "mild clay," meaning that it contains between 30
and 35 percent sand. The clay to sand ratio affects bricks in a multitude of
ways. For example, the higher the clay content, the lower the firing
temperature. However, this benefit is offset by large amounts shrinkage
and the increased cracking encountered with such "fat clays."
Conversely, a "thin clay," or one that contains more than 35 percent sand,
requires temperatures well over 2000F, which is difficult to reach with a
wood fired kiln.29 Thus, a suitable clay is comprised of a middle ground
between high and low sand content. Once dug, the clay is left exposed
and allowed to “weather” or go through many freeze-thaw cycles in order
to break up large chunks and make it more workable. The clay is then,
after the last freeze, or around Easter, put in large pits dug for the purpose
and there mixed with sand and perhaps other types of clay. The pit is
then treaded barefoot until the clay has roughly the texture of dough or
peanut butter. This is done to remove any chunks of mud that may remain
and thus keep bricks from exploding during firing.
At this point the clay is molded into the typical brick shape by a
molder and moved to a sand bed to dry for several weeks in the sun.

44
Figure 32- "Bearing Off" the wet, or "green" bricks.30
After the clay bricks have dried sufficiently to make them somewhat hard,
they are stacked loosely in a covered tent built for the purpose and
allowed to sit until October, when the actual kiln structure is built.
The kiln itself can vary tremendously in size, from a small number
of bricks (about 5000) up to nearly 100,000 bricks. The kiln built in
October 1998 was roughly 16 feet square, nearly 9 feet tall, and consisted
of roughly 10,000 bricks (roughly enough for a large chimney). The bricks
are stacked carefully with about a finger spacing between each one so as

45
to allow heat to circulate more efficiently and tunnels, or eyes as they are
called, that run completely through the kiln are left at the base. The kiln is
then covered in mud, or daub, to help keep heat in, and keep smoke from
coming out the sides of the kiln.
At this point the kiln is ready to be fired. There are two important
components of firing, namely drying and the actual firing. The first of
these consists of the first couple of days of the firing process, and is
intended to simply finish “cooking out” the water from the bricks. Although
they may have been drying for a considerable amount of time in the sun,
water still remains and excessively high temperatures could crack the
bricks. The general signal that the drying is done comes in the form of
clear smoke. As the bricks dry, the smoke rising from the kiln is fairly thick
and is described as being "white and puffy." When the bricks have lost
most of their water, the smoke tends to run clear, signaling the next phase
of the burn. The next step is the actual firing, during which, depending on
the type of clay, the temperatures must reach at least 1650�F, ideally
around 1850�F but below 2000�F, for between eight and twelve hours.
This is the delicate part of the firing process because not enough heat will
result in poor bricks but too much will cause cracked and destroyed bricks.
The other challenge of this phase of firing is to allow the higher
temperatures to reach as many bricks as possible and thus increase the
percentage of bricks that are of better quality (naturally, the bricks closest
to the fire are extremely hard, and those furthest away are more soft).

46
The kiln is then left to cool for a period of time, disassembled,
sorted according to quality and then the bricks are ready for use.
Figure 33- Sealed up kiln cooling off

47
Figure 34- Photo showing the kiln partially disassembled as the bricks are being removed and sorted for use in the spring. Note the differing colors of the bricks, denoting differences in hardness. The grayish bricks are much harder than the more salmon colored ones.
APPENDIX B: NARRATIVE CHRONOLOGY OF 1998 KILN FIRING: This is a day by day account of the data taken. The times in bold listed without any narrative denote that data was taken, but nothing of particular note occurred.
Wednesday, Oct. 21, 1998-4:00PM At 4:00 in the afternoon I arrived at the kiln and took some measurements before the fires were lit. As could be expected, the data was fairly uninteresting, because the kiln was at about the same temperature as the surrounding environment.

48
8:45 PM After the kiln was lit, I took some measurements of the eyes of the kiln. This portion of the firing was only meant to dry out the bricks, so the fires are kept intentionally low. These measurements are fairly close in and only show heat right around the eyes. The eyes are still uncovered at this point. Thursday, Oct. 22 - 1:50PM It had rained a little (maybe 1/4 inch) the night before and the fires are still very low at this point. There is still virtually no signature at the ends of the kiln without eyes. This marks the first time you can see the vent holes with the IR camera. 10:50PM This reading only includes one perspective of the eyes. It is close up and the kiln is indeed warming up, but there still isn’t much signature from the ends of the kiln without eyes. Friday, Oct. 23 - 9:50AM This marks the first day that a visible temperature increase is visible throughout the kiln. The kiln has warmed up thoroughly. 3:30PM This is the first reading that I had the thermocouple for. This allowed me to get accurate ambient temperature readings and to read the temperature of the face of the kiln. The surface was about 96.8F and the reading inside the access hole is 280F (See figure). 10:00PM The heat is really visible throughout the kiln now. This is shown both in the IR pictures and the thermocouple readings. Saturday, Oct. 24 -8:45AM No IR data was taken this time because the video camera died on me and I had to go get the charger, but I took several thermocouple reading in different spots of the kiln.

49
10:00AM-10:30AM After sprinting to and from the lab to charge up the VCR battery at 10 AM the roof (logs and tarp) came off the kiln and at 10:30AM I took some more data, this time with commentary on position and variables after the data. This is a practice I keep up throughout the rest of the data. I take data and then, with the camera on video (visual) mode, I shoot video along with comments on variables or notes on things to notice. 11:45AM At this point the goal is to bring the kiln up to temperature (about 1400F) slowly. The iron doors are added at this point and the fires are beginning to get much hotter. 1:30PM This time I take a temperature reading on the far wall (without eyes) with the thermocouple. 3:00-3:15PM This time I take a temperature reading on the close wall (without eyes) with the thermocouple. I take a reading on only dried mud and it is important to note that the dried mud is in the hot sun. 4:20PM 5:45PM 8:40PM This marks one of the first times I pan from side to side in the video. The infrared video is followed by a dark narration (I hadn’t hooked up the floodlight yet). 9:35PM There is a dolphin sculpture in the near side of the kiln (as well as a ladder in the data). And on the side of the kiln with the eyes closest to the tent, a poker is visible in the video. 10:30PM Sunday 3:50AM (not including daylight savings time)

50
According to the interpreters, despite a constant rate of adding wood (5 sticks each per hour for the outer eyes and 4 per hour for the inner two eyes) the coals aren’t as good on the side closest to the public. The attempt is to spread the coals evenly throughout the length of the tunnels in the outer two eyes while piling the coals more to the middle of the two central tunnels. 7:00AM not including daylight savings time The positions of the camera are identical to those at 3:50AM. 10:00AM Now using daylight savings time A person daubing and a ladder are visible in the data. 11:30AM-12:15PM This set includes one image of the fourth tunnel (farthest from the tent) without the doors on. 3:00 - 3:30PM The hole in the wall above the eyes that I have been using to take temperature readings is now mudded up. There is also some new door art (Bobby painted a stick figure on the second door from the tent using a daubing brush). It is also convenient, because his drawing marks the iron door that is slightly thicker than the others. 5:45-6:00PM The first time I use the halogen floodlight on the VCR camera while doing my narration. 7:40PM 11:00 - 11:25PM One of the data sets is taken during a stoking. 12:00 Midnight Monday 1:00 - 1:20 AM A little fire glow is now visible through the top of the kiln (A ladder is used to climb up to see) immediately after the kiln is stoked.

51
4:15 - 4:30 AM The fires are quite high now. The wood rate is up to 9 sticks per hour for each of the outer two tunnels and 7 sticks per hour for each of the inner two tunnels. It is also interesting to note that I Took some infrared images of the kiln from pretty far away (60 feet). 9:15 - 9:45 AM There is some new daubed “art” on the door on the side of the kiln closest to the tent and the wood rate is still the same. 12:00 Noon - 12:20 PM 4:00 PM 6:15-6:30PM I take one reading close to the eyes on the side of the kiln closest to the public. 8:45 - 9:00PM An orangey glow is now visible through the cracks in the top of the kiln at all times (not just during the stoking). I measure the heat in one of these cracks with the thermocouple. Tuesday 2:00 - 2:20 AM I overslept a bit. The orange glow is becoming more pronounced in the cracks on the top of the kiln. 5:40 -5:50AM It is EXTREMELY FOGGY. At this point, the interpreters say that the tunnel closest to the tent is hot enough that they are backing off to only 5 sticks per hour for it. They are also slacking off to 7 per hour on the other outer tunnel. 8:50 AM It is less foggy, but still a bit damp. The lens of the IR camera may be a little fogged up. Some of the iron doors are rotated (their positions are switched). 12:45AM- 1:10PM A small region (roughly ten bricks) in the top course was removed from the roof of the kiln to facilitate heat flow.

52
4:00 - 4:20PM 6:25-7:00PM 9:45-10:00PM Wednesday 1:00 AM-1:30AM The peak temperature is reached (in theory) at about 10PM and this data is being taken during full stoke.. The idea at this point in the firing is to maintain this high temperature until about 6:00AM It is also extremely foggy and there is some condensation on the lens of the camera. 8:10AM No thermal data was taken due to the fact that I woke up asleep at my desk at 8:00AM, having missed the closing of the kiln, and was unable to take readings because I had a Chemistry Exam to attend. However, the last stoke was just after 5:30AM and then the doors were shut up by daubing over them and sealing the eyes shut. The kiln is now left to cool off on its own. 12-1:00PM The kiln is cooling off now. 9:00-9:45PM Thursday 7:45PM The signature has dropped off significantly enough to make the kiln fairly uninteresting to look at.

53
APPENDIX C: DATA FROM 1989 BURN The following is a compilation of plots of temperature (Kelvin) vs. time for given positions of the kiln fired in 1989. This data was compiled with the use of thermocouples by colonial interpreter in 1989 as the kiln was fired. It is important to note that since data was not taken in each case until the kiln had significantly heated up, a period of two and a half days, corresponding to a typical drying period, has been artificially added to the front of each plot to aid comparison with the 1998 kiln. Below is a diagram of the position of each thermocouple's position in the 1989 kiln. Note that in this thermocouple configuration, as opposed to the configurations from 1994, 1995, and 1996, all of the thermocouples are in the same plane.
Whole kiln Position 12 Position 11 Position 10 Position9 Position 8 Position 7 Position 6 Position 5 Position 4 Position 3 Position 2

54
55

56

57

58

59

60
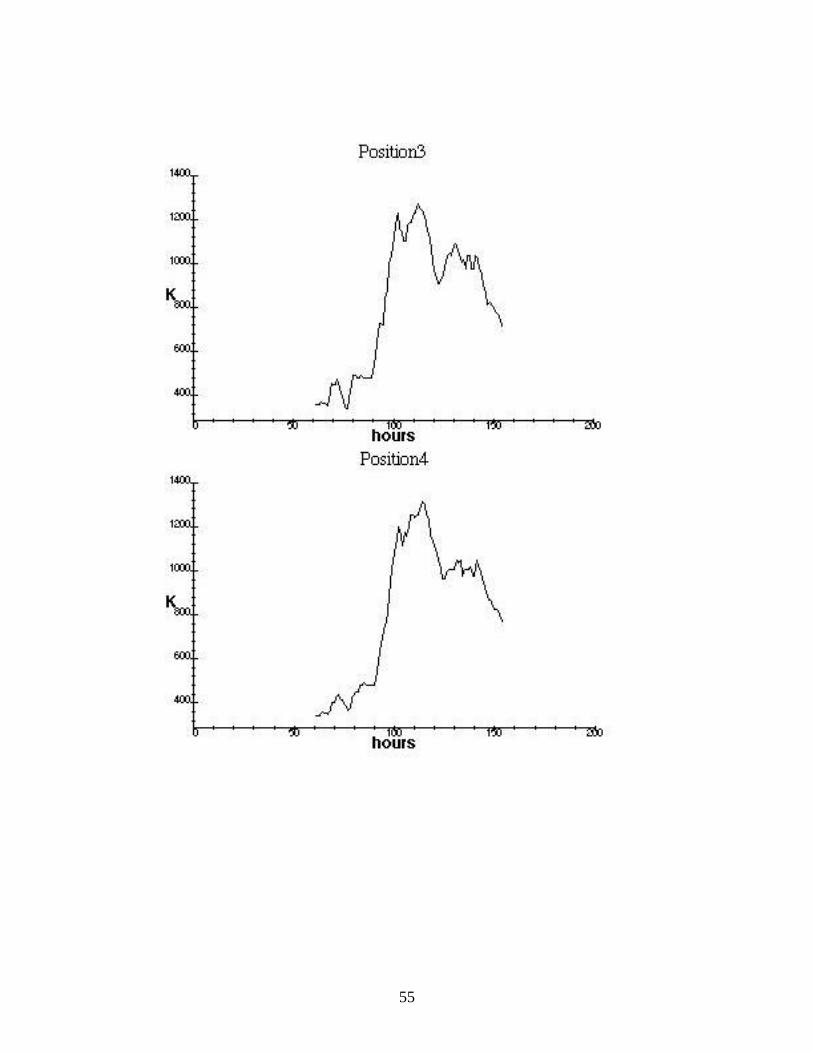
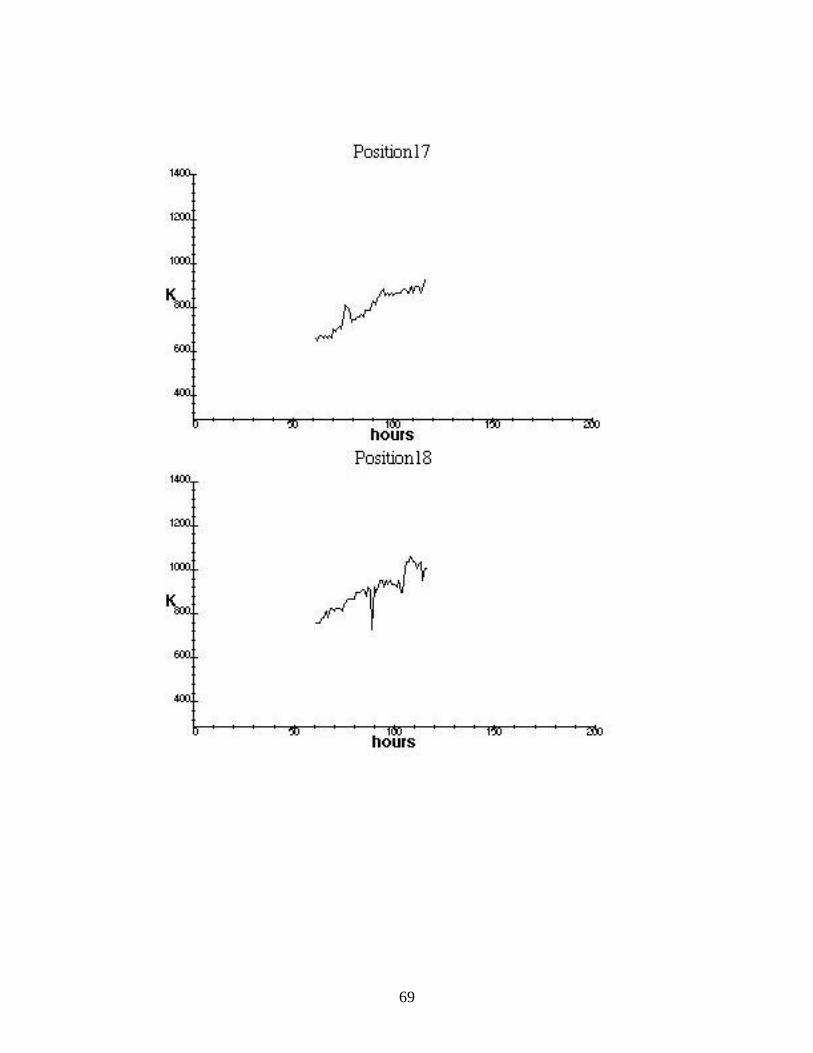
APPENDIX D: DATA FROM 1994 BURN The following is a compilation of plots of temperature (Kelvin) vs. time for given positions of the kiln fired in 1994. This data was compiled with the use of thermocouples by colonial interpreter in 1994 as the kiln was fired. It is important to note that since data was not taken in each case until the kiln had significantly heated up, a period of two and a half days corresponding to a typical drying period, has been artificially added to the front of each plot to aid comparison with the 1998 kiln. Below is a diagram of the position of each thermocouple in the kiln in 1994.
Top half of kiln
Bottom half of kiln Position 10
Position 11 Position 12 Position 13 Position 14 Position 15 Position 16 Position 17
Position 1 Position 2 Position 3 Position 4 Position 5 Position 6 Position 7 Position 8

61

62

63

64

65

66

67

68
69

70
APPENDIX E: DATA FROM 1995 BURN The following is a compilation of plots of temperature (Kelvin) vs. time for given positions of the kiln fired in 1995. This data was compiled with the use of thermocouples by colonial interpreter in 1995 as the kiln was fired. It is important to note that since data was not taken in each case until the kiln had significantly heated up, a period of two and a half days corresponding to a typical drying period, has been artificially added to the front of each plot to aid comparison with the 1998 kiln. Below is a diagram of the position of each thermocouple in the kiln in 1995. Top half of
kiln
Bottom half of kiln
Position 10 Position 11 Position 12 Position 13 Position 14 Position 15 Position 16 Position 17
Position 1 Position 2 Position 3 Position 4 Position 5 Position 6 Position 7 Position 8

71

72

73

74

75

76

77

78

79

80
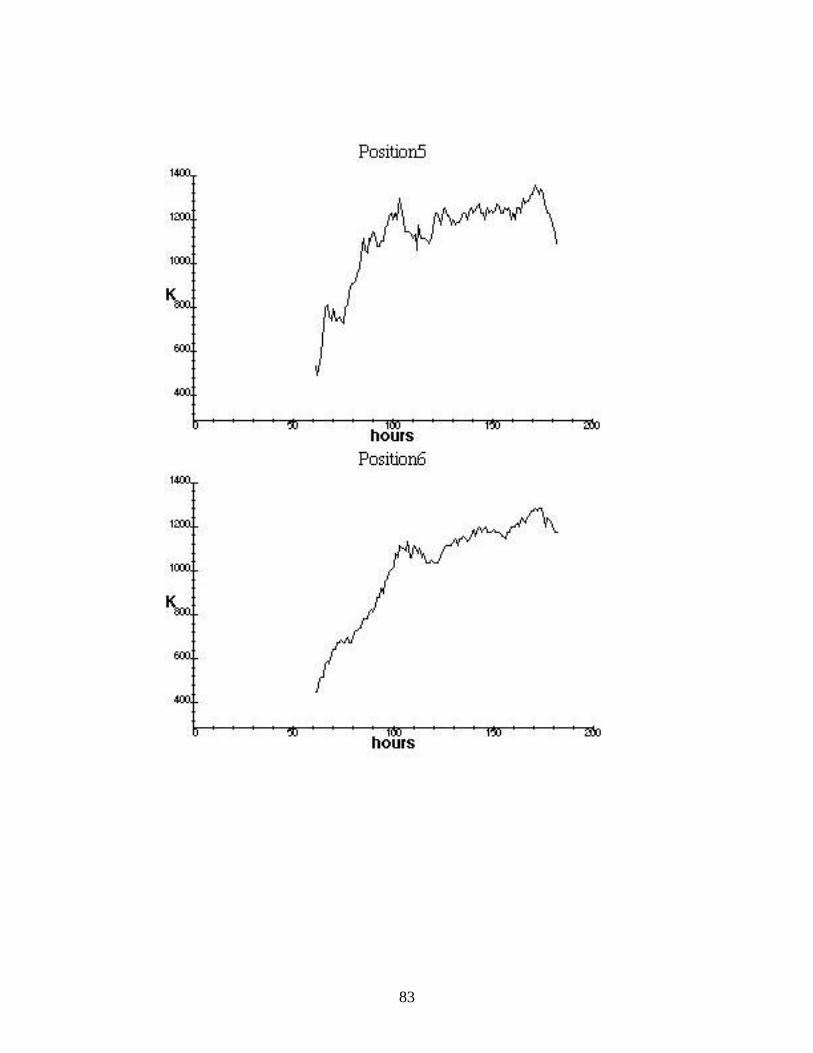
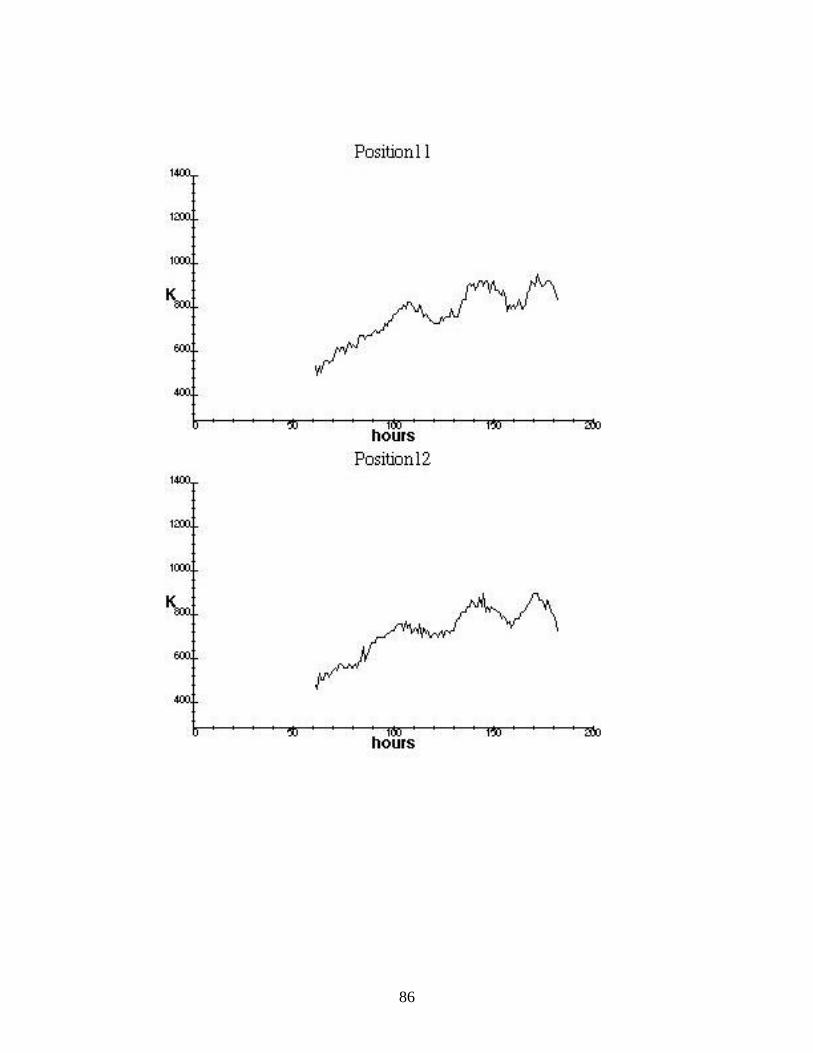
APPENDIX F: DATA FROM 1996 BURN The following is a compilation of plots of temperature (Kelvin) vs. time for given positions of the kiln fired in 1996. This data was compiled with the use of thermocouples by colonial interpreter in 1996 as the kiln was fired. It is important to note that since data was not taken in each case until the kiln had significantly heated up, a period of two and a half days corresponding to a typical drying period, has been artificially added to the front of each plot to aid comparison with the 1998 kiln. Below is a diagram of the position of each thermocouple in the kiln in 1996.
Top half of kiln
Bottom half of kiln
Position 10 Position 11 Position 12 Position 13 Position 14 Position 15 Position 16 Position 17 Position 18
Position 1 Position 2 Position3 Position 4 Position 5 Position 6 Position 7 Position 8 Position 9

81

82
83

84

85
86

87

88

89

90
REFERENCES
1 Bill Weldon, in Colonial Williamsburg Historic Trades, Volume II, (Colonial Williamsburg, Williamsburg Virginia, 1990), pp. 25. 2 Weldon, pp. 2-3. 3 Weldon, pp. 24. 4 Inframetrics 600 Operator's Manual, Document #05250-200 REV C (Inframetrics, May 1988), Ch. 3, pp. 9. 5 Inframetrics 600 Operator's Manual, Ch. 1, pp. 1-2. 6 Inframetrics 600 Operator's Manual, Ch. 1, pp. 1-2. 7 Inframetrics 600 Applications Manual, (Inframetrics, Bedford, MA) Section 5, pp.6. 8 Inframetrics 600 Operator's Manual, Ch. 2, pp. 1. 9 Weldon, pp. 20. 10 Weldon, pp. 21. 11 Constantine C. Spyrakos, Finite Element Modeling in Engineering Practice, (West Virginia University Press, Morgantown, WV, 1992), pp.2. 12 Spyrakos, pp.3. 13 Yunus A. Çengel, Introduction to Thermodynamics and Heat Transfer, (McGraw-Hill, N.Y., 1997) pp.85. 14 Çengel pp. 88. 15 Çengel pp. 871. 16 Çengel pp. 871. 17 Machinery's Handbook, Ed. Erik Oberg, (Industrial Press, New York, 1996) pp. 376

91
18 Marks' Standard Handbook for Mechanical Engineers, Ed. Eugene Avallone and Theodore Baumeister III, (McGraw-Hill, N.Y., 1987) Ch.7, pp. 12. 19 Marks' Standard Handbook for Mechanical Engineers, Ch.7, pp. 11. 20 IPLab, (Scanalytics, Alexandria, Virginia, Scanalytics.com). 21 Andrew Plumridge and Wim Meulenkamp, Brickwork: Architecture and Design, (Harry N. Abrams, NY, 1993) pp. 7. 22 Plumridge, pp. 10. 23 Plumridge, pp. 10. 24 Plumridge, pp. 10. 25 Plumridge, pp.16. 26 Plumridge, pp. 22. 27 Plumridge, pp. 38. 28 Weldon, pp. 6. 29 Weldon, pp. 2-3. 30 Weldon, pp. 15. 31 Weldon, pp. 24.

92
Works Consulted Establishment of the Brick and Tile Industry in Developing Countries, (United Nations Press, New York, 1969). J.L Ericksen, Introduction to the Thermodynamics of Solids, (Chapman and Hall, London, 1991). J.P. Holman, Heat Transfer 8th ed. (McGraw-Hill, New York, 1997). Xavier P.V. Malgague, Nondestructive Evaluation of Materials by Infrared Thermography, (Springer-Verlag, New York, 1993). Nathaniel Lloyd, A History of English Brickwork, (William Helburn, London, 1928). Jean Taine and Jean-Pierre Petit, Heat Transfer, (Prentice Hall, New York 1993). Jane A. Wight, Brick Building in England, (John Baker, London, 1972).