2011 irp public input meeting december 15, 2010 · east side resources 8 supply side resources...
TRANSCRIPT
Pacific Power | Rocky Mountain Power | PacifiCorp Energy
2011 IRP Public Input Meeting
December 15, 2010

Agenda
• 2011 IRP schedule update and next steps
– Resource portfolio development status
• Supply Side Resources update
• Final capacity/energy load & resource balances
• Capacity expansion model set-up
• Stochastic model parameter update
• Proposed preferred portfolio selection approach
2

Pacific Power | Rocky Mountain Power | PacifiCorp Energy
IRP Schedule Update and Next Steps
3
Pete Warnken

Recent Milestones
• Distributed Loss of Load Study on November 18, 2010
– PacifiCorp selected a 13% planning reserve margin for portfolio
development
• Distributed October 5 IRP public input meeting report and
dispersed generation resource attribute workbook
• Distributed updated Portfolio Development Case List on
November 18, 2010
• Completed analysis of sustained hydro peaking capability
– will distribute associated report in December 2010
4

Remaining 2011 IRP Schedule
5
IRP Public Meetings*
General Public Meetings 15 X X
Wind integration study follow-up
Model tutorial
Status report/issue resolution conference calls
* Specific meeting dates will be determined after considering state regulatory calendars, participant availability, and meeting preparation requirements.
IRP Development Schedule
Hydro capacity accounting methodology assessment X
Stochastic parameter update (loads, CO2 price) X
System Optimizer portfolio development, sensitivity cases
PaR stochastic simulations and results reporting
Preferred portfolio analysis and selection
Action Plan development/contingency planning
Market reliance and hedging analysis
Stochastic analysis of illiquid market scenario
Western market assessment
Hedging
IRP report preparation, 1st draft
Public review of draft IRP report (30 days)
IRP report preparation, final draft
Commission filing, 3/31/2010 X
To Be Determined
2010 2011
Dec Jan Feb March
To Be Determined
To Be Determined

Next Steps…
• Next public meeting, to be scheduled for mid-
January 2011, will focus on:
– Portfolio development and stochastic results
– Preferred portfolio selection
– Portfolio sensitivity cases
– Status update on market reliance and hedging
analysis
• Model tutorial – February 2011?
– Presentation development activities starting in
January 2010
– Working with Ventyx on non-disclosure agreement
6

Pacific Power | Rocky Mountain Power | PacifiCorp Energy
Supply Side Resource Update
7
Jim Lacey

East Side Resources
8
Supply Side Resources
DRAFT (IRP PIM December 15, 2010)
Description
Installation
Location
Earliest In-
Service
Date
Average
Capacity
MW
Design
Plant Life
in Years
Annual
Average
Heat Rate
HHV
(BTU/kWh)
Maint.
Outage
Rate
Equivalent
Forced
Outage
Rate
(EFOR)
Low
Estimate
Capital
Cost
($/kW)
High
Estimate
Capital Cost
($/kW )
Var.
O&M
($/MWh)
Fixed
O&M
($/kW-yr)
Utah PC without Carbon Capture & Sequestration Utah 2020 600 40 9,106 4.6% 4.0% $2,923 $3,692 $0.96 $38.80
Utah PC with Carbon Capture & Sequestration Utah 2025 526 40 13,087 5.0% 5.0% $5,285 $6,676 $6.71 $66.07
Utah IGCC with Carbon Capture & Sequestration Utah 2025 466 40 10,823 7.0% 8.0% $5,117 $6,463 $11.28 $53.24
Wyoming PC without Carbon Capture & Sequestration Wyoming 2020 790 40 9,214 4.6% 4.0% $3,310 $4,181 $1.27 $36.00
Wyoming PC with Carbon Capture & Sequestration Wyoming 2025 692 40 13,242 5.0% 5.0% $5,985 $7,559 $7.26 $61.37
Wyoming IGCC with Carbon Capture & Sequestration Wyoming 2025 456 40 11,047 7.0% 8.0% $5,794 $7,318 $13.52 $58.00
Existing PC with Carbon Capture & Sequestration (500 MW) Utah/Wyo 2025 (139) 20 14,372 5.0% 5.0% $1,314 $1,660 $6.71 $66.07
Utility Cogeneration Utah 2014 10 20 4,974 10.0% 8.0% $4,449 $5,619 $23.29 $1.86
Fuel Cell - Large Utah 2013 5 30 7,262 2.0% 3.0% $1,668 $2,106 $0.03 $8.40
SCCT Aero Utah 2014 118 30 9,773 3.8% 2.6% $1,047 $1,322 $5.63 $9.95
Intercooled Aero SCCT Utah 2014 279 30 9,379 3.8% 2.9% $1,229 $1,553 $3.93 $7.01
Internal Combustion Engines Utah 2014 301 30 8,806 5.0% 1.0% $1,204 $1,521 $5.50 $6.49
SCCT Frame (2 Frame "F") Utah 2014 362 35 10,446 3.8% 2.7% $1,037 $1,310 $7.16 $5.41
CCCT (Wet "F" 1x1) Utah 2015 263 40 7,302 3.8% 2.7% $1,253 $1,583 $2.94 $13.04
CCCT Duct Firing (Wet "F" 1x1) Utah 2015 42 40 8,869 3.8% 2.7% $511 $646 $0.39 $0.00
CCCT (Wet "F" 2x1) Utah 2014 539 40 6,885 3.8% 2.7% $1,014 $1,280 $2.98 $8.19
CCCT Duct Firing (Wet "F" 2x1) Utah 2014 86 40 8,681 3.8% 2.7% $511 $646 $0.55 $0.00
CCCT (Dry "F" 2x1) Utah 2015 512 40 6,963 3.8% 2.7% $1,134 $1,433 $3.35 $9.69
CCCT Duct Firing (Dry "F" 2x1) Utah 2015 85 40 8,934 3.8% 2.7% $571 $721 $0.11 $0.00
CCCT (Wet "G" 1x1) Utah 2015 333 40 6,777 3.8% 2.7% $1,185 $1,497 $4.56 $6.75
CCCT Duct Firing (Wet "G" 1x1) Utah 2015 72 40 9,021 3.8% 2.7% $502 $634 $0.36 $0.00
CCCT Advanced (Wet) Utah 2018 400 40 6,651 3.8% 2.7% $1,308 $1,653 $4.56 $6.75
CCCT Advanced Duct Firing (Wet) Utah 2018 75 40 9,021 3.8% 2.7% $642 $811 $0.36 $0.00
Wyoming Wind (35% CF) Wyoming 2012 100 25 n/a n/a n/a $2,015 $2,686 $0.00 $31.43
Utah Wind (30% CF) Utah 2012 100 25 n/a n/a n/a $2,015 $2,686 $0.00 $31.43
East Side Geothermal Utah 2015 35 40 n/a 5.0% 5.0% $4,063 $5,132 $5.94 $110.85
Greenfield Geothermal Utah / Idaho 2017 35 40 n/a 5.0% 5.0% $5,826 $7,359 $5.94 $209.40
Battery Storage All 2015 5 30 11,000 1.9% 5.0% $1,924 $2,431 $10.00 $1.00
Pumped Storage Nevada 2020 250 50 12,500 5.0% 5.0% $1,636 $2,067 $4.30 $4.30
Compressed Air Energy Storage (CAES) Wyoming 2015 350 30 11,980 3.8% 2.7% $1,241 $1,568 $5.50 $3.80
Nuclear Utah 2030 1,600 40 10,710 7.3% 7.7% $5,041 $6,368 $1.63 $146.70
Solar (PV) - 19% CF Utah 2012 5 25 n/a n/a n/a $3,982 $5,030 $0.00 $59.50
Solar Concentrating (natural gas backup) - 25% solar Utah 2014 250 30 n/a n/a n/a $3,831 $4,839 $0.00 $120.99
Solar Concentrating (thermal storage) - 30% solar Utah 2014 250 30 n/a n/a n/a $4,293 $5,423 $0.00 $135.56
Coal
Natural Gas (4500 feet)
Other - Renewables
EAST SIDE RESOURCE OPTIONS
Location / Timing Plant Details Outage Information Costs

West Side Resources
9
Supply Side Resources
DRAFT (IRP PIM December 15, 2010)
Description
Installation
Location
Earliest In-
Service
Date
Average
Capacity
MW
Design
Plant Life
in Years
Annual
Average
Heat Rate
HHV
(BTU/kWh)
Maint.
Outage
Rate
Equivalent
Forced
Outage
Rate
(EFOR)
Low
Estimate
Capital
Cost
($/kW)
High
Estimate
Capital Cost
($/kW )
Var.
O&M
($/MWh)
Fixed
O&M
($/kW-yr)
Utility Cogeneration Northwest 2014 0 20 4,974 10.00% 8.00% $4,044 $5,109 $21.17 $1.69
SCCT Aero Northwest 2014 130 30 9,773 3.85% 2.60% $952 $1,202 $5.12 $9.04
Intercooled Aero SCCT Northwest 2014 307 30 9,379 3.85% 2.90% $1,117 $1,412 $3.57 $6.37
Internal Combustion Engines Northwest 2014 331 30 8,806 5.00% 1.00% $1,094 $1,383 $5.50 $6.49
SCCT Frame (2 Frame "F") Northwest 2014 405 35 10,446 3.85% 2.70% $943 $1,191 $6.51 $4.92
CCCT (Wet "F" 1x1) Northwest 2015 289 40 7,302 3.85% 2.70% $1,139 $1,439 $2.67 $11.86
CCCT Duct Firing (Wet "F" 1x1) Northwest 2015 46 40 8,869 3.85% 2.70% $465 $587 $0.36 $0.00
CCCT (Wet "F" 2x1) Northwest 2015 578 40 6,911 3.85% 2.70% $1,029 $1,300 $2.67 $7.21
CCCT Duct Firing (Wet "F" 2x1) Northwest 2015 92 40 9,329 3.85% 2.70% $519 $656 $0.36 $0.00
CCCT (Wet "G" 1x1) Northwest 2015 367 40 6,777 3.85% 2.70% $1,077 $1,361 $4.14 $6.13
CCCT Duct Firing (Wet "G" 1x1) Northwest 2015 80 40 9,021 3.85% 2.70% $456 $576 $0.33 $0.00
CCCT Advanced (Wet) Northwest 2018 440 40 6,651 3.85% 2.70% $1,189 $1,503 $4.14 $6.13
CCCT Advanced Duct Firing (Wet) Northwest 2018 83 40 9,021 3.85% 2.70% $584 $737 $0.33 $0.00
Oregon / Washington Wind (35% CF) Northwest 2012 50 25 n/a n/a 5.00% $2,145 $2,860 $0.00 $31.43
Greenfield Geothermal Northwest 2015 35 40 n/a 5.00% 5.00% $5,826 $7,359 $5.94 $209.40
Solar (PV) - 19% CF Northwest 2012 5 25 n/a n/a n/a $3,982 $5,030 0 $59.50
Utility Cogeneration Northwest 2014 0 20 4,974 10.00% 8.00% $3,868 $4,886 $21.17 $1.69
SCCT Aero Northwest 2014 135 30 9,773 2.00% 2.60% $910 $1,150 $4.89 $8.65
Intercooled Aero SCCT Northwest 2014 321 30 9,379 3.85% 2.90% $1,069 $1,350 $3.42 $6.10
Internal Combustion Engines Northwest 2014 346 30 8,806 3.85% 1.00% $1,047 $1,322 $5.50 $6.49
SCCT Frame (2 Frame "F") Northwest 2014 423 35 10,446 5.00% 2.70% $902 $1,139 $6.23 $4.70
CCCT (Wet "F" 1x1) Northwest 2015 302 40 7,302 3.85% 2.70% $1,090 $1,377 $2.56 $11.34
CCCT Duct Firing (Wet "F" 1x1) Northwest 2015 48 40 8,869 3.85% 2.70% $445 $562 $0.34 $0.00
CCCT (Wet "F" 2x1) Northwest 2015 604 40 6,911 3.85% 2.70% $984 $1,243 $2.56 $6.89
CCCT Duct Firing (Wet "F" 2x1) Northwest 2015 96 40 9,329 3.85% 2.70% $497 $627 $0.34 $0.00
CCCT (Wet "G" 1x1) Northwest 2015 383 40 6,777 3.85% 2.70% $1,030 $1,302 $3.96 $5.87
CCCT Duct Firing (Wet "G" 1x1) Northwest 2015 83 40 9,021 3.85% 2.70% $436 $551 $0.31 $0.00
CCCT Advanced (Wet) Northwest 2018 460 40 6,651 3.85% 2.70% $1,138 $1,437 $3.96 $5.87
CCCT Advanced Duct Firing (Wet) Northwest 2018 86 40 9,021 3.85% 2.70% $558 $705 $0.31 $0.00
Oregon / Washington Wind (28% CF) Northwest 2012 100 25 n/a n/a 5.00% $2,145 $2,860 $0.00 $31.43
Biomass Northwest 2015 50 30 10,979 4.60% 4.00% $3,334 $4,211 $0.96 $38.80
Nuclear Northwest 2025 1,600 40 10,710 7.30% 7.70% $5,041 $6,368 $1.63 $146.70
Hydrokinetic (Wave) - 21% CF Northwest 2020 100 20 n/a n/a n/a $5,539 $6,997 $0.00 174.92
Solar (PV) - 19% CF Northwest 2012 5 25 n/a n/a n/a $3,982 $5,030 $0.00 $56.91
Other - Renewables
West Side Options at ISO Conditions (Sea Level)
Natural Gas
Other - Renewables
WEST SIDE RESOURCE OPTIONS
West Side Options (1500 feet)
Natural Gas
Location / Timing Plant Details Outage Information Costs
Pacific Power | Rocky Mountain Power | PacifiCorp Energy
Final Load and Resource Balances
10
Brian Osborn

Load and Resource Balance Changes
• Load and resource balance development based on a
13% planning reserve margin (Loss of Load study
conclusion)
• Change to Idaho irrigation dispatchable load control:
peak contribution reduced by 139 MW for all years
– Reflects revised expectation of load reductions available at the
time of dispatch
– Acknowledges system stability issues at certain substations
arising from growth in the irrigator network
• Incorporates updated hydro energy forecast
• Incorporates new east-side wind PURPA Qualifying
Facilities
– Pioneer wind I / II, and Power County Wind Park North / South
11

Initial Capacity Load and Resource Balance (Final)
12
-
2,000
4,000
6,000
8,000
10,000
12,000
14,000
16,000
2011 2012 2013 2014 2015 2016 2017 2018 2019 2020
Me
gaw
att
s
Obligation + 13% Planning Reserves
System Obligation
West Existing Resources
East Existing Resources
2012 Resource Gap:1,601 MW
Planning Reserves
2020 Resource Gap:3,852 MW

Initial Capacity L&R Balance (Final),
Line Item Details
13
Calendar Year 2011 2012 2013 2014 2015 2016 2017 2018 2019 2020
East
Thermal 6,019 6,026 6,028 6,028 6,028 6,046 6,046 6,046 6,046 6,046
Hydro 133 133 133 133 133 129 129 129 129 129
Class 1 DSM 324 329 329 329 329 329 329 329 329 329
Renewable 179 179 179 178 176 176 176 176 176 176
Purchase 655 705 604 304 304 283 283 283 283 283
Qualifying Facilities 152 187 206 206 207 206 207 207 206 206
Interruptible 281 281 281 281 281 281 281 281 281 281
Transfers 810 451 414 456 311 499 547 299 361 328
East Existing Resources 8,553 8,290 8,174 7,916 7,768 7,949 7,997 7,749 7,811 7,778
Load 7,112 7,344 7,566 7,805 8,009 8,201 8,377 8,544 8,712 8,896
Sale 758 997 1,045 745 745 745 659 659 659 659
East Obligation 7,870 8,341 8,611 8,550 8,754 8,946 9,036 9,203 9,371 9,555
East Reserves 930 984 1,032 1,063 1,090 1,117 1,129 1,151 1,173 1,196
East Obligation + Reserves 8,799 9,324 9,643 9,613 9,844 10,063 10,165 10,354 10,544 10,752
East Position (247) (1,034) (1,469) (1,698) (2,076) (2,114) (2,168) (2,605) (2,732) (2,974)
East Reserve Margin 10% 1% (4%) (7%) (11%) (11%) (11%) (15%) (16%) (18%)
West
Thermal 2,552 2,552 2,556 2,556 2,556 2,556 2,541 2,550 2,550 2,550
Hydro 1,103 958 958 957 958 959 958 958 902 745
Class 1 DSM - - - - - - - - - -
Renewable 77 71 71 71 71 71 71 71 71 71
Purchase 856 247 331 226 221 225 255 269 285 242
Qualifying Facilities 136 136 136 136 136 136 136 136 136 136
Transfers (809) (452) (416) (457) (311) (499) (547) (300) (360) (330)
West Existing Resources 3,915 3,512 3,636 3,489 3,631 3,447 3,415 3,684 3,584 3,414
Load 3,266 3,374 3,395 3,448 3,491 3,541 3,584 3,650 3,666 3,713
Sale 290 258 258 258 158 108 108 108 108 108
West Obligation 3,556 3,632 3,653 3,706 3,649 3,649 3,692 3,758 3,774 3,821
Planning reserves 351 440 432 452 446 445 447 454 454 465
Non-owned reserves 7 7 7 7 7 7 7 7 7 7
West Reserves 357 447 438 459 452 452 453 460 460 472
West Obligation + Reserves 3,913 4,079 4,092 4,165 4,101 4,100 4,145 4,218 4,234 4,293
West Position 2 (567) (456) (676) (470) (653) (730) (534) (650) (879)
West Reserve Margin 13% (3%) 1% (5%) 0% (5%) (7%) (1%) (4%) (10%)
System
Total Resources 12,468 11,802 11,810 11,404 11,399 11,397 11,412 11,433 11,395 11,192
System Obligation 11,425 11,973 12,264 12,256 12,403 12,595 12,728 12,961 13,145 13,376
Reserves 1,287 1,430 1,470 1,522 1,542 1,569 1,582 1,611 1,633 1,668
Obligation + 13% Planning Reserves 12,712 13,403 13,735 13,778 13,945 14,164 14,310 14,572 14,777 15,044
System Position (244) (1,601) (1,925) (2,373) (2,546) (2,767) (2,898) (3,139) (3,383) (3,852)
Reserve Margin 11% (0%) (3%) (6%) (8%) (9%) (10%) (11%) (13%) (16%)

Initial L&R Balance: Line Item Differences,
Final less October 5th Presentation
14
Calendar Year 2011 2012 2013 2014 2015 2016 2017 2018 2019 2020
East
Thermal - - - - (1) (1) (1) (1) (1) (1)
Hydro 1 1 1 1 1 (3) (3) (3) (3) (3)
Class 1 DSM (139) (139) (139) (139) (139) (139) (139) (139) (139) (139)
Renewable - - - - - - - - - -
Purchase - - - - - - - - - -
Qualifying Facilities - 34 54 54 54 54 54 54 54 54
Interruptible - - - - - - - - - -
Transfers (59) 47 (30) 147 (200) (45) 278 (285) 31 (256)
East Existing Resources (197) (57) (114) 63 (285) (134) 189 (374) (58) (345)
Load 1 1 1 - - 1 (1) - - 1
Sale - - - - - - - - - -
East Obligation 1 1 1 - - 1 (1) - - 1
Planning reserves 83 87 91 93 95 97 98 100 101 103
Non-owned reserves - - - - - - - - - -
East Reserves 83 87 91 93 95 97 98 100 101 103
East Obligation + Reserves 84 88 92 93 95 98 97 100 101 104
East Position (281) (145) (206) (30) (380) (232) 92 (474) (159) (449)
East Reserve Margin (3%) (1%) (1%) 1% (3%) (2%) 2% (4%) (1%) (4%)
West
Thermal - - 4 4 4 (8) (20) (20) (32) (32)
Hydro (32) (19) (18) (19) (23) (23) (23) (20) (23) (25)
Class 1 DSM - - - - - - - - - -
Renewable - - - - - - - - - -
Purchase - - - - - - - - - -
Qualifying Facilities - - - - - - - - - -
Transfers 61 (48) 27 (150) 201 46 (278) 284 (31) 254
West Existing Resources 29 (67) 12 (165) 181 15 (321) 243 (86) 197
Load (1) 1 1 1 (1) 1 1 - - 1
Sale - - - - - - - - - -
West Obligation (1) 1 1 1 (1) 1 1 - - 1
Planning reserves 27 34 33 35 34 34 34 35 35 36
Non-owned reserves - - - - - - - - - -
West Reserves 27 34 33 35 34 34 34 35 35 36
West Obligation + Reserves 26 35 34 36 33 35 35 35 35 37
West Position 3 (102) (22) (201) 148 (21) (357) 208 (121) 160
West Reserve Margin 1% (2%) 0% (4%) 5% 0% (9%) 7% (2%) 5%
System
Total Resources (168) (124) (102) (102) (104) (119) (132) (130) (144) (148)
System Obligation - 2 2 1 (1) 2 - - - 2
Reserves 110 121 124 128 129 132 132 135 136 139
Obligation + Planning Reserves 110 123 126 129 128 134 132 135 136 141
System Position (278) (247) (228) (231) (232) (253) (265) (265) (280) (289)
Reserve Margin (1%) (1%) (1%) (1%) (1%) (1%) (1%) (1%) (1%) (1%)

(2,500)
(2,000)
(1,500)
(1,000)
(500)
0
500
1,000
1,500
2,000
2,500
3,000
MW
a
System Off-Peak
System On-Peak
System Energy Position – On Peak / Off Peak
15
System On-Peak / Off-Peak hours

Pacific Power | Rocky Mountain Power | PacifiCorp Energy
System Optimizer Model Settings
16

Topology Changes
• West side: Added four new bubbles and
associated links to capture constraints relieved by
Hemingway – Boardman – Bethel (“Cascade
Crossing”) transmission project option
• Wind generation bubbles: Added to Oregon,
Utah, and Wyoming to enable assignment of
applicable incremental transmission investment
costs to wind selected by the model
17

2011 IRP Topology Changes – More Detailed West
18
BPA
Yakima
West Main
Borah
Walla Walla
Hermisto
n
Chehalis
Mid-C
$
COB
$
BPA
Yakima
Borah
Walla WallaMid-C
$
Hermiston
Chehalis
Portland / N. Coast
Willamette Valley /
Central Coast
South-Central OR /
N. California
COB
$
Bethel
Wind
2008 IRP Update
2011 IRP – West only
Wind Bubbles: Used for selection of wind resources requiring incremental transmission
investment beyond the base Energy Gateway footprint.

Front Office Transaction Limits
19
Market Hub / Proxy FOT Product 2011 IRP 2008 IRP Update
West Main / 3rd Quarter 6x16 50 MW 50 MW
Mid-Columbia / Flat 7x24 and 3rd Quarter 6x16400 MW + 375 MW with 10% price premium
400 MW
COB / Flat 7x24 and 3rd Quarter 6x16 400 MW 400 MW
• East-side FOT limits are still under review; PacifiCorp will distribute a table that includes the east-side limits subsequent to this meeting. The table below covers only the west-side
• For market hubs where both flat 7x24 and 3rd quarter 6x16 products are available, only one product type can be selected in a given year

Wind Resource Representation
New “cost step” approach to modeling wind resources
• Geographic zones based on Western Renewable Energy
Zones (WREZ) initiative Phase 1
• Capital costs based on a third party model have three
“cost steps” that vary by wind resource quality
• Incremental transmission costs are the full portion of the
Energy Gateway component necessary for the resource
– Three new wind-only bubbles:
• West, linked to BPA bubble (“Washington South”, ”Oregon Northeast” WREZ
zones)
• Utah, linked to Utah South bubble (“Utah West” WREZ zone)
• Wyoming, linked to Aeolus bubble (Wyoming “East Central”, “East”, “South”
WREZ zones)
– Walla Walla and Yakima each able to accommodate 100 MW of
new wind without new incremental transmission20
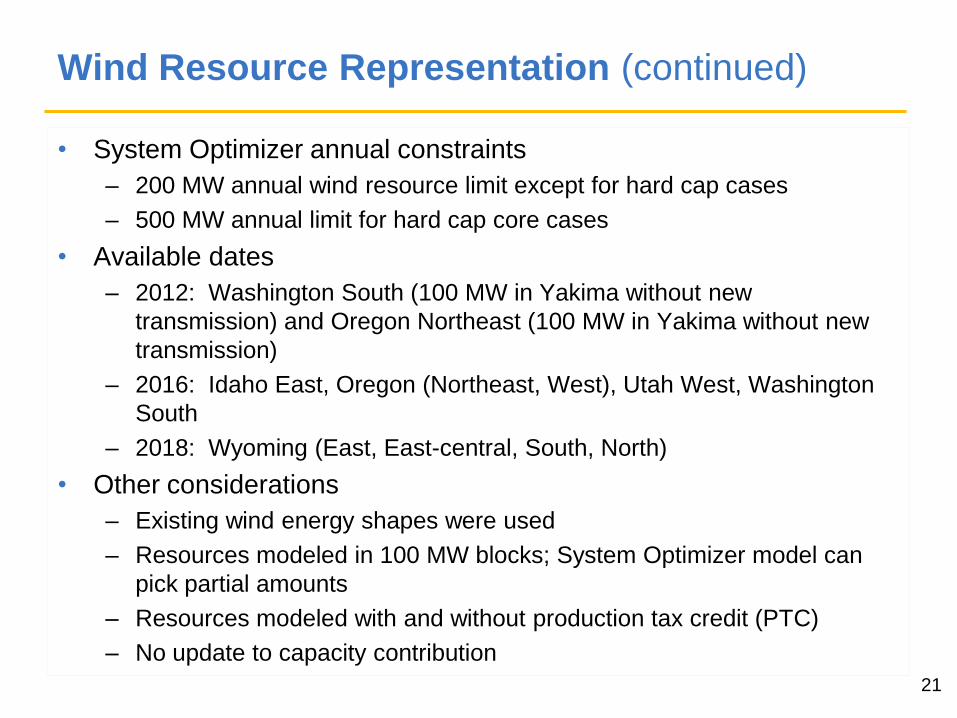
Wind Resource Representation (continued)
• System Optimizer annual constraints
– 200 MW annual wind resource limit except for hard cap cases
– 500 MW annual limit for hard cap core cases
• Available dates
– 2012: Washington South (100 MW in Yakima without new
transmission) and Oregon Northeast (100 MW in Yakima without new
transmission)
– 2016: Idaho East, Oregon (Northeast, West), Utah West, Washington
South
– 2018: Wyoming (East, East-central, South, North)
• Other considerations
– Existing wind energy shapes were used
– Resources modeled in 100 MW blocks; System Optimizer model can
pick partial amounts
– Resources modeled with and without production tax credit (PTC)
– No update to capacity contribution
21

WREZ Initiative Hub Map
22WREZ Map is found on page 5-5, figure 5-2 of the October 2009 Phase 1 report at
http://www.nrel.gov/docs/fy10osti/46877.pdf

Out-year Resource Representation
• All resource types, subject to “earliest in-service
year” constraints, are available throughout the 20-
year simulation period
• In addition, growth resources are available after
2020 for additional system capacity balancing
flexibility
– Similar to front office transactions, except that they are
not transacted at market hubs
– System Optimizer can select a flat or third-quarter
heavy load hour energy pattern priced at forward
market prices appropriate for each load area
23

Pacific Power | Rocky Mountain Power | PacifiCorp Energy
Stochastic Modeling Parameter Update
Connie Clonch
24

Stochastic Modeling Parameter Update
• Only the load stochastic parameters have been
updated for the 2011 IRP
– Load stochastics
• Short-term load parameters updated in PaR
– Seasonal volatilities
– Mean reversions
– Seasonal correlations
• Long-term load volatilities set to zero to avoid highly unlikely
load excursions in the out years
• Load Stochastics estimated by Transmission Area to Match
PaR load topology. Prior IRP load stochastics were
estimated by state
• Volatilities follow prior IRP estimates with Washington / West
Main the most volatile and Wyoming the least
25
.

Stochastic Modeling Parameter Update
• Capturing CO2 Price Uncertainty In the PaR
model
– Three CO2 price scenarios per portfolio
• No CO2 price
• Medium: $19/ton* in 2015, exceeding $51/ton by 2036
• Low-High: $12/ton* in 2015, exceeding $136/ton by 2036
– CO2 / natural gas price relationship enforced
• Using IPM®, scenario-specific natural gas curves are
produced as a function of CO2 price
• Resultant gas curves are then coupled with corresponding
CO2 price curves in PaR
26
* Nominal Dollars
IPM® is a North American production simulation model that optimizes electricity production costs under a given environmental paradigm.

Stochastic Modeling Parameter Update
Potential Future Enhancements to Investigate
– Explore Incorporating CO2 stochastics directly into
PaR
• Lack of observable US market data limits ability to estimate
CO2 parameters
• European market data for CO2 are available but have limited
relevancy
• Test CO2 parameters have been calculated using European
and IPM® - generated price movements. However,
parameters need to be further refined
– Expand Stochastic Correlations to Include CO2 / Coal
Prices
27

Pacific Power | Rocky Mountain Power | PacifiCorp Energy
Proposed Preferred Portfolio Selection
Approach
Pete Warnken
28
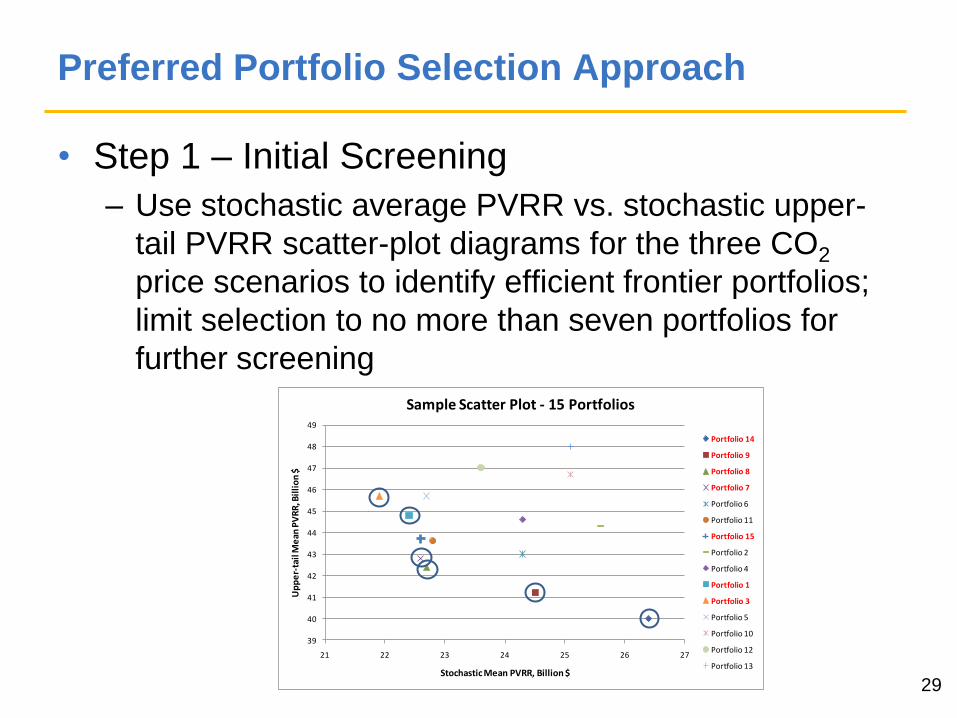
Preferred Portfolio Selection Approach
• Step 1 – Initial Screening
– Use stochastic average PVRR vs. stochastic upper-
tail PVRR scatter-plot diagrams for the three CO2
price scenarios to identify efficient frontier portfolios;
limit selection to no more than seven portfolios for
further screening
29
39
40
41
42
43
44
45
46
47
48
49
21 22 23 24 25 26 27
Up
pe
r-ta
il M
ean
PV
RR
, Bil
lio
n $
Stochastic Mean PVRR, Billion $
Sample Scatter Plot - 15 Portfolios
Portfolio 14
Portfolio 9
Portfolio 8
Portfolio 7
Portfolio 6
Portfolio 11
Portfolio 15
Portfolio 2
Portfolio 4
Portfolio 1
Portfolio 3
Portfolio 5
Portfolio 10
Portfolio 12
Portfolio 13

Preferred Portfolio Selection Approach
• Step 2 – Final Screening
– Evaluate relative performance of efficient frontier
portfolios based on the following measures, listed in
the order of importance
• Risk-adjusted PVRR – Stochastic mean PVRR plus the
expected value of the 95th percentile PVRR
• 10-year customer rate impact – Year by year and cumulative
percentage rate change by 2020, relative to 2011 revenue
requirement forecast
• Supply reliability – average annual Energy Not Served (ENS)
• Carbon dioxide emissions (generator plus net market
transaction contribution)
30

Preferred Portfolio Selection Approach
– Other portfolio performance measures will also be
reported
• Ave. annual probability of ENS events for July exceeding 25
GWh
• Production cost standard deviation (alternate cost risk
measure)
• Upper-tail ENS
– Scenario risk assessment using System Optimizer
• Determine range of deterministic PVRRs resulting from fixing
portfolios in System Optimizer under varying gas/electricity
and CO2 price assumptions
– PacifiCorp will explain its preferred portfolio selection
on the basis of the above measures and analysis, but
does not intend to use numerical weights for portfolio
ranking purposes31