2011-2012 solid waste management program information update · 28/01/2013 · 2011-2012 solid waste...
TRANSCRIPT
2011-2012 Solid Waste Management Program Information Update
January 2013
Last Updated: 1/28/2013
By: Maggie Conley
DEQ Report to Legislature
Land Quality Division Solid Waste 811 SW 6th Avenue Portland, OR 97204 Phone: (503) 229-5696 (800) 452-4011 Fax: (503) 229-6977 Contact: Maggie Conley www.oregon.gov/DEQ DEQ is a leader in restoring, maintaining and enhancing the quality of Oregon’s air, land and water.
This report prepared by:
Oregon Department of Environmental Quality
811 SW 6th Avenue
Portland, OR 97204
1-800-452-4011
www.oregon.gov/deq
Contact:
Maggie Conley
(503) 229-5106
Alternative formats (Braille, large type) of this document can be made available.
Contact DEQ’s Office of Communications & Outreach, Portland, at (503) 229-5696, or call toll-free in Oregon at 1-800-452-4011, ext. 5696.
3 3
Oregon Department of Environmental Quality 2011-2012 Solid Waste Management Program Information Update
DEQ Report to the Legislature
Table of Contents
Executive Summary ................................................................................................................... 1
1. Purpose ................................................................................................................................... 3
2. Solid Waste Programs ............................................................................................................ 4
A. Materials Management in Oregon: 2050 Vision and Framework for Action ................. 4
B. Product Stewardship ....................................................................................................... 5
Paint Product Stewardship Pilot Program ..................................................................... 5 Oregon E-Cycles ........................................................................................................... 6 Fluorescent Lamps ........................................................................................................ 7 Bottle Bill ...................................................................................................................... 7
C. Waste Prevention ............................................................................................................ 7
Green Building .............................................................................................................. 8 Foundation Research and Analysis ............................................................................... 8 Other Waste Prevention ................................................................................................ 9
D. Household Hazardous Waste ........................................................................................ 10
DEQ-sponsored HHW programs ................................................................................ 10 Local government HHW collection programs ............................................................ 10
E. Conversion Technology ................................................................................................ 10
F. Metro’s Waste Reduction Program: Compliance with State Requirements.................. 11
3. Waste Generation and Waste Reduction .............................................................................. 12
A. Waste Generation ......................................................................................................... 12
B. Recovery Rates ............................................................................................................. 13
Materials ..................................................................................................................... 15 Wasteshed recovery rates ............................................................................................ 16 Energy savings ............................................................................................................ 16 Greenhouse gas reductions ......................................................................................... 16
C. Disposal Data ................................................................................................................ 16
D. Composting ................................................................................................................... 17
4. Solid Waste Disposal Facilities ............................................................................................ 19
A. Municipal Disposal Facilities and Permits ................................................................... 19
B. Short-term Disposal Permits and Beneficial Uses ........................................................ 20
C. Solid Waste Orphan Account ....................................................................................... 20
5. DEQ Solid Waste Program Funding .................................................................................... 21

1 1
Oregon Department of Environmental Quality 2011-2012 Solid Waste Management Program Information Update
DEQ Report to the Legislature 1
Executive Summary This report fulfills DEQ’s requirement to report biennially to the Oregon Legislature on Oregon’s integrated solid waste management plan. It describes the 2050 Vision and Framework for Action that updates Oregon’s solid waste management plan. This report also addresses product stewardship, waste prevention, household hazardous waste, conversion technology, Metro’s waste reduction program, Oregon waste generation and waste reduction, solid waste disposal facilities and solid waste program funding. The report uses 2011 data (the most recent available), as well as historical trend information. The full 2011-2012 DEQ Solid Waste Management Program Information Update report and related information is on the DEQ Legislative Publications web page at www.deq.state.or.us/pubs/legislativepubs/.
Program Directions Solid waste policies and programs continue to evolve in response to the growing awareness of the significant environmental impacts materials and products have throughout their life cycles – from resource extraction and manufacturing to transport, use and disposal. For many products, impacts from production are much greater than impacts from disposal. In 2011 and 2012, DEQ continued to implement its waste prevention strategy, with a focus on waste prevention in the design and construction practices for residential buildings. DEQ also conducted research to help both public and private sectors focus efforts toward more effective waste prevention, including development of a consumption-based emissions inventory for greenhouse gases. This research estimates the globally-distributed emissions associated with satisfying consumption in Oregon, as well as differences in emissions between different types of materials. This information is valuable in prioritizing waste prevention efforts to achieve greater return on investment.
DEQ is working with stakeholders to develop product stewardship as a strategy to reduce the impacts of products through all life cycle phases and to manage the increasing volume and complexity of waste products. Product stewardship shifts primary responsibility for impacts over the life of a product to the producers of the product. In addition to the Oregon Bottle Bill, DEQ is implementing two legislated product stewardship programs -- Oregon E-Cycles and the pilot Paint Product Stewardship Program, which began in 2010.
In December 2012, the Oregon Environmental Quality Commission adopted Materials Management in Oregon: 2050 Vision and Framework for Action to help the state shift from managing wastes at the end of life or at time of discard to identifying what impacts are most significant and then focusing on actions to reduce them. This holistic approach represents a shift from solid waste to materials management. The 2050 Vision updates Oregon’s Statewide Integrated Resource and Solid Waste Management Plan and will guide DEQ’s and others’ work to reduce environmental impacts by managing materials throughout all stages of their life cycle. Materials management includes waste prevention and discard management. More broadly, it identifies impacts and actions to address those impacts of materials and products as they move through the economy including design, production, use and discards management.
Trends in Waste Generation and Management Waste generation is the sum of the tons disposed and tons recovered through recycling, reuse and energy recovery. Waste generation in 2011 totaled 4,740,561 tons, a one percent increase over 2010. This equates to 2,458 pounds per person for 2011, a 0.6 percent increase over per-capita generation in 2010. With these slight increases, the state narrowly missed both of the state’s waste generation goals. Nevertheless, the state continued a five-year trend of no or negligible increases in total or per-capita waste generation, in sharp contrast to much of the 1990s and early 2000s, when waste generation rose steeply. The per-capita waste generation rate for 2009-2011 is
2 2
Oregon Department of Environmental Quality 2011-2012 Solid Waste Management Program Information Update
DEQ Report to the Legislature 2
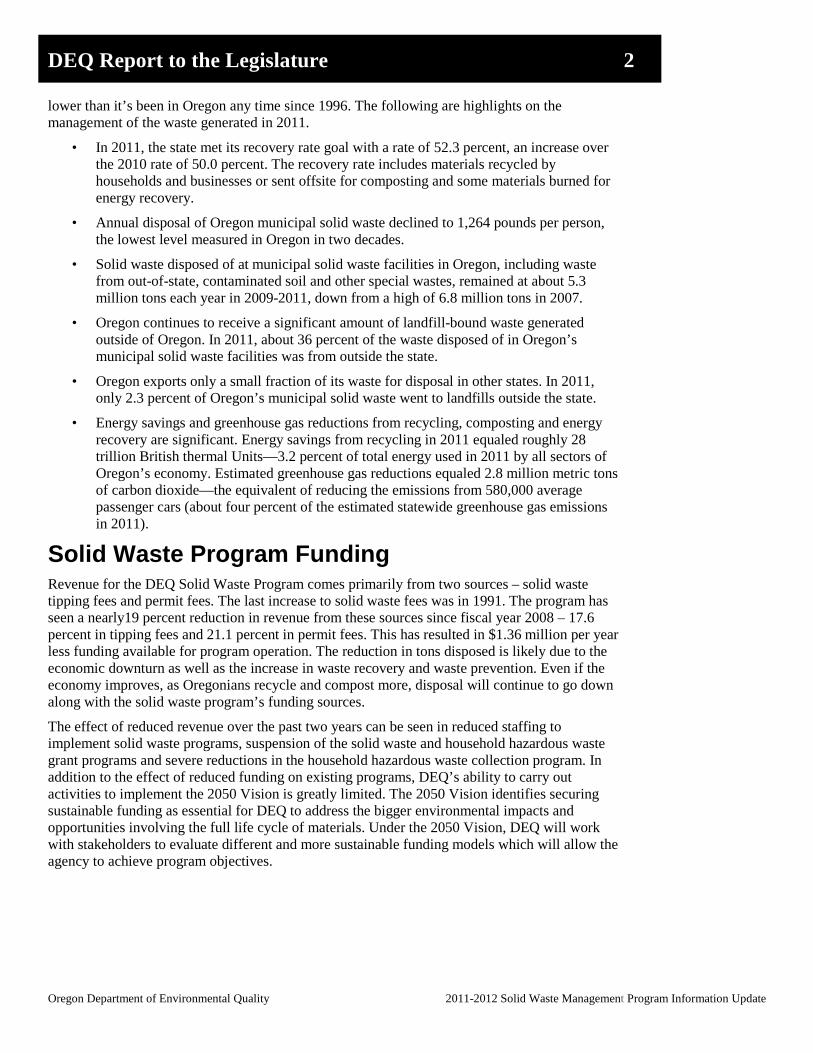
lower than it’s been in Oregon any time since 1996. The following are highlights on the management of the waste generated in 2011.
• In 2011, the state met its recovery rate goal with a rate of 52.3 percent, an increase over the 2010 rate of 50.0 percent. The recovery rate includes materials recycled by households and businesses or sent offsite for composting and some materials burned for energy recovery.
• Annual disposal of Oregon municipal solid waste declined to 1,264 pounds per person, the lowest level measured in Oregon in two decades.
• Solid waste disposed of at municipal solid waste facilities in Oregon, including waste from out-of-state, contaminated soil and other special wastes, remained at about 5.3 million tons each year in 2009-2011, down from a high of 6.8 million tons in 2007.
• Oregon continues to receive a significant amount of landfill-bound waste generated outside of Oregon. In 2011, about 36 percent of the waste disposed of in Oregon’s municipal solid waste facilities was from outside the state.
• Oregon exports only a small fraction of its waste for disposal in other states. In 2011, only 2.3 percent of Oregon’s municipal solid waste went to landfills outside the state.
• Energy savings and greenhouse gas reductions from recycling, composting and energy recovery are significant. Energy savings from recycling in 2011 equaled roughly 28 trillion British thermal Units—3.2 percent of total energy used in 2011 by all sectors of Oregon’s economy. Estimated greenhouse gas reductions equaled 2.8 million metric tons of carbon dioxide—the equivalent of reducing the emissions from 580,000 average passenger cars (about four percent of the estimated statewide greenhouse gas emissions in 2011).
Solid Waste Program Funding Revenue for the DEQ Solid Waste Program comes primarily from two sources – solid waste tipping fees and permit fees. The last increase to solid waste fees was in 1991. The program has seen a nearly19 percent reduction in revenue from these sources since fiscal year 2008 – 17.6 percent in tipping fees and 21.1 percent in permit fees. This has resulted in $1.36 million per year less funding available for program operation. The reduction in tons disposed is likely due to the economic downturn as well as the increase in waste recovery and waste prevention. Even if the economy improves, as Oregonians recycle and compost more, disposal will continue to go down along with the solid waste program’s funding sources.
The effect of reduced revenue over the past two years can be seen in reduced staffing to implement solid waste programs, suspension of the solid waste and household hazardous waste grant programs and severe reductions in the household hazardous waste collection program. In addition to the effect of reduced funding on existing programs, DEQ’s ability to carry out activities to implement the 2050 Vision is greatly limited. The 2050 Vision identifies securing sustainable funding as essential for DEQ to address the bigger environmental impacts and opportunities involving the full life cycle of materials. Under the 2050 Vision, DEQ will work with stakeholders to evaluate different and more sustainable funding models which will allow the agency to achieve program objectives.
3 3
Oregon Department of Environmental Quality 2011-2012 Solid Waste Management Program Information Update
DEQ Report to the Legislature 3
1. Purpose This report fulfills DEQ’s requirement to report biennially to the Oregon Legislature on Oregon’s integrated solid waste management plan, as outlined in Oregon Revised Statute 459A.015 and 459A.020. It describes DEQ’s 2050 Vision and Framework for Action, which updates Oregon’s solid waste management plan. It also provides an update of other Oregon solid waste programs and data for the years 2011 and 2012.
4 4
Oregon Department of Environmental Quality 2011-2012 Solid Waste Management Program Information Update
DEQ Report to the Legislature 4
2. Solid Waste Programs A. Materials Management in Oregon: 2050 Vision
and Framework for Action Materials Management in Oregon: 2050 Vision and Framework for Action was adopted by the Oregon Environmental Quality Commission in December 2012. It replaces the State Integrated Resource and Solid Waste Management Plan (1995-2005), which previously guided statewide policy on solid waste management and waste prevention. Much has changed since the Environmental Quality Commission adopted the first plan in 1994, and current research confirms that the vast majority of environmental impacts result from decisions made in design, production and consumption – not waste management. To effectively address evolving challenges and opportunities, Oregon must now look more broadly and systematically consider environmental impacts and actions to address them across the full life of materials. This holistic approach is called “materials management.” In the 2050 Vision DEQ shifts from managing wastes to managing materials to achieve the best environmental results at the lowest cost to society. Materials Management in Oregon: 2050 Vision and Framework for Action can be found at www.deq.state.or.us/lq/pubs/docs/sw/2050vision/MaterialsManagementinOregon.pdf
Materials management takes a comprehensive and holistic view of environmental impacts across the full life cycle of materials, as well as actions that can be taken to reduce those impacts. It includes resource extraction and the use of recovered materials, the design and production of materials and their use as well as management at end of life, including disposal and recovery. The shift from solid waste management to materials management will also help DEQ to be more effective. For example, in many cases looking upstream – at design, production and consumption - uncovers more effective opportunities to protect the environment. Optimizing just one stage of the life cycle can be unhelpful: there can be tradeoffs between different stages of the life cycle and so making good decisions requires looking at the big picture, not only production, or packaging, or transport, or disposal. The 2050 Vision reflects the already-changing nature of the state’s work and proposes a solid framework for continuing to reorient its efforts and adapt to new challenges and opportunities.
To develop the 2050 Vision, DEQ applied The Natural Step approach, which involves “backcasting,” starting with a future vision and then looking back to identify steps needed to achieve that vision. DEQ convened a workgroup of stakeholders representing businesses, nongovernmental organizations, local governments, state agencies and individuals to participate in the visioning process. The workgroup met for five day-long meetings and provided ideas, opinions and support drafting the document.
To support the workgroup, DEQ staff conducted significant research and wrote 14 background papers including an examination of the solid waste management hierarchy, best practices for managing food wastes and the policy and program options to make consumption and production more sustainable. The complete set of papers is available at www.deq.state.or.us/lq/sw/materialsmgmtplanbkgrddocs.htm.
Materials Management in Oregon: 2050 Vision and Framework for Action envisions a future where “Oregonians produce and use materials responsibly: conserving resources – protecting the environment – living well.” The 2050 Vision identifies actions to help reach that vision, including a need to establish new goals and outcome measures, realign DEQ resources for effective implementation, reprioritize existing resources and secure new resources as needed. Stakeholders involved in the visioning process recognized that these foundational actions are essential to move Oregon toward the 2050 Vision.

5 5
Oregon Department of Environmental Quality 2011-2012 Solid Waste Management Program Information Update
DEQ Report to the Legislature 5
The 2050 Vision lists about 50 actions without prioritization. DEQ is currently prioritizing them and will begin work on the highest priorities over the next few years as resources allow. Implementation of other actions will follow.
B. Product Stewardship Product stewardship refers to actions that minimize environmental, health, safety and social impacts while maximizing economic benefits of a product and its packaging throughout all life cycle stages. Product stewardship shifts primary responsibility for impacts over the life of a product to the producers of the product. The producer has the greatest ability to minimize adverse impacts, but other stakeholders such as suppliers, retailers and consumers also play a role. Stewardship can be either voluntary or required by law.
Following a stakeholder process, in 2010 DEQ developed a report recommending Oregon pursue product stewardship as a strategy to reduce the environmental and public health impacts of products. It also recommends eight key elements to be included in product stewardship programs in Oregon. This report, Recommendations for Product Stewardship in Oregon (2010), can be found at www.deq.state.or.us/lq/pubs/docs/sw/prodstew/RecommendationsforProductStewardshipinOregon.pdf
The three product stewardship programs DEQ worked on in 2011 and 2012 addressed paint, electronics and fluorescent lights.
Paint Product Stewardship Pilot Program Oregon’s Paint Product Stewardship Law established the nation’s first statewide product stewardship program for managing leftover latex and oil-based architectural paint. The pilot program began in July 2010 and is due to sunset in June 2013.
An estimated ten percent of paint sold each year in the United States is unused. Leftover paint is the largest component of household hazardous waste collection programs, and managing it is expensive for local governments. Paint waste can be captured for reuse, recycling, energy recovery or safe disposal.
PaintCare, an industry-run product stewardship organization, was established to implement the program on behalf of architectural paint manufacturers. This product stewardship program is supported by a fee on each can of paint purchased in Oregon. The program is managed by industry and overseen by DEQ. In the first two years PaintCare:
• Provided over 80 new collection sites, mostly at retail locations
• Collected more than 900,000 gallons of leftover paint
• Recycled more than half of the paint collected
• Shifted the cost of paint collection and recycling from local governments to those who purchase paint. Metro reported that during the program’s first year the paint product stewardship program saved the regional government more than $1 million, and Lane County reported savings of $40-45,000 during the same period.
DEQ reviewed the program and made recommendations for strengthening a permanent paint product stewardship program in Oregon’s Paint Product Stewardship Law, a report to the Legislature, in November 2011. www.deq.state.or.us/lq/pubs/docs/sw/LegReportPaintProdStewardshipLaw.pdf
These recommendations are included in HB 2048for the 2013 legislative session. LC 574 modifies the Paint Product Stewardship law passed in 2009 (House Bill 3037). The concept seeks
6 6
Oregon Department of Environmental Quality 2011-2012 Solid Waste Management Program Information Update
DEQ Report to the Legislature 6
to make the pilot program permanent and make changes to improve the program for the benefit of consumers buying paint, the paint industry, Oregon’s environment and DEQ. The changes would provide clear standards, goals and procedures for the permanent program.
Oregon E-Cycles Oregon’s electronic recycling program, Oregon E-Cycles, concluded its fourth year of operations in 2012. Under this program, electronics manufacturers provide free, convenient and environmentally responsible recycling statewide for TVs, computers and monitors. Manufacturers whose covered devices are sold in or into Oregon must register with DEQ and join either the state contractor or a manufacturer-run recycling program. These programs, funded by their participating manufacturers, operate under plans approved by DEQ.
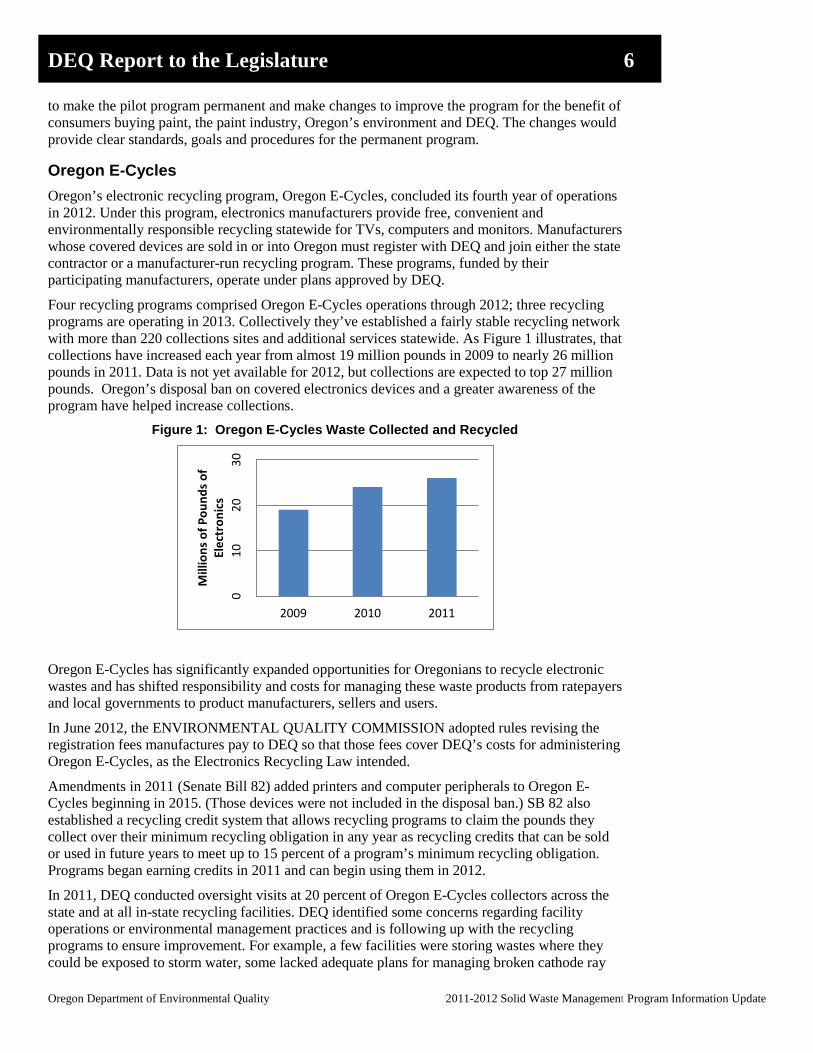
Four recycling programs comprised Oregon E-Cycles operations through 2012; three recycling programs are operating in 2013. Collectively they’ve established a fairly stable recycling network with more than 220 collections sites and additional services statewide. As Figure 1 illustrates, that collections have increased each year from almost 19 million pounds in 2009 to nearly 26 million pounds in 2011. Data is not yet available for 2012, but collections are expected to top 27 million pounds. Oregon’s disposal ban on covered electronics devices and a greater awareness of the program have helped increase collections.
Figure 1: Oregon E-Cycles Waste Collected and Recycled
Oregon E-Cycles has significantly expanded opportunities for Oregonians to recycle electronic wastes and has shifted responsibility and costs for managing these waste products from ratepayers and local governments to product manufacturers, sellers and users.
In June 2012, the ENVIRONMENTAL QUALITY COMMISSION adopted rules revising the registration fees manufactures pay to DEQ so that those fees cover DEQ’s costs for administering Oregon E-Cycles, as the Electronics Recycling Law intended.
Amendments in 2011 (Senate Bill 82) added printers and computer peripherals to Oregon E-Cycles beginning in 2015. (Those devices were not included in the disposal ban.) SB 82 also established a recycling credit system that allows recycling programs to claim the pounds they collect over their minimum recycling obligation in any year as recycling credits that can be sold or used in future years to meet up to 15 percent of a program’s minimum recycling obligation. Programs began earning credits in 2011 and can begin using them in 2012.
In 2011, DEQ conducted oversight visits at 20 percent of Oregon E-Cycles collectors across the state and at all in-state recycling facilities. DEQ identified some concerns regarding facility operations or environmental management practices and is following up with the recycling programs to ensure improvement. For example, a few facilities were storing wastes where they could be exposed to storm water, some lacked adequate plans for managing broken cathode ray
0 10
20
30
2009 2010 2011
Mill
ions
of P
ound
s of
Elec
tron
ics
7 7
Oregon Department of Environmental Quality 2011-2012 Solid Waste Management Program Information Update
DEQ Report to the Legislature 7
tubes and some did not have adequate liability insurance. Based on these results, DEQ will conduct fewer but more targeted visits each year.
DEQ submitted a more detailed Oregon E-Cycles Biennial Report to the Legislature in March 2012, available at: www.deq.state.or.us/lq/pubs/docs/ORECyclesBiennialReportLeg2011.pdf
Fluorescent Lamps With emphasis on energy conservation, use of fluorescent lighting has increased, creating a need for safe end-of-life handling systems as well as improved product design to eliminate concerns related to mercury releases from broken lamps. In 2012, the Legislature (Senate Bill 1512) set standards for the amount of mercury that may be contained in general purpose lamps and prohibited manufacturers from selling lamps in Oregon that contain mercury in an amount exceeding the mercury content standards. It establishes state procurement guidelines that will ensure that the state looks at the full range of lighting issues including mercury content, energy use and lamp lifetime. The content standards in the law are the result of negotiations between lamp manufacturers, represented by the National Electrical Manufacturers Association, Oregon DEQ and Metro. The law contains a provision for the Legislature to look at changes in content standards that California may adopt in the future to help ensure that there is consistency between the two states.
Bottle Bill Legislation passed in 2011 added all beverage containers to the Oregon Bottle Bill except distilled liquor, wine, dairy and plant-based milk and infant formula, effective January 1, 2018. The refund value could also double to 10 cents per container by Jan. 1, 2017, or any subsequent date, if the return rate for beverage containers remains under 80 percent for two consecutive years. Primary responsibility for the implementation of the Bottle Bill law rests with Oregon Liquor Control Commission, with DEQ providing policy and technical assistance.
Beverage distributors and distributor cooperatives are to report their sales and returns to the Oregon Liquor Control Commission each year, with the first report due by July 1, 2013.
Although beverage distributors and the distributor cooperative, Oregon Beverage Recycling Cooperative, are not required to submit reports until July 2013, they have indicated that the current return rate is under 80 percent. To try to raise the return rate, the Oregon Beverage Recycling Cooperative has been working with local grocery stores to try to increase recovery by establishing stand-alone redemption centers to provide convenient return services to customers. The three built to date, including a special large pilot redemption center in South Salem, have all been operating with great success and high return volumes. It will take substantial efforts, however, to raise the beverage return rate to the 80 percent goal within the next few years.
C. Waste Prevention It has long been Oregon’s policy that prevention and reuse, which both reduce waste generation, have priority over recycling, composting, energy recovery and landfilling as methods of managing solid waste. The 2001 Legislature set Oregon’s first statutory waste prevention goals, noting that: “There are limits to Oregon’s natural resources and the capacity of the state’s environment to absorb the impacts of increasing consumption of resources, including waste generation and increasing solid waste disposal... It is in the best interests of the people of Oregon to conserve resources and energy by developing an economy that encourages waste prevention and recycling.” The goals are:
• For the calendar year 2005 and subsequent years, no annual increase in per-capita municipal solid waste generation; and
8 8
Oregon Department of Environmental Quality 2011-2012 Solid Waste Management Program Information Update
DEQ Report to the Legislature 8
• For the calendar year 2009 and subsequent years, no annual increase in total municipal solid waste generation.
In December 2007, DEQ adopted a waste prevention strategy as a framework for its work to reduce solid waste generation in Oregon over the next 10 years. The strategy also contains a summary of actions DEQ is taking in specific focus areas. The strategy and periodic updates on implementation is at www.deq.state.or.us/lq/sw/wasteprevention/wpstrategy.htm
Green Building Choices about building design, materials, construction and remodeling practices all have significant bearing on Oregonians’ overall environmental impacts. Since buildings are long lasting, design choices made today will affect the environment for decades.
In 2010, DEQ completed a groundbreaking report that evaluates and compares the environmental benefits of a wide range of waste prevention practices in residential buildings. The report was prepared in partnership with Earth Advantage, the Oregon Home Builders Association, architects, builders, remodelers, deconstruction operators and related organizations. Study results are helping these partners, DEQ and other agencies and organizations to understand the environmental impacts of material selection and waste prevention practices, and to prioritize efforts that offer the most potential for achieving environmental improvements. The report, A Life Cycle Approach to Prioritizing Methods of Preventing Waste from the Residential Construction Sector in the State of Oregon, is available at www.deq.state.or.us/lq/sw/wasteprevention/greenbuilding.htm,
DEQ has collaborated with diverse organizations and several new partners in using this research to help inform policy decisions since the study was completed. These efforts have focused primarily on putting the value of building size on par with other green building practices, since reducing homes size was the most beneficial practice evaluated. For example in 2011 and 2012, DEQ supported the Oregon Building Codes Division and other stakeholders in incorporating size-based tiers into Oregon’s residential REACH building code. DEQ teamed with Earth Advantage Institute to help recalibrate its rating system to better account for house size. DEQ also collaborated with the Energy Trust of Oregon to better align financial incentives for smaller homes that save both materials and energy. In addition, DEQ worked with many municipal planning programs to share effective zoning and incentive strategies for space-efficient housing.
Foundation Research and Analysis Ongoing research and analysis improves the effectiveness of DEQ and others in preventing waste. DEQ continues to build capacity in Oregon around environmental analysis of materials and wastes. In the past two years, significant progress was made in two areas:
• Greenhouse gas accounting The conventional method for inventorying greenhouse gas emissions at the level of a state or community significantly undercounts emissions resulting from waste generation and the “upstream” consumption (and production) of goods. In 2011, DEQ completed work on a “consumption-based” greenhouse gas inventory for Oregon. This inventory estimates the globally-distributed emissions associated with satisfying consumption (economic final demand) by Oregon. It supplements the state’s traditional greenhouse gas inventory, which focuses primarily on in-state emissions. This alternative inventory perspective helps policymakers and the general public better understand the role of consumption; imports; and local, domestic and international supply chains in contributing to greenhouse gas emissions. The consumption-based emissions inventory for 2005 and associated reports can be viewed at www.deq.state.or.us/lq/consumptionbasedghg.htm. In late 2012, DEQ began work on an update of the consumption-based inventory for 2010. This update will be integrated into a

9 9
Oregon Department of Environmental Quality 2011-2012 Solid Waste Management Program Information Update
DEQ Report to the Legislature 9
new multi-agency greenhouse gas emissions report that will bring together multiple accounting frameworks used by DEQ and other agencies.
Specific to waste prevention, the consumption-based emissions inventory has value in demonstrating not only the magnitude of emissions associated with material consumption, but also the significant differences in emissions between different types of commodities. This information will be useful for prioritizing future waste prevention initiatives, to focus more on those material and waste types that have higher greenhouse gas (and other environmental) impacts.
As an example, DEQ in 2012 used the consumption-based emissions model to help the city of Eugene estimate greenhouse gas emissions associated with municipal purchases. This information helps the city prioritize its own climate action efforts to focus on those types of purchases with larger greenhouse gas impacts. Similarly, DEQ in 2012 used the consumption-based emissions model to support the Oregon Department of Energy’s 10-Year Energy Action Plan modeling effort, from which a draft report demonstrated that waste prevention is highly cost-effective at reducing greenhouse gas emissions.
In 2011 and 2012 DEQ participated in an effort to develop the first U.S. standard for local government accounting and reporting of greenhouse gas emissions. These accounting and reporting standards will help local governments in Oregon and elsewhere document and communicate the greenhouse gas impacts of materials and waste prevention.
• Waste prevention and sustainable consumption In support of the 2050 Vision and Framework for Action DEQ conducted research into the relationship between waste prevention and the broader but closely-related field of sustainable consumption. DEQ also researched some of the barriers and opportunities related to sustainable consumption. Research is summarized in several papers located at www.deq.state.or.us/lq/sw/materialsmgmtplanbkgrddocs.htm.
Other Waste Prevention • Business Practices DEQ staff provides information and guidance to individuals,
private businesses and local governments on many aspects of waste prevention and recovery. For example, DEQ participates in the steering committee of Walmart’s Packaging Sustainable Value Network. This is a voluntary product stewardship initiative by Walmart to drive efficiencies and environmental improvements related to packaging throughout its supply chain through goals, collaboration and the use of a packaging “scorecard” where all packages are scored against multiple environmental criteria. DEQ has also participated in that project’s Materials Metrics Committee, which makes recommendations to Walmart regarding changes to the environmental metrics that populate the packaging scorecard. Waste prevention is a central element of Walmart’s packaging sustainability initiatives.
• Public information Waste prevention information is available on DEQ’s website, including a commercial waste reduction clearinghouse. DEQ staff also provides numerous presentations on waste prevention and the environmental considerations of materials selection and purchasing to audiences such as individual businesses, industry groups and Master Recycler organizations.
• Solid waste grants Since 1991, DEQ has awarded 216 solid waste reduction grants to local governments (another 51 grants have been awarded for household hazardous waste collection and facilities and 19 for waste tire collections). Due to falling revenues from
10 10
Oregon Department of Environmental Quality 2011-2012 Solid Waste Management Program Information Update
DEQ Report to the Legislature 10
solid waste disposal fees, commensurate with decreased waste generation since 2007, DEQ was unable to award any solid waste reduction grants in 2011 and 2012.
D. Household Hazardous Waste DEQ and local governments continued to provide opportunities to safely dispose of household hazardous waste in 2011 and 2012. Given declines in revenue from solid waste disposal fees, DEQ scaled back or suspended most HHW programs. Whether these programs can be implemented again in the future depends on availability of future funding sources.
DEQ-sponsored HHW programs • Free Mercury Program In 2011, DEQ paid for collection of mercury and mercury-
containing articles free of charge from conditionally exempt generators at locally sponsored HHW collection facilities. The program was suspended in 2012.
• Home Collection of Mercury DEQ continued a program designed to collect elemental (liquid) mercury from homeowners who had large quantities of mercury, but increased the minimum amount eligible for collection from three pounds to 10 pounds.
• School Lab Cleanout Program DEQ continued the school lab cleanout program but with most program costs paid by local governments instead of by DEQ. Under this program, a school lab specialist funded by DEQ visited each school and identified unneeded and unsafe chemicals, which were removed and managed as hazardous waste. He also provided training for teachers on safer chemicals and chemical management practices to use in the future. In 2011 and 2012, 30 school labs in seven counties were cleaned out and more than 4,000 pounds of unneeded school lab chemicals were collected.
• HHW prevention DEQ continues to distribute two educational resources via Internet and hard copy to help Oregonians reduce their use of toxic substances at home: Natural Gardening and The Hazardless Home Handbook.
DEQ suspended the HHW grant program, the mercury thermometer exchange program and the DEQ HHW collection event program, which collected household hazardous waste in counties with no other HHW services.
Local government HHW collection programs In 2011, 71 percent of Oregonians had access to local facilities that collected HHW on multiple days throughout the year – up from 69 percent in 2009. Another 16 percent of residents had convenient access to at least one special HHW collection event. Four of these locally-sponsored HHW events were provided under DEQ’s “purchaser program” that allows local governments to use DEQ’s contract and contractor, although the local governments pay for the service.
Thirteen Oregon counties still have no household hazardous waste collection facilities or events.
E. Conversion Technology In December 2012, DEQ proposed new rules to establish performance standards and permit requirements for conversion technology facilities. Conversion technology facilities take solid waste and use thermal and chemical processes to produce fuels and other potentially useful materials. Examples include pyrolysis and gasification facilities that heat organic wastes to high temperatures under low-oxygen conditions to produce fuels and other products. Currently DEQ regulates these facilities under rules designed for waste treatment facilities – rules ill-suited to emerging conversion technologies. DEQ’s proposed rulemaking also includes amendments to
11 11
Oregon Department of Environmental Quality 2011-2012 Solid Waste Management Program Information Update
DEQ Report to the Legislature 11
address anaerobic digestion of organic materials under Oregon’s composting rules. Rule adoption is expected to be complete in 2013.
F. Metro’s Waste Reduction Program: Compliance with State Requirements DEQ approved Metro’s Regional Solid Waste Management Plan 2008-2018 update on April 24, 2009. Metro is required by Oregon Revised Statute 459.345 to provide a report to the Environmental Quality Commission two years after approval. In April 2011 Metro submitted a Status Report on the Metro Region’s Waste Reduction Programs to the EQC. The Regional Solid Waste Management Plan identifies strategies that Metro and Metro-area local governments will pursue to increase the recovery of waste to meet the wasteshed’s 64 percent statutory recovery goal. Strategies include targeted efforts in the single-family, multi-family, business and building industry sectors. The plan also identifies strategies to reduce the amount of solid and household hazardous waste generated. Strategies include education on waste prevention and alternatives to household hazardous waste products, product stewardship initiatives and implementation of sustainability measures for the region’s solid waste vehicles and facilities. The report provides information to the EQC demonstrating how Metro and local governments are working together to ensure that the Metro region’s activities comply with the waste reduction program and waste reduction goals outlined in Metro’s plan.
12 12
Oregon Department of Environmental Quality 2011-2012 Solid Waste Management Program Information Update
DEQ Report to the Legislature 12
3. Waste Generation and Waste Reduction
A. Waste Generation Waste generation is defined as the sum of materials disposed and recovered. It is a rough measure of the total amount of materials discarded by households, businesses, institutions and governments. It includes garbage as well as materials separated for recycling, energy recovery and off-site composting.
Methods to reduce waste generation include:
• Waste prevention – Using and wasting less by acquiring fewer items as raw materials, packaging or consumables or by purchasing more durable goods
• Reuse – Using something again in its original form (as opposed to recycling which reformulates materials into new products)
• Composting on site so that materials don’t enter the solid waste stream
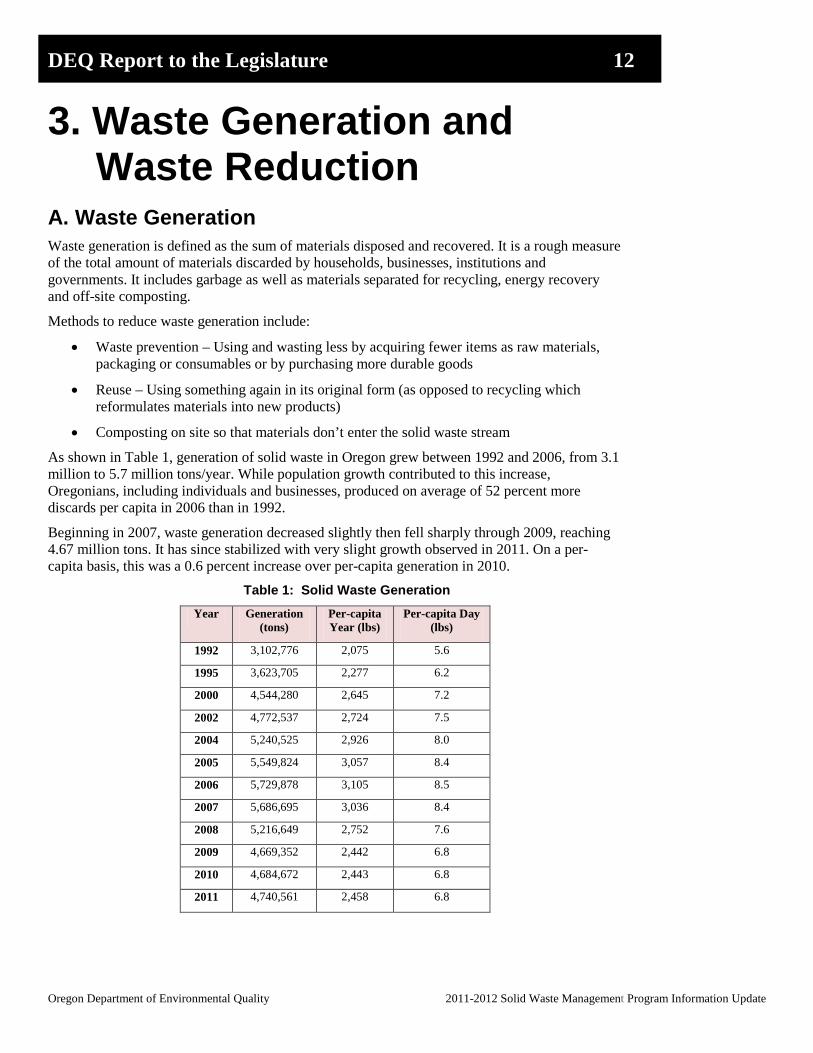
As shown in Table 1, generation of solid waste in Oregon grew between 1992 and 2006, from 3.1 million to 5.7 million tons/year. While population growth contributed to this increase, Oregonians, including individuals and businesses, produced on average of 52 percent more discards per capita in 2006 than in 1992.
Beginning in 2007, waste generation decreased slightly then fell sharply through 2009, reaching 4.67 million tons. It has since stabilized with very slight growth observed in 2011. On a per-capita basis, this was a 0.6 percent increase over per-capita generation in 2010.
Table 1: Solid Waste Generation Year Generation
(tons) Per-capita Year (lbs)
Per-capita Day (lbs)
1992 3,102,776 2,075 5.6
1995 3,623,705 2,277 6.2
2000 4,544,280 2,645 7.2
2002 4,772,537 2,724 7.5
2004 5,240,525 2,926 8.0
2005 5,549,824 3,057 8.4
2006 5,729,878 3,105 8.5
2007 5,686,695 3,036 8.4
2008 5,216,649 2,752 7.6
2009 4,669,352 2,442 6.8
2010 4,684,672 2,443 6.8
2011 4,740,561 2,458 6.8
13 13
Oregon Department of Environmental Quality 2011-2012 Solid Waste Management Program Information Update
DEQ Report to the Legislature 13
With these slight increases, the state narrowly missed both of the state’s waste generation goals.1 Nevertheless, the state continued a five-year trend of no or negligible increases in total or per-capita waste generation, in sharp contrast to much of the 1990s and early 2000s, when waste generation rose steeply. The per-capita waste generation rate for 2009-2011 is lower than it’s been in Oregon any time since 1996.
Per-capita solid waste generation in Oregon grew from 5.6 pounds per day in 1992 to 8.5 pounds per day in 2006, and then began to decrease in 2007—down to 6.8 pounds per day by 2009, where it remained for both 2010 and 2011. The table above illustrates Oregon’s waste generation trends. Environmentally, the downward trend of both total and per-capita waste generation is a positive development. Generation is a crude measure of consumption, and for many materials, environmental impacts of production (the corollary of consumption) are many times higher than the impacts of disposal. However, some of this decline is attributed to the current economic situation, and it is not known if the decline in generation will be sustained as the economy begins to recover.
Recent analysis by the U.S. Environmental Protection Agency suggests that roughly 40 percent of the country’s greenhouse gas emissions are associated with the production and transportation of goods. The leveling off of waste generation may indicate a leveling off in the emissions of unwanted greenhouse gases in all stages of the life cycle of materials. Further research is needed to evaluate this hypothesis.
B. Recovery Rates The state met its recovery rate goal2 in 2011with a rate of 52.3 percent, an increase over the 2010 rate of 50.0 percent. The recovery rate includes materials recycled by households and businesses or sent offsite for composting and some materials burned for energy recovery.
Oregon recovered 2,302,794 tons of materials in 2011, which is an increase of 138,115 tons from 2010. Thus, the state’s calculated recovery rates show an increase in 2011 to 48.6 percent (see Table 2). However, these calculated rates do not include the two percent credits for wastesheds that operate reuse and backyard composting programs. These activities decrease waste generation, but are hard to quantify, so the Legislature created these credits and mandated their inclusion in the state’s official recovery rate, starting in 2001.
1 Statutory generation goals (ORS 459A.010) are: no increase in per-capita generation of municipal solid waste in 2005 and subsequent years, and no increase in total generation of municipal solid waste in 2009 and subsequent years. 2 The statutory recovery goals (ORS 459A.010) are: 45 percent for 2005 and 50 percent for 2009.
14 14
Oregon Department of Environmental Quality 2011-2012 Solid Waste Management Program Information Update
DEQ Report to the Legislature 14
Table 2: Solid Waste Recovery Rates
Year Tons Calculated Rate Rate with Two Percent Credits
1992 839,679 27.1%
1995 1,257,204 34.7%
2000 1,765,817 38.9%
2002 2,029,261 42.7% 46.3%
2004 2,317,064 44.2% 48.0%
2005 2,523.367 45.5% 49.2%
2006 2,495,050 43.5% 47.3%
2007 2,437,569 42.9% 46.6%
2008 2,326,146 44.6% 48.2%
2009 2,082,631 44.6% 48.3%
2010 2,164,679 46.2% 49.9%
2011 2,302,794 48.6% 52.3%
Looking just at materials commonly collected through curbside programs (recyclable paper, most rigid plastic containers, tinned and aluminum cans and glass containers), long-term trends show that recycling programs have been increasingly successful over the years. Figure 2 shows the amount of these materials that on average each of us recycles or disposes of each year. The total generation of these materials remained remarkably constant from 1993 through 2007, before dropping sharply primarily due to the decreased use of paper, particularly for newspapers and magazines. Even as the total generation held constant, there was regular movement of recyclable material out of the garbage stream and into the recycling stream. Per-capita disposal of these materials fell from 341 pounds per person per year in 1993 down to 231 pounds per person per year in 2007 and then to 156 pounds per person per year in 2009 (the year of the latest waste composition study.) At the same time, per-capita recovery of these materials rose from 361 to 506 pounds per person per year in 2007, before falling back to 417 pounds per person per year in 2009.
15 15
Oregon Department of Environmental Quality 2011-2012 Solid Waste Management Program Information Update
DEQ Report to the Legislature 15
Figure 2: Common Recyclable Material Recovery and Disposal Per Capita
Looking at this from another standpoint, as recovery of these common recyclables increased, there was less of these materials ending up in the garbage relative to other wastes being disposed. Figure 3 below shows the regular decline of common recyclables when measured as a percentage of the total municipal waste being disposed of. These common recyclables dropped from 23 percent of total solid waste in 1993 down to only 11.4 percent by 2009.
Figure 3: Disposal of Common Recyclable Materials as a Percent of Total Solid Waste Disposed
Materials Oregon’s 2011 total recovery rate, with credits, of 53.2 percent includes materials collected for recycling or composting as well as some material burned for energy recovery. Major categories of recyclables include:
• Metal The total amount of recovered metals, after increasing nearly 12 percent in 2010, rose by another 41 percent in 2011. Most of the increase in the state recovery rate was due to increased scrap metal recovery.
• Paper (including cardboard) All paper fibers showed a small increase from 2009 to 2010. In 2011, all paper fibers showed a six percent decrease in recovered tons from 2010.
• Organic material (wood waste, yard debris, food waste) Food waste recovery increased by eight percent in 2011, although total recovery of all organic material (food, yard and wood wastes) remained constant.
0
100
200
300
400
500
600
700
800
1993 1995 1997 1999 2001 2003 2005 2007 2009
Poun
ds p
er p
erso
n pe
r yea
r
RecoveredDisposed
0%
5%
10%
15%
20%
25%
1993 1995 1997 1999 2001 2003 2005 2007 2009
Perc
ent o
f tot
al d
ispo
sed
was
te
16 16
Oregon Department of Environmental Quality 2011-2012 Solid Waste Management Program Information Update
DEQ Report to the Legislature 16
• Electronics This material showed a 12 percent increase in total tons recovered in 2011. The increase is likely attributable to the Oregon E-Cycles program and the ban on disposing of electronics in landfills.
• Glass Glass recovery increased seven percent from 2010 after remaining nearly constant for several years.
Wasteshed recovery rates Twenty-five of the 35 wastesheds increased their total recovery rates in 2011; 21 wastesheds increased their rates in 2010. Recovery rates in 25 wastesheds remained higher in 2011 than their 2009 recovery rate goals.
Energy savings Manufacturers save large amounts of energy when they use recycled materials instead of virgin resources. Recycling in Oregon in 2011 (not including composting or energy recovery) saved about 28 trillion British thermal units, the equivalent of 253 million gallons of gasoline. That is equivalent to 3.2 percent of 2011 estimated total statewide energy use.
Greenhouse gas reductions Estimated greenhouse gas reductions from recycling, composting and energy recovery in 2011 are equal to 2.8 million metric tons of carbon dioxide, or the equivalent of reducing the emissions from 580,000 passenger cars. It is also equivalent to reducing four percent of 2011 estimated statewide greenhouse gas emissions. The greenhouse gas benefits of waste recovery are partly the result of the large energy savings industries gain by using recycled materials in manufacturing.
More detailed information on waste generation, material recovery and specific wasteshed programs can be found in the 2011 Oregon Material Recovery and Waste Generation Report on the DEQ solid waste webpage at www.deq.state.or.us/lq/pubs/docs/sw/2011MRWGRatesReport.pdf .
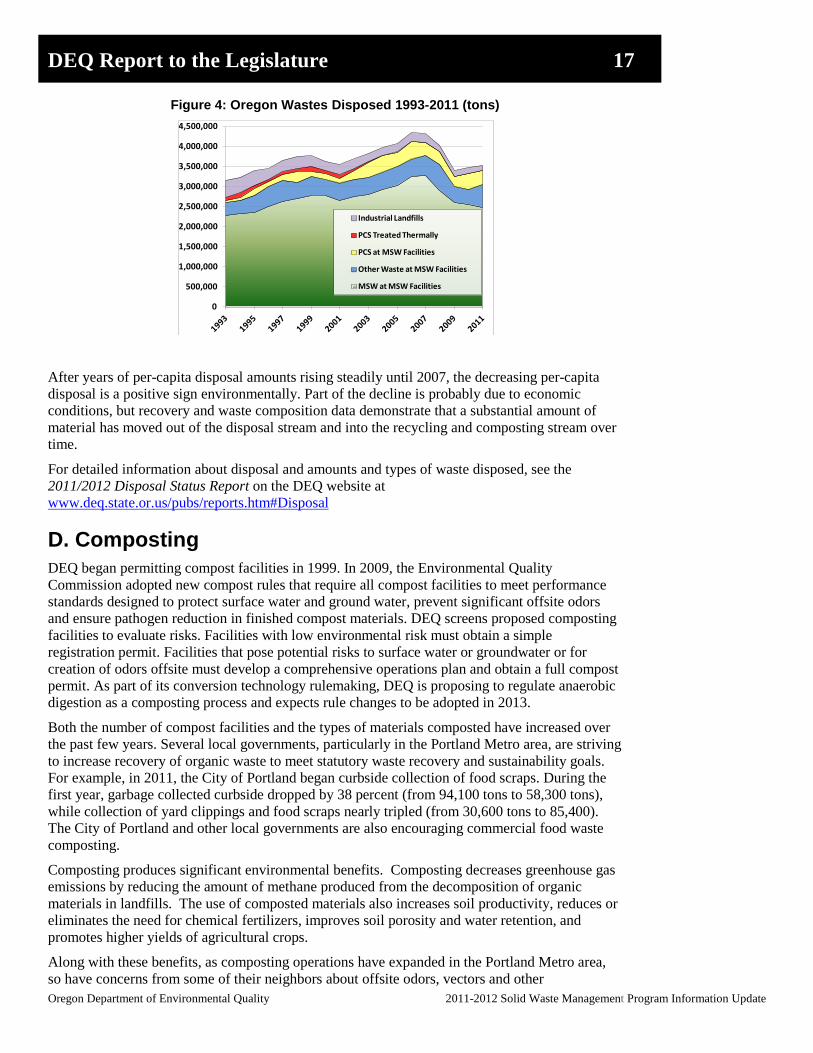
C. Disposal Data Solid waste disposed of at municipal solid waste facilities in Oregon, including waste from out-of-state, contaminated soil and other special wastes, remained at about 5.3 million tons each year in 2009-2011, down from a high of 6.8 million tons in 2007 (see Figure 4).
Oregon continues to receive a significant amount of waste for landfilling that is generated outside of Oregon. In 2011, about 36 percent of the waste disposed of in Oregon’s municipal solid waste facilities was from out-of-state.
Oregon exports only a small fraction of its waste for disposal in other states. In 2011, only 2.3 percent of Oregon’s municipal solid waste was landfilled out-of-state.
The amount of “counting” solid waste (municipal and construction wastes that "count" towards wasteshed recovery rates) disposed in Oregon in 2011 was 2,437,767 tons or 1,264 pounds per person per year1. This is the lowest per-capita disposal measured in Oregon in more than two decades, and is 15 percent below the per-capita disposal rate from 1992.
1 “Counting” solid waste includes municipal solid waste, waste tires, construction and demolition debris, animal waste and grease and some inerts such as gypsum.
17 17
Oregon Department of Environmental Quality 2011-2012 Solid Waste Management Program Information Update
DEQ Report to the Legislature 17
Figure 4: Oregon Wastes Disposed 1993-2011 (tons)
After years of per-capita disposal amounts rising steadily until 2007, the decreasing per-capita disposal is a positive sign environmentally. Part of the decline is probably due to economic conditions, but recovery and waste composition data demonstrate that a substantial amount of material has moved out of the disposal stream and into the recycling and composting stream over time.
For detailed information about disposal and amounts and types of waste disposed, see the 2011/2012 Disposal Status Report on the DEQ website at www.deq.state.or.us/pubs/reports.htm#Disposal
D. Composting DEQ began permitting compost facilities in 1999. In 2009, the Environmental Quality Commission adopted new compost rules that require all compost facilities to meet performance standards designed to protect surface water and ground water, prevent significant offsite odors and ensure pathogen reduction in finished compost materials. DEQ screens proposed composting facilities to evaluate risks. Facilities with low environmental risk must obtain a simple registration permit. Facilities that pose potential risks to surface water or groundwater or for creation of odors offsite must develop a comprehensive operations plan and obtain a full compost permit. As part of its conversion technology rulemaking, DEQ is proposing to regulate anaerobic digestion as a composting process and expects rule changes to be adopted in 2013.
Both the number of compost facilities and the types of materials composted have increased over the past few years. Several local governments, particularly in the Portland Metro area, are striving to increase recovery of organic waste to meet statutory waste recovery and sustainability goals. For example, in 2011, the City of Portland began curbside collection of food scraps. During the first year, garbage collected curbside dropped by 38 percent (from 94,100 tons to 58,300 tons), while collection of yard clippings and food scraps nearly tripled (from 30,600 tons to 85,400). The City of Portland and other local governments are also encouraging commercial food waste composting.
Composting produces significant environmental benefits. Composting decreases greenhouse gas emissions by reducing the amount of methane produced from the decomposition of organic materials in landfills. The use of composted materials also increases soil productivity, reduces or eliminates the need for chemical fertilizers, improves soil porosity and water retention, and promotes higher yields of agricultural crops.
Along with these benefits, as composting operations have expanded in the Portland Metro area, so have concerns from some of their neighbors about offsite odors, vectors and other
0
500,000
1,000,000
1,500,000
2,000,000
2,500,000
3,000,000
3,500,000
4,000,000
4,500,000
Industrial Landfills
PCS Treated Thermally
PCS at MSW Facilities
Other Waste at MSW Facilities
MSW at MSW Facilities
18 18
Oregon Department of Environmental Quality 2011-2012 Solid Waste Management Program Information Update
DEQ Report to the Legislature 18
environmental issues. DEQ will continue to work closely with local governments, compost operators and the public to make sure that composting facilities meet environmental standards.
19 19
Oregon Department of Environmental Quality 2011-2012 Solid Waste Management Program Information Update
DEQ Report to the Legislature 19
4. Solid Waste Disposal Facilities
A. Municipal Disposal Facilities and Permits Oregon has 27 operating municipal solid waste landfills and one municipal solid waste energy recovery facility. With the closure of over 90 landfills in the past two decades, Oregon has the potential for some of them to leak contamination. Thus, the need for regulatory oversight continues well beyond the date at which a facility stops accepting waste for disposal. Continued monitoring of groundwater and methane gas levels may be necessary for decades after a facility closes.
Many landfills that remain open are larger facilities that accept waste from regional rather than local areas. Some of these landfills are among the nation’s largest, providing Oregon with sufficient disposal capacity for many years to come.
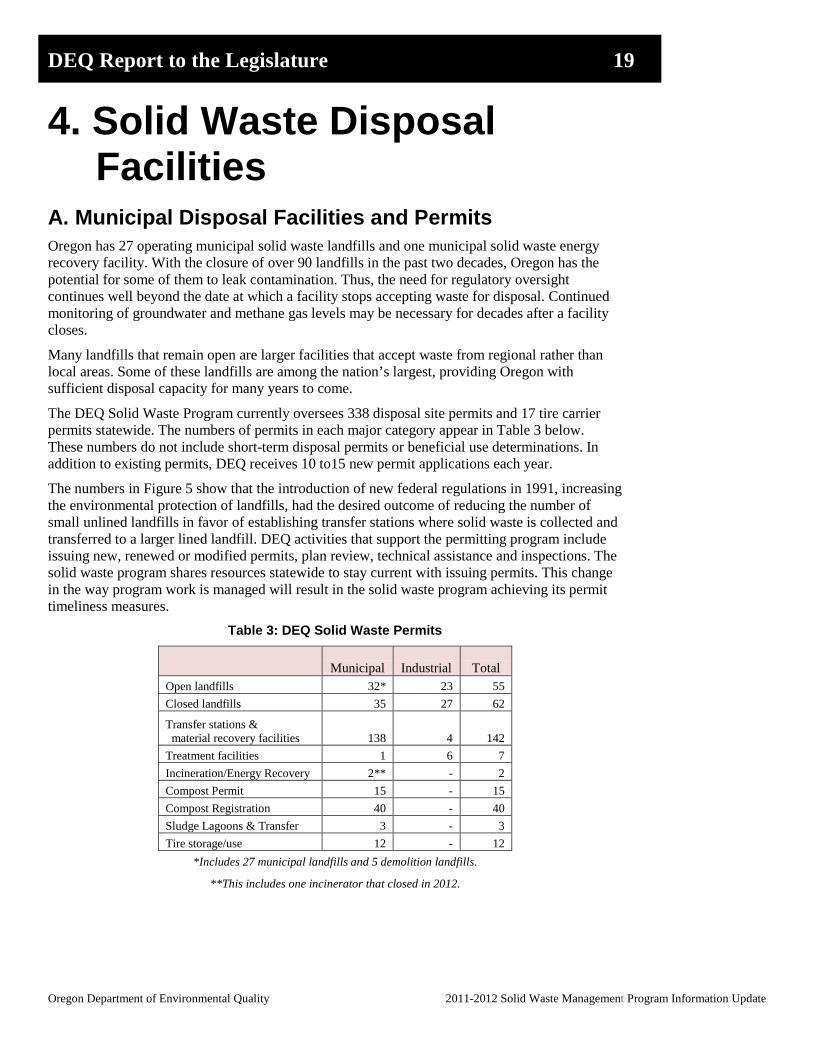
The DEQ Solid Waste Program currently oversees 338 disposal site permits and 17 tire carrier permits statewide. The numbers of permits in each major category appear in Table 3 below. These numbers do not include short-term disposal permits or beneficial use determinations. In addition to existing permits, DEQ receives 10 to15 new permit applications each year.
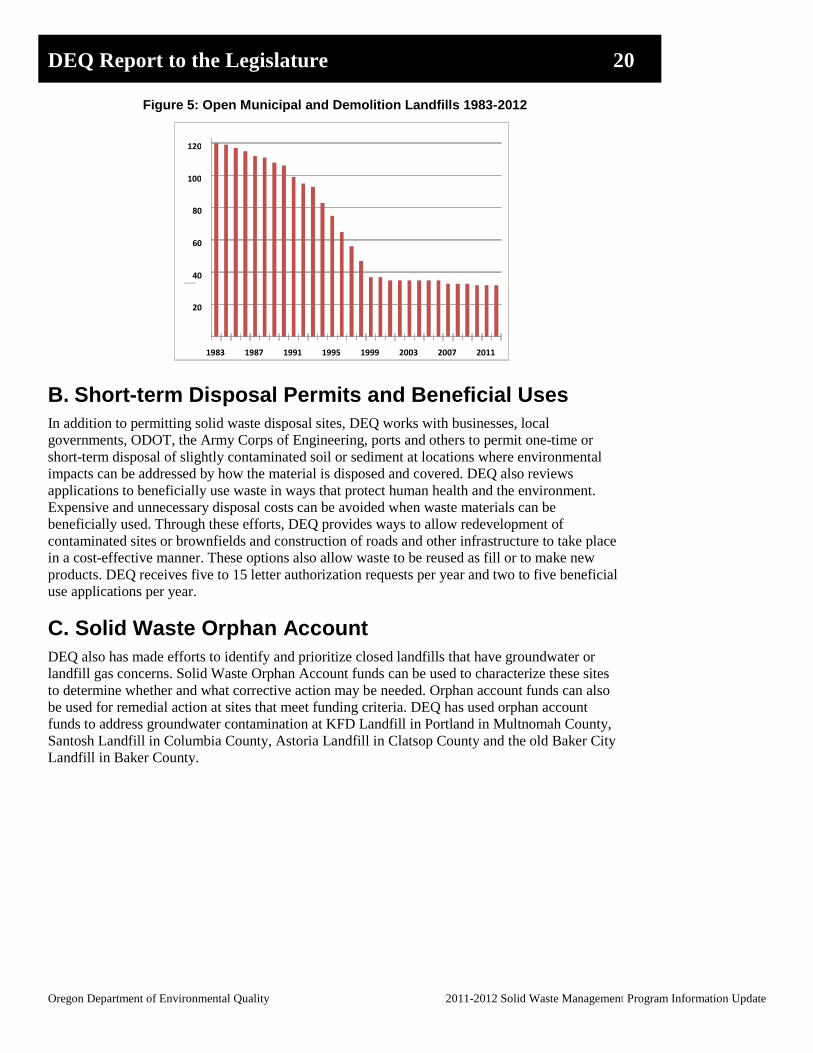
The numbers in Figure 5 show that the introduction of new federal regulations in 1991, increasing the environmental protection of landfills, had the desired outcome of reducing the number of small unlined landfills in favor of establishing transfer stations where solid waste is collected and transferred to a larger lined landfill. DEQ activities that support the permitting program include issuing new, renewed or modified permits, plan review, technical assistance and inspections. The solid waste program shares resources statewide to stay current with issuing permits. This change in the way program work is managed will result in the solid waste program achieving its permit timeliness measures.
Table 3: DEQ Solid Waste Permits
Municipal Industrial Total Open landfills 32* 23 55 Closed landfills 35 27 62
Transfer stations & material recovery facilities 138 4 142 Treatment facilities 1 6 7 Incineration/Energy Recovery 2** - 2 Compost Permit 15 - 15 Compost Registration 40 - 40 Sludge Lagoons & Transfer 3 - 3 Tire storage/use 12 - 12
*Includes 27 municipal landfills and 5 demolition landfills.
**This includes one incinerator that closed in 2012.
20 20
Oregon Department of Environmental Quality 2011-2012 Solid Waste Management Program Information Update
DEQ Report to the Legislature 20
Figure 5: Open Municipal and Demolition Landfills 1983-2012
B. Short-term Disposal Permits and Beneficial Uses In addition to permitting solid waste disposal sites, DEQ works with businesses, local governments, ODOT, the Army Corps of Engineering, ports and others to permit one-time or short-term disposal of slightly contaminated soil or sediment at locations where environmental impacts can be addressed by how the material is disposed and covered. DEQ also reviews applications to beneficially use waste in ways that protect human health and the environment. Expensive and unnecessary disposal costs can be avoided when waste materials can be beneficially used. Through these efforts, DEQ provides ways to allow redevelopment of contaminated sites or brownfields and construction of roads and other infrastructure to take place in a cost-effective manner. These options also allow waste to be reused as fill or to make new products. DEQ receives five to 15 letter authorization requests per year and two to five beneficial use applications per year.
C. Solid Waste Orphan Account DEQ also has made efforts to identify and prioritize closed landfills that have groundwater or landfill gas concerns. Solid Waste Orphan Account funds can be used to characterize these sites to determine whether and what corrective action may be needed. Orphan account funds can also be used for remedial action at sites that meet funding criteria. DEQ has used orphan account funds to address groundwater contamination at KFD Landfill in Portland in Multnomah County, Santosh Landfill in Columbia County, Astoria Landfill in Clatsop County and the old Baker City Landfill in Baker County.
20
40
60
80
100
120
1983 1987 1991 1995 1999 2003 2007 2011
Number of Landfills
21 21
Oregon Department of Environmental Quality 2011-2012 Solid Waste Management Program Information Update
DEQ Report to the Legislature 21
5. DEQ Solid Waste Program Funding
Revenue for the DEQ Solid Waste Program comes primarily from two sources – solid waste tipping fees and permit fees. Solid waste tipping fees are assessed on solid waste disposed in Oregon or generated in-state and transported out-of-state for disposal. Disposal revenues support the management of solid waste, including programs to promote and enhance waste prevention, reuse, recycling, household hazardous waste management, groundwater protection at disposal facilities and other safe management requirements statewide. There are several categories of permit fees paid by solid waste permittees; the largest component is based on the amount of waste disposed. Permit fees fund compliance assurance, permitting and waste reduction activities. As tons of waste disposed declines, the solid waste program’s revenue from both the tipping and permit fees declines. The last increase to the solid waste tipping fees and permit fees based on tons was in the early 1990s.
The program has seen a nearly19 percent reduction in revenue from solid waste tipping and permit fees since fiscal year 2008 – 17.6 percent in tipping fees and 21.1 percent in permit fees. This has resulted in $1.36 million-per-year less funding available for program operations. The reduction in tons disposed is likely due to the economic downturn as well as the increase in waste recovery and waste prevention. Even if the economy improves, as Oregonians recycle and compost more, disposal will continue to decline, further reducing the solid waste program’s revenue. The effect of reduced revenue over the past two years can be seen in reduced staffing to implement solid waste programs, suspension of the solid waste and household hazardous waste grant programs and severe reductions in the household hazardous waste collection program. In addition to the effect of reduced funding on existing programs, DEQ’s ability to carry out activities to implement the 2050 Vision is greatly limited. The 2050 Vision identifies securing sustainable funding as essential for DEQ to address the bigger environmental impacts and opportunities involving the full life cycle of materials. Under the 2050 Vision, DEQ will work with stakeholders to evaluate different and more sustainable funding models which will allow the agency to achieve program objectives.