2010 undergraduate graduation rate report undergraduate graduation rate report * students entering...
TRANSCRIPT
2010 Undergraduate Graduation Rate Report* Students Entering Fall 1980 through Fall 2003
Catherine J Alvord and Marin E Clarkberg Institutional Research and Planning 440 Day Hall • Ithaca, NY 14853‐2801
Contents
A. Graduation Rates of First‐Time Freshmen ................................................. 1 B. Attrition among First‐Time Freshmen ........................................................ 7 C. Graduation Rates of External Transfers ...................................................... 9
* Throughout this report the following abbreviations apply:
AG: Agriculture & Life Sciences AR: Architecture, Arts & Planning AS: Arts & Sciences EN: Engineering HA: Hotel Administration HE: Human Ecology IL: Industrial & Labor Relations
2010 Undergraduate Graduation Rate Report
A. Graduation Rates of First‐Time Freshmen • Overall and by College
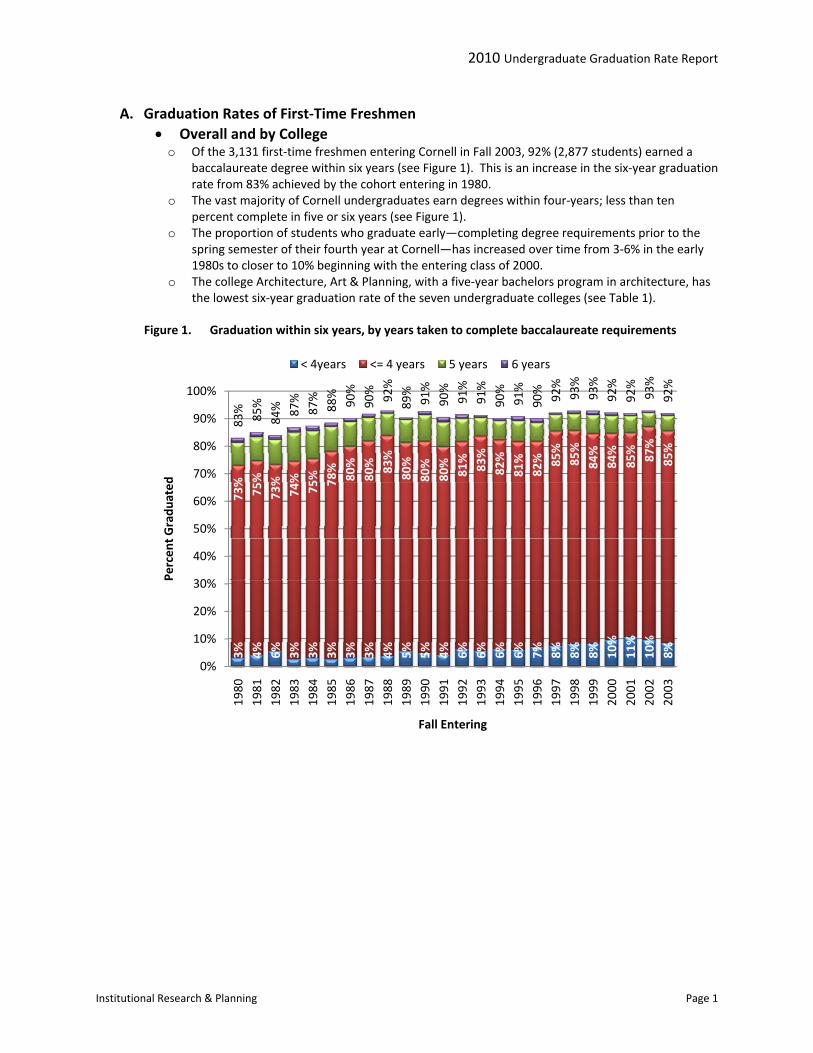
o Of the 3,131 first‐time freshmen entering Cornell in Fall 2003, 92% (2,877 students) earned a baccalaureate degree within six years (see Figure 1). This is an increase in the six‐year graduation rate from 83% achieved by the cohort entering in 1980.
o The vast majority of Cornell undergraduates earn degrees within four‐years; less than ten percent complete in five or six years (see Figure 1).
o The proportion of students who graduate early—completing degree requirements prior to the spring semester of their fourth year at Cornell—has increased over time from 3‐6% in the early 1980s to closer to 10% beginning with the entering class of 2000.
o The college Architecture, Art & Planning, with a five‐year bachelors program in architecture, has the lowest six‐year graduation rate of the seven undergraduate colleges (see Table 1).
Figure 1. Graduation within six years, by years taken to complete baccalaureate requirements
3% 4% 6% 3% 3% 3% 3% 3% 4% 5% 5% 4% 6% 6% 6% 6% 7% 8% 8% 8% 10%
11%
10%
8%
83%
85%
84% 87%
87%
88%
90%
90% 92%
89%
91%
90%
91%
91%
90%
91%
90%
92%
93%
93%
92%
92%
93%
92%
73%
75%
73%
74%
75% 78%
80%
80% 83%
80%
80%
80%
81%
83%
82%
81%
82% 85%
85%
84%
84%
85% 87%
85%
0%
10%
20%
30%
40%
50%
60%
70%
80%
90%
100%
1980
1981
1982
1983
1984
1985
1986
1987
1988
1989
1990
1991
1992
1993
1994
1995
1996
1997
1998
1999
2000
2001
2002
2003
Percen
t Gradu
ated
Fall Entering
< 4years <= 4 years 5 years 6 years
Institutional Research & Planning Page 1
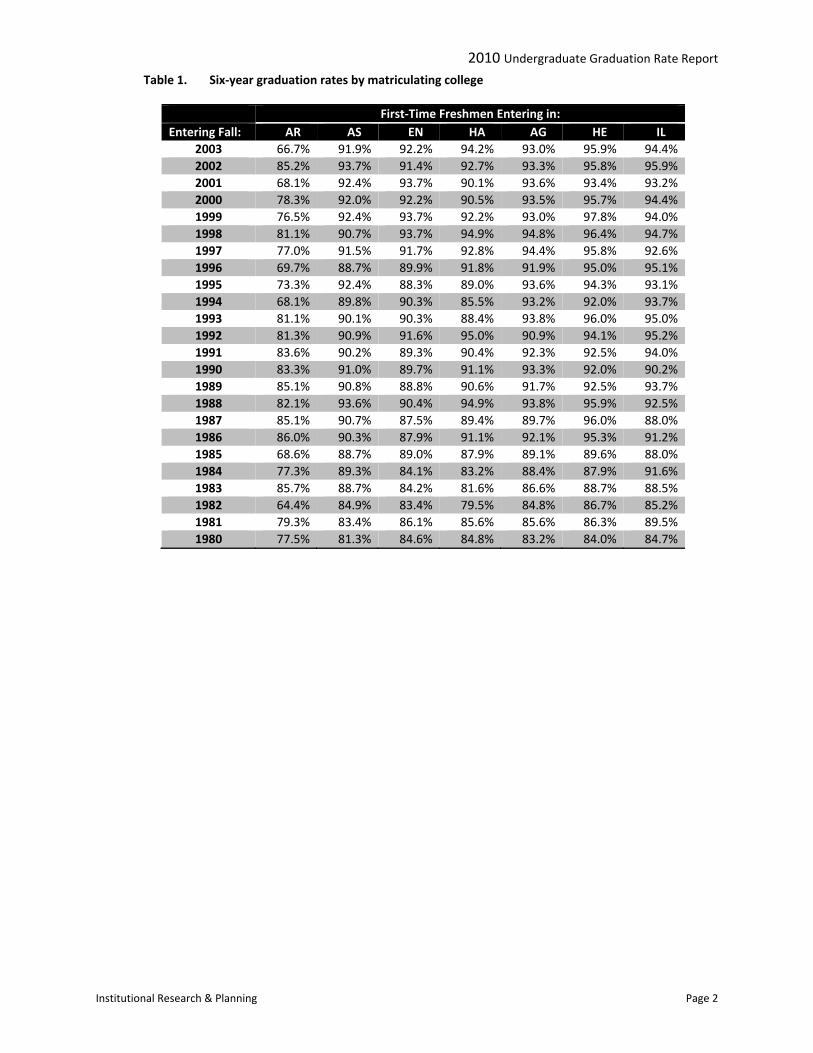
2010 Undergraduate Graduation Rate Report Table 1. Six‐year graduation rates by matriculating college
First‐Time Freshmen Entering in:Entering Fall: AR AS EN HA AG HE IL
2003 66.7% 91.9% 92.2% 94.2% 93.0% 95.9% 94.4%2002 85.2% 93.7% 91.4% 92.7% 93.3% 95.8% 95.9%2001 68.1% 92.4% 93.7% 90.1% 93.6% 93.4% 93.2%2000 78.3% 92.0% 92.2% 90.5% 93.5% 95.7% 94.4%1999 76.5% 92.4% 93.7% 92.2% 93.0% 97.8% 94.0%1998 81.1% 90.7% 93.7% 94.9% 94.8% 96.4% 94.7%1997 77.0% 91.5% 91.7% 92.8% 94.4% 95.8% 92.6%1996 69.7% 88.7% 89.9% 91.8% 91.9% 95.0% 95.1%1995 73.3% 92.4% 88.3% 89.0% 93.6% 94.3% 93.1%1994 68.1% 89.8% 90.3% 85.5% 93.2% 92.0% 93.7%1993 81.1% 90.1% 90.3% 88.4% 93.8% 96.0% 95.0%1992 81.3% 90.9% 91.6% 95.0% 90.9% 94.1% 95.2%1991 83.6% 90.2% 89.3% 90.4% 92.3% 92.5% 94.0%1990 83.3% 91.0% 89.7% 91.1% 93.3% 92.0% 90.2%1989 85.1% 90.8% 88.8% 90.6% 91.7% 92.5% 93.7%1988 82.1% 93.6% 90.4% 94.9% 93.8% 95.9% 92.5%1987 85.1% 90.7% 87.5% 89.4% 89.7% 96.0% 88.0%1986 86.0% 90.3% 87.9% 91.1% 92.1% 95.3% 91.2%1985 68.6% 88.7% 89.0% 87.9% 89.1% 89.6% 88.0%1984 77.3% 89.3% 84.1% 83.2% 88.4% 87.9% 91.6%1983 85.7% 88.7% 84.2% 81.6% 86.6% 88.7% 88.5%1982 64.4% 84.9% 83.4% 79.5% 84.8% 86.7% 85.2%1981 79.3% 83.4% 86.1% 85.6% 85.6% 86.3% 89.5%1980 77.5% 81.3% 84.6% 84.8% 83.2% 84.0% 84.7%
Institutional Research & Planning Page 2
2010 Undergraduate Graduation Rate Report
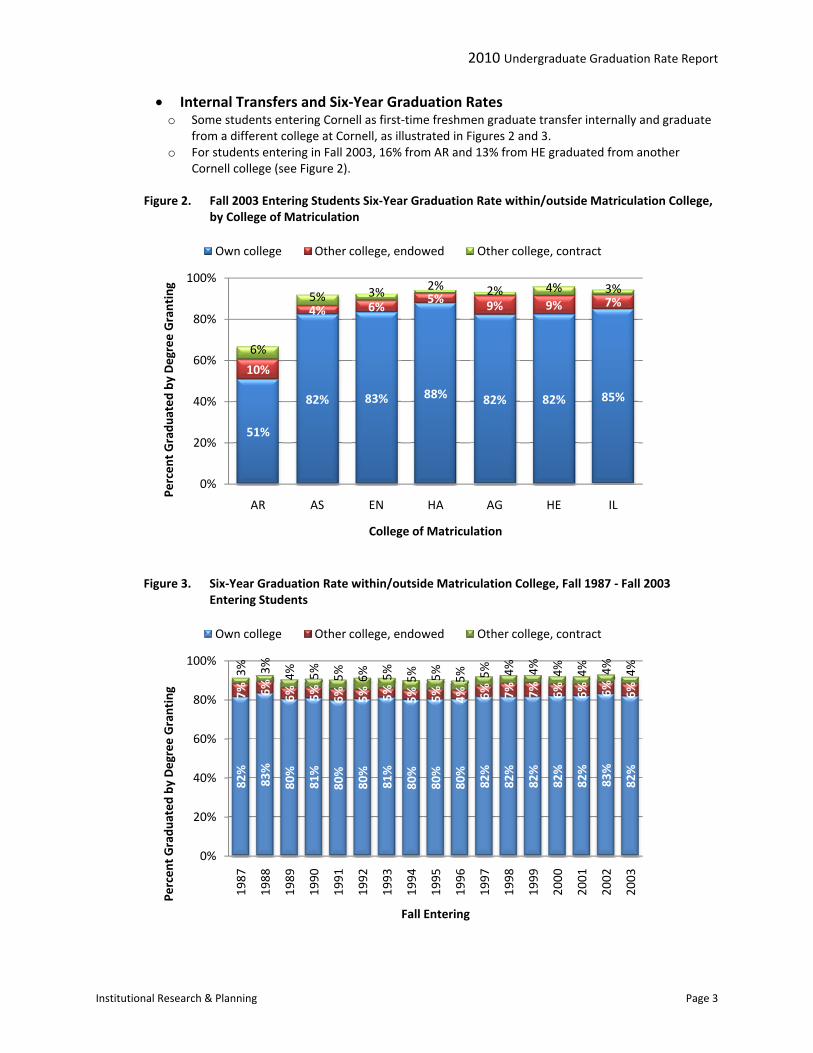
• Internal Transfers and Six‐Year Graduation Rates
o Some students entering Cornell as first‐time freshmen graduate transfer internally and graduate from a different college at Cornell, as illustrated in Figures 2 and 3.
o For students entering in Fall 2003, 16% from AR and 13% from HE graduated from another Cornell college (see Figure 2).
Figure 2. Fall 2003 Entering Students Six‐Year Graduation Rate within/outside Matriculation College, by College of Matriculation
51%
82% 83% 88% 82% 82% 85%
10%
4% 6%5% 9% 9% 7%
6%
5% 3% 2% 2% 4% 3%
0%
20%
40%
60%
80%
100%
AR AS EN HA AG HE IL
Percen
t Gradu
ated
by Degree Granting
College of Matriculation
Own college Other college, endowed Other college, contract
Figure 3. Six‐Year Graduation Rate within/outside Matriculation College, Fall 1987 ‐ Fall 2003 Entering Students
82%
83%
80%
81%
80%
80%
81%
80%
80%
80%
82%
82%
82%
82%
82%
83%
82%
7% 6% 6% 5% 6% 5% 5% 5% 5% 4% 6% 7% 7% 6% 6% 6% 6%
3% 3% 4% 5% 5% 6% 5% 5% 5% 5% 5% 4% 4% 4% 4% 4% 4%
0%
20%
40%
60%
80%
100%
1987
1988
1989
1990
1991
1992
1993
1994
1995
1996
1997
1998
1999
2000
2001
2002
2003
Percen
t Gradu
ated
by Degree Granting
Fall Entering
Own college Other college, endowed Other college, contract
Institutional Research & Planning Page 3
2010 Undergraduate Graduation Rate Report
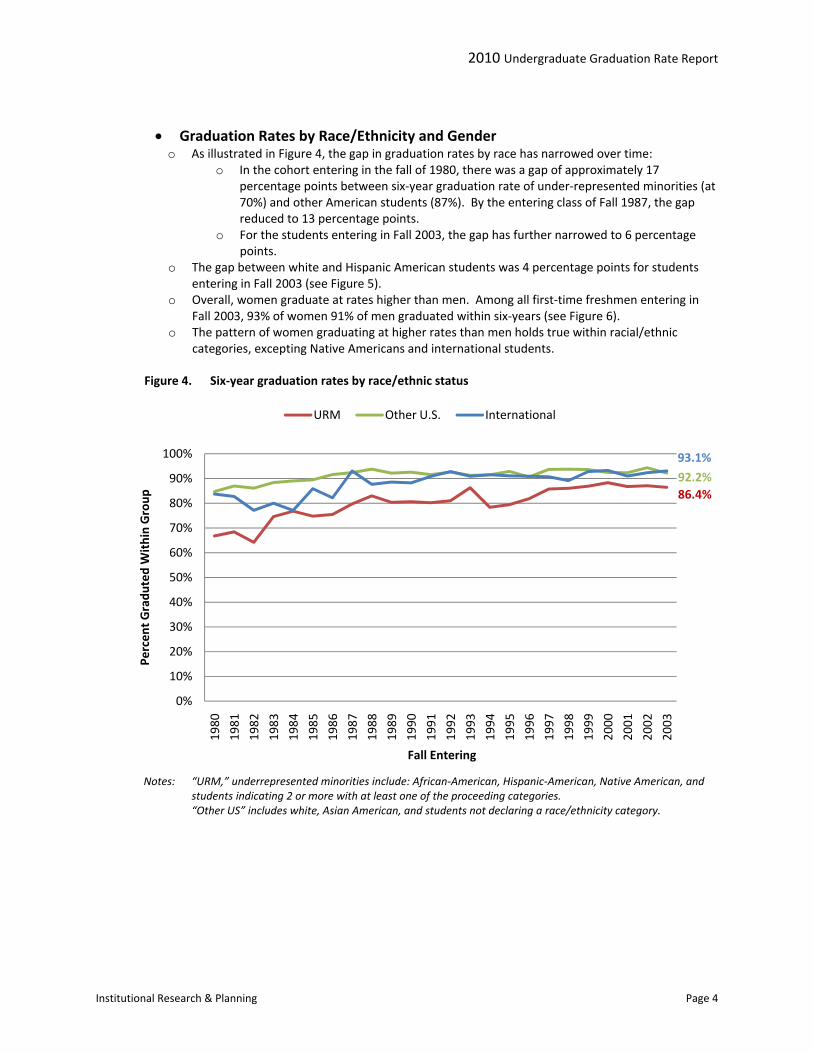
• Graduation Rates by Race/Ethnicity and Gender o As illustrated in Figure 4, the gap in graduation rates by race has narrowed over time:
o In the cohort entering in the fall of 1980, there was a gap of approximately 17 percentage points between six‐year graduation rate of under‐represented minorities (at 70%) and other American students (87%). By the entering class of Fall 1987, the gap reduced to 13 percentage points.
o For the students entering in Fall 2003, the gap has further narrowed to 6 percentage points.
o The gap between white and Hispanic American students was 4 percentage points for students entering in Fall 2003 (see Figure 5).
o Overall, women graduate at rates higher than men. Among all first‐time freshmen entering in Fall 2003, 93% of women 91% of men graduated within six‐years (see Figure 6).
o The pattern of women graduating at higher rates than men holds true within racial/ethnic categories, excepting Native Americans and international students.
Figure 4. Six‐year graduation rates by race/ethnic status
Notes: “URM,” underrepresented minorities include: African‐American, Hispanic‐American, Native American, and
students indicating 2 or more with at least one of the proceeding categories.
URM Other U.S. International
86.4%92.2%
93.1%
0%
10%
20%
30%
40%
50%
60%
70%
80%
90%
100%
1980
1981
1982
1983
1984
1985
1986
1987
1988
1989
1990
1991
1992
1993
1994
1995
1996
1997
1998
1999
2000
2001
2002
2003
Percen
t Gradu
ted Within Group
Fall Entering
“Other US” includes white, Asian American, and students not declaring a race/ethnicity category.
Institutional Research & Planning Page 4
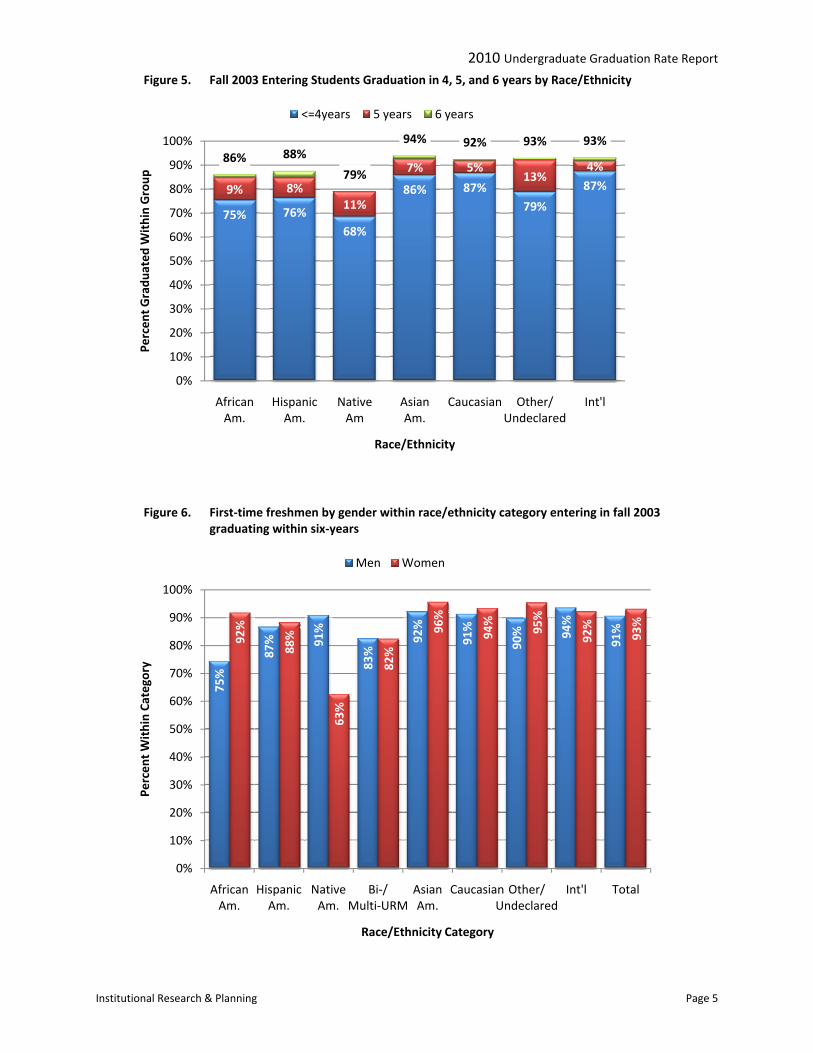
2010 Undergraduate Graduation Rate Report Figure 5. Fall 2003 Entering Students Graduation in 4, 5, and 6 years by Race/Ethnicity
75% 76%68%
86% 87%79%
87%9% 8%11%
7% 5%13%
4%86% 88%
79%
94% 92% 93% 93%
0%
10%
20%
30%
40%
50%
60%
70%
80%
90%
100%
AfricanAm.
HispanicAm.
NativeAm
AsianAm.
Caucasian Other/Undeclared
Int'l
Percen
t Gradu
ated
Within Group
Race/Ethnicity
<=4years 5 years 6 years
Figure 6. First‐time freshmen by gender within race/ethnicity category entering in fall 2003 graduating within six‐years
75%
87% 91%
83%
92%
91%
90% 94%
91%
92%
88%
63%
82%
96%
94%
95%
92%
93%
0%
10%
20%
30%
40%
50%
60%
70%
80%
90%
100%
AfricanAm.
HispanicAm.
NativeAm.
Bi‐/Multi‐URM
AsianAm.
Caucasian Other/Undeclared
Int'l Total
Percen
t Within Ca
tegory
Race/Ethnicity Category
Men Women
Institutional Research & Planning Page 5
2010 Undergraduate Graduation Rate Report
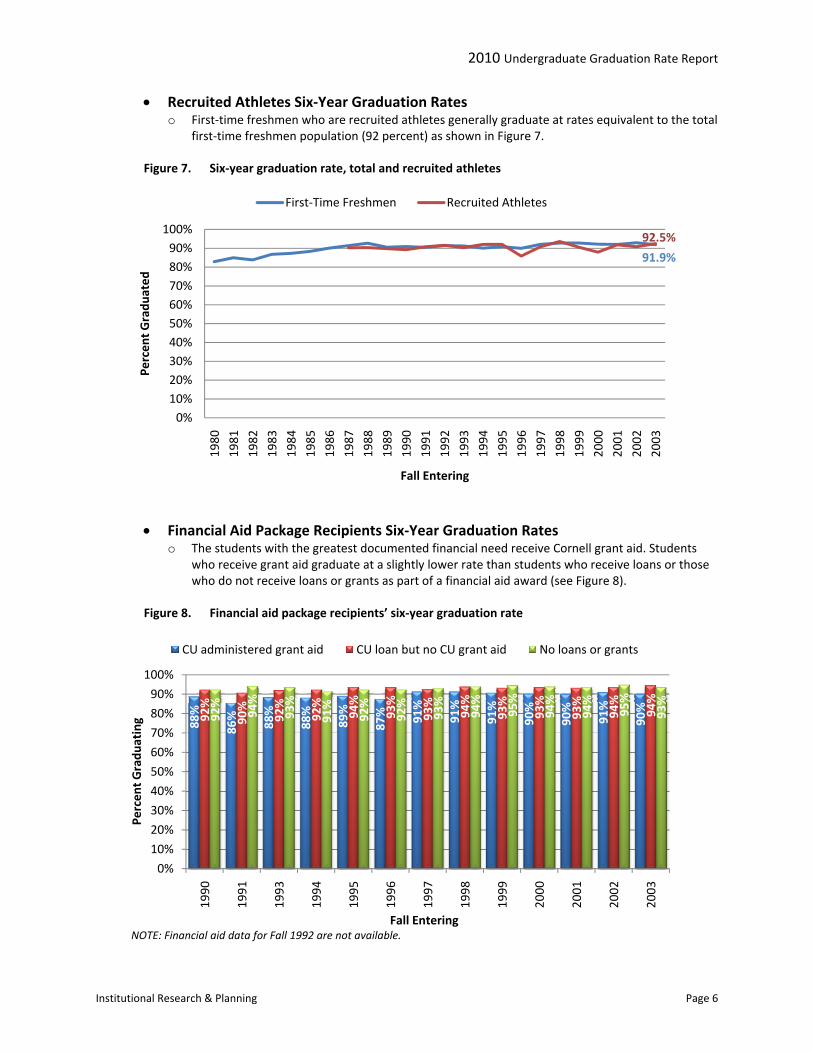
• Recruited Athletes Six‐Year Graduation Rates
o First‐time freshmen who are recruited athletes generally graduate at rates equivalent to the total first‐time freshmen population (92 percent) as shown in Figure 7.
Figure 7. Six‐year graduation rate, total and recruited athletes
92.5%
91.9%
0%10%20%30%40%50%60%70%80%90%100%
1980
1981
1982
1983
1984
1985
1986
1987
1988
1989
1990
1991
1992
1993
1994
1995
1996
1997
1998
1999
2000
2001
2002
2003
Percen
t Gradu
ated
Fall Entering
First‐Time Freshmen Recruited Athletes
• Financial Aid Package Recipients Six‐Year Graduation Rates o The students with the greatest documented financial need receive Cornell grant aid. Students
who receive grant aid graduate at a slightly lower rate than students who receive loans or those who do not receive loans or grants as part of a financial aid award (see Figure 8).
Figure 8. Financial aid package recipients’ six‐year graduation rate
88%
86%
88%
88%
89%
87% 91%
91%
91%
90%
90%
91%
90%
92%
90%
92%
92%
94%
93%
93%
94%
93%
93%
93%
94%
94%
92%
94%
93%
91%
92%
92%
93%
94%
95%
94%
94%
95%
93%
0%
10%
20%
30%
40%
50%
60%
70%
80%
90%
100%
1990
1991
1993
1994
1995
1996
1997
1998
1999
2000
2001
2002
2003
Percen
t Gradu
ating
Fall Entering
CU administered grant aid CU loan but no CU grant aid No loans or grants
NOTE: Financial aid data for Fall 1992 are not available.
Institutional Research & Planning Page 6
2010 Undergraduate Graduation Rate Report
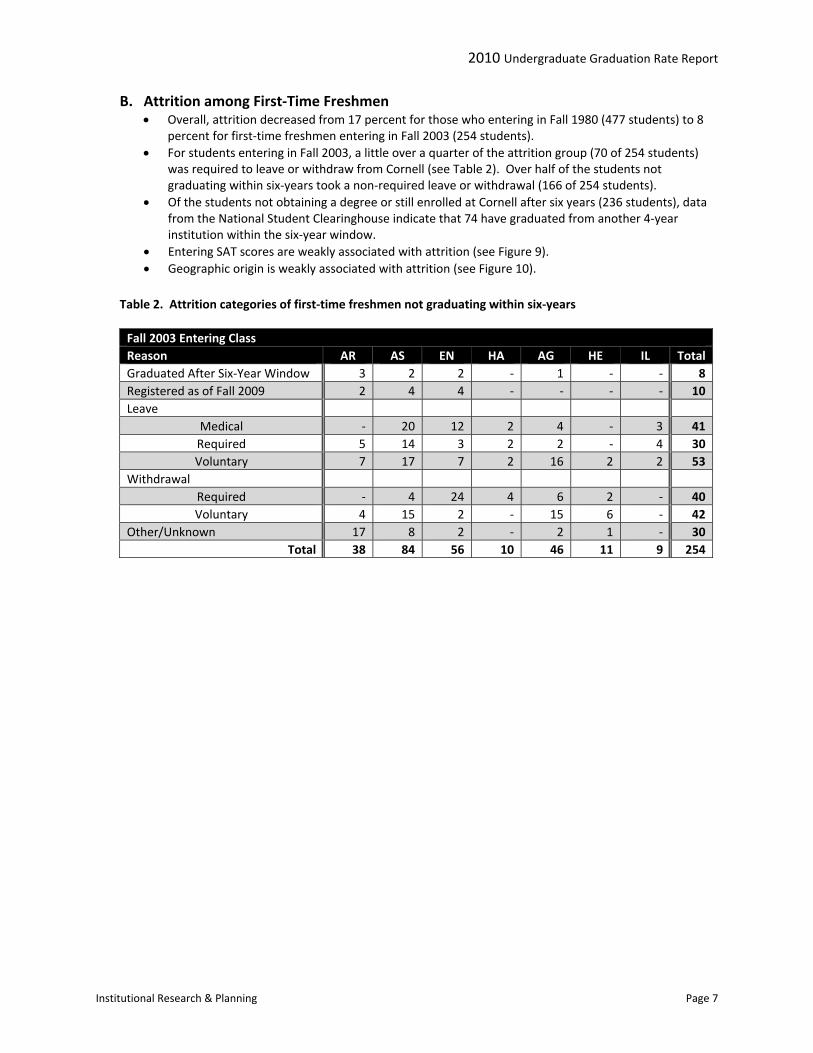
B. Attrition among First‐Time Freshmen
• Overall, attrition decreased from 17 percent for those who entering in Fall 1980 (477 students) to 8 percent for first‐time freshmen entering in Fall 2003 (254 students).
• For students entering in Fall 2003, a little over a quarter of the attrition group (70 of 254 students) was required to leave or withdraw from Cornell (see Table 2). Over half of the students not graduating within six‐years took a non‐required leave or withdrawal (166 of 254 students).
• Of the students not obtaining a degree or still enrolled at Cornell after six years (236 students), data from the National Student Clearinghouse indicate that 74 have graduated from another 4‐year institution within the six‐year window.
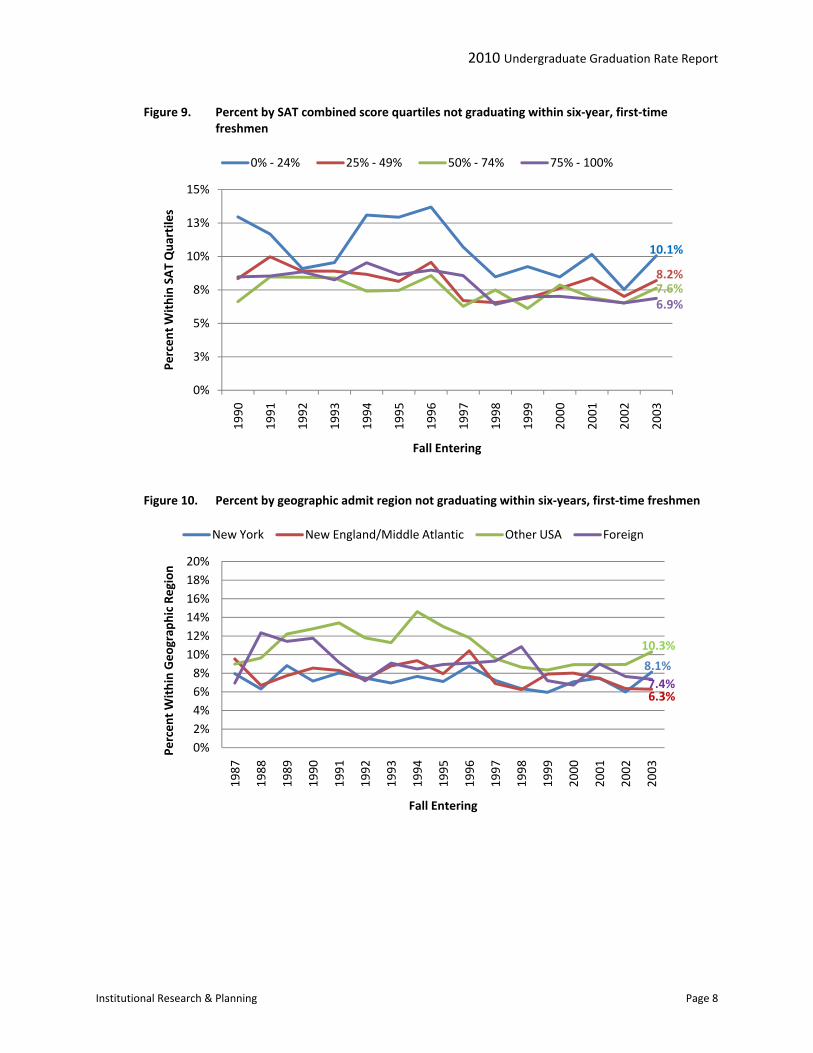
• Entering SAT scores are weakly associated with attrition (see Figure 9). • Geographic origin is weakly associated with attrition (see Figure 10).
Table 2. Attrition categories of first‐time freshmen not graduating within six‐years Fall 2003 Entering Class Reason AR AS EN HA AG HE IL Total Graduated After Six‐Year Window 3 2 2 ‐ 1 ‐ ‐ 8 Registered as of Fall 2009 2 4 4 ‐ ‐ ‐ ‐ 10 Leave
Medical ‐ 20 12 2 4 ‐ 3 41 Required 5 14 3 2 2 ‐ 4 30 Voluntary 7 17 7 2 16 2 2 53
Withdrawal Required ‐ 4 24 4 6 2 ‐ 40 Voluntary 4 15 2 ‐ 15 6 ‐ 42
Other/Unknown 17 8 2 ‐ 2 1 ‐ 30 Total 38 84 56 10 46 11 9 254
Institutional Research & Planning Page 7
2010 Undergraduate Graduation Rate Report
Figure 9. Percent by SAT combined score quartiles not graduating within six‐year, first‐time freshmen
10.1%
8.2%7.6%6.9%
0%
3%
5%
8%
10%
13%
15%
1990
1991
1992
1993
1994
1995
1996
1997
1998
1999
2000
2001
2002
2003
Percen
t Within SA
T Qua
rtiles
Fall Entering
0% ‐ 24% 25% ‐ 49% 50% ‐ 74% 75% ‐ 100%
Figure 10. Percent by geographic admit region not graduating within six‐years, first‐time freshmen
8.1%
New York New England/Middle Atlantic Other USA Foreign
6.3%
10.3%
7.4%
0%2%4%6%8%
10%12%14%16%18%20%
1987
1988
1989
1990
1991
1992
1993
1994
1995
1996
1997
1998
1999
2000
2001
2002
2003
Percen
t Within Geo
grap
hic Re
gion
Fall Entering
Institutional Research & Planning Page 8
2010 Undergraduate Graduation Rate Report
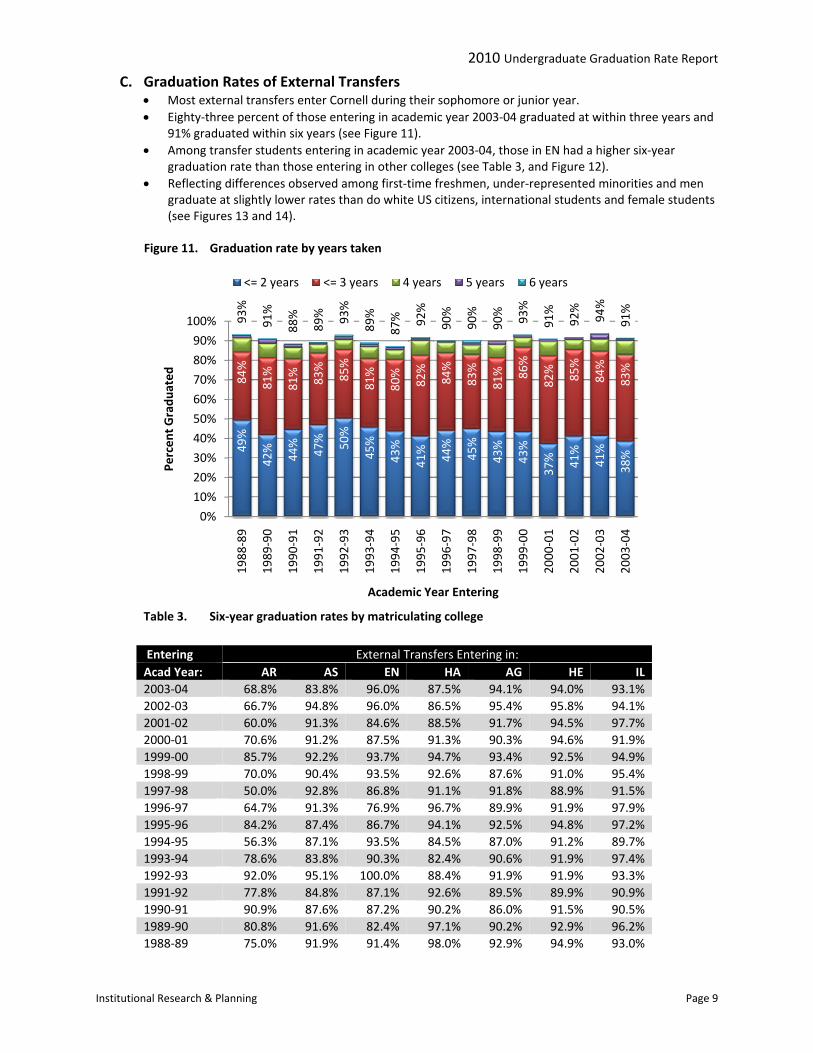
C. Graduation Rates of External Transfers • Most external transfers enter Cornell during their sophomore or junior year. • Eighty‐three percent of those entering in academic year 2003‐04 graduated at within three years and
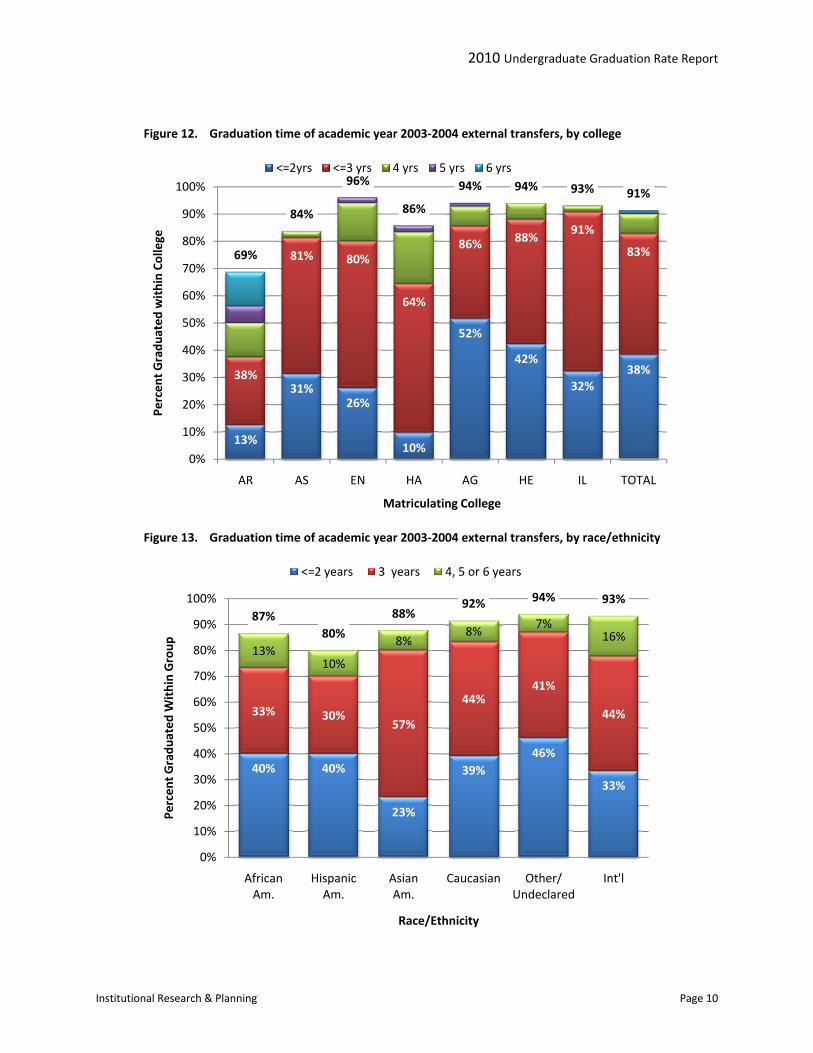
91% graduated within six years (see Figure 11). • Among transfer students entering in academic year 2003‐04, those in EN had a higher six‐year
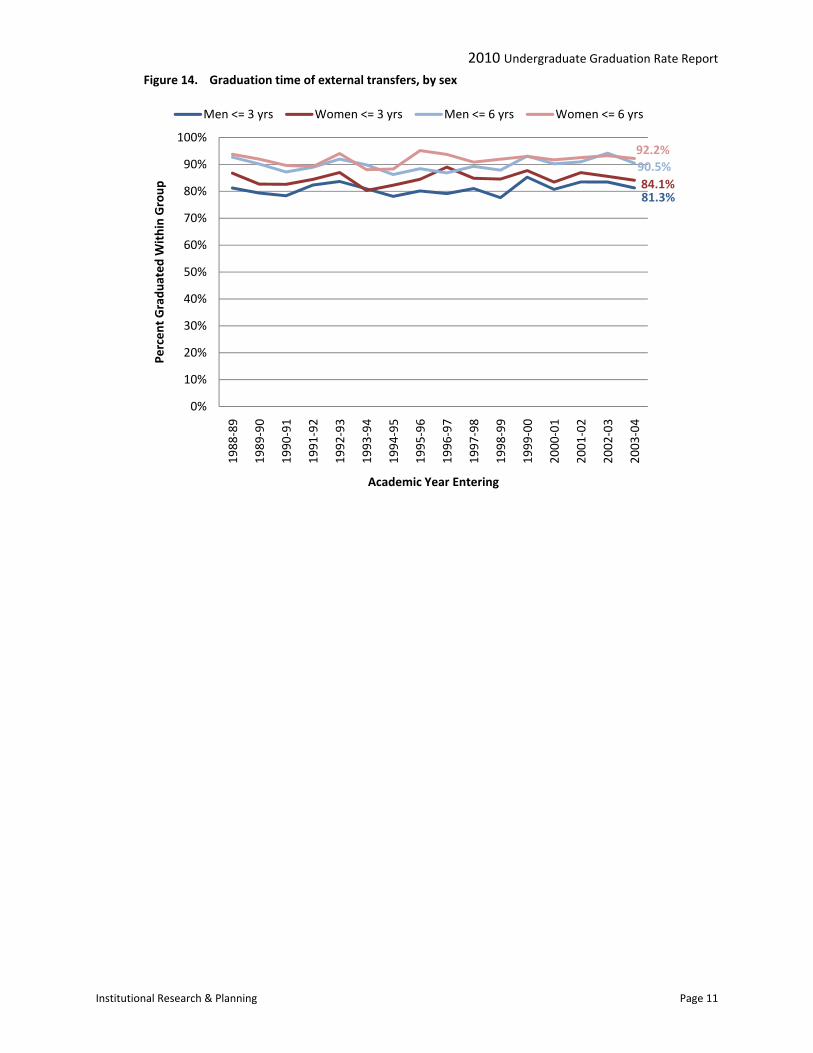
graduation rate than those entering in other colleges (see Table 3, and Figure 12). • Reflecting differences observed among first‐time freshmen, under‐represented minorities and men
graduate at slightly lower rates than do white US citizens, international students and female students (see Figures 13 and 14).
Figure 11. Graduation rate by years taken
Table 3. Six‐year graduation rates by matriculating college
49%
42%
44%
47% 50%
45%
43%
41%
44%
45%
43%
43%
37% 41%
41%
38%
84%
81%
81%
83%
85%
81%
80%
82%
84%
83%
81% 86%
82% 85%
84%
83%
93%
91%
88%
89% 93%
89%
87% 92%
90%
90%
90% 93%
91%
92%
94%
91%
0%
10%
20%
30%
40%
50%
60%
70%
80%
90%
100%
1988
‐89
1989
‐90
1990
‐91
1991
‐92
1992
‐93
1993
‐94
1994
‐95
1995
‐96
1996
‐97
1997
‐98
1998
‐99
1999
‐00
2000
‐01
2001
‐02
2002
‐03
2003
‐04
Percen
t Gradu
ated
Academic Year Entering
<= 2 years <= 3 years 4 years 5 years 6 years
Entering External Transfers Entering in: Acad Year: AR AS EN HA AG HE IL 2003‐04 68.8% 83.8% 96.0% 87.5% 94.1% 94.0% 93.1% 2002‐03 66.7% 94.8% 96.0% 86.5% 95.4% 95.8% 94.1% 2001‐02 60.0% 91.3% 84.6% 88.5% 91.7% 94.5% 97.7% 2000‐01 70.6% 91.2% 87.5% 91.3% 90.3% 94.6% 91.9% 1999‐00 85.7% 92.2% 93.7% 94.7% 93.4% 92.5% 94.9% 1998‐99 70.0% 90.4% 93.5% 92.6% 87.6% 91.0% 95.4% 1997‐98 50.0% 92.8% 86.8% 91.1% 91.8% 88.9% 91.5% 1996‐97 64.7% 91.3% 76.9% 96.7% 89.9% 91.9% 97.9% 1995‐96 84.2% 87.4% 86.7% 94.1% 92.5% 94.8% 97.2% 1994‐95 56.3% 87.1% 93.5% 84.5% 87.0% 91.2% 89.7% 1993‐94 78.6% 83.8% 90.3% 82.4% 90.6% 91.9% 97.4% 1992‐93 92.0% 95.1% 100.0% 88.4% 91.9% 91.9% 93.3% 1991‐92 77.8% 84.8% 87.1% 92.6% 89.5% 89.9% 90.9% 1990‐91 90.9% 87.6% 87.2% 90.2% 86.0% 91.5% 90.5% 1989‐90 80.8% 91.6% 82.4% 97.1% 90.2% 92.9% 96.2% 1988‐89 75.0% 91.9% 91.4% 98.0% 92.9% 94.9% 93.0%
Institutional Research & Planning Page 9
2010 Undergraduate Graduation Rate Report
Figure 12. Graduation time of academic year 2003‐2004 external transfers, by college
13%
31%26%
10%
52%
42%
32%38%38%
81% 80%
64%
86% 88%91%
83%69%
84%
96%
86%
94% 94% 93% 91%
0%
10%
20%
30%
40%
50%
60%
70%
80%
90%
100%
AR AS EN HA AG HE IL TOTAL
Percen
t Gradu
ated
within Co
llege
Matriculating College
<=2yrs <=3 yrs 4 yrs 5 yrs 6 yrs
Figure 13. Graduation time of academic year 2003‐2004 external transfers, by race/ethnicity
40% 40%
23%
39%46%
33%
33% 30%57%
44%41%
44%
13%10%
8%8%
7%16%
87%80%
88%92% 94% 93%
0%
10%
20%
30%
40%
50%
60%
70%
80%
90%
100%
AfricanAm.
HispanicAm.
AsianAm.
Caucasian Other/Undeclared
Int'l
Percen
t Gradu
ated
Within Group
Race/Ethnicity
<=2 years 3 years 4, 5 or 6 years
Institutional Research & Planning Page 10
2010 Undergraduate Graduation Rate Report
Institutional Research & Planning Page 11
Figure 14. Graduation time of external transfers, by sex
81.3%84.1%90.5%92.2%
0%
10%
20%
30%
40%
50%
60%
70%
80%
90%
100%
1988
‐89
1989
‐90
1990
‐91
1991
‐92
1992
‐93
1993
‐94
1994
‐95
1995
‐96
1996
‐97
1997
‐98
1998
‐99
1999
‐00
2000
‐01
2001
‐02
2002
‐03
2003
‐04
Percen
t Gradu
ated
Within Group
Academic Year Entering
Men <= 3 yrs Women <= 3 yrs Men <= 6 yrs Women <= 6 yrs