2010 pncwa conference, bend or wastewater collection
TRANSCRIPT
Wastewater Collection System Odor Control
Mark M. Smith, P.E.
2010 PNCWA Conference, Bend OR
October 25 | 2010

• Causes of Collection System Odors• Liquid Phase• Gas Phase
• Case Studies• Los Angeles, CA• Henderson, NV
Outline
Brown and Caldwell 2

Causes of Odors in Collection Systems2010 PNCWA Conference
Bend, OR
3

Two Causes of Odor Complaints
• Production of Hydrogen Sulfide
• Air Escape from Sewer to Atmosphere

Liquid Phase Odor Causes
2010 PNCWA Conference,Bend, OR
Brown and Caldwell 5

Generation of H2
S in Sanitary Sewers
• Wastewater Characteristics:• pH• BOD• Temperature
• Flow Patterns
• Physical Pipe Characteristics

Sulfide Production
•
Bacteria in Slime Layer Reduce Sulfate (SO4
2-) to Sulfide (S2-)
•
Equilibrium Established in Wastewater based on pH
% Combination of S2-, HS-, H2S

65 7 8 9 10 11
0
20
40
60
80
100
%
pH
H2 S
HS-
S2-
Sulfide Speciation Breakdown

Gas Phase Odor Causes
2010 PNCWA Conference,Bend, OR
Brown and Caldwell 9

Hydrogen Sulfide Release
•
H2
S Mainly Stripped out of Solution due to Turbulent Flow Conditions
Drop StructuresLocations of Radical Slope ChangesLocations of Changes in Direction

Odor Emissions from Gravity Sewers to Atmosphere
• Positive Differential Air Pressure• Wastewater Drag Effect• Pipe Physical Characteristics

Wastewater Drag Effect in a Gravity Sewer
Headspace (Air)
Wastewater(Liquid)

Sufficient Headspace = No Positive Air Pressure

Insufficient Headspace = Positive Air Pressure

Physical Pipe Characteristics
Diameter Constriction
Positive Pressure Point
Slope Reduction
Positive Pressure Point

Physical Pipe Characteristics
Presence of a Siphon
Pressure Point
Air Jumper

Primary Method to Solve Odor Problem in a Gravity Sewer System
• Withdraw Odorous Air
• Treat in an Appropriately-sized Scrubber
Typical Air Treatment Systems in Collection Systems
• Biological•Biofilters•Biotrickling Filters
•Carbon Scrubbers
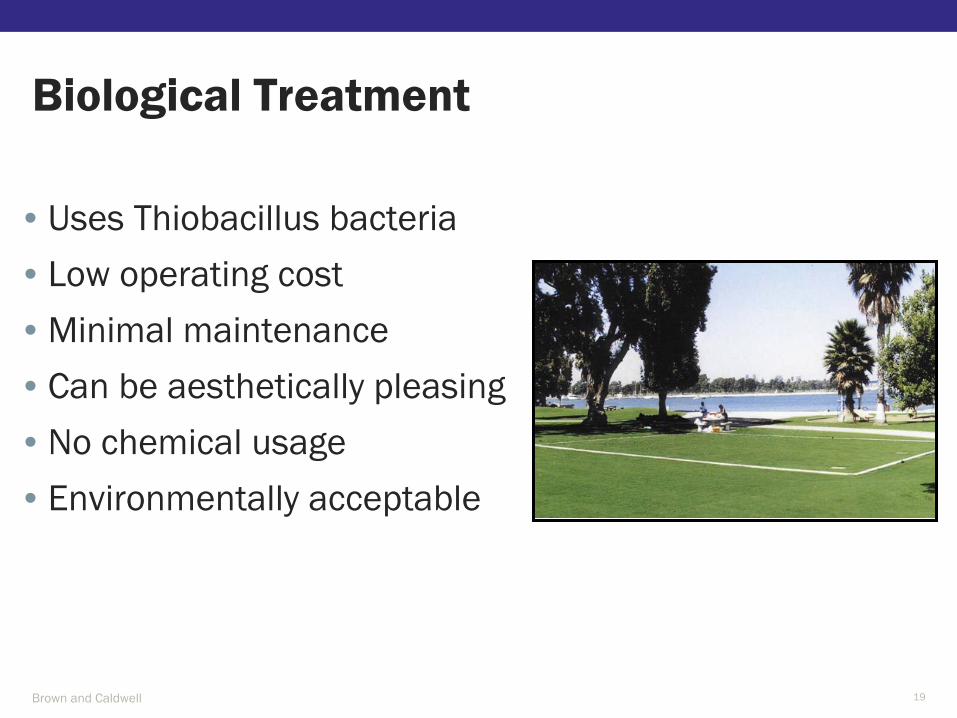
• Uses Thiobacillus bacteria
• Low operating cost
• Minimal maintenance
• Can be aesthetically pleasing
• No chemical usage
• Environmentally acceptable
Biological Treatment
Brown and Caldwell 19

Carbon Adsorption
Brown and Caldwell 20
• Can treat most odors
• Minimal maintenance
• Stack discharge increases dilution
• No chemical usage
• New high-capacity carbons available

Case Studies2010 PNCWA Conference
Bend, OR
21
Los Angeles, CA Interceptor System
2010 PNCWA ConferenceBend, OR
Brown and Caldwell 22

Downtown LA
Hollywood Hills
Hyperion
WWTP
CentralLos AngelesSewers

NOTF
WRS
WLAIS
Abandoned
N. NOS
S. NOS
MLK Jr. Bl.
NOSRodeo Rd.
Diversion
Structure 1
LA C
iene
ga B
l.
La B
rea
Ave
.
LCSF
VRS
Wes
tlake
Rel
ief
Sew
er
Jeffe
rson
Bl.
LCIS
N
Fu
ture
ECI
S Ti
e-in
Diversion
Structure 2
NOS
NCO
S
North Portal
To Hyperion
WWTP
Diversion
Structure 3
LARGE DIAMETER SEWERS IN LA CIENEGA/RODEO
VICINITY
Not to Scale
NO
RS
Stoplogged
Stoplogged
Direction of Flow Sewer Out of Service Siphon
Maze
Existing “Maze”
Sewer System

Pre-Design Analysis
• Three Odor Control Locations Identified
• Airflow Withdrawal Rates Estimated
• Needed Confirmation of Rates (“Fan Test”)

• Baseline Period• 12 data loggers installed in sewers• Pressures Recorded
• Three Air Withdrawal Sites• La Cienega (LCSFVRS)• Rodeo (NCOS)• Culver City Park (NORS)
• Fans Were Operated Over a 7-Day Period in 21 Possible “On-Off”
Combinations
• Data Loggers Recorded Air Pressure Responses in the Sewer
Fan Test Procedure

NOTF
WRS
WLAIS
N. NOS
S. NOS
NOS
Diversion
Structure 1
LCSF
VRS
Wes
tlake
Rel
ief
Sew
er
LCIS
N
Fu
ture
ECI
S Ti
e-in
Diversion
Structure 2
NOS
NCO
S
North Portal
To Hyperion
WWTP
Diversion
Structure 3
AIR PRESSURIZATION
SOURCES AND AFFECTED SEWERS
Not to Scale
NO
RS
Stoplogged
Stoplogged
Abandoned
Direction of Flow Sewer Out of Service Siphon Path of Air Backpressure Effect
Maze
Siphon Backpressure
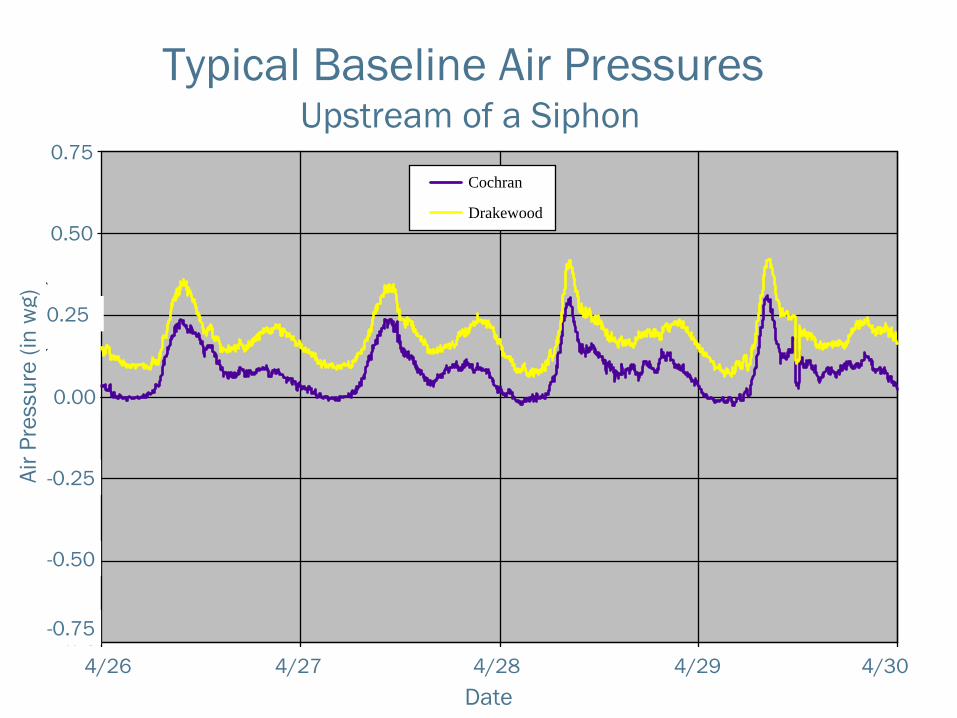
Cochran (NOS) & Drakewood (NCOS)Baseline Pressures
-0.75
-0.50
-0.25
0.00
0.25
0.50
0.75
4/26 4/27 4/28 4/29 4/30
Date
Air
Pre
ssur
e (in
. H2O
)
Cochran
Drakewood
Typical Baseline Air PressuresUpstream of a Siphon
Air P
ress
ure
(in w
g)
Date4/26 4/27 4/28 4/29 4/30
0.75
0.50
0.00
-0.25
-0.50
-0.75
0.25

Cochran (NOS) & Drakewood (NCOS)Baseline Pressures
0.00
0.05
0.10
0.15
0.20
0.25
12:00 15:00 18:00 21:00 0:00
Time
Air
Pre
ssur
e (in
. H2O
)
Cochran
Drakewood
4/26/03
Typical Baseline Air PressuresUpstream of a Siphon (12 hr. Period)
Time
0.25
0.20
0.15
0.10
0.05
0.00
12:00 15:00 18:00 21:00 00:00
Air P
ress
ure
(in w
g)
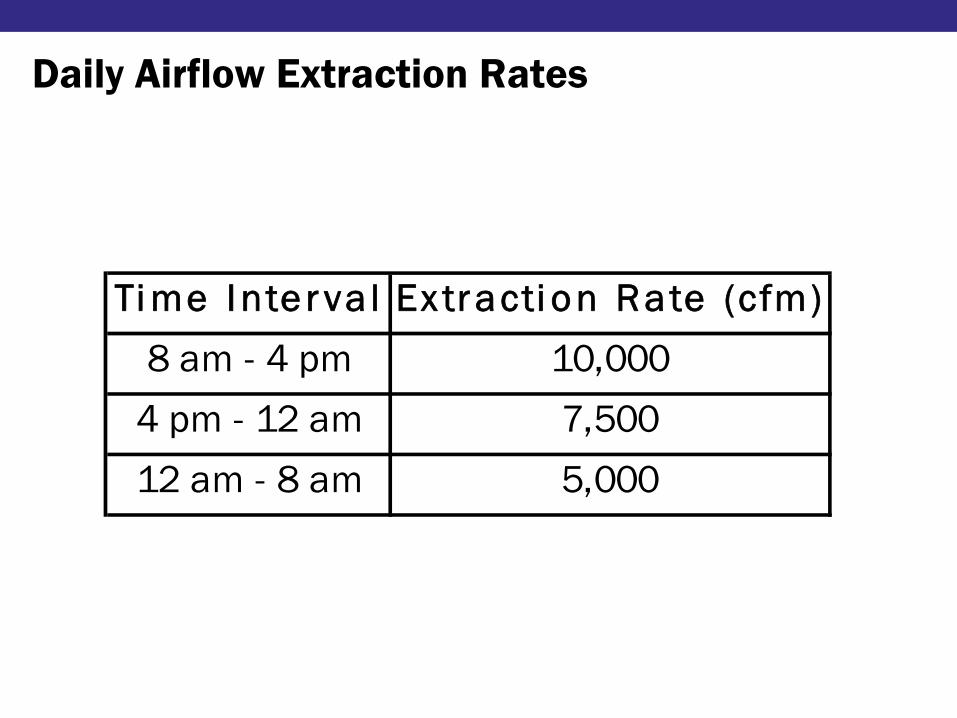
Daily Airflow Extraction Rates
Ti me Inte r va l Ex tr acti on Rate (cfm)
8 am - 4 pm 10,000
4 pm - 12 am 7,500
12 am - 8 am 5,000


Vinton, Ivy & Jackson ManholesMay 2, 2003
All Fans Running @ 10,000 cfm
-0.4
-0.3
-0.2
-0.1
0
0.1
0.2
0.3
0.4
8:00 12:00 16:00
Time
Sew
er A
ir P
ress
ure
(in. w
c)
Jackson (WRS)
Vinton (WLAIS)Ivy (NORS)
Vent Hole at Ivy Covered at This Time
10:00 14:00
Typical Air Pressure Responses3 Fans Withdrawing 10,000 cfm Each
8:00 10:00 12:00 14:00 16:00
Time
0.0
Air P
ress
ure
(in w
g )
0.2
0.1
-0.2
-0.1
0.3
0.4
-0.4
-0.3

Kalsman, Corbett & Fairfax ManholesMay 2, 2003
All Fans Running @ 10,000 cfm
-0.4
-0.3
-0.2
-0.1
0
0.1
0.2
0.3
0.4
8:00 12:00 16:00Time
Sew
er A
ir P
ress
ure
(in. w
c)
Kalsman (LCSFVRS)
Corbett (LCIS)
Fairfax (LCSFVRS)
La Cienega Fan
is Started
Rodeo and
Culver City Fans are Started
La Cienega Connection
is Short-Circuiting
Short-Circuiting
is Corrected
14:0010:00
Typical Air Pressure Responses3 Fans Withdrawing 10,000 cfm Each
8:00 10:00 12:00 14:00 16:00
Time
0.0
0.2
0.1
-0.2
-0.1
0.3
0.4
-0.4
-0.3
Air P
ress
ure
(in w
g )

Summary of Test ResultsAll Fans Running at 10,000 cfm
Manhole Location
% Change in
Avg Pressure
Cochran (NOS) -259 Vinton (WLAIS) -183
Fairfax (LCSFVRS) -167 Jackson (WRS) -165
Kalsman (LCSFVRS) -161
Corbett (LCIS) -156 Ivy (NORS) -152
Hannum (NORS) -120 Grayburn (NOS, N.
Branch) -101
Imperial Hwy. (NORS) -12 Somerset (NOS, S.
Branch) -4
Drakewood (NCOS) 28

Conclusions
• Siphons Were The Primary Cause of Positive Pressure
• Significant Reductions in Pressure
were Achieved
• Greatest Success Occurred When All Fans
Were Withdrawing 10,000 cfm Simultaneously

Recommendations
• Withdraw 12,500 cfm at Each of the Three ATF Locations (1.25 SF)
• Further Evaluate Pressure and Ventilation Dynamics in Areas Unaffected by Fan Testing

Force Main Odor Production
• Problems are made worse due to• Full Pipe Flow
• 360°
Slime Layer
• Long Detention Times• In Wet Well
• In Force Main

H2
S Release from Force Main
• Typically occurs at the point of discharge into a gravity pipe
• Turbulence Induced

How to Solve an Odor Problem in a Force Main?
• Chemical Feed• Calcium Nitrate• Sodium Hypochlorite• Sodium Hydroxide• Magnesium Hydroxide• Iron Salts
• Ferrous Chloride
• Ferric Chloride

Calcium Nitrate Ca(NO3
)2
• Trade name BIOXIDE®
• Provides bacteria with alternative oxygen source• They prefer nitrate over sulfate
• Sulfate remains in non-odorous form• Safe to handle• Fairly expensive

Sodium Hypochlorite (NaOCl)
• “Bleach”• Oxidizes H2
S to elemental sulfur at basic pH• Oxidized H2
S to sulfate at acidic pH• Relatively safe to handle• Inexpensive unit cost• Strong oxidant

Sodium Hydroxide (NaOH)
• “Caustic”• High pH• Intended to Kill the Slime Layer• Typically Introduced in “slug doses”, Not Continuously
• PRI-SC System• Combination of NaOH & FeCl3

Magnesium Hydroxide (MgOH)2
• “Mag”, “Milk of Magnesia”• Intended as a pH Adjustment• Original Use (in sewers) Was to Slow Concrete Corrosion
Rates• Operators Noted Reduction in Downstream Odor Complaints
• Relatively Inexpensive• Safe to Handle• Can Require a Large Dosage, Depending on the
Alkalinity of the Wastewater

Lake Las Vegas Resort
North Shore•Hyatt Hotel•High $$ Homes•Golf Courses
South Shore•High $$ Homes•Golf Courses
Lake Las Vegas

South Shore Collection System
• 60,000 GPD
• 42,000 LF of pipe• 2 inches to 15 inches in diameter
• 5 Lift Stations

South Shore Odor Problem
• Very high hydrogen sulfide concentrations
• Housing construction was booming (2004)
• Several odor complaints arose

Odor Investigative Team
• City of Henderson• Collection System Field Personnel• Engineers
• Lake Las Vegas • Management• Lift Station Operators
• Consulting Team

Project Approach
• Compile and map odor complaint locations
• Develop and execute a sampling plan
• Compile and analyze the resulting data
• Develop and implement an odor control plan

Sampling Plan• Install 8 hydrogen sulfide monitors throughout
collection system
• Data collected for 1 week
• Inspect and analyze existing lift stations, pipes and O&M procedures
• CCTV’d suspected problem pipes

Henderson, NV “911”
Odor Study
2010 PNCWA ConferenceBend, OR
Brown and Caldwell 53

A
B
C
D
EF
GH
LS 17
LS 18
LS 19
LS 25
LS 27 Grand
Cor
niche
Dr.
Rue
Med
iterra
Grand Mediterra Blvd.
Rue de
Rivo
li
Via di Como
Grand Barcelona
Direction of FlowH2S Sampling Location
Lift StationR
ue P
rom
enad
e W
ay
Surcharged MH 289-076
N

Findings
• Hydrogen sulfide between 50 and 300 ppm• Regularly over 100 ppm
• Elevation problems and sags in pipes and manholes
• Out-of-service chemical feed facilities
• Detention times between 7 and 90 hours in lift stations(!)

H2S Concentrations at MH 283-013 (A)
0
50
100
150
200
250
300
9/29/20040:00
9/30/20040:00
10/1/20040:00
10/2/20040:00
10/3/20040:00
10/4/20040:00
10/5/20040:00
10/6/20040:00
10/7/20040:00
Time
H2S
(ppm
)

Incoming 8-in Sewer
To Lift Station
Stub Out

Short Term Recommendations
• Restore BIOXIDE®
feed facilities
• Periodically clean and flush problem manholes and pipes
• Install rubber flapper

Incoming 15-in Sewer6% Slope
RubberFlapper
Incoming 8-in Sewer
100 ft. DSSags
Air
Air
Air


Hydrogen Sulfide in MH 283-013 w/ Bioxide Addition & Flushing
0
50
100
150
200
250
300
10/8/2004 0:00 10/9/2004 0:00 10/10/20040:00
10/11/20040:00
10/12/20040:00
10/13/20040:00
10/14/20040:00
Time
H2S
(ppm
)

Long Term Recommendations
• Continue feeding BIOXIDE®
, monitoring hydrogen
sulfide and force mains
• Perform chemical feed optimization study
• Find permanent solution to sags and manhole elevation problems