2010 interim results presentation - centrica
TRANSCRIPT


Disclaimer
This presentation does not constitute an invitation to underwrite, subscribe for, orp , ,otherwise acquire or dispose of any Centrica shares or other securities.
This presentation contains certain forward-looking statements with respect to thefinancial condition, results, operations and businesses of Centrica plc. These, , p pstatements and forecasts involve risk and uncertainty because they relate to eventsand depend on circumstances that will occur in the future. There are a number offactors that could cause actual results or developments to differ materially from thoseexpressed or implied by these forward-looking statements and forecasts.p p y g
Past performance is no guide to future performance and persons needing adviceshould consult an independent financial adviser.
2


Commodity prices and spreads
100
120
140
Power (£/MWh)
40
60
80
100Oil ($/boe)
0
20
2008 2009 2010
Gas (p/th)
201160
30
40
50
Clean Dark Spread (£/MWh)
£/MWh
0
10
20
30
Clean Spark Spread (£/MWh)
Clean Dark Spread (£/MWh)
5
02008 2009 2010 2011

Financial headlines
20092010Period ended 30 June
CONTINUING OPERATIONS:Revenue (£m)Adjusted operating profit (£m)
11,7071,563
11,657945
Effective tax rate
GROUP RESULT:
37% 39%
GROUP RESULT:Earnings (£m)Earnings per share (p)
88617.2
53710.5
Ab fi i l d JV & i t t f i t t & t ti ( t dj t d ti fit hi h i l d JV d i t
Interim dividend per share (p) 3.84 3.66
6
Above figures include JVs & associates net of interest & taxation (except adjusted operating profit which includes JVs and associatesgross of interest and taxation) and are before depreciation of fair value uplifts to property, plant and equipment from StrategicInvestments and exceptional items & certain re-measurements
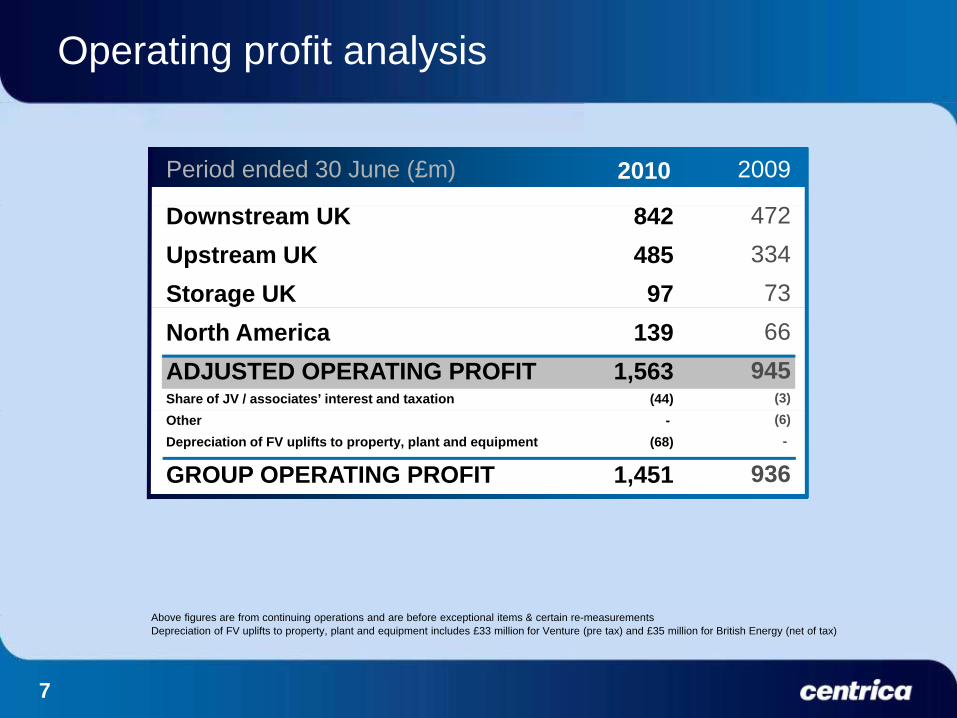
Operating profit analysis
20092010Period ended 30 June (£m)
Downstream UKUpstream UKStorage UK
842485
97
472334
73North AmericaADJUSTED OPERATING PROFITShare of JV / associates’ interest and taxation
1391,563
(44)
66945
(3)OtherDepreciation of FV uplifts to property, plant and equipment
GROUP OPERATING PROFIT
-(68)
1,451
(6)-
936
Ab fi f ti i ti d b f ti l it & t i t
7
Above figures are from continuing operations and are before exceptional items & certain re-measurementsDepreciation of FV uplifts to property, plant and equipment includes £33 million for Venture (pre tax) and £35 million for British Energy (net of tax)
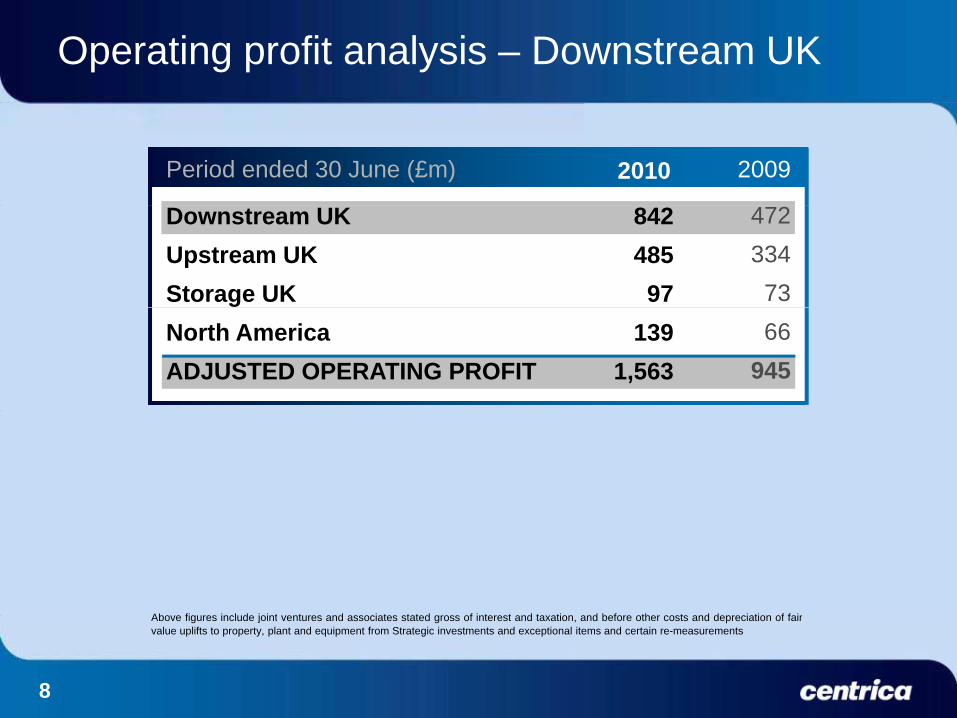
Operating profit analysis – Downstream UK
20092010Period ended 30 June (£m)
472334
73
Downstream UKUpstream UKStorage UK
842485
9766
945North AmericaADJUSTED OPERATING PROFIT
1391,563
Ab fi i l d j i t t d i t t t d f i t t d t ti d b f th t d d i ti f f i
8
Above figures include joint ventures and associates stated gross of interest and taxation, and before other costs and depreciation of fairvalue uplifts to property, plant and equipment from Strategic investments and exceptional items and certain re-measurements

Downstream UK: operating profit & key drivers
20092010Period ended30 June (£m)
Residential energy revenue (£m) & margin (%)
4 384 4 448Residential energy
Residential services
Business
DOWNSTREAM UK
585
109
148
842
295
112
65
472
4,384 4,448
6.7%
13.2%
DOWNSTREAM UK 842 472
Business revenue (£m)& margin (%)
H1 2009 H1 2010
Residential services revenue (£m) & margin (%) g ( )
1,805 1,559
9.5%
688 726
16.3%
H1 2009 H1 2010
3.6%
16.3%15.0%
H1 2009 H1 2010Ab fi i l d j i t t d i t t t d f i t t d t ti d b f th t d d i ti f f i
9
Above figures include joint ventures and associates stated gross of interest and taxation, and before other costs and depreciation of fairvalue uplifts to property, plant and equipment from Strategic investments and exceptional items and certain re-measurements

Operating profit analysis – Upstream UK
20092010Period ended 30 June (£m)
472334
73
Downstream UKUpstream UKStorage UK
842485
9766
945North AmericaADJUSTED OPERATING PROFIT
1391,563
Ab fi i l d j i t t d i t t t d f i t t d t ti d b f th t d d i ti f f i
10
Above figures include joint ventures and associates stated gross of interest and taxation, and before other costs and depreciation of fairvalue uplifts to property, plant and equipment from Strategic investments and exceptional items and certain re-measurements

Upstream UK: operating profit & key drivers
Gas & oil production volumes20092010
Upstream gas and oil 314 346
Period ended30 June (£m)
Liquids(mmboe)
Gas(mmth)
p gPower generationI&CEnergy tradingUPSTREAM UK
127 46 (2)
485
43
(89)
34
334
939
1,321
6.0
3.2
Power generation volumes (TWh) andachieved spreads / prices (£/MWh)
UPSTREAM UK 485 334
Average sales price
H1 2010 H1 2010H1 2009 H1 2009
achieved spreads / prices (£/MWh)gLiquids(£/boe)
Gas(p/therm)
55.741.9
29 7
NuclearCCGT
9.7
12.3
39.8
29.7
H1 2010 H1 2010H1 2009 H1 2009 H1 2010 H1 2010H1 2009
£11.7/MWh £11.5/MWh
5.0
£42.9/MWh
11
Above figures include joint ventures and associates stated gross of interest and taxation, and before other costs and depreciation of fairvalue uplifts to property, plant and equipment from Strategic investments and exceptional items and certain re-measurements

Operating profit analysis – Storage UK
20092010Period ended 30 June (£m)
472334
73
Downstream UKUpstream UKStorage UK
842485
9766
945North AmericaADJUSTED OPERATING PROFIT
1391,563
Ab fi i l d j i t t d i t t t d f i t t d t ti d b f th t d d i ti f f i
12
Above figures include joint ventures and associates stated gross of interest and taxation, and before other costs and depreciation of fairvalue uplifts to property, plant and equipment from Strategic investments and exceptional items and certain re-measurements

Operating profit analysis – North America
20092010Period ended 30 June (£m)
472334
73
Downstream UKUpstream UKStorage UK
842485
9766
945North AmericaADJUSTED OPERATING PROFIT
1391,563
Ab fi i l d j i t t d i t t t d f i t t d t ti d b f th t d d i ti f f i
13
Above figures include joint ventures and associates stated gross of interest and taxation, and before other costs and depreciation of fairvalue uplifts to property, plant and equipment from Strategic investments and exceptional items and certain re-measurements

North America: operating profit & key drivers
20092010
Residential energy underlying performance
110 110
46 91
Period ended30 June (£m) Underlying
margin (%)*
Residential energyRevenue (£m)
y g pone-off charges
Business energyServicesUpstream & WholesaleNORTH AMERICA
-44 8
(23)139
(45)20 3
(3)66
1.3696.3%
1,4548.0%
NORTH AMERICA 139 66
Upstream and wholesale energyPower generation
volumes and achievedGas production
volumes and
Business energyPower volumes
(TWh)Revenue & margin %
(£m)
H1 2010 H1 2010H1 2009 H1 2009
volumes and achieved spark spread
volumes and achieved price
(TWh)
18.3
15.5
(£m)
1,311 1,319
3 3% 2 2 2 2
186177
1.5%
3.3%
Ab fi i l d j i t t d i t t t d f i t t d t ti d b f th t d d i ti f f i
2.2
$20.2/MWh
2.2
H1 2010 H1 2010H1 2009 H1 2009
$10.2/MWh C$5.2/GJ C$5.2/GJ
H1 2010 H1 2010H1 2009 H1 2009
14
Above figures include joint ventures and associates stated gross of interest and taxation, and before other costs and depreciation of fairvalue uplifts to property, plant and equipment from Strategic investments and exceptional items and certain re-measurements* Excludes one-off charges of £45m in H1 2009

Cash flow
20092010Period ended 30 June (£m) FY 2009
(511)(511)1,257 (125)
OPENING NET DEBTEBITDAWorking capital movements
(3,136)1,948 (337)
(511)2,538
419 (74)
(379)(1,427)
Margin callsInterest and taxNet capex
410 (180)(565)
(79)(700)
(4,072)( , )(447)(100)
(83)
et capeDividendsPension deficit paymentsFX / Other
(565)(470)(207)(216)
( , )(635)(403)307(83)
(1,889)(638)
FX / OtherCLOSING NET DEBT Margin cash held / (pledged) within net debt
(216)(2,753)
(236)
307 (3,136)
(631)
15

Capital and acquisition expenditureCapital and acquisition expenditure
H1 2009H1 2010 (£m) FY 2010e
145 73 46
UK upstream gasUK upstream powerNorth America
3206542
550 250 100
30 49 33
UK gas storageEuropeBritish Gas / other
316
57
50 -
150 33376
1,051 1 427
t s Gas / ot eTotal pre-acquisitionsAcquisitions / Disposals*TOTAL
5521
44565
501,100
379 1,427 TOTAL 565
* T d t F ll i l d th i iti f T i id d LNG t f £242 th i iti f Cl k k f £122 d th di l
16
* To date. Full year includes the acquisition of Trinidad LNG assets for £242m, the acquisition of Clockwork for £122m, and the disposalof Centrica Energía for £29m

Summary and outlook
Summary• Strong financial and operational performanceg p p• Profit heavily weighted towards the first half• Strong downstream performance, reflecting improved service levels
and customer growth together with impact of lower commodity pricesand customer growth, together with impact of lower commodity prices• Upstream production and generation volumes offset by lower achieved
prices and spreads• Improved performance in North America
Outlook• Full year 2010 in line with current market expectations, subject to
usual factors of commodity prices and weather• Significant rise in wholesale commodity costs over the medium term
17
• Significant rise in wholesale commodity costs over the medium term


Overview
• Strong first half result• Downstream: growth underpinned by customer service
and pricingUpstream: strong asset performance but continued• Upstream: strong asset performance, but continued impact of lower commodity prices
• Improved returns from North America downstream• Strategic priorities in place, focus on delivering growth
and long-term value
19

Our Strategic Priorities
Grow British Gas1. . . leading the transition to low carbon homes and businesses
Deliver value from our growing upstream business 2 g g p. . . securing sustainable energy for our customers
Build an integrated North American business3 Build an integrated North American business. . . with leading positions in deregulated markets
Drive superior financial returns
3
4 Drive superior financial returns. . . through operating performance and our investment choices
energy for a low carbon world
4
energy for a low carbon world
20

Grow British Gas
• Strong H1 residential energy performance driven by customer service and competitive pricing position
• Service metrics remain strong– online transactions increased – call volumes and speed to answer down
further net promoter score improvements– further net promoter score improvements• On track to exceed £100m cost reduction target• Maintained ‘cheapest electricity’ position
calls
Telephone vs. online contact
• Customer growth– 223k growth in residential energy accounts– 51k growth in joint customer accounts
online
H1 2010
Households (‘000)Energy & ServicesServices onlyEnergy only
Jun 102,0941,9488,226
Change+51-11+2
Dec 092,0431,9598,224
Accounts (‘000)Residential energyResidential servicesBusiness energy
Jun 1015,934
8,5601,048
Change+223+107
+1
Dec 0915,711
8,4531,047gy y
Total,
12,268 +4212,226gy
Total 25,542 +33125,211
21

Grow British Gas
• Strong services operational performance in Q1 during record call out period
Insurance penetration100%g p
• Continued customer growth in secondary products
• Almost 2m customers now on an
60%
80%
40%
20%
insurance based product• Installation volumes up 17%
– more flexible pricing Average business sites on
2009 H2 2010 H1 2010 H2e
20%
0
– quicker lead to sale time– increasing lead conversion
• Business – new segmental growth
new multi-site dealsThe image cannot be displayed. Your computer may not have enough memory to open the image, or the image may have been corrupted. Restart your computer, and then open the file again. If the red x still appears, you may have to delete the image and then insert it again.
28
strategy – increase in average sites on new
multi-site deals– improving net promoter score
11
improving net promoter score2009 2010
22
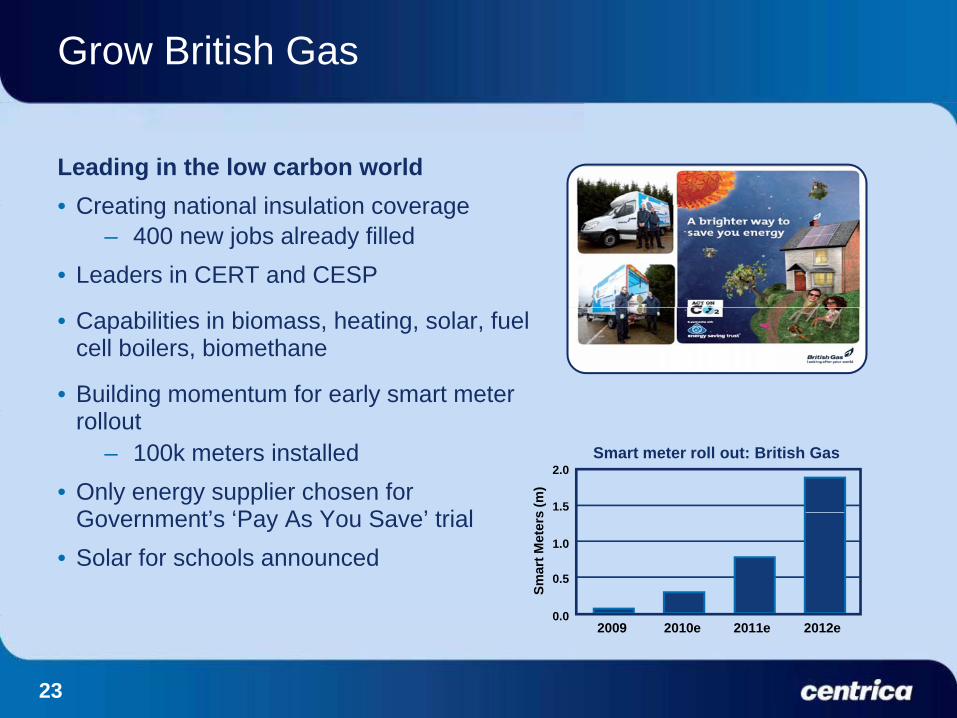
Grow British Gas
Leading in the low carbon world• Creating national insulation coverage• Creating national insulation coverage
– 400 new jobs already filled• Leaders in CERT and CESP
• Capabilities in biomass, heating, solar, fuel cell boilers, biomethane
• Building momentum for early smart meter rollout
– 100k meters installed• Only energy supplier chosen for
G t’ ‘P A Y S ’ t i l
Smart meter roll out: British Gas
1.5
2.0
s (m
)Government’s ‘Pay As You Save’ trial
• Solar for schools announced
0 0
1.0
0.5
Smar
t Met
ers
0.02009 2010e 2011e 2012e
23

Deliver value from our growing upstream business - Gas
• Successful integration of Venture– empowered decision making andempowered decision making and
clear accountability– comprehensive risk management
programme in place• Development projects success
– third well at Chiswick brought on stream; fourth well due shortly
– Eris and Ceres commencedEris and Ceres commenced production
– due to install F3-FA platform during second half of 2010
ErisCygnus
F3 FAErisCeres Chiswick
F3-FA
24

Deliver value from our growing upstream business - Gas
• Appraisal and exploration– Cygnus appraisal drilling of western
Cygnus fieldCygnus appraisal drilling of western area successful
– exploration discoveries in Olympus, Fogelberg and Maria
• Ten wells drilled to date – seven have shown positive results,
including three exploration discoveriesdiscoveries
– a further six wells scheduled to be drilled by the end of 2010
• Acquisition of Suncor TrinidadianAcquisition of Suncor Trinidadian exploration, development and production assets due to be completed shortly
• 9 LNG cargoes delivered so far in 2010g
25

Deliver value from our growing upstream business - Power
• Excellent CCGT reliability in well supplied market Langage, 885MWpp
• Langage in full commercial operation• Completed JV agreement for Lincs
– contracts awarded and onshorecontracts awarded and onshore works commenced
• British Energy output impacted by Sizewell B outage Raceg
• Engineering studies for nuclear new-build ongoing
– Government recognition of need for Skegness
Docking Shoal
BankLincs
Lynn
InnerDowsing
a carbon floor
Kings LynnWalpoleSub Station Lincs Project
26

Deliver value from our growingupstream business - Storage
• Excellent operational performance• Record winter demand supported by• Record winter demand, supported by
enhanced withdrawal and injection capabilities at Rough
• Narrowing summer / winter spreads
Historical Analysis (2005-2010)bcf
120
140
Narrowing summer / winter spreads• Caythorpe
– shorter cycle times to capture market volatility 40
60
80
Min - Max Range(2005-2009)y
– regulatory uncertainty in respect of third party access exemption
• Baird and Bains FID now expected
10
20 2010
M A M J J A S O N DJ F
in 2011
27

Build an integrated North American business
• New management team in place• Encouraging initial progress against
Aim to double operating profit over next 3-5 years• Encouraging initial progress against
strategy• Strong returns downstream, in excess
of cost of capital
over next 3 5 years
of cost of capital• Acquisition of Clockwork achieves
services scale and provides platform for growth
• Upstream environment challenging– low wholesale commodity prices– provides opportunities as asset
2009 Organicgrowth
opportunities
Acquisitions 3-5 yrs
prices reduce opportunities
28

Build an integrated North American business
• Residential energy supply– reduced churn in Texasreduced churn in Texas– reduced operating cost base and lower debt
levels; prepayment launched– focus on customer quality and growth in US
N th E tNorth East– Ontario legislation – cost reduction and
retention programme in place
• Business energy supply– continued growth – focus on sales channels– improved margins
Business Energy SupplyPower volumes (TWh)
18.3– disciplined customer acquisition– pricing for credit / capital utilisation– reduced cost base
H1 2009
15.5
H1 2009 H1 2010
29

Build an integrated North American business
Services market share100%
80%
Other
Large
Major/National
Clockwork Home Services acquired for US$182m (£122m)
• Scale achieved in cost effective way– market leading services position – lower procurement costs 40%
60%
80%
AHS
Dwyer
ARS / R R t
SearsRelianceLarge
Local
( )
lower procurement costs
• Energy and services overlap– enhances presence in key
de-regulated markets
20%
40%
Clockwork
ARS / Rescue Rooter
ServiceExperts
DirectEnergy
SmallLocal
de regulated markets– increases ability to provide both
energy and services over time
• Platform for future growthEnergy / services overlap
0NA Market Major / National
Energy
60%at o o utu e g o t– established franchise model
20%
40%
DE DE with Clockwork
30

Summary
• Strong start to the yearg y• Good progress on strategic priorities• Strong cash generation combined with financial discipline• Optionality in investment programme• Balanced business able to grow in both high and low
commodity price environmentcommodity price environment• Leading in a low carbon world
31
