2010 cetaceans on the frontier survey - vliz › imisdocs › publications › 236767.pdfcetaceans...
TRANSCRIPT

Galway-Mayo Institute of Technology
Irish Whale and Dolphin Group
Cetaceans on the Frontier Survey 2010
18th February – 1st March 2010
Survey Team
Cetaceans: Joanne O'Brien1, Conor Ryan1,2, Patrick Lyne2, Hilary Healy1, Lucy Hunt2, Mary Coleman3, Sophie
Hansen1 & David Williams2. Birds: Maggie Hall4, Rossa Meade2, Jackie Hunt4 & Alex Borawska4. Acoustics:
Dave Wall (SIC)1,2 & Laura Kavanagh2. Plankton & Jellyfish: Jane Kelleher3, Darren Craig1 & Fien de
Raedemaecker1.
1 Galway-Mayo Institute of Technology, Dublin Road, Galway. 2 Irish Whale and Dolphin Group, Merchants Quay, Kilrush,
Co. Clare. 3 Coastal Marine Resources Centre, University College Cork, Co. Cork. 4 Birdwatch Ireland, Unit 20, Block D,
Bullford Business Campus, Kilcoole, Co. Wicklow, Ireland.
Pilot Whale, Whittard Canyon System. ( Dave Wall)
Cetaceans on the Frontier 2010 Page 1 18/05/2010
1 Introduction
The waters of Ireland’s Exclusive Economic Zone (EEZ) are thought to represent one of the most
important cetacean (whales, dolphins and porpoise) habitats in Europe. To date 24 species of
cetacean have been recorded (Appendix I), with seven of these having been confirmed as calving
within the Irish EEZ, while a number of other species are possibly calving (e.g. minke whale and
northern bottlenose whale) (Berrow 2001). In recognition of their importance for cetaceans, the
Irish government declared all Irish waters (within the EEZ) to be a whale and dolphin sanctuary
in 1991 (Rogan and Berrow 1995). Despite this recognition, information on the distribution and
relative abundance of cetaceans within the Irish EEZ, especially in offshore waters, is very limited
(Wall et al. 2006).
The Irish Whale and Dolphin Group (IWDG) have been collecting data on the distribution and
relative abundance of cetaceans in Irish waters (including Northern Ireland) since 1991. The
IWDG casual and constant effort sightings schemes record data mainly from land-based sightings
and surveys (Berrow et al. 2001). The IWDG has conducted cetacean surveys on board
commercial ferries since 2001 and on board the Irish Marine Institute’s offshore research vessel
Celtic Explorer since 2003.
In 2008, the IWDG in collaboration with the Galway-Mayo Institute of Technology commenced
PReCAST, a three-year project (2008-2011) that aims to provide robust scientific data to support
conservation policy and provide guidance to state agencies in implementing national and
international obligations. PReCAST is committed to gaining a more complete understanding of
the seasonal distribution, relative abundance and habitat use of cetaceans within the Irish EEZ.
As part of this project the PReCAST team committed to apply for ship time under the Marine
Institute’s Ship Time Programme and was successful in 2009, conducting a survey of slope and
canyon habitat along the north and west slopes of the Porcupine Bank (Wall et al. 2009). In 2010
the PReCAST team applied for further ship time to conduct a similar survey of slope and canyon
habitat along the slopes of the southern Porcupine Bank, eastern Porcupine Basin and South-
western shelf. The application was made in order to address a number of objectives.
1.1 Visual Cetacean Survey
The main focus of the survey was to conduct a habitat specific survey of deep diving cetaceans,
particularly the enigmatic beaked whale species. These whales, of which 5 species have been
recorded from Irish waters (Sowerby's, Gervais', True's and Cuvier' beaked whales and the
northern bottlenose whale), favour deep waters (in excess of 1000m depth) with complex
bathymetry (Macleod C., 2005). Little is known of their distribution or biology, and all were listed
Cetaceans on the Frontier 2010 Page 2 18/05/2010
as 'data deficient' in the 2007 Irish report on the conservation status of cetaceans in Irish waters
(NPWS, 2008). The focus of this survey was on deep-water canyons, which splice the slopes of
the Porcupine Bank and Shelf Edge to the west of Ireland.
Detailed multi-beam bathymetry images collected during the Irish National Seabed Survey (INSS)
2000-2006, enabled these canyons to be targeted in a very specific manner for the first time. The
survey track was designed to run through the centre of each of the chosen study canyons and the
route was further refined during the survey using the Celtic Explorer’s OLEX™ bathymetry
charting system (updated with INSS bathymetry data), which enabled real time visualisation of
the vessel’s movement above the canyons.
1.2 Acoustic Cetacean Survey
Many deep diving species spend the vast majority of their lives beneath the surface and out of the
reach of visual detection. In order to increase the detection rate for these species during the
current survey, a number of acoustic survey methods were employed.
1.2.1 Towed Hydrophone Array
Beaked whales belong to one of the marine mammal families that we know the least about. The
reason for this is their infrequent encounter rates, offshore (deep water) distribution and
extensive deep and long lasting dives (Heyning 2002, Mead 2002, Pitman 2002). The beaked
whale family is widely distributed on a global scale (Cox et al. 2006, MacLeod et al. 2006, Podestá
et al. 2006) and concentrated in deep-water habitats, continental slopes or submarine canyons
(D'Amico et al. 2003, Johnson et al. 2008, MacLeod and Mitchell 2006, Mead 2002, Reeves et al.
2002, Whitened et al. 1997, Williams et al. 2002). Their general diving pattern limits the time the
animals spend on the surface and encounter rates of beaked whales during visual surveys are
therefore typically low (ANON 2004, Barlow 1999, Barlow et al. 2006).
Several beaked whale species are believed to produce clicks and some species also use whistles
as part of their vocal repertoire (Dawson et al. 1998, Hobson and Martin 1996, Hooker and
Whitehead 2002, MacLeod and D`Amico 2006, Rogers and Brown 1999). Beaked whales use
ultrasonic frequency clicks with most of the energy in the 26-50 kHz frequency range. The
frequency modulated search clicks are 175 to 270 µs long with inter click intervals (ICI) of
between 0.2 and 0.4 sec. (Johnson et al. 2008, Johnson et al. 2004, 2006, Madsen et al. 2005,
Zimmer et al. 2005).
The potential of using near surface towed hydrophones to detect beaked whales from ships like
the RV Celtic Explorer is unknown. Preliminary assessment of towed hydrophone array data
collected during the Cetaceans on the Frontier survey 2009 yielded no confirmed beaked whale

Cetaceans on the Frontier 2010 Page 3 18/05/2010
vocalisations, however identification methods and software for beaked whale clicks are still very
much under development and recorded audio files will be subject to ongoing analyses for
identification of beaked whale clicks and whistles. Recorded data could be very important
combined with the dedicated visual and acoustic 2007 CODA survey for cetaceans (CODA 2009).
The objective from an acoustic marine mammal perspective is to investigate the potential for
collection of passive acoustic data on beaked whales from a large vessel and to generate data on
distribution, abundance and habitat use of beaked whales and other cetacean species.
1.2.2 Bottlenose Dolphin Vocalisations
Acoustic data from bottlenose dolphin encounters will be provided to a PhD study (based in
University College Cork and funded by IRCSET), which aims to describe the variability of
bottlenose dolphin (Tursiops truncatus) vocalisations in Irish waters. To do this, passive acoustic
techniques were used to sample vocalisations, initially from resident dolphins in the Shannon
estuary and coastal transients. Photo identification techniques were used to look the degree of
association within and between these communities to identify any overlapping ranging patterns.
Data from a parallel study will also be used in which genetic sampling through biopsy provides
information on relatedness within and between the studied communities (study funded by SFI).
The vocal repertoire of dolphins includes pulsed sounds and tonal whistles. Pulsed sounds can be
divided into click trains and burst pulses and are used for echolocation and communication
purposes. Burst pulse calls are often described as cries, barks, grunts or squeals since even
though these are composed of individual clicks the repetition rate is so high that the clicks are
indistinguishable to the human ear and the sound is like a continuous noise. Burst pulses are
produced by most toothed whales and are associated with feeding and close range social
interactions (Blomqvist and Amundin, 2004).
The whistle repertoire of dolphins varies between species, geographically separated populations
(Azevedo and Van Sluys, 2005; Morisaka et al., 2005b), different groups within populations
(Rendell et al., 1999) and between individuals (Janik et al., 2006). Such variation in may be the
result of physiological or environmental factors such as body size or ambient background noise
levels (Morisaka et al., 2005; Rendell et al., 1999). The presence of eavesdroppers (e.g. predators
or prey) may also contribute to variation between social groups or individuals (Deecke and Janik,
2005). Variation may also arise from related individuals sharing similar whistles (Bazua-Duran
and Au, 2004) or through distinct repertoires being used within associating groups and thus
result in the development of dialects (Tyack, 1986). Dialects are well known in birds (Baker,
1987) but rare among cetaceans, two examples are the calls of killer whales (Orcinus orca) (Ford,
2002) and the codas of sperm whales (Physeter macrocephalus) (Weilgart and Whitehead, 1997).

Cetaceans on the Frontier 2010 Page 4 18/05/2010
1.3 Cetacean Photo-ID and Biopsy
To better understand the status of the whales and dolphins found in Irish waters, and identify
whether (and what) additional conservation measures are required, it is essential to clarify
issues related to stock structure, movements and abundance. A number of scientific tools have
been used to assist in determining stock structure and movement and it is generally agreed that
information from a suite of techniques is required. Without such an understanding it is difficult, if
not impossible to devise an appropriate conservation and monitoring strategy.
The most commonly used techniques are analyses of individual identification data
(photographs), genetic analyses of population structure and analysis of satellite telemetry data.
All approaches have strengths and weaknesses, and a number of respected international
scientific bodies (e.g. the Scientific Committee of the International Whaling Commission, the IUCN
Western Grey Whale Advisory Panel) recommend and use data from all three approaches to
obtain as clear an understanding as possible.
During this survey it was hoped to obtain photo-ID images of target species (fin, humpback, and
sperm whales, bottlenose dolphins and pilot whales) in Irish waters. To date the IWDG have
photo-identified 20 bottlenose dolphins in offshore waters within the Irish EEZ.
1.4 Visual Seabird Survey
By surveying seabirds at sea using a standardised ship-based method (following European
Seabirds At Sea (ESAS) recommendations (Tasker et al. 1984; Komdeur, Bertelsen and Cracknell
1992; Camphuysen et al. 2004) during this research cruise, it was planned to record and then
map the distribution, abundance, and density of seabird species occurring over the slopes and
canyons of the Porcupine Bank, Porcupine Seabight, and southwest shelf of the North Atlantic.
This data would supplement current knowledge of seabird distribution in the waters of Ireland’s
Atlantic margin (e.g. Pollock et al. 1997; Mackey et al. 2004), and would be combined with the
results of seabird surveys carried out during the 2009 Cetaceans on the Frontier research cruise
which took place in August 2009. Thus, summer and winter seabird distributions may be
compared for this region.
As well as providing insights into the biology of particular seabird species, seabirds at sea data
can also shed light on how bird distribution relates to physical and biological aspects of the
marine ecosystem. Seabirds at sea data are key to identifying the requirements of marine birds
outside the breeding season (e.g. Ballance 2007) and marine areas requiring special protection.
Long-term data can indicate where changes in the marine environment are occurring (Cairns
1987; Croxall 1987; Monaghan 1996; Furness and Camphuysen 1997), for instance with regard

Cetaceans on the Frontier 2010 Page 5 18/05/2010
to pollution, fisheries practice, or climate change (González-Solis and Shaffer 2009; Grémillet and
Boulinier 2009).
1.5 Plankton and Oceanographic Survey
Due to recent intensive mapping work by the Irish National Seabed Survey, the location and
extent of many continental slope canyons in the Irish EEZ have become apparent. Studies in other
regions have demonstrated that similar canyons may affect the distribution or production of
phyto- and zooplankton (Allen et al. Can. J. Fish. Aquat. Sci. 58: 671–684, 2001). Such
concentrations may in turn lead to concentrations of predators such as fish and cetaceans. The
purpose of the present investigation was to determine if there was any evidence to suggest that
zoo- or phytoplankton was more concentrated near canyons along the slopes of the Porcupine
Bank, Porcupine Seabight or shelf edge and if any features in the physical oceanography of the
canyon systems would favour increased production or concentration of planktonic organisms.
Studies have shown that deep-water canyons and slopes, such as those to the west and southwest
of Ireland, may influence the abundance and distribution of phytoplankton and zooplankton (N.
Skliris et al, 2005). Such aggregations of plankton over these areas may also be linked to cetacean
activity along the shelf edge and in the region of canyons
The objective of the plankton study during this trip was to map the distribution of both
zooplankton and phytoplankton in relation to deep-sea canyons. In addition, in relation to
gelatinous zooplankton, the study aimed to determine the vertical distribution of various
gelatinous zooplankton species in deep water (>1000m).
Because the primary purpose of the cruise was to record the distribution of cetaceans using
visual and acoustic techniques, oceanographic work was conducted only after sunset.
The collection of underway sea surface temperature data will enable cetacean sightings to be
related to sea surface temperatures. Temperature is thought to be a significant factor affecting
the distribution of some cetacean species and concern has been raised as to the possible effects of
global warming on cetacean populations in northwest Europe (Learmonth et al., 2006).
1.6 Stable Isotope Analysis of Krill
Despite their widespread occurrence here, very little is known about the diet and migrations of
the six species of baleen whale in Irish waters. Such information is essential if Ireland is to fulfil
its legal conservation obligations for these species. To date, there has been no systematic analysis

Cetaceans on the Frontier 2010 Page 6 18/05/2010
of baleen whale diets in Irish waters by conventional methods due to the difficulty in obtaining
useable stomach samples.
Stable isotope analysis (SIA) can be used to obtain these data. Using SIA to infer trophodynamics
is based on the principle of preferential accumulation of heavier isotopes (δ15N, δ13C, δ18O)
over lighter ones (δ14N, δ12C, δ16O) due to differential excretion (called fractionation). Stable
isotopes, namely carbon, nitrogen and oxygen occur in all living organisms. These are derived
from diet and are incorporated into the tissues of a predator in a predictable manner. Stable
isotopes thus record faithfully the origin of diet in the predator via the lower trophic levels.
Nitrogen stable isotopes increase by 3‰ per trophic level and are therefore used to infer trophic
level in a predator. The carbon isotope is not enriched for each trophic level and is used to infer
the geographic location as it is thought to become more depleted with increasing latitude. Oxygen
isotopes are indicative of the temperature of the environment from which they were acquired.
Such is the complexity of the technique, that baseline stable isotope data are required from each
trophic level.
Current evidence suggests that Euphausiids comprise the primary consumer in the Fin Whale
food chain. The whales probably feed on them directly and indirectly (via Herring or sprat). Their
feeding habits may change depending on season. Analysis of skin/blubber biopsies and baleen
plates from fin and humpback whales is in progress.
1.7 Marine Megafauna Survey
In addition to visual sightings data on cetacean and bird species, it was planned to collect data on
the distribution of other marine megafauna, including sharks, seals, turtles and sunfish. Basking
shark and marine turtle sightings data are collected and held by the IWDG in an effort to map the
seasonal distribution of these species in Irish waters and to monitor their numbers. Offshore seal
sightings are collected on behalf of the National Parks and Wildlife Service (NPWS) in an effort to
help identify important offshore feeding areas for seals in Irish waters. Sunfish sightings are
collected for a project being run in the Coastal Marine Resources Centre at University College
Cork.
1.8 Deployment of ARGO Oceanographic Buoy
ARGO is an international collaboration that collects high-quality temperature and salinity profiles
from the upper 2000m of the ice-free global ocean and currents from intermediate depths. The
data come from battery-powered autonomous floats that spend most of their life drifting at depth
where they are stabilised by being neutrally buoyant at the "parking depth" pressure by having a
density equal to the ambient pressure and a compressibility that is less than that of sea water. At

Cetaceans on the Frontier 2010 Page 7 18/05/2010
typically 10-day intervals, the floats pump fluid into an external bladder and rise to the surface
over about 6 hours while measuring temperature and salinity. Satellites determine the position
of the floats when they surface, and receive the data transmitted by the floats. The bladder then
deflates and the float returns to its original density and sinks to drift until the cycle is repeated.
Floats are designed to make about 150 such cycles.

Cetaceans on the Frontier 2010 Page 8 18/05/2010
2 Methods
The survey was conducted on board the Marine Institute’s R.V. Celtic Explorer as a dedicated
survey between 18th February and 1st March 2010. The survey area covered waters over the
Porcupine Bank, Porcupine Seabight, Whittard Canyon System and Celtic Shelf. The survey track
was predominantly designed to target deep-water canyon and slope habitat (fig. 1).
Fig. 1 Survey transects (green line) for the 2010 Cetaceans on the Frontier research cruise. Orange areas
denote Special Areas of Conservation.
The survey transects cut across the Southwest Porcupine SAC and a permit to conduct research
within the SAC was applied for and granted by the National Parks and Wildlife Service of the
Department of the Environment.
The survey vessel travelled at an average speed of 8 knots while on transect, except in heavy
swell. The ship spent from 08:30 – 18:30 each day on visual and acoustic transect, and from
20:30 – 08:30 altered between steaming at 8 knots and being stationary while conducting CTDs,
water sampling and plankton hauls.
2.1 Visual Cetacean Survey
A double platform cetacean survey design, based on methods used during the SCANS II and CODA
surveys (Hammond & Macleod, 2006) was employed. The method was a combination of line-
transect distance sampling and mark-recapture methods. Three types of survey mode were used
Cetaceans on the Frontier 2010 Page 9 18/05/2010
during the survey. In sea states up to sea state 4, double platform survey mode was used. In sea
states of 5 and 6, single platform survey mode was employed. In sea states greater than 6, in
heavy rain, very reduced visibility or where conditions were unsafe for surveying from the
Monkey Island or Crow’s nest, a watch was kept from the bridge.
Sightings were identified to species level where possible, with species identifications being
graded as definite, probable or possible. Where species identification could not be confirmed,
sightings were downgraded (e.g. unidentified dolphin / unidentified whale / unidentified beaked
whale etc.) according to criteria established for the IWDG’s cetacean sightings database (IWDG
2009).
2.1.1 Double platform survey mode
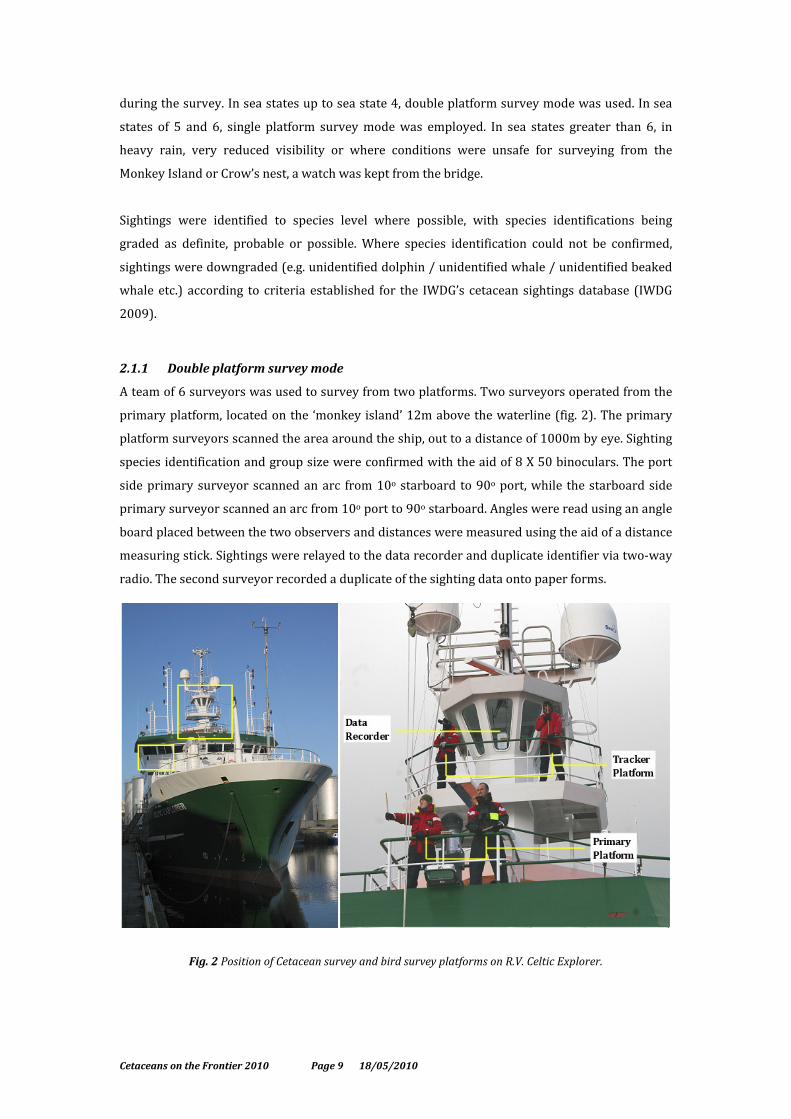
A team of 6 surveyors was used to survey from two platforms. Two surveyors operated from the
primary platform, located on the ‘monkey island’ 12m above the waterline (fig. 2). The primary
platform surveyors scanned the area around the ship, out to a distance of 1000m by eye. Sighting
species identification and group size were confirmed with the aid of 8 X 50 binoculars. The port
side primary surveyor scanned an arc from 10o starboard to 90o port, while the starboard side
primary surveyor scanned an arc from 10o port to 90o starboard. Angles were read using an angle
board placed between the two observers and distances were measured using the aid of a distance
measuring stick. Sightings were relayed to the data recorder and duplicate identifier via two-way
radio. The second surveyor recorded a duplicate of the sighting data onto paper forms.
Fig. 2 Position of Cetacean survey and bird survey platforms on R.V. Celtic Explorer.

Cetaceans on the Frontier 2010 Page 10 18/05/2010
Another two surveyors surveyed from the tracker platform, located on the ‘crows nest’ 17m
above the waterline (fig. 2). The tracker platform surveyors surveyed ahead of the ship (500m+)
in order to spot animals before they reacted to the presence of the ship and before the primary
platform surveyors spotted them. The port side tracker scanned an arc 60o to port and starboard
using 8 X 40 Opticron™ binoculars, while the starboard side tracker scanned an arc 40o to port
and starboard using 10X40 Zeiss™ binoculars. Angles were read using an angle board placed
between the two observers and distances were measured using the aid of a distance measuring
stick. Sightings were relayed to the data recorder via two-way radio. The duplicate identifier
recorded a duplicate of sighting data onto a paper form. The role of the trackers was to locate
animals at a distance from the ship and track them as they approached or passed by the vessel.
The data recorder was positioned on the crow’s nest deck within an enclosed survey platform
(fig. 2). The recorder logged details of primary and tracker platform sightings into an access
database using IFAW Logger 2000™ (IFAW, 2000). The data recorder also logged details of
observer rotations, waypoints and changes in environment every 30 minutes or as required.
The duplicate identifier was situated on the crow’s nest deck beside, and listening to, the
trackers. The duplicate identifier also received details of the primary platform sightings via a
two-way radio. The role of the duplicate identifier was to match sightings made by the primary
platform with those being tracked by the tracker platform. Sightings matched between the two
platforms were termed duplicates and were ranked as definite, probable, possible, remote or not
a duplicate.
Primary platform and tracker platform surveyors formed survey pairings, which remained
unchanged during the survey. Primary and tracker surveyors swapped from port to starboard
every 30 minutes while data recorder and duplicate identifier changed every hour. Primary and
tracker platform surveyors acted as data recorder and duplicate identifier in rotation.
2.1.2 Single platform survey mode
A team of 3 surveyors was used to survey using the primary platform. Two surveyors operated
from the primary platform, located on the ‘monkey island’ 12m above the waterline. The primary
platform surveyors scanned the area around the ship, out to a distance of 1000m by eye. Sighting
species identification and group size were confirmed with the aid of 8X50 binoculars. The port
side primary surveyor scanned an arc from 10o starboard to 90o port, while the starboard side
primary surveyor scanned an arc from 10o port to 90o starboard. Angles were read using an angle
board placed between the two observers and distances were measured using the aid of a distance
measuring stick. Sightings were relayed to the data recorder via two-way radio. The second
surveyor recorded a duplicate of the sighting data onto paper forms.
Cetaceans on the Frontier 2010 Page 11 18/05/2010
2.1.3 Bridge watch mode & auxiliary sightings
Two surveyors (either primary or tracker) kept a watch from the port and starboard wings of the
bridge for any animals in the vicinity of the ship. Sightings were logged onto paper forms and
were entered in the database as auxiliary sightings.
Sightings recorded at by other time by members of the ships or scientific crew were also entered
in the database as auxiliary sightings.
2.2 Acoustic Cetacean Survey
A number of projects to enable the acoustic detection of cetaceans within canyon systems and at
sea were conducted during the cruise.
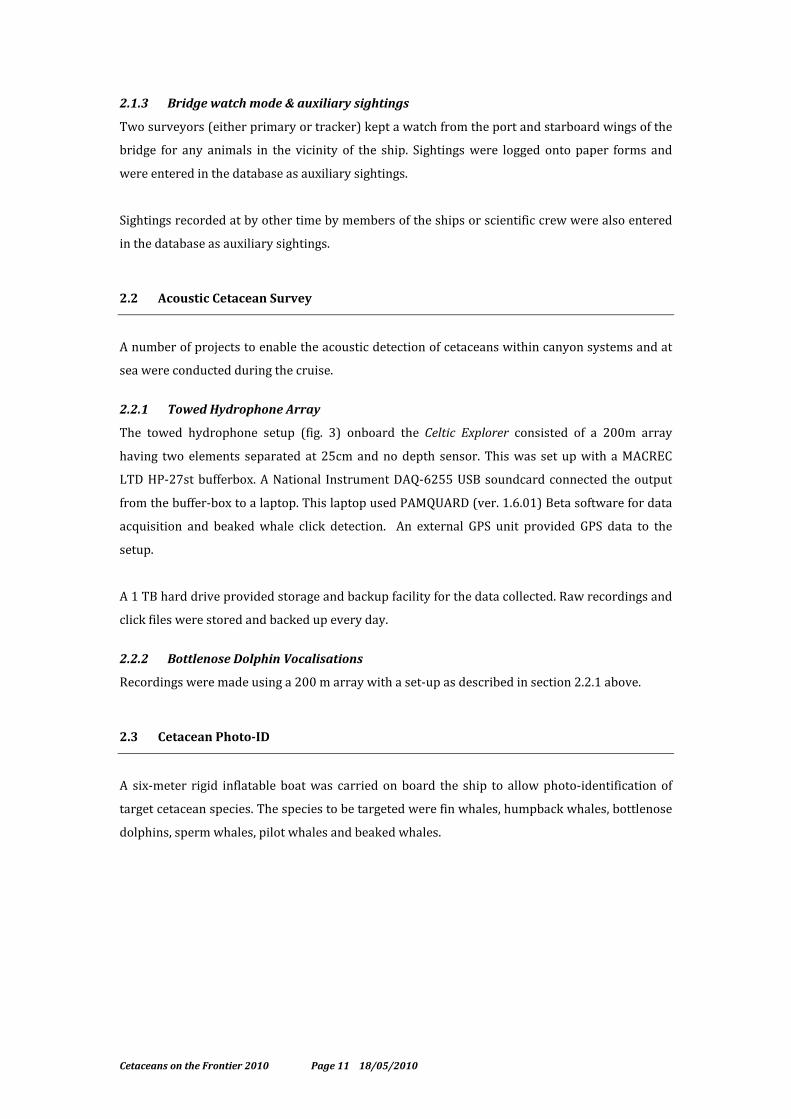
2.2.1 Towed Hydrophone Array
The towed hydrophone setup (fig. 3) onboard the Celtic Explorer consisted of a 200m array
having two elements separated at 25cm and no depth sensor. This was set up with a MACREC
LTD HP-27st bufferbox. A National Instrument DAQ-6255 USB soundcard connected the output
from the buffer-box to a laptop. This laptop used PAMQUARD (ver. 1.6.01) Beta software for data
acquisition and beaked whale click detection. An external GPS unit provided GPS data to the
setup.
A 1 TB hard drive provided storage and backup facility for the data collected. Raw recordings and
click files were stored and backed up every day.
2.2.2 Bottlenose Dolphin Vocalisations
Recordings were made using a 200 m array with a set-up as described in section 2.2.1 above.
2.3 Cetacean Photo-ID
A six-meter rigid inflatable boat was carried on board the ship to allow photo-identification of
target cetacean species. The species to be targeted were fin whales, humpback whales, bottlenose
dolphins, sperm whales, pilot whales and beaked whales.

Cetaceans on the Frontier 2010 Page 12 18/05/2010
Fig. 3 IWDG’s 6m RIB, Muc Mhara, being loaded on board the R.V. Celtic Explorer.
A number of Digital SLR cameras and telephoto zoom lenses were carried on board for the
purposes of obtaining photo-identification images of target cetacean species, should the
opportunity arise.
2.4 Visual Seabird Survey
Surveys of seabirds at sea were conducted from the R.V. Celtic Explorer between February 19th
and March 1st 2010. The ship spent from 08:30 to 18:45 each day on transect, during which the
average travel speed was 8 knots, except when heavy swell prohibited this (at which time
surveying also stopped). A standardised line transect method with sub-bands to allow correction
for species detection bias and ‘snapshots’ to account for flying birds was used (following
recommendations of Tasker et al., 1984; Komdeur, Bertelsen and Cracknell 1992; Camphuysen et
al. 2004), as outlined below.
Two observers (a primary observer and a primary recorder), in rotation from a pool of four
surveyors, were allocated to survey shifts of two hours, surveying from 08.30 to 18.00 hours
(dusk) each day. Environmental conditions, including wind force and direction, sea state, swell
height, visibility and cloud cover, and the ship’s speed and heading were noted at hourly intervals
during surveys. No surveys were conducted in conditions greater than sea state five, when high
swell made working on deck unsafe, or when visibility was reduced to less than 300m.

Cetaceans on the Frontier 2010 Page 13 18/05/2010
Fig. 4 Seabird primary observer and recorder surveying from the bridge deck of the R.V. Celtic Explorer
(©Maggie Hall). Binoculars were used to confirm species identification.
The seabird observation platform was the bridge deck, which is 10.5m above the waterline and
provided a good view of the survey area. The survey area was defined as a 300m wide band
operated on one side (in a 90˚ arc from the bow) and ahead of the ship. This survey band was
sub-divided (A = 0-50m from the ship, B = 50-100m, C = 100-200m, D = 200-300m, E > 300m) to
subsequently allow correction of species differences in detection probability with distance from
the observer. A fixed-interval range finder (Heinemann 1981) was used to periodically check
distance estimates. The area was scanned by eye, with binoculars used only to confirm species
identification. All birds seen within the survey area were counted, and those recorded on the
water noted as ‘in transect’. All flying birds within the survey area were also noted, but only those
recorded during a ‘snapshot’ were regarded as ‘in transect’. This method avoids overestimating
bird numbers in flight (Tasker et al. 1984). The frequency of the snapshot scan was ship-speed
dependent, such that they were timed to occur at the moment the ship passed from one survey
area to the next. Any bird recorded within the survey area that was regarded as being associated
with the survey vessel was noted as such (to be excluded from abundance and density
calculations). Survey time intervals were set at 5 minutes. Additional bird species observed
outside the survey area were also recorded and added to the species list for the research cruise,
but these will not be included in maps of seabird abundance or density.
2.5 Plankton and Oceanographic Survey
Zooplankton samples were collected using a 1m ring net with a mesh size of 280µ and another of
700µ. At each station a CTD profile was carried out on arrival. Following this the 1m ring net was
deployed to a maximum depth of 1000m and hauled at a rate of 2ms-1. A phytoplankton net was
also deployed to 50m at each station. At the Labadie Bank two zooplankton tows were carried
Cetaceans on the Frontier 2010 Page 14 18/05/2010
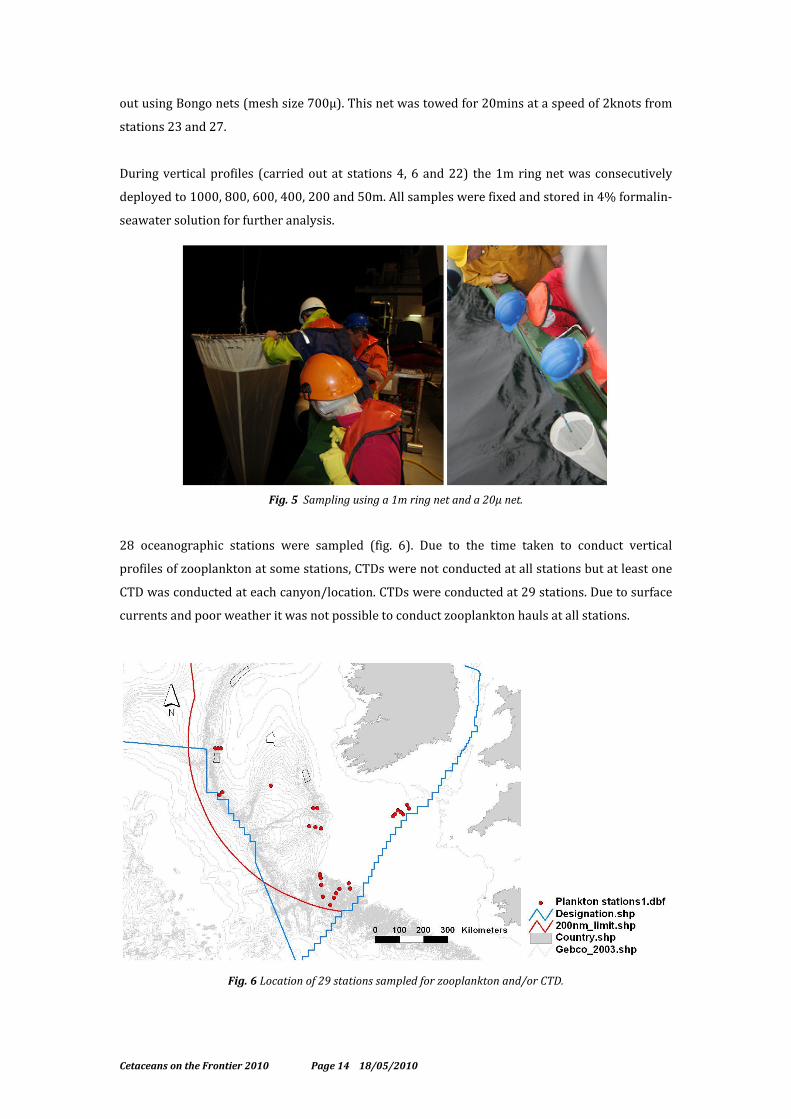
out using Bongo nets (mesh size 700µ). This net was towed for 20mins at a speed of 2knots from
stations 23 and 27.
During vertical profiles (carried out at stations 4, 6 and 22) the 1m ring net was consecutively
deployed to 1000, 800, 600, 400, 200 and 50m. All samples were fixed and stored in 4% formalin-
seawater solution for further analysis.
Fig. 5 Sampling using a 1m ring net and a 20µ net.
28 oceanographic stations were sampled (fig. 6). Due to the time taken to conduct vertical
profiles of zooplankton at some stations, CTDs were not conducted at all stations but at least one
CTD was conducted at each canyon/location. CTDs were conducted at 29 stations. Due to surface
currents and poor weather it was not possible to conduct zooplankton hauls at all stations.
Fig. 6 Location of 29 stations sampled for zooplankton and/or CTD.

Cetaceans on the Frontier 2010 Page 15 18/05/2010
Salinity, temperature and fluorescence were measured under way using the ship’s onboard
fluorometer and CTD. This data has been logged and will be used to construct maps of surface
distribution of these variables. Once a day pumped seawater from the ships non toxic supply was
filtered through a 20 µ net for 45 minutes to collect surface phytoplankton. The sample was
preserved using Lugol’s Iodine for examination on shore.
28 oceanographic stations were sampled (fig. 8), of these 14 were in or near canyon systems
along the southwest slopes of the Porcupine Bank, the east slopes of the Porcupine seabight and
the Whittard Canyon system. Eight stations were sampled for comparative purposes, one over
the Porcupine Seabight and seven over inter-canyon slopes in the Whittard Canyon System.
Another seven stations were conducted over along the Labadie Bank some 70nm south of the
Cork coast. At each station, temperature salinity, density and light transmission were measured
from in water depths from 200m – 3000m. Water samples were collected at some stations. These
samples were preserved in Lugol’s Iodine for cell counting on shore. Extensive surface data was
obtained on a 24 hour basis, including seas surface temperature.
The Simrad™ EK 60 echo sounder was turned on during CTD/Plankton work and when steaming
between plankton/oceanographic stations (it could not be used when hydrophones were
deployed due to acoustic interference with the hydrophone recordings). This gave an initial
estimate of zoo- and even phytoplankton density along the main axes of several canyon systems.
2.6 Stable Isotope Analysis of Krill
Vertical plankton hauls were made at various stations where high densities of Fin Whales are
known to occur. The complete water column was sampled using a 280μm (ø=100cm) plankton
net. Sampling was carried out at night when net-avoidance by larger zooplankton is thought to be
less problematic. Euphausiids (Meganyctiphanes norvegica, and Thysanoessa spp.) and Copepods
(Calanus spp.) were removed from the samples and stored at -20OC for stable isotope analysis.
Samples will be freeze-dried, ground to a powder, carbonates and lipids will be removed before
being analysed using a mass spectrometer.
2.7 Marine Megafauna Survey
Any marine megafauna data was collected during cetacean visual surveys, was collected using
methods as described in section 2.1 above.
Cetaceans on the Frontier 2010 Page 16 18/05/2010
2.8 Deployment of ARGO Oceanographic Buoy
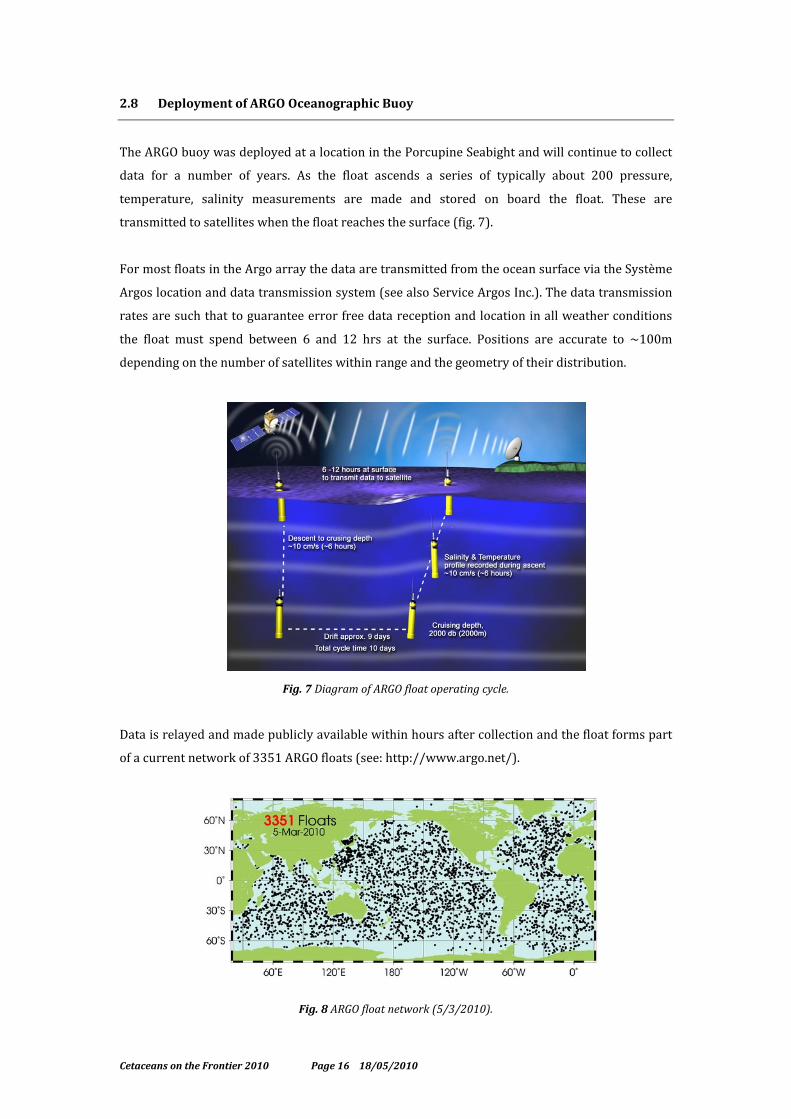
The ARGO buoy was deployed at a location in the Porcupine Seabight and will continue to collect
data for a number of years. As the float ascends a series of typically about 200 pressure,
temperature, salinity measurements are made and stored on board the float. These are
transmitted to satellites when the float reaches the surface (fig. 7).
For most floats in the Argo array the data are transmitted from the ocean surface via the Système
Argos location and data transmission system (see also Service Argos Inc.). The data transmission
rates are such that to guarantee error free data reception and location in all weather conditions
the float must spend between 6 and 12 hrs at the surface. Positions are accurate to ~100m
depending on the number of satellites within range and the geometry of their distribution.
Fig. 7 Diagram of ARGO float operating cycle.
Data is relayed and made publicly available within hours after collection and the float forms part
of a current network of 3351 ARGO floats (see: http://www.argo.net/).
Fig. 8 ARGO float network (5/3/2010).

Cetaceans on the Frontier 2010 Page 17 18/05/2010
3 Results
3.1 Environmental Conditions
Environmental data was collected at 231 stations. Sea state was ≤3 at 21.6% of environmental
stations, ≤4 at 60.2% of stations and ≤5 at 89.2% of stations. Visibility was >5km at 93.1% of
stations, 1–5km at 5.2% of stations and <1km at 1.7% of stations. Swell of 2m+ was recorded at
35.1% of stations. Rainfall was recorded at 11.3% of stations (fig. 11). One full visual survey day
and one half-day were lost due to due to bad weather (gales, dense fog or heavy rain).
Fig. 9: Sea state, swell conditions and wind speed recorded twice daily during the survey.
3.2 Visual Cetacean Survey
80.6hrs of on-effort survey time were logged with 20.7% (16.7hrs) of this at Beaufort sea state
three or less; 58.5% (47.15hrs) at Beaufort sea state four or less and 88.6% (71.4hrs) at Beaufort
sea state five or less. Additional time was spent watching from the bridge during poor weather,
however these data were considered off-effort and sightings from these watched were logged as
auxiliary sightings. 25.6hrs of double platform survey effort, 27.5hrs of single platform survey
effort and 27.5hrs of bridge watching were logged (fig. 10).
0
1
2
3
4
5
6
7
19
.02
.20
10
AM
20
.02
.20
10
AM
20
.02
.20
10
PM
21
.02
.20
10
AM
21
.02
.20
10
PM
22
.02
.20
10
AM
22
.02
.20
10
PM
24
.02
.20
10
AM
24
.02
.20
10
PM
25
.02
.20
10
AM
25
.02
.20
10
PM
26
.02
.20
10
AM
26
.02
.20
10
PM
27
.02
.20
10
AM
27
.02
.20
10
PM
28
.02
.20
10
AM
28
.02
.20
10
PM
SeaState (Beaufort)
Visibility (0-6)
Swell Height (0-3)

Cetaceans on the Frontier 2010 Page 18 18/05/2010
Fig. 10: Double, Single and bridge watch survey effort collected during the survey.
94 sightings of at least five cetacean species, totalling 750 individuals were recorded (figs. 13 –
18 show distribution and group sizes of sightings for each species).
Fig. 11 Bottlenose Dolphins Fig. 12 Common Dolphins
Cetaceans on the Frontier 2010 Page 19 18/05/2010
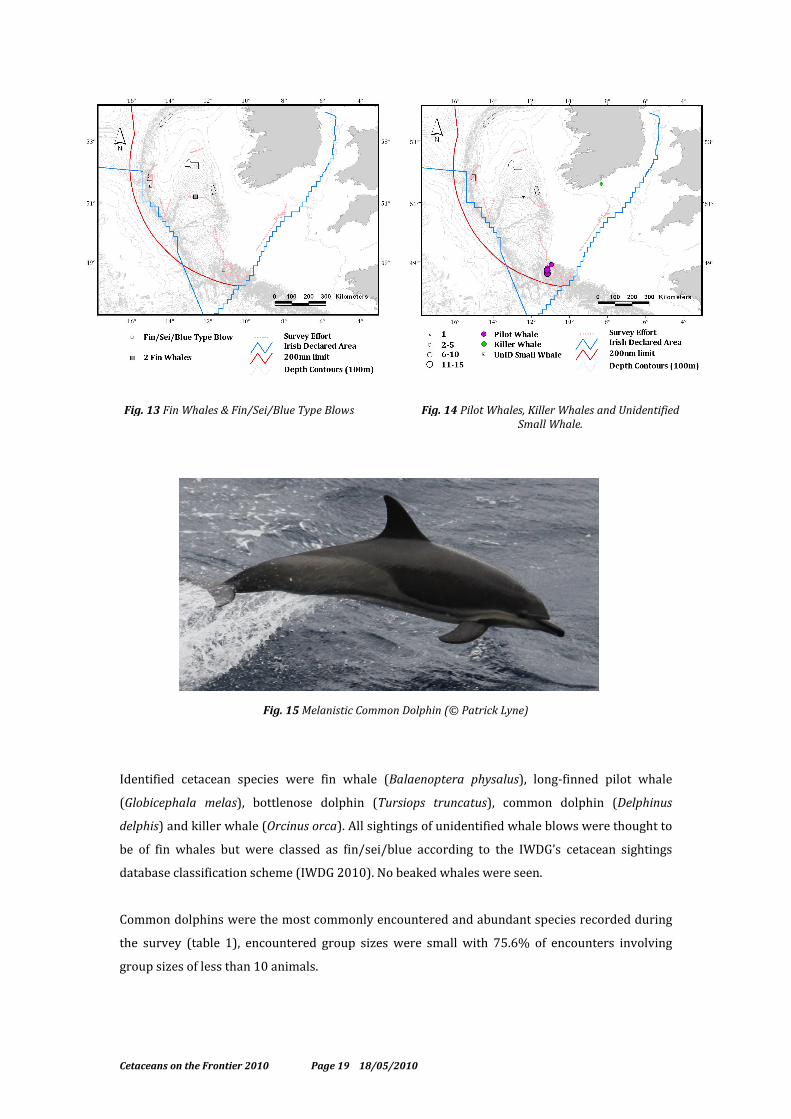
Fig. 15 Melanistic Common Dolphin (© Patrick Lyne)
Identified cetacean species were fin whale (Balaenoptera physalus), long-finned pilot whale
(Globicephala melas), bottlenose dolphin (Tursiops truncatus), common dolphin (Delphinus
delphis) and killer whale (Orcinus orca). All sightings of unidentified whale blows were thought to
be of fin whales but were classed as fin/sei/blue according to the IWDG’s cetacean sightings
database classification scheme (IWDG 2010). No beaked whales were seen.
Common dolphins were the most commonly encountered and abundant species recorded during
the survey (table 1), encountered group sizes were small with 75.6% of encounters involving
group sizes of less than 10 animals.
Fig. 13 Fin Whales & Fin/Sei/Blue Type Blows Fig. 14 Pilot Whales, Killer Whales and Unidentified Small Whale.

Cetaceans on the Frontier 2010 Page 20 18/05/2010
Table 1: Sightings, counts and group size ranges for cetaceans sighted during the survey.
Species
No. Sightings No. Individuals
Range of Group Size
Bottlenose dolphin 2 46 6 - 40
Common dolphin 82 649 1 - 50
Killer whale 1 2 -
Fin whale 1 2 -
Long-finned pilot whale 7 58 1 - 15
Fin/sei/blue (blows) 2 2 -
Unidentified cetacean 1 1 -
Unidentified dolphins 1 3 -
Unidentified small whale 1 1 -
A group of 35-40 bottlenose dolphins was encountered on the 24th February on the eastern
slopes of the Porcupine sea bight. The ship was diverted to approach the group, to confirm
species identification, obtain photo-identification images (see section 3.4) and record
vocalisations (see section 3.3.4). The group included at least two calves.
The majority of sightings were made over the Whittard Canyon system, with common dolphins
also being commonly encountered in small groups over the Celtic Shelf.
3.3 Acoustic Cetacean Survey
3.3.1 Towed Hydrophone Array
130.25 hours of recordings from the hydrophone array were collected. This data underwent
preliminary analysis, resulting in a total of 367 identified acoustic detection events involving at
least 4 species. As these results were based on a preliminary analysis of the data, changes in the
final dataset should be expected. From the acoustic data and associated visual sightings, 2
detection events were identified as bottlenose dolphins, 42 as common dolphins, 8 as long-finned
pilot whales, 18 as sperm whales, 91 as unidentified dolphin clicks and 206 as unidentified
dolphin whistles. The acoustic data will undergo further in depth analysis, which may reveal
more information on source species, number and duration of detection events. A copy of the
acoustic files was also sent to the Sea Mammal Research Unit in St. Andrew’s University in
Scotland where researchers are looking at the potential and problems in using towed
hydrophone arrays to monitor beaked whales.

Cetaceans on the Frontier 2010 Page 21 18/05/2010
Fig. 16 An example of whistle spectrogram recorded from a common dolphin acoustic detection event.
Sperm whales were the most commonly encountered acoustic detection events during the
survey. Sperm whales were encountered in the slopes and canyons of the southwest Porcupine
Bank and the eastern Porcupine Sea Bight. Pilot whales were encountered in canyons on the east
slopes of the Porcupine Sea Bight and the Whittard Canyon System (fig. 17).
Fig. 17 Distribution of acoustic detections of sperm whales and pilot whales recorded during the survey.

Cetaceans on the Frontier 2010 Page 22 18/05/2010
Fig. 18 Distribution of acoustic detections of common, bottlenose and unidentified dolphin species recorded
during the survey.
Dolphin acoustic detections were commonly recorded in slopes and canyon habitat along the
southern slopes of the Porcupine Bank, the Whittard Canyon and the eastern slopes of the
Porcupine Sea Bight (fig. 18). Dolphin detections were also common over the Celtic Shelf. Dolphin
whistle detections were almost continuously detected in some areas of the survey route, though
it is difficult to interpret how far away the vocalising animals were. Generally dolphin clicks
appeared to be only recorded when the animals were within a few hundred meters of the array.
3.3.2 Bottlenose Dolphin Vocalisations
Participation in the Cetaceans on the Frontier survey provided a valuable opportunity to sample
vocalisations of offshore bottlenose dolphins to compare with inshore recordings. Recordings
were successfully made during some of the encounters with bottlenose dolphins during the
survey cruise. Recordings were made using the 200m towed array, having a frequency range
between 2 kHz and 96kHz sampling at 96kHz, 24bit (48kHz effective bandwidth).

Cetaceans on the Frontier 2010 Page 23 18/05/2010
3.4 Cetacean Photo-ID
Due to weather conditions during the survey it was not possible to launch the IWDG RIB for use
in photo-identification on the days that bottlenose dolphins were encountered.
An encounter with a group of 40 bottlenose dolphins occurred on the slopes of the southwest
Porcupine Bank (fig. 11) on the 24th February 2010. During that encounter the ship approached
the group for the purposed of confirming species identification and at this time some of the group
approached the ship to bow ride. The interaction enabled the collection of photographic images
for the purpose of conducting photo-identification studies.
Following processing of these photographs, nine new bottlenose dolphin photo-identification
images were obtained (fig. 19). These images will be catalogued and available on the photo-
identification section of the IWDG website (www.iwdg.ie).
Fig.19 Photo-identification images obtained from a group of 40 bottlenose dolphins encountered on the 24th
February 2010.
Photo-identification images obtained during the encounter will be compared with existing
catalogues of bottlenose dolphin fins from Ireland and Europe to attempt to determine whether
these are part of an inshore population, a resident group (e.g. Shannon Estuary) or are from a
distinct population of offshore dolphins.
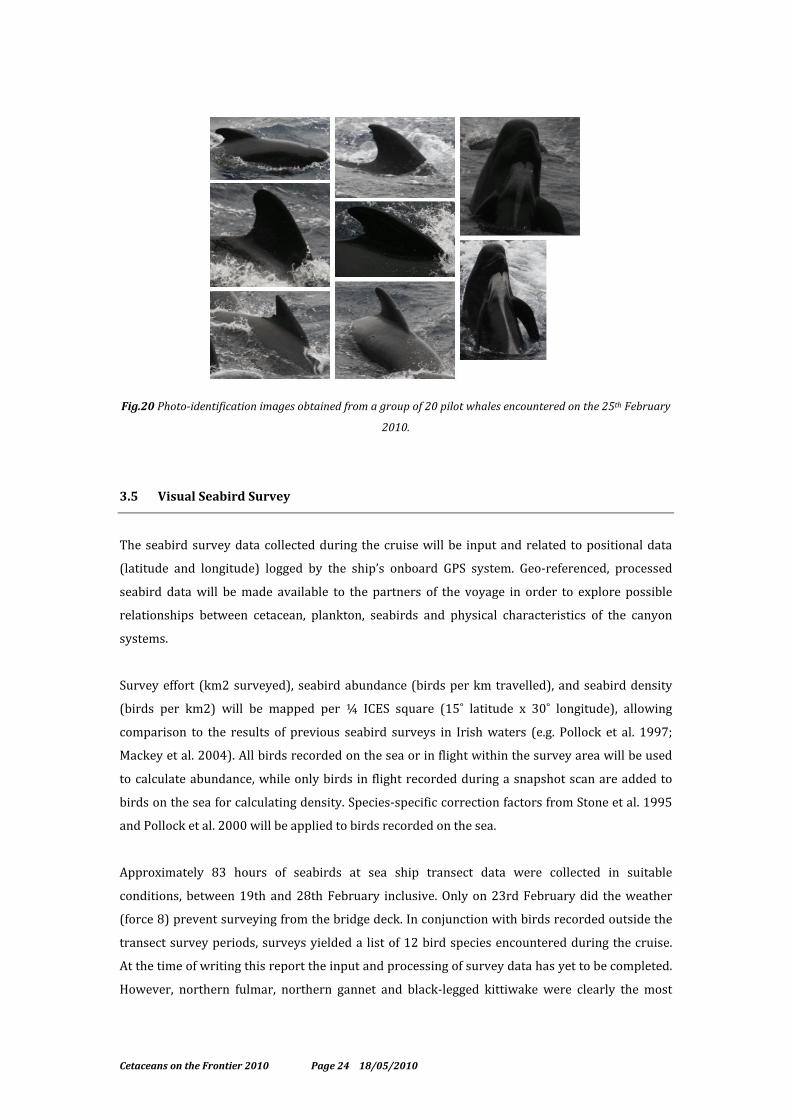
During an encounter with a group of 20 pilot whales on the 25th February 2010, eight photo-ID
images (fig. 20) of animals carrying identifying scars or breastplate patterns were collected.
These images will be catalogued and available on the photo-identification section of the IWDG
website (www.iwdg.ie).
Cetaceans on the Frontier 2010 Page 24 18/05/2010
Fig.20 Photo-identification images obtained from a group of 20 pilot whales encountered on the 25th February
2010.
3.5 Visual Seabird Survey
The seabird survey data collected during the cruise will be input and related to positional data
(latitude and longitude) logged by the ship’s onboard GPS system. Geo-referenced, processed
seabird data will be made available to the partners of the voyage in order to explore possible
relationships between cetacean, plankton, seabirds and physical characteristics of the canyon
systems.
Survey effort (km2 surveyed), seabird abundance (birds per km travelled), and seabird density
(birds per km2) will be mapped per ¼ ICES square (15˚ latitude x 30˚ longitude), allowing
comparison to the results of previous seabird surveys in Irish waters (e.g. Pollock et al. 1997;
Mackey et al. 2004). All birds recorded on the sea or in flight within the survey area will be used
to calculate abundance, while only birds in flight recorded during a snapshot scan are added to
birds on the sea for calculating density. Species-specific correction factors from Stone et al. 1995
and Pollock et al. 2000 will be applied to birds recorded on the sea.
Approximately 83 hours of seabirds at sea ship transect data were collected in suitable
conditions, between 19th and 28th February inclusive. Only on 23rd February did the weather
(force 8) prevent surveying from the bridge deck. In conjunction with birds recorded outside the
transect survey periods, surveys yielded a list of 12 bird species encountered during the cruise.
At the time of writing this report the input and processing of survey data has yet to be completed.
However, northern fulmar, northern gannet and black-legged kittiwake were clearly the most

Cetaceans on the Frontier 2010 Page 25 18/05/2010
abundant species encountered. A preliminary account of each bird species recorded during the
cruise follows.
Northern Fulmar (Fulmarus glacialis)
Fulmars were abundant (as expected: Mackey et al. (2004) found peak relative abundance of this
species occurred in February), and seen daily. However, their abundance did vary over the
course of the survey. Pollock et al. (1997) reported peak densities of fulmars from February to
March in areas with sudden changes in bathymetry, and it will be interesting to see whether our
results, once mapped, are consistent with this. The majority of fulmars we saw were light
morphs, but a dark morph was noted on 20th February (Fig. 21).
Fig. 21 Light and dark fulmar morphs were seen (© Maggie Hall).
Great Shearwater (Puffinus gravis)
Two great shearwaters were seen on the morning of 20th February, when we were over the
slopes of the Porcupine bank. This compares to a single bird of this species recorded in January in
ESAS data collected between 1980 and 1997 in the Atlantic west of Ireland (Pollock et al. 1997),
and none recorded in winter or spring during surveys of this area conducted between July 1999
and Sept. 2001 (Mackey et al. 2004). We were not expecting to see great shearwaters in the North
Atlantic at this time of year, as these summer migrants breed on islands in the South Atlantic.
Fig. 22 Great shearwater (© Dave Wall).

Cetaceans on the Frontier 2010 Page 26 18/05/2010
Sooty Shearwater (Puffinus griseus)
A single sooty shearwater was seen from the bridge on the morning of 21st February. At this time
we were over the south of the Porcupine bank. This bird was later observed being harassed by a
great skua.
Sooty shearwaters were only recorded in the Atlantic west of Ireland between May and
November by Mackey et al. (2004), and between July and October by Pollock et al. (1997).
Members of this species typically move out of the area in autumn, to breed in the southern
hemisphere. However, the waters west of Ireland are thought to be important as feeding grounds
for non-breeders (Warham 1996).
Fig. 23 Sooty shearwater (© Dave Wall).
European storm-petrel (Hydrobates pelagicus)
A single European storm-petrel was seen during the evening of 24th February (in the hours of
darkness), skimming over the surface of the water close to the plankton net as it was hauled in.
Pollock et al. (1997) report only nine storm petrels observed in Irish waters in December, and
none between January and April, but Mackey et al. (2004) recorded small numbers of this species
in March. Storm petrels winter off southern Africa and are typically summer visitors to the
waters around Ireland, with Inishtooskert, County Kerry thought to represent the world’s largest
breeding colony of this species (Mitchell et al. 2004).
Fig. 24 European storm petrel (© Dave Wall).

Cetaceans on the Frontier 2010 Page 27 18/05/2010
Northern gannet (Morus bassanus)
Gannets were seen daily. They were particularly abundant on the afternoon of February 22nd as
we surveyed across the Porcupine Seabight and down its eastern slopes, when they were seen
plunge-diving and sitting on the water “snorkelling”. Gannets were also noticeably more
numerous than fulmars on 24th February, as we tracked southwest across the Goban Spur,
skirting the shelf edge. We recorded 2nd-, 3rd- and 4th-winter birds, as well as adults throughout
the cruise.
This species breeds at a few, very large colonies in the North Atlantic (Wanless 1987), with
approx. 80% of the European population breeding in Ireland and Britain (Mead 2000). During the
winter months gannets are widely dispersed, some remaining in Irish waters while others
(particularly immature birds) migrate south as far as west Africa (Cramp et al. 1974; Lloyd et al.
1991), before beginning to return to breeding colonies in January (Pollock et al. 1997).
Fig. 25 Northern gannet flying above the R.V. Celtic Explorer (©Maggie Hall).
Great skua (Stercorarius skua)
At least one great skua was seen every day of the survey until 28th February, when they were
absent (at this stage we were tracking back north across the Celtic shelf towards inshore waters).
Four great skuas associated with the ship during bad weather on 23rd February. We observed
kleptoparasitic attacks by this species on northern gannets and a sooty shearwater.
Most great skuas present in the area in winter are likely to be adults, as immature birds are
thought to disperse further south (Furness 1987). In spring great skuas migrate north towards
their breeding colonies. Almost 60% of the NE Atlantic population breeds in Shetland and
Orkney, but a few pairs have recently been discovered breeding in west Ireland (Mitchell et al.
2004).

Cetaceans on the Frontier 2010 Page 28 18/05/2010
Fig. 26 Great skua (© Dave Wall).
Lesser black-backed gull (Larus fuscus)
Lesser black-backed gulls were not seen during the first four days of surveys, but once we
travelled further south were recorded daily between 23rd and 28th February, usually occurring
in small groups of three to five. During the bad weather on 23rd February larger numbers were
seen associating with the ship, as part of a mixed group with herring gulls that numbered ca. 40
birds in total. On 28th February larger groups (of ca. 20) were also seen.
Lesser black-backed gulls move north from their wintering grounds between mid-February and
early April (Hutchinson 1989), and are widely dispersed south of Ireland in spring (Pollock et al.
1997).
Great black-backed gull (Larus marinus)
Great black-backed gulls were recorded on the first day of surveying (19th February), and on
22nd, 23rd, 25th, 27th and 28th February (single birds or pairs). They are considered more
marine than lesser black-backed and herring gulls.
Fig. 27 Great black-backed gull (front) and Lesser black-backed gull (behind). (© Dave Wall).

Cetaceans on the Frontier 2010 Page 29 18/05/2010
Herring gull (Larus argentatus)
Herring gulls were recorded on 22nd, 23rd (with lesser black-backed gulls- see above), and daily
from 26th to 28th February, generally in small groups.
Pollock et al. (1997) recorded the highest numbers of herring gulls in winter (November to
February), but few were seen at this time southwest of Ireland.
Fig. 28 Herring gull. (© Dave Wall).
Black-legged kittiwake (Rissa tridactyla)
Kittiwakes were seen daily, often associating with the ship. A high proportion of these were 1st-
winter birds.
Pollock et al. (1997) recorded the highest density of kittiwakes in February and March, and
interestingly (like fulmars) high densities appeared to coincide with the steep slopes of the shelf
break (also Webb et al. 1990; Bloor et al. 1996). Mackey et al. (2004) also recorded a peak in
abundance in February.
Fig. 29 Black-legged kittiwake (© Maggie Hall)

Cetaceans on the Frontier 2010 Page 30 18/05/2010
Common guillemot (Uria aalge)
The first sighting of any auk species during this cruise was made as we tracked back north over
the Celtic shelf on 27th February, when four individuals were seen fleetingly during surveys. One
of these was identified as a common guillemot, but we were unable to confirm the identification
of the others to species level. Another guillemot was positively identified on 28th February, plus
two further “auks” (too distant for species identification).
Previous studies have found common guillemots to be virtually absent from deep offshore waters
(Mackey et al. 2004), although Pollock et al. (1997) report small numbers occurring along the
shelf break west of Ireland between October and February.
Atlantic puffin (Fratercula arctica)
Two puffins were recorded on 28th February, as we tracked north over the Celtic Shelf.
In winter puffins disperse widely, adopting a pelagic lifestyle. At this time they may feed more on
plankton than they do during the summer months (Harris 1984a, b), and may occur at low
densities in deep Atlantic waters (Pollock et al. 1997). However, in late winter they undergo a
complete body moult (mostly between January and March), before returning to their breeding
colonies (Harris and Yule 1977). This contrasts with other auk species which moult after the
breeding season. Pollock et al. (1997) recorded no puffins in February in the waters around
Ireland, but in March they appeared off the south coast at low density. Mackey et al. (2004)
recorded relatively low abundances in February.
3.6 Plankton & Oceanographic Survey
3.6.1 CTD Profiles
Results from the CTD indicated that the water both around canyons and on the shelf edge was
very well mixed with no visible thermocline until a depth of approximately 600m. The lowest
temperature recorded, 2.8°C, was within the canyons at 3000m. Surface temperatures increased
as the survey moved south with a maximum water temp of 11.6°C in the Whittard Canyon. See
Appendix I for CTD profiles at each station.

Cetaceans on the Frontier 2010 Page 31 18/05/2010
Fig. 30: Two deep water CTD’s. Left: Station 4; right: Station 16.
3.6.2 Phytoplankton
Initial results indicated very little phytoplankton in the water. This is consistent with existing
studies which indicate phytoplankton blooms as occurring during the warmer summer months.
An Simrad ER60 scientific echo sounder was used to assess plankton biomass in the water
column at each station and between night time stations (fig. 31).
Fig. 31: Simrad ER60 sounder image of typical distribution of plankton biomass in the water column, with very
little phytoplankton in the upper 200m and zooplankton biomass predominantly below 600m.
3.6.3 Zooplankton
Due to poor weather conditions and/or strong surface currents zooplankton samples could not
be taken at every station. A total of 31 zooplankton samples were collected.

Cetaceans on the Frontier 2010 Page 32 18/05/2010
Within the canyons there was no visible differences between the shallow and deep areas of the
canyons. The only distinction between such areas was the presence of deep-sea zooplankton in
deep hauls (>800m). Species such as the deep red jellyfish, Periphylla sp., and also red deepwater
crustaceans such as Gnathophausia sp. and Acanthephyra sp. among others were recorded at
these stations.
Fig. 32: A selection of specimens collected during the cruise. Clockwise from top left, Gnathophausia sp.,
pipefish, Acanthephyra sp., Aglantha digitale, Clio sp.
The vertical profiles carried out at stations 4, 6 and 22 illustrated the distribution of the
zooplankton within the water column. Chaetognaths, siphonophores, pteropods and
hydromedusae were observed in hauls between 800 and 1000m, but were rarely found in
shallower samples (above 600m). Small copepods, euphausiids and amphipods were present in
all samples however very little biomass was observed in hauls shallower than 200m. Pipefish
were also present at stations 6 and 7, approximately 15 individuals were recorded over 5 hauls.
The Labadie Bank area was notably different from the other sites surveyed. Here large numbers
of chaetognaths, amphipods and copepods were recorded. The hydromedusa, Aglantha digitale,
not previously observed, was present in all samples taken over the Labadie Bank. A number of
large euphausiids and the pelagic larval stage of the cushion star were also observed at all
stations on the bank.
Underway temperature, salinity and fluorescence data was collected during the trip and will be
obtained from the Marine Institute after the cruise. The sea surface temperature data will be
related to cetacean sightings and its effects on cetacean species distribution will be analysed as
part of ongoing work by the IWDG/GMIT and the University of Aberdeen.

Cetaceans on the Frontier 2010 Page 33 18/05/2010
3.7 Marine Megafauna Survey
No seals, turtles, sharks or sunfish were encountered during the survey.
3.8 Stable Isotope Analysis of Krill
Samples from the Labadie Bank and within 5nm of the southeast coast, where Fin and Humpback
whales were known to be feeding at that time (observed from shore by IWDG) were also taken.
Fin and blue whales (Wall et al., 2009) are believed to feed on high concentrations of krill along
the continental shelf edge of Ireland. These samples will provide a baseline stable isotope profile
for baleen whale prey in this region in order to test the hypothesis that whales are feeding
directly or indirectly on these species in Irish waters. The zooplankton samples obtained in this
survey will be used as a baseline in trophic modelling of baleen whale diets. These samples add
value to those collected in September 2009 from the R.V. Celtic Voyager from the Labadie Bank as
they will enable a comparison of Spring and Autumn samples to look for seasonal variability in
isotope signatures.
Fig. 32 Locations of plankton sampling stations for stable isotope analysis.
3.9 Deployment of ARGO Float
The ARGO float was deployed on the 22nd February in the Porcupine Seabight. By the
18/05/2010 the float had completed 10 recording cycles in 95 days since deployment (fig. 33).
The buoy will continue to gather data until its power supply runs down.

Cetaceans on the Frontier 2010 Page 34 18/05/2010
Fig. 33 ARGO float locations between 23/2/2010 and 14/5/2010.
Fig. 34 ARGO float being brought on deck for deployment over the Porcupine Seabight.
Cetaceans on the Frontier 2010 Page 35 18/05/2010
4 Acknowledgements
We would like to thank Captain Denis Rowan and the crew of the R.V. Celtic Explorer for their
help and professionalism during the course of this survey. To Aodhán Fitzgerald, Barry Kavanagh,
Carol Maloney and Bill Dwyer for their assistance during the planning of the survey.
Special thanks to Sheena Fennell for help in the preparation of a C-POD mooring. We are also
grateful to the staff of P&O Maritime Ireland for assistance during mobilisation and demob and to
Dr. Ian O’Connor, GMIT for assistance with equipment, planning and logistics.
Access to the R.V. Celtic Explorer was granted to IWDG/GMIT through the National Marine
Research Vessels Ship-Time Grant Aid Programme 2010, which is funded under the Science
Technology and Innovation Programme of National Development Plan 2007-2013
PReCAST is funded under the Sea Change strategy with the support of the Marine Institute and
the Marine Research Sub-Programme of the National Development Plan 2007–2013 (Grant Aid
Agreement No. PBA/ME/07/005 (02)).
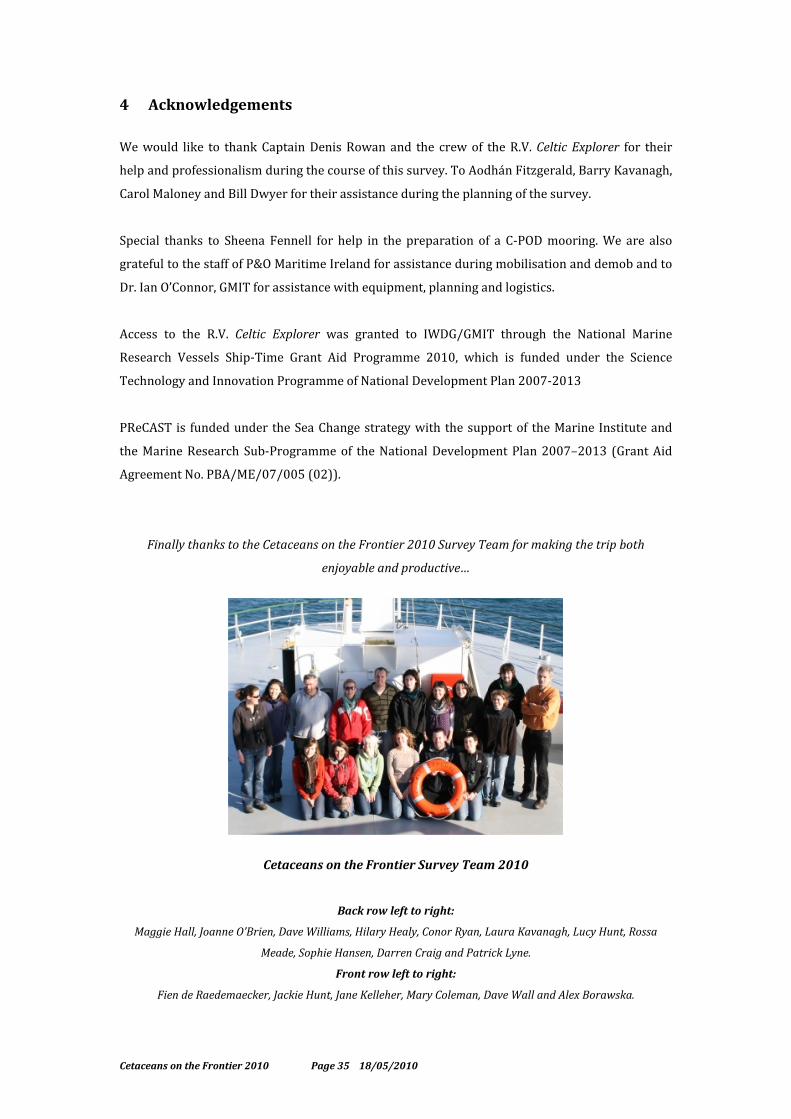
Finally thanks to the Cetaceans on the Frontier 2010 Survey Team for making the trip both
enjoyable and productive…
Cetaceans on the Frontier Survey Team 2010
Back row left to right:
Maggie Hall, Joanne O’Brien, Dave Williams, Hilary Healy, Conor Ryan, Laura Kavanagh, Lucy Hunt, Rossa
Meade, Sophie Hansen, Darren Craig and Patrick Lyne.
Front row left to right:
Fien de Raedemaecker, Jackie Hunt, Jane Kelleher, Mary Coleman, Dave Wall and Alex Borawska.

Cetaceans on the Frontier 2010 Page 36 18/05/2010
5 References
Azevedo, A.F. and Van Sluys, M. (2005)
Whistles of tucuxi dolphins (Sotalia fluviatilis) in
Brazil: comparisons among populations. Journal
of the Acoustical Society of America, 117: 1456-
1464.
Baker, M.C. (1987) Intergradation of song
between two subspecies of White-crowned
Sparrows on the west coast of North America.
Ornis Scandinavica, 18: 265-268.
Ballance, L.T. (2007) Understanding seabirds at
sea: why and how? Marine Ornithology 35: 127-
135.
Bazua-Duran, C. and Au, W.W.L. (2004)
Geographic variations in the whistles of spinner
dolphins (Stenella longirostris) of the Main
Hawai'ian Islands. Journal of the Acoustical
Society of America, 116: 3757-3769.
Beaman, M. (1994) Palearctic Birds. A Checklist
of the Birds of Europe, North Africa and Asia
North of the Foothills of the Himilayas. Harrier
Publications, Stonyhurst, England.
Berrow, S.D., Whooley, P. and Ferriss, S.
(2001) Irish Whale and Dolphin Group cetacean
sighting schemes: development of a system to
record sightings of cetaceans (whales, dolphins
and porpoises) in Irish waters. Final report to the
Heritage Council (Ireland), Kilkenny.
Best, P.B. and Schell, D.M. (1996) Stable
isotopes in southern right whale baleen as
indicators of seasonal movements, feeding and
growth. Marine Biology 124: 483-494.
Blomqvist, C. and Amundin, M. (2004) High-
frequency burst-pulse sounds in
agonistic/aggressive interaction in bottlenose
dolphins, Tursiops truncatus, Echolocation in Bats
and Dolphins. The University of Chicago Press,
Chicago, pp. 425-431.
Bloor, P.D., Reid, J.B., Webb, A., Begg, G. and
Tasker, M.L. (1996) The distribution of seabirds
and cetaceans between Shetland and the Faroe
Islands. JNCC Report, No. 226.
Born, E.W., Outridge, P., Riget, F.F., Hobson,
K.A., Dietz, R., Oien, N. and Haug, T. (2003)
Population substructure of North Atlantic minke
whales (Balaenoptera acutorostrata) inferred
from regional variation of elemental and stable
isotopic signatures in tissues. Journal of Marine
Systems 43: 1-17.
Cairns, D.K. (1987) Seabirds as indicators of
marine food supplies. Biological Oceanography 5:
261-271.
Camphuysen C.J, Fox A.D, Leopold M.F. &
Petersen I.K. (2004) Towards standardised
seabirds at sea census techniques in connection
with environmental impact assessments for
offshore wind farms in the U.K. Report
commissioned by COWRIE. Royal Netherlands
Institute for Sea Research.
Cramp, S., Bourne, W.R.P. and Saunders, D.
(1974) The seabirds of Britain and Ireland.
Collins, London. 287 pp.
Croxall, J.P. (1987) Conclusions. In: Croxall, J.P.
(ed.) Seabirds feeding ecology and role in marine
ecosystems. Cambridge University Press.
Deecke, V.B. and Janik, V.M. (2005) Automated
categorization of bioacoustic signals: Avoiding
perceptual pitfalls. Journal of the Acoustical
Society of America, 119(1): 645-653.
Cetaceans on the Frontier 2010 Page 1 18/05/2010
Ford, J.K.B. (2002) Dialects. In: W.F. Perrin, B.
Würsig and J.G.M. Thewissen (Editors),
Encyclopedia of marine mammals. Academic
Press, San Diego, California.
Furness, R.W. (1987) The skuas. T & A D Poyser,
Calton.
Furness, R.W. and Camphuysen, Kees (C.J.)
(1997) Seabirds as monitors of the marine
environment. ICES Journal of Marine Science 54:
726-737.
González-Solis, J. and Shaffer, S.A. (2009)
Introduction and synthesis: spatial ecology of
seabirds at sea. Marine Ecology Progress Series
391: 117-120.
Grémillet, D. and Boulinier, T. (2009) Spatial
ecology and conservation of seabirds facing
global climate change: a review. Marine Ecology
Progress Series 391: 121-137.
Hammond P. and Macleod K. (2006) Progress
report on the SCANS II project. ASCOBANS
Committee, Finland, April 2006.
Harris, M.P. (1984a) The puffin. T & A D Poyser,
Calton.
Harris, M.P. (1984b) Movement and mortality
patterns of north Atlantic puffins as shown by
ringing. Bird Study 31: 131-140.
Harris, M.P. and Yule, R.F. (1977) The moult of
the puffin Fratercula arctica. Ibis 119: 535-541.
Heinemann, D. (1981) A Range Finder for
Pelagic Bird Censusing. Journal of Wildlife
Management 45(2): 489-493.
Hutchinson, C.D. (1989) Birds in Ireland. T & A
D Poyser, Calton.
IFAW (2000) Logger 2000 software. Inter-
national Fund for Animal Welfare, London.
IWDG (2009) IWDG Cetacean Sightings
Database (Rep. Ireland & Northern Ireland).
http://www.iwdg.ie/Iscope/
Janik, V.M., Sayigh, L.S. and Wells, R.S. (2006)
Signature Whistle Shape Conveys Identity
Information to Bottlenose Dolphins. Proceedings
of the National Academy of Sciences of the United
States of America, 103(21): 8293-8297.
Komdeur J., Bertelsen J. & Cracknell G. (eds)
(1992) Manual for Aeroplane and Ship Surveys
of Waterfowl and Seabirds. IWRB Special Publ.
No. 19, National Environmental Research Institute
Kalø.
Learmonth J.A., Macleod C.D., Santos M.B.,
Pierce G.J., Crick H.Q.P. and Robinson R.A.
(2006) Potential effects of climate change on
marine mammals. Oceanography and Marine
Biology: An Annual Review, 44, 431-464.
Lloyd, C., Tasker, M.L. and Partridge, K.
(1991) The status of seabirds in Britain and
Ireland. T & A D Poyser, London. 355pp.
Mackey, M., Ó Cadhla, O., Kelly, T.C., Aguilar de
Soto, N. and Connolly, N. (2004) Cetaceans and
Seabirds of Ireland’s Atlantic Margin. Volume I-
Seabird distribution, density & abundance.
Report on research carried out under the Irish
infrastructure Programme (PIP): Rockall Studies
Group (RSG) projects 98/6 and 00/13, Porcupine
Studies Group project P00/15 and Offshore
Support Group (OSG) project 99/38.
MacLeod C. D. (2005) Niche Partitioning,
Distribution And Competition In North Atlantic
Beaked Whales. Unpublished Thesis, School of
Biological Sciences, University of Aberdeen,
Aberdeen,UK. 259pp.
Cetaceans on the Frontier 2010 Page 2 18/05/2010
Mead, C. (2000) The state of the nation’s birds.
Whittet Books Ltd., Suffolk. 285pp.
Mitchell, P.I., Newton, S.F., Ratcluiffe, N. and
Dunn, T.E. (2004) Seabird Populations of Britain
and Ireland. Results of the Seabird 2000 Census
(1998-2002). T & A D Poyser, London.
Monaghan, P. (1996) Relevance of the
behaviour of seabirds to the conservation of
marine environments. Oikos 77: 227-237.
Morisaka, T., Shinohara, M., Nakahara, F. and
Akamatsu, T. (2005) Effects of Ambient Noise
on the Whistles of Indo-Pacific Bottlenose
Dolphin Populations. Journal of Mammalogy,
86(3): 541-546.
Morisaka, T., Shinohara, M., Nakahara, F. and
Akamatsu, T. (2005b) Geographic variations in
the whistles among three Indo-Pacific bottlenose
dolphin Tursiops aduncus populations in Japan.
Fisheries Science, 71: 568-576.
NPWS (2008) The Status of EU Protected
Habitats and Species in Ireland. Report by
National Parks and Wildlife Service Department of
the Environment, Heritage and Local Government,
7 Ely Place, Dublin 2. 135pp.
Ó Cadhla, O., Mackey, M., Aguilar de Soto, N.,
Rogan, E. & Connolly, N. (2004). Cetaceans and
Seabirds of Ireland’s Atlantic Margin. Volume II –
Cetacean distribution & abundance. Report on
research carried out under the Irish Infrastructure
Programme (PIP): Rockall Studies Group (RSG)
projects 98/6 and 00/13, Porcupine Studies Group
project P00/15 and Offshore Support Group (OSG)
project 99/38. 82pp.
Pollock, C.M., Reid, J.B., Webb, A. and Tasker, M.L.
(1997) The distribution of seabirds and
cetaceans in the waters around Ireland. JNCC
Report No. 267, JNCC, Peterborough.
Pollock, C.M., Mavor, R., Weir, C.R., Reid, A.,
White, R.W., Tasker, M.L., Webb, A. & Reid, J.B.
(2000) The distribution of seabirds and marine
mammals in the Atlantic Frontier, north and west
of Scotland. JNCC. Peterborough. 92pp.
Rendell, L.E., Matthews, J.N., Gill, A., Gordon,
J.C.D. and Macdonald, D.W. (1999) Quantiative
analysis of tonal calls from five odontocete
species, examining interspecific and intraspecific
variation. Journal of Zoology, 249: 403-410.
Rogan, E. and Berrow, S.D. (1995) The
management of Irish waters as a whale and
dolphin sanctuary. In A.S. Blix, L. Walløe and Ø.
Ulltang (eds), Whales, seals, fish and man, 671..81.
Amsterdam. Elsevier Science.
Stone, C.J., Webb, C., Barton, C., Ratcliffe, N.,
Reed, T.C., Tasker, M.L., Camphuysen, C.J. &
Pienkowski, M.W. (1995) An atlas of seabird
distribution in northwest European waters. JNCC.
Peterborough. 326pp.
Tasker M.L., Jones P.H., Dixon T.J. & Blake B.F.
(1984) Counting seabirds at sea from ships: a
review of methods employed and a suggestion
for a standardized approach. Auk 101: 567-577.
Tyack, P. (1986) Whistle Repertoires of Two
Bottlenosed Dolphins, Tursiops Truncatus:
Mimicry of Signature Whistles? Behavioral
Ecology and Sociobiology, 18(4): 251-257.
Wall D. (2006) Irish Cetacean Genetic Tissue
Bank. Final Report to the Heritage Council of
Ireland. Project reference 14762.
Wall D., O’Brien J., Meade J. & Allen B.M.
(2006) Summer distribution and relative
abundance of cetaceans off the west coast of

Cetaceans on the Frontier 2010 Page 3 18/05/2010
Ireland. Biology and Environment: Proceedings of
the Royal Irish Academy, 106B (2), 135 - 142.
Wall D., O’Kelly I., Whooley P. and Tyndall P.
(2009) New records of blue whales
(Balaenoptera musculus) with evidence of
possible feeding behaviour from the continental
shelf slopes to the west of Ireland. Marine
Biodiversity Records, Vol. 2; e128; 2009.
Wall D. et al. (2009) Cetaceans on the Frontier
Survey 2009. Cruise report to the Marine Institute,
Oranmore, Galway, Ireland.
Wanless, S. (1987) A survey of the numbers and
breeding distribution of the North Atlantic
gannet Sula bassana and an assessment of the
changes which have occurred since Operation
Seafarer 1969/70. Peterborough, Nature
Conservancy Council (Research and survey in
nature conservation No. 4).
Warham, J. (1996) The behaviour, population
biology and physiology of the petrels. London,
Academic Press.
Webb, A., Harrison, N., Leaper, G., Steele, R.D.,
Tasker, M.L. and Pienkowski, M.W. (1990)
Seabird distribution west of Britain. Nature
Conservancy Council, Peterborough.
Weilgart, L. and Whitehead, H. (1997) Group-
specific dialects and geographical variation in
coda repertoire in South Pacific sperm whales.
Behavioral Ecology and Sociobiology, 40(5): 277-
285.
Cetaceans on the Frontier 2010 Page 1 18/05/2010
6 Previous Survey Reports
O’Brien J. (2010) Cetacean Distribution and
Relative Abundance Survey during the Marine
Institute Oceanographic Survey 2010. Report to
the Marine Institute, Oranmore, Galway, Ireland.
Wall D. (2010) Cetacean Distribution and
Relative Abundance Survey during the LE Roisín
& LE Niamh January Patrol 2010. Cruise Report to
Irish Naval Service, Haulbowline, Cork, Ireland.
Wall D. (2009) Cetacean Distribution and
Relative Abundance Survey during FSS
Deepwater Survey 2009. Report to the Marine
Institute, Oranmore, Galway, Ireland.
O’Brien J. (2009) Cetacean Distribution and
Relative Abundance Survey during FSS
Groundfish Survey 2009. Report to the Marine
Institute, Oranmore, Galway, Ireland.
Wall D. (2009) Cetacean Distribution and
Relative Abundance Survey during FSS
Southwest Herring Acoustic Survey 2009. Report
to the Marine Institute, Oranmore, Galway,
Ireland.
Wall D. and O’Brien J. (2009) Cetacean
Distribution and Relative Abundance Survey
during the NPWS Geogenic Reef Habitat Mapping
Survey 2009. Cruise Report to the National Parks
and Wildlife Service, 7 Ely Place, Dublin 2.
Murray C. (2009) Cetacean Distribution and
Relative Abundance Survey during the AFBI
Autumn Herring Acoustic Survey 2009. Cruise
Report to the Agriculture, Food and Biosciences
Institute, Belfast.
Wall D. et al. (2009) Cetaceans on the Frontier
Survey 2009. Cruise report to the Marine Institute,
Oranmore, Galway, Ireland.
Murray C. (2009) Cetacean Distribution and
Relative Abundance Survey during the AFBI
Biological Oceanography Survey 2009. Cruise
Report to the Agriculture, Food and Biosciences
Institute, Belfast.
Murray C. (2009) Cetacean Distribution and
Relative Abundance Survey during the AFBI
Nephrops Survey 2009. Cruise Report to the
Agriculture, Food and Biosciences Institute,
Belfast.
Murray C. (2009) Cetacean Distribution and
Relative Abundance Survey during the AFBI
Summer Herring Acoustic Survey 2009. Cruise
Report to the Agriculture, Food and Biosciences
Institute, Belfast.
Kavanagh L. (2009) Cetacean Distribution and
Relative Abundance Survey during FSS
Northwest Herring Acoustic Survey 2009. Cruise
Report to the Marine Institute, Oranmore, Galway,
Ireland.
Wall D. (2009) Cetacean Distribution and
Relative Abundance Survey during the NUI
Galway, Climate Change Survey 2009. Cruise
Report to National University of Ireland, Galway,
Ireland.
Murray C. (2009) Cetacean Distribution and
Relative Abundance Survey during the AFBI
Juvenile Gadoid Survey 2009. Cruise Report to the
Agriculture, Food and Biosciences Institute,
Belfast.
Wall D. (2009) Cetacean Distribution and
Relative Abundance Survey during the NUI
Galway, Coralfish Survey 2009. Cruise Report to
National University of Ireland, Galway, Ireland.

Cetaceans on the Frontier 2010 Page 1 18/05/2010
Wall D. (2009) Cetacean Distribution and
Relative Abundance Survey during the LE Emer
April Patrol 2009. Cruise Report to Irish Naval
Service, Haulbowline, Cork, Ireland.
O’Brien J. (2009) Cetacean Distribution and
Relative Abundance Survey during the Tridens
Blue Whiting Survey 2009. Report to the Dutch
Ministry of Agriculture, Nature and Food Quality
(LNV), Den Haag, The Netherlands.
Murray C. (2009) Cetacean Distribution and
Relative Abundance Survey during the AFBI
Groundfish Survey 2009. Report to the
Agriculture, Food and Biosciences Institute,
Belfast.
Wall D. (2009) Cetacean Distribution and
Relative Abundance Survey during the Marine
Institute Oceanographic Survey 2009. Report to
the Marine Institute, Oranmore, Galway, Ireland.
Tuffy P. (2009) Cetacean Distribution and
Relative Abundance Survey during AFBI Gadoid
Survey 2009. Report to the Agriculture, Food and
Biosciences Institute, Belfast.
Murray C. (2009) Cetacean Distribution and
Relative Abundance Survey during the Marine
Institute Nutrient Survey 2009. Report to the
Marine Institute, Oranmore, Galway, Ireland.
Wall D. (2009) Cetacean Distribution and
Relative Abundance Survey during the LE Niamh
January Patrol 2009. Report to Irish Naval Service,
Haulbowline, Cork, Ireland.
Wall D. (2008) Cetacean Distribution and
Relative Abundance Survey during the LE Róisín
December Patrol 2008. Report to Irish Naval
Service, Haulbowline, Cork, Ireland.
Tuffy P. (2008) Cetacean Distribution and
Relative Abundance Survey during IFREMER
Groundfish Survey 2008. Report to the French
Institute for the Exploitation of the Sea.
Murray C. (2008) Cetacean Distribution and
Relative Abundance Survey during CEFAS
Groundfish Survey 2008. Report to the Centre for
Environment, Food and Agriculture Sciences,
Suffolk, England.
Tuffy P. (2008) Cetacean Distribution and
Relative Abundance Survey during AFBI
Groundfish Survey 2008. Report to the
Agriculture, Food and Biosciences Institute,
Belfast.
Wall D. (2008) Cetacean Distribution and
Relative Abundance Survey during FSS
Southwest Herring Acoustic Survey 2008. Report
to the Marine Institute, Oranmore, Galway,
Ireland.
Wall D. (2008) Cetacean Distribution and
Relative Abundance Survey during FSS Deep
Water Survey 2008. Report to the Marine
Institute, Oranmore, Galway, Ireland.
Murray C. (2008) Cetacean Distribution and
Relative Abundance Survey during AFBI
Nephrops Assessment Survey 2008. Report to the
Agri-Food and Biosciences Institute, Northern
Ireland.
Wall D. (2008) Cetacean Distribution and
Relative Abundance Survey during NIOZ Cold
Water Coral Fish Survey 2008. Report to the
Royal Netherlands Institute for Sea Research and
the Marine Institute, Oranmore, Galway, Ireland.
Wall D. (2008) Cetacean Distribution and
Relative Abundance Survey during FSS Blue
Whiting Acoustic Survey 2008. Report to the
Marine Institute, Oranmore, Galway, Ireland.

Cetaceans on the Frontier 2010 Page 2 18/05/2010
Baer J. (2008) Cetacean Distribution and
Relative Abundance Survey during CEFAS Irish
Sea Plankton Survey 2008. Report to the Centre
for Environment, Fisheries & Aquaculture Science
and the Marine Institute, Oranmore, Galway,
Ireland.
Wall D. (2007) Cetacean Distribution and
Relative Abundance Survey during FSS
Southwest Herring Acoustic Survey 2007. Report
to the Marine Institute, Oranmore, Galway,
Ireland.
Wall D. (2007) Cetacean Distribution and
Relative Abundance Survey during FSS Deep
Water Survey 2007. Report to the Marine
Institute, Oranmore, Galway, Ireland.
Wall D. (2007) Cetacean Distribution and
Relative Abundance Survey during NIOZ Canyons
Survey 2007. Report to the Royal Netherlands
Institute for Sea Research and the Marine
Institute, Oranmore, Galway, Ireland.
Wall D. (2007) Cetacean Distribution and
Relative Abundance Survey during Rockall
Trough Oceanographic Survey 2007. Report to
the Marine Institute, Oranmore, Galway, Ireland.
Wall D. (2007) Cetacean Distribution and
Relative Abundance Survey during FSS
Northwest Herring Acoustic Survey 2007. Report
to the Marine Institute, Oranmore, Galway,
Ireland.
Wall D. (2006) Cetacean Distribution and
Relative Abundance Survey during FSS
Southwest Herring Acoustic Survey 2006. Report
to the Marine Institute, Oranmore, Galway,
Ireland.
Wall D. (2006) Cetacean Distribution and
Relative Abundance Survey during FSS Deep
Water Survey 2006. Report to the Marine
Institute, Oranmore, Galway, Ireland.
Wall D. (2005) Cetacean Distribution and
Relative Abundance Survey during FSS
Southwest Herring Acoustic Survey 2005. Report
to the Marine Institute, Oranmore, Galway,
Ireland.
Wall D. (2005) Cetacean Distribution and
Relative Abundance Survey during Irish Seabed
Survey: Leg 17. Report to the Marine Institute,
Oranmore, Galway, Ireland.
Wall D., O’Brien J., Meade J. & Allen B.M.
(2004) Summer Distribution and Relative
Abundance of Cetaceans off the West Coast of
Ireland. Final report to the Heritage Council,
Kilkenny, Ireland.
O’Brien J. (2004) Cetacean Distribution and
Relative Abundance Survey during FSS
Northwest Herring Acoustic Survey 2004. Report
to the Marine Institute, Oranmore, Galway,
Ireland.
O’Brien J. (2004) Cetacean Distribution and
Relative Abundance Survey during FSS Blue
Whiting Survey 2004. Report to the Marine
Institute, Oranmore, Galway, Ireland.
Wall D. (2004) Cetacean Distribution and
Relative Abundance Survey during the Celtic Sea
Herring Acoustic Survey 2004. Report to the
Marine Institute, Oranmore, Galway, Ireland.

Cetaceans on the Frontier 2010 Page 1 18/05/2010
Appendix II: List of cetacean species recorded within the Irish EEZ and
adjacent waters.
Atlantic White-Sided Dolphin Lagenorhynchus acutus
Beluga Delphinapterus leucas†
Blue Whale Balaenoptera musculus
Bottlenose Dolphin Tursiops truncatus
Common Dolphin Delphinus delphis
Cuvier's Beaked Whale Ziphius cavirostris
False Killer Whale Pseudorca crassidens
Fin Whale Balaenoptera physalus
Gervais’ Beaked Whale Mesoplodon europaeus*
Harbour Porpoise Phocoena phocoena
Humpback Whale Megaptera novaeangliae
Killer Whale Orcinus orca
Minke Whale Balaenoptera acutorostrata
Northern Bottlenose Whale Hyperoodon ampullatus
Northern Right Whale Eubalaena glacialis
Pilot Whale (long-finned) Globicephala melas
Pygmy Sperm Whale Kogia breviceps
Risso's Dolphin Grampus griseus
Sei Whale Balaenoptera borealis
Sowerby's Beaked Whale Mesplodon bidens
Sperm Whale Physeter macrocephalus
Striped Dolphin Stenella coeruleoalba
True's Beaked Whale Mesplodon mirus
White-Beaked Dolphin Lagenorhynchus albirostris
† Vagrant * Recorded only from Stranding