2010 annual results
DESCRIPTION
2010 Annual ResultsTRANSCRIPT

1 PENGROWTH 2010 Financial Results
PENGROWTH ENERGY CORPORATION
2010 Annual Results

Operating Measures Years ended December 31 2010 2009 2008 2007 2006
PRODUCTION Crude Oil (bbl per day) 21,743 22,841 24,416 26,327 21,821 Heavy Oil (bbl per day) 6,789 7,551 8,122 7,168 4,964 Natural Gas (mcf per day) 219,302 237,217 240,825 266,980 175,578 Natural gas liquids (bbl per day) 9,611 9,590 9,315 9,409 6,774 Total (boe per day) 74,693 79,518 81,991 87,401 62,821 Annual (mmboe) 27.3 29.0 30.0 31.9 22.9 % natural gas 49 50 49 51 47
BENCHMARK PRICES WTI (U.S. per bbl) 79.61 62.09 99.75 72.36 66.25NYMEX (U.S. per mmbtu) 4.38 4.16 8.90 7.12 6.98AECO (Cdn $ per mmbtu) 3.99 3.99 8.19 6.46 6.53Currency (U.S. $ per Cdn $) 0.97 0.88 0.94 0.93 0.88
AVERAGE REALIZED PRICES Crude Oil ($ per bbl) 75.04 72.36 77.78 71.88 66.85Heavy Oil ($ per bbl) 60.22 52.72 75.77 44.53 42.26Natural Gas ($ per mcf) 5.00 5.14 8.19 7.29 7.22Natural gas liquids ($ per bbl) 56.99 42.12 70.67 58.86 57.11Average price per boe 49.34 46.19 62.76 53.90 52.88
AVERAGE NETBACK Crude Oil netback ($ per bbl)(1) 39.59 40.40 41.55 43.26 38.55Heavy Oil netback ($ per bbl)(1) 32.62 29.99 51.53 26.34 23.00Natural Gas netback ($ per mcf)(1) 2.70 2.95 4.68 4.00 4.16Natural gas liquids netback ($ per bbl)(1) 30.02 17.81 31.35 27.80 25.82Operating netback ($ per boe) 26.37 25.38 34.78 30.40 29.59
Total capital expenditures ($ millions)(2) 357.7 216.8 401.9 309.7 300.8
Reserves (proved plus probable) Reserves at year end (mmboe) 318.4 295.7 323.5 319.9 297.8
(1) Prior year restated to conform to presentation in the current period.(2) Total capital expenditures excludes Drilling Royalty Credits (“DRCs”).
TABLE OF CONTENTSPresident’s Message 1Summary of Financial and Operating Results 3Management’s Discussion & Analysis 4Management’s Report to Shareholders 40
Auditor’s Report 41Consolidated Financial Statements 43Notes to Consolidated Financial Statements 46Corporate Information

President’s Message
To our shareholders,
2010 has been a year of significant transformation at Pengrowth. In addition to some of the operational and financial highlightslisted below, here are a few of the positive strategic and structural changes that your management team has undertaken in the lastyear:• Successful conversion from a trust to a dividend paying corporation on December 31, 2010.• Expanded the breadth and depth of the organic drilling inventory.• Undertook a significant gas focused acquisition in the Montney fairway, with an excellent drilling inventory.• Built capacity within the organization with the addition of new personnel in key operational roles across all levels.• Kick-started our Lindbergh Steam Assisted Gravity Drainage (SAGD) project, with a new leader and project team.• Focused capital spending into four key areas and expanded our capital budget.• Continued to grow investor awareness of the new Pengrowth as evidenced by a marked increase in institutional ownership.
We have made substantial and meaningful progress on the journey that we set out on in late 2009. Below you will find some of themore granular milestones and indicators of that progress during 2010.
Highlights• Pengrowth replaced 183 percent (99 percent through internal development) of annual production at an all in annual finding,
development and acquisition (FD&A) cost of $18.46 per barrel of oil equivalent (boe) including changes to future developmentcapital (FDC) for proved plus probable reserves.
• Pengrowth grew its proved plus probable reserves by 7.7 percent to 318.4 MMboe from year-end 2009 levels.• All-in finding and development (F&D) costs were $15.32 per boe for proved plus probable reserves and $17.63 per boe for
proved reserves including changes to FDC.• Throughout the year, Pengrowth’s production averaged 74,693 boe per day, with the reinvestment of approximately 59 percent
of cash flow.• Cost structures came down in 2010, with operating expenses declining by three percent in 2010 and General and Administrative
expenses declining by 18 percent throughout the year.• Pengrowth continued to maintain its financial discipline. In 2010, distributions declared and capital expenditures were
95 percent of operating cash flow. The remaining cash was directed to the reduction of debt.• Financial capability and flexibility was strengthened with the May private placement of U.S. $187 million of notes, coupled with
the renewal in October of a Cdn $1 billion bank facility with a $250 million expansion feature for a three year term.
Accomplishments & OpportunitiesDuring 2010, we took steps to re-vitalize our work force and build capacity within the organization by adding new personnel in keyoperational roles. During the year, we welcomed individuals to head up our acquisitions and business development team, drillingand completions team, and our in-situ development (SAGD) as well as our Montney gas development teams. These additions havestrengthened our technical capabilities and will help focus the organization on larger impact projects.
The Swan Hills area remains a core focus area, with a known resource of approximately 2.3 billion barrels of original-oil-in-place,net to Pengrowth. In 2010, our teams invested approximately $136 million on development activities in Swan Hills, where we areutilizing horizontal drilling and multi-stage acid fracturing technology to exploit tight carbonate reservoirs. We continue to meetwith substantial success in this area with the number of applications for this technology increasing along with the individual wellproduction rates improving. In 2011, we have allocated an additional $135 million of development capital to further theunconventional opportunities identified in this trend.
Inside the Swan Hills Trend, a total of seven horizontal wells (6.6 wells net) were drilled in the Carson Creek ‘C’ Pool in 2010. All ofthese wells were multi-stage acid fractured and added, on average, 750 boe per day of initial production per well. At Deer MountainUnit No 1, six horizontal wells (5.1 wells net) were drilled by the end of the fourth quarter; four (3.4 wells net) of which were multi-stage acid fractured and tested by the end of the year. These six wells are now on production and had an average five-day initialproduction rate of 300 boe per day.
Our Groundbirch Montney asset continues to be a core gas focus area. A 28 MMcf per day gas plant was successfully constructedand commissioned at this property on December 18, 2010 with five wells being brought on production and tied into the facility. Anadditional five wells have been drilled and will be fracture stimulated in the first quarter of 2011. These additional five wells shouldfill the plant.
PENGROWTH 2010 President’s Message 1

Lindbergh, our SAGD play, represents one of our longer-term growth opportunities where we are currently focused on advancingthe pilot project in 2011. The envisioned commercial project has the potential to produce up to 12,000 boe per day of oil in the firstphase and could potentially grow to as much as 30,000 boe per day. Subject to regulatory approval, construction of the pilot isexpected to commence in the third quarter of 2011 with first steam anticipated in the first quarter of 2012. Upon successfulcompletion of the pilot, we anticipate the first commercial phase of the project to be on stream by the end of 2013.
We continue to aggressively investigate new opportunities on our asset base in order to identify new core areas for futuredevelopment.
OutlookWe have made substantial progress in 2010, having right-sized the balance sheet, identified unconventional opportunities on ourexisting asset base and executed on the Monterey acquisition. There still remains significant opportunity on our own asset base, inparticular on the oil inventory side, as well as opportunities in the acquisition market. 2011 will be the year in which we roll out thestory on how we are going to grow production utilizing our inventory of oil weighted opportunities. We will continue to look at theacquisition market for opportunities that make sense, though our growth program will not be dependant on transactions. I lookforward to updating you in the near future on this next important stage of our transformation.
I’d like to take the opportunity to thank all of our shareholders for their continued support as we progress through this excitingperiod.
Sincerely
Derek W. EvansPresident and Chief Executive OfficerMarch 8, 2011
2 PENGROWTH 2010 President’s Message

SUMMARY OF FINANCIAL & OPERATING RESULTS(monetary amounts in thousands, exceptper share amounts or as otherwise stated)
Three Months ended December 31 Twelve Months ended December 312010 2009 % Change 2010 2009 % Change
STATEMENT OF INCOMEOil and gas sales $340,690 $359,296 (5) $1,353,283 $1,343,167 1Net income $ 1,937 $ 50,523 (96) $ 230,257 $ 84,853 171Net income per share (1) $ 0.01 $ 0.18 (94) $ 0.76 $ 0.32 138
CASH FLOWCash flow from operating activities $137,783 $149,933 (8) $ 605,995 $ 551,350 10Cash flow from operating activities per share (1) $ 0.42 $ 0.53 (21) $ 2.01 $ 2.09 (4)
Total capital expenditures (2) $134,296 $ 51,331 162 $ 357,704 $ 216,778 65Total capital expenditures per share (1) $ 0.41 $ 0.18 128 $ 1.19 $ 0.82 45Distributions paid $ 67,413 $ 66,548 1 $ 250,640 $ 334,405 (25)Distribution paid per unit (1) $ 0.21 $ 0.24 (13) $ 0.84 $ 1.28 (34)
Weighted average number of shares outstanding (000's) (1) 325,515 282,298 15 301,026 264,121 14
BALANCE SHEETWorking capital (deficiency) $ (91,629) $ (217,007)(3) (58)Property, plant and equipment $4,076,976 $3,789,369 8Long term debt $1,024,367 $ 907,599 13Shareholders' equity $3,186,976 $2,795,201 14Shareholders' equity per share (1) $ 9.78 $ 9.64 1Currency (U.S.$/Cdn$) (closing rate at period end) $ 1.0054 $ 0.9515Number of shares outstanding at period end (000's) (1) 326,024 289,835 12
AVERAGE DAILY PRODUCTIONCrude oil (bbls) 21,762 21,948 (1) 21,743 22,841 (5)Heavy oil (bbls) 6,673 7,235 (8) 6,789 7,551 (10)Natural gas (mcf) 218,044 232,682 (6) 219,302 237,217 (8)Natural gas liquids (bbls) 10,177 9,564 6 9,611 9,590 0Total production (boe) 74,953 77,529 (3) 74,693 79,518 (6)TOTAL PRODUCTION (mboe) 6,896 7,133 (3) 27,263 29,024 (6)
PRODUCTION PROFILECrude oil 29% 28% 29% 29%Heavy oil 9% 9% 9% 9%Natural gas 48% 50% 49% 50%Natural gas liquids 14% 13% 13% 12%
AVERAGE REALIZED PRICES (after commodity risk management)Crude oil (per bbl) $ 74.98 $ 75.79 (1) $ 75.04 $ 72.36 4Heavy oil (per bbl) $ 60.42 $ 62.16 (3) $ 60.22 $ 52.72 14Natural gas (per mcf) $ 4.87 $ 5.45 (11) $ 5.00 $ 5.14 (3)Natural gas liquids (per bbl) $ 56.74 $ 54.52 4 $ 56.99 $ 42.12 35Average realized price per boe $ 49.01 $ 50.35 (3) $ 49.34 $ 46.19 7
PROVED PLUS PROBABLE RESERVESCrude oil (mbbls) 110,297 112,249 (2)Heavy oil (mbbls) 26,472 27,724 (5)Natural gas (bcf) 913 757 21Natural gas liquids (mbbls) 29,481 29,587 0Total oil equivalent (mboe) 318,429 295,734 8CAPITAL PERFORMANCEFinding & Development Cost (F&D) (per boe) (4) $ 15.32 $ 30.81 (50)Finding, Development & Acquisition Cost (FD&A) (per boe) (4) $ 18.46 $ 57.16 (68)Recycle Ratio (5) 1.72 0.82 110
SUMMARY OF COMMON SHARE TRADINGNYSE– PGH ($U.S.)
High $ 13.25 $ 10.52 26 $ 13.25 $ 10.54 26Low $ 11.02 $ 8.81 25 $ 7.67 $ 4.51 70Close $ 12.86 $ 9.63 34 $ 12.86 $ 9.63 34
TSX –PGF ($Cdn)High $ 13.38 $ 11.39 17 $ 13.38 $ 12.33 9Low $ 11.29 $ 9.40 20 $ 8.50 $ 5.84 46Close $ 12.78 $ 10.15 26 $ 12.78 $ 10.15 26
(1) Pengrowth Energy Corporation is the entity resulting from the conversion of Pengrowth Energy Trust see note regarding conversion below.(2) Total capital expenditures excludes Drilling Royalty Credits ("DRCs")(3) Includes $157.5 million current portion of long term debt.(4) Includes the changes in Future Development Capital ("FDC") and based on Proved plus Probable Reserves.(5) Recycle Ratio is calculated as operating netback per boe divided by F&D costs per boe based on proved plus probable reserves.
Note regarding corporate conversion: Pengrowth Energy Corporation is the entity resulting from the conversion of Pengrowth Energy Trust to adividend paying corporation effective December 31, 2010. References to “shares”, “shareholder” and “dividends” should be read as references to
“trust units”, “trust unitholder” and “distributions” respectively for periods prior to December 31, 2010.Note regarding currency: all figures contained within this report are quoted in Canadian dollars unless otherwise indicated.
PENGROWTH 2010 Summary of Financial & Operating Results 3

MANAGEMENT’S DISCUSSION & ANALYSIS
The following Management’s Discussion and Analysis (“MD&A”) of financial results should be read in conjunction with the auditedconsolidated Financial Statements for the year ended December 31, 2010 of Pengrowth Energy Corporation and the consolidatedfinancial statements and MD&A of Pengrowth Energy Trust for the year ended December 31, 2009. The MD&A is based oninformation available to March 8, 2011.
STRUCTURE OF THE CORPORATION
Pengrowth Energy Corporation (the “Corporation”) is a Canadian resource company that is engaged in the production, development,exploration and acquisition of oil and natural gas assets. The Corporation was formed through a reorganization involving PengrowthEnergy Trust (the “Trust”), Pengrowth Corporation, its subsidiaries and the security holders of the Trust and Pengrowth Corporationpursuant to a Plan of Arrangement (the “Arrangement”) under the Business Corporations Act (Alberta).
On December 31, 2010 (the “Date of Conversion”), the Trust completed its conversion from an open-end investment trust to acorporation through a business combination resulting in the unitholders of the Trust and the exchangeable shareholders ofPengrowth Corporation owning all the common shares of the Corporation. Unitholders of the Trust received common shares in theCorporation on a one-for-one basis. Exchangeable shareholders of Pengrowth Corporation received 1.02308 common shares ofthe Corporation for each exchangeable share held. Pursuant to the Arrangement agreement, shareholders’ capital was reduced bythe amount of the deficit of the Trust on December 31, 2010. The management team and Board of Directors of the Corporation arecomprised of the former management team and elected members of the Board of Directors of the Trust.
The Corporation effected an internal reorganization subsequent to the Date of Conversion whereby, among other things, the Trustand its subsidiaries were dissolved and the Corporation received all the assets and assumed all the liabilities of the Trust.
The Arrangement has been accounted for on a continuity of interest basis and accordingly, the consolidated financial statements forperiods prior to the date of conversion reflect the financial position, results of operations and cash flows as if the Corporation hadalways carried on the business formerly carried on by the Trust. This MD&A may at times refer to common shares, shareholders,shareholders’ capital and dividends which prior to the Arrangement were referred to as trust units, trust unitholders, trustunitholder’s capital and distributions, respectively. References made to trust units are those issued by the Trust. Comparativeamounts in this MD&A will also reflect the history of the Trust and its subsidiaries.
This MD&A will refer to “Pengrowth” which collectively includes the Corporation, the Trust and its subsidiaries.
FREQUENTLY RECURRING TERMS
Pengrowth uses the following frequently recurring industry terms in this MD&A: “bbls” refers to barrels, “mbbls” refers tothousands of barrels, “boe” refers to barrels of oil equivalent, “mboe” refers to a thousand barrels of oil equivalent, “mcf” refers tothousand cubic feet, “bcf” refers to billion cubic feet, “gj” refers to gigajoule, “mmbtu” refers to million British thermal units and“MW” refers to megawatt. Disclosure provided herein in respect of a boe may be misleading, particularly if used in isolation. A boeconversion ratio of six mcf of natural gas to one barrel of crude oil equivalent is based on an energy equivalency conversion methodprimarily applicable at the burner tip and does not represent a value equivalency at the wellhead.
ADVISORY REGARDING FORWARD-LOOKING STATEMENTS
This MD&A contains forward-looking statements within the meaning of securities laws, including the "safe harbour" provisions ofCanadian securities legislation and the United States Private Securities Litigation Reform Act of 1995. Forward-looking information isoften, but not always, identified by the use of words such as "anticipate", "believe", "expect", "plan", "intend", "forecast", "target","project", “guidance”, "may", "will", "should", "could", "estimate", "predict" or similar words suggesting future outcomes orlanguage suggesting an outlook. Forward-looking statements in this MD&A include, but are not limited to, statements with respectto: reserves, 2011 production, the proportion of 2011 production of each product type, production additions from Pengrowth's 2011development program, royalty expenses, 2011 operating expenses, future income taxes, goodwill, asset retirement obligations,taxability of dividends, remediation, reclamation and abandonment expenses, capital expenditures, development activities, generaland administration expenses, and proceeds from the disposal of properties Statements relating to "reserves" are forward-lookingstatements, as they involve the implied assessment, based on certain estimates and assumptions that the reserves described existin the quantities predicted or estimated and can profitably be produced in the future.
4 PENGROWTH 2010 Management’s Discussion & Analysis

Forward-looking statements and information are based on Pengrowth's current beliefs as well as assumptions made by, andinformation currently available to, Pengrowth concerning general economic and financial market conditions, anticipated financialperformance, business prospects, strategies, regulatory developments, including in respect of taxation, royalty rates andenvironmental protection, future capital expenditures and the timing thereof, future oil and natural gas commodity prices anddifferentials between light, medium and heavy oil prices, future oil and natural gas production levels, future exchange rates andinterest rates, the proceeds of anticipated divestitures, the amount of future cash dividends paid by Pengrowth, the cost ofexpanding our property holdings, our ability to obtain labour and equipment in a timely manner to carry out development activities,our ability to market our oil and natural gas successfully to current and new customers, the impact of increasing competition, ourability to obtain financing on acceptable terms, our ability to add production and reserves through our development, exploitation andexploration activities. Although management considers these assumptions to be reasonable based on information currentlyavailable to it, they may prove to be incorrect.
By their very nature, forward-looking statements involve inherent risks and uncertainties, both general and specific, and risks thatpredictions, forecasts, projections and other forward-looking statements will not be achieved. We caution readers not to placeundue reliance on these statements as a number of important factors could cause the actual results to differ materially from thebeliefs, plans, objectives, expectations and anticipations, estimates and intentions expressed in such forward-looking statements.These factors include, but are not limited to: the volatility of oil and gas prices; production and development costs and capitalexpenditures; the imprecision of reserve estimates and estimates of recoverable quantities of oil, natural gas and liquids;Pengrowth's ability to replace and expand oil and gas reserves; environmental claims and liabilities; incorrect assessments of valuewhen making acquisitions; increases in debt service charges; the loss of key personnel; the marketability of production; defaults bythird party operators; unforeseen title defects; fluctuations in foreign currency and exchange rates; inadequate insurance coverage;counterparty risk; compliance with environmental laws and regulations; changes in tax and royalty laws; Pengrowth's ability toaccess external sources of debt and equity capital; the implementation of International Financial Reporting Standards; and theimplementation of greenhouse gas emissions legislation. Further information regarding these factors may be found under theheading “Business Risks” herein and under "Risk Factors" in Pengrowth's most recent Annual Information Form (AIF), and inPengrowth’s most recent consolidated financial statements, management information circular, quarterly reports, material changereports and news releases. Copies of Pengrowth’s Canadian public filings are available on SEDAR at www.sedar.com. Pengrowth’sU.S. public filings, including the most recent annual report form 40-F as supplemented by its filings on form 6-K, are available atwww.sec.gov.
Pengrowth cautions that the foregoing list of factors that may affect future results is not exhaustive. When relying on our forward-looking statements to make decisions with respect to Pengrowth, investors and others should carefully consider the foregoingfactors and other uncertainties and potential events. Furthermore, the forward-looking statements contained in this MD&A aremade as of the date of this MD&A and Pengrowth does not undertake any obligation to update publicly or to revise any of theincluded forward-looking statements, except as required by law. The forward-looking statements in this document are provided forthe limited purpose of enabling current and potential investors to evaluate an investment in Pengrowth. Readers are cautioned thatsuch statements may not be appropriate, and should not be used for other purposes.
The forward-looking statements contained in this MD&A are expressly qualified by this cautionary statement.
CRITICAL ACCOUNTING ESTIMATES
The financial statements are prepared in accordance with Canadian Generally Accepted Accounting Principles (GAAP). Managementis required to make estimates and assumptions that affect the reported amounts of assets and liabilities at the date of the financialstatements and revenues and expenses for the period ended. Certain of these estimates may change from period to period resultingin a material impact on Pengrowth’s results of operations, financial position, and change in financial position.
The amounts recorded for depletion and depreciation of property, plant and equipment, amortization of injectants, share basedcompensation, goodwill and future taxes are based on estimates. The ceiling test calculation is based on estimates of provedreserves, production rates, oil and natural gas prices, future costs and other relevant assumptions. Values assigned to the variousassets and liabilities of the Monterey Exploration Ltd. (Monterey) business combination were based on internal and third partyestimates. The amounts recorded for the fair value of risk management contracts and the unrealized gains or losses on the changein fair value are based on estimates. The provision for asset retirement obligations is based on estimates affected by assumptionsaround timing and cost estimates for the related work activity. These estimates can change significantly from period to period. Asrequired by National Instrument 51-101 Standards of Disclosure for Oil and Gas Activities, Pengrowth uses independent qualifiedreserve evaluators in the preparation of the annual reserve evaluations. By their nature, these estimates are subject tomeasurement uncertainty and changes in these estimates may impact the consolidated financial statements of future periods.
PENGROWTH 2010 Management’s Discussion & Analysis 5

NON-GAAP FINANCIAL MEASURES
This MD&A refers to certain financial measures that are not determined in accordance with GAAP in Canada or the United States.These measures do not have standardized meanings and may not be comparable to similar measures presented by other oil andgas companies. Measures such as operating netbacks do not have standardized meanings prescribed by GAAP. See the section ofthis MD&A entitled Operating Netbacks for a discussion of the calculation.
The current level of capital expenditures funded through retained cash, as compared to debt or equity, can be determined when it iscompared to the difference in cash flow from operating activities and dividends paid in the financing section of the Statement ofCash Flow.
Payout Ratio is a term used to evaluate financial flexibility and the capacity to fund dividends. Payout ratio is defined on a percentagebasis as dividends declared divided by cash flow from operations.
Management monitors Pengrowth’s capital structure using non-GAAP financial metrics. The two metrics are Total Debt to thetrailing twelve months Earnings Before Interest, Taxes, Depletion, Depreciation, Amortization, Accretion, and other non-cash items(“EBITDA”) and Total Debt to Total Capitalization. Total Debt is the sum of working capital deficit and long term debt as shown onthe balance sheet, and Total Capitalization is the sum of Total Debt and Shareholder’s equity.
NON-GAAP OPERATIONAL MEASURES
The reserves and production in this MD&A refer to company interest reserves or production that is Pengrowth’s working interestshare of production or reserves prior to the deduction of Crown and other royalties plus any Pengrowth owned royalty interest inproduction or reserves at the wellhead. Company interest is more fully described in the Corporation's AIF.
When converting natural gas to equivalent barrels of oil within this MD&A, Pengrowth uses the industry standard of six mcf to oneboe. Barrels of oil equivalent may be misleading, particularly if used in isolation; a conversion ratio of six mcf of natural gas to oneboe is based on an energy equivalency conversion and does not represent a value equivalency at the wellhead. Production volumes,revenues and reserves are reported on a company interest gross basis (before royalties) in accordance with Canadian practice.
Pengrowth’s ability to grow both reserves and production can be measured with the following metrics: Reserves per debt adjustedshare and production per debt adjusted share. Reserves per debt adjusted share is measured using year-end Proved plus Probablereserves and the number of common shares outstanding at year-end. The measurements are debt-adjusted by assuming additionalshares are issued at year-end share prices to replace year-end long-term debt outstanding.
Production per debt adjusted share is measured in respect of the average production for the year and the weighted average numberof common shares outstanding during the year. The measurements are debt-adjusted by assuming additional shares are issued atyear- end share prices to replace year-end long-term debt outstanding.
Recycle ratio is a measure of value creation for each dollar spent. This measure is calculated as operating netback per boe dividedby Finding and Development (“F&D”) cost per boe and can also be calculated using Finding, Development & Acquisition (“FD&A”)cost per boe. Recycle ratio can be calculated including or excluding Future Development Capital (“FDC”).
CURRENCY
All amounts are stated in Canadian dollars unless otherwise specified.
6 PENGROWTH 2010 Management’s Discussion & Analysis

Pengrowth’s fourth quarter and annual results for 2010 are contained within this MD&A.
2010 GUIDANCE AND FINANCIAL HIGHLIGHTS
The following table provides a summary of the 2010 and 2011 Guidance and a review of 2010 actual results.
2010 2010 2010 2011Actual Guidance Variance Guidance
Production (boe/d) 74,693 74,000 - 75,000 – 74,000 - 76,000
Royalty Expense (% of Sales) (1) 19.8 20.0 (0.2) 20.0
Operating Expense ($/boe) 13.63 13.60 0.03 13.54
G&A Expense (cash & non-cash) ($/boe) 1.87 2.23 (0.36) 2.69
Total capital expenditures ($ millions) (2) 357.7 350.0 7.7 400.0
(1) Royalty expense as a % of sales excludes the impact of commodity risk management contracts.
(2) Total capital expenditures excludes Drilling Royalty Credits.
• Operating expenses for the full year were essentially in line with guidance.
• Increased capital spending on oil focused drilling in the fourth quarter resulted in Pengrowth exceeding spending targets.
FINANCIAL HIGHLIGHTS
(monetary amounts in thousands, exceptper boe amounts or as otherwise stated)
Three months ended Twelve months endedDec 31, 2010 Sept 30, 2010 Dec 31, 2009 Dec 31, 2010 Dec 31, 2009
Production (boe/d) 74,953 72,704 77,529 74,693 79,518
Net capital expenditures (1) $130,874 $ 87,677 $ 46,215 $333,842 $ 207,451
Cash flow from operating activities $137,783 $159,926 $149,933 $605,995 $ 551,350
Netback ($/boe) (2) $ 24.58 $ 26.12 $ 26.63 $ 26.37 $ 25.38
Net income $ 1,937 $125,632 $ 50,523 $230,257 $ 84,853
Included in net income:
Gain on equity investment $ – $ 73,756 $ – $ 73,756 $ –
Realized gain on commodityrisk management (3) $ 19,102 $ 25,689 $ 27,855 $ 75,065 $ 171,147
Unrealized (loss) gain on commodityrisk management (3) $ (52,529) $ (898) $ (40,101) $ 6,949 $(173,726)
Unrealized foreign exchange gain (3) $ 29,742 $ 30,579 $ 18,124 $ 49,918 $ 149,233
Future tax reduction $ 24,388 $ 11,884 $ 67,806 $ 44,829 $ 142,945
(1) Net capital expenditures includes Drilling Royalty Credits
(2) Includes the impact of realized commodity risk management contracts
(3) Pre-tax amount
PENGROWTH 2010 Management’s Discussion & Analysis 7

Cash flow from operations
The following table provides a reconciliation of the change in cash flow from operations from period end 2009 to period end 2010.
($ thousands) Q4 % Change Full Year % Change
2009 Cash flow from Operating Activities 149,933 551,350
Volume variance (7,200) (5) (65,938) (12)
Price variance (5,387) (4) 165,822 30
Processing income variance 1,652 1 1,840 –
Lower cash gains on risk management contracts (8,753) (6) (96,082) (17)
Royalty expense 10,087 7 (45,136) (8)
Expenses:
Transportation (156) – (2,272) –
Operating (14,769) (10) 12,696 2
Cash G&A and management fee 2,562 2 10,534 2
Interest and financing expense (1,378) (1) 9,810 2
Drilling Credits acquired – – 16,727 3
Realized foreign exchange loss 127 – (2,550) –
Non-cash working capital and other items 11,065 7 49,194 9
2010 Cash flow from Operating Activities 137,783 (8) 605,995 10
Cash flow from operating activities decreased eight percent from the fourth quarter of 2009 to 2010. The decrease was driven by acombination of lower production volumes, lower average realized commodity prices and higher operating costs. The decrease incash flow was partly offset by lower royalties and G&A expenses.
Cash flow from operating activities increased 10 percent on a year over year basis. Higher liquids commodity prices in 2010compared to 2009 combined with lower operating expense and G&A expenses in the current year contributed to higher cash flows in2010 but were partially mitigated by lower production volumes and higher royalty expenses.
Price Sensitivity
The following table illustrates the sensitivity of cash flow from operating activities to changes in commodity prices:
Impact on2011 Annual
Commodity Price Environment(1) Assumption Change Cash Flow ($'000s) (2)
West Texas Intermediate Oil Price (3) US$/bbl 79.40 $1.00 10,832
Heavy Oil US$/bbl 79.40 $1.00 1,865
Light Oil US$/bbl 79.40 $1.00 6,084
NGL US$/bbl 79.40 $1.00 2,883
AECO Natural Gas Price (3) 4.06 $0.10 6,491
Natural Gas C$/mcf 4.06 $0.10 6,491
(1) Calculations are performed independently and are not indicative of actual results when multiple variables change at the same time.
(2) The calculated impact on revenue/cash flow is only applicable within a limited range of the change indicated.
(3) Does not include the impact of risk management contracts. For 2011, risk management contracts represent approximately 32% of forecastedtotal liquids production and 22% of forecasted natural gas production.
Net Income or Loss
For the fourth quarter of 2010, net income of $1.9 million was recorded, a $48.6 million decrease from the same period last year.The decrease is largely attributable to changes in certain non-cash items including:
• An unrealized loss on commodity risk management contracts of $52.5 million ($37.7 million, net of tax) compared to$40.1 million ($28.8 million, net of tax) in the fourth quarter of 2009.
8 PENGROWTH 2010 Management’s Discussion & Analysis

• Future income tax reductions decreased $43.4 million in the fourth quarter 2010 primarily from changes in non-cashitems affecting net income.
• Partially offsetting these decreases was a higher unrealized foreign exchange gain of $29.7 million ($25.9 million, net oftax) compared to $18.1 million ($15.8 million, net of tax) in the fourth quarter of 2009.
On a year-over-year basis, net income was $230.3 million, an increase of $145.4 million from the same period last year.Contributing to the increase was a 10 percent increase in cash flow from operating activities and changes to certain non-cash itemsincluding:
• A non-cash gain of $73.8 million ($73.8 million, net of tax) arising from the difference between the fair value and the bookvalue of the investment in Monterey prior to the acquisition as described in Note 4 to the financial statements.
• An unrealized commodity risk management gain of $6.9 million ($5.0 million, net of tax) for the full year of 2010 comparedto an unrealized commodity risk management loss of $173.7 million ($126.3 million, net of tax) in the prior year.
• Lower depletion, depreciation and amortization in 2010 of $529.4 million compared to $591.4 million in 2009.
• Partly offsetting the increase was the impact of the change in the U.S. to Canadian dollar exchange rate which primarilycaused a smaller unrealized foreign exchange gain of $49.9 million in 2010 ($43.5 million, net of tax) compared to anunrealized gain of $149.2 million ($130.1 million, net of tax) in the same period last year.
• Also partially offsetting the increase to net income were lower 2010 future income tax reductions compared to the sameperiod last year by $98.1 million as a result of lower unitholder distributions and the impact of changes to non-cash items.
RESULTS OF OPERATIONS
(All volumes, wells and spending amounts stated below reflect Pengrowth’s net working interest unless otherwise stated.)
CAPITAL EXPENDITURES
For the full year of 2010, capital expenditures totaled $357.7 million, $333.8 million after drilling royalty credits, with approximately85 percent spent on drilling, completions and facilities. Included in the capital expenditures are land acquisition costs of$5.6 million, maintenance capital of $41.0 million and reductions from drilling credits of $23.9 million.
Three months ended Twelve months ended($ millions) Dec 31, 2010 Sept 30, 2010 Dec 31, 2009 Dec 31, 2010 Dec 31, 2009
Drilling, completions and facilities 120.4 78.7 40.2 300.8 146.2
Seismic acquisitions (1) & Reservoir Studies (2) 4.2 1.0 0.5 5.9 13.9
Maintenance capital 7.5 12.5 8.8 41.0 48.5
Land purchases 0.3 1.0 0.5 5.6 2.9
Development capital 132.4 93.2 50.0 353.3 211.5
Other capital 1.9 0.9 1.3 4.4 5.2
Drilling Royalty Credits (3.4) (6.3) (5.1) (23.9) (9.3)
Total net capital expenditures 130.9 87.7 46.2 333.8 207.4
Business acquisitions (3) 570.4 – 570.4 –
Property acquisitions 0.1 17.3 25.3 20.2 35.7
Proceeds on property dispositions (12.4) (0.3) (34.2) (60.7) (41.9)
Net capital expenditures and acquisitions 118.6 675.1 37.3 863.7 201.2
(1) Seismic acquisitions are net of seismic sales revenue.
(2) Reservoir Studies includes capital spending on the Lindbergh Steam Assisted Gravity Drainage ("SAGD") Project.
(3) Business acquisitions includes the increase to Property, Plant & Equipment as a result of the acquisition of Monterey.
PENGROWTH 2010 Management’s Discussion & Analysis 9

DRILLING ACTIVITY
Pengrowth participated in the drilling of 214 wells (128.1 net wells) in 2010.
Q4 2010 Q3 2010 Q2 2010 Q1 2010 Full Year 2010Gross Net Gross Net Gross Net Gross Net Gross Net
Focus Areas
Swan Hills 16 7.9 13 8.3 6 5.1 24 4.6 59 25.9
Groundbirch 3 3.0 1 1.0 – – – – 4 4.0
Lindbergh 3 3.0 – – – – – – 3 3.0
Olds/Garrington 5 3.7 5 2.7 2 1.6 2 1.7 14 9.71
Other Resource Plays
Shallow Gas & CBM 5 3.2 11 5.1 – – 66 54.0 82 62.3
Heavy Oil – – – – – – 12 12.0 12 12.0
Horn River – – – – – – 2 2.0 2 2.0
Weyburn Unit 12 1.2 8 0.8 6 0.6 5 0.5 31 3.1
Conventional 1 0.7 3 3.0 1 1.0 2 1.4 7 6.1
Total wells drilled 45 22.7 41 20.9 15 8.3 113 76.2 214 128.1
DEVELOPMENT CAPITAL ACTIVITIES
Pengrowth’s capital spending breakdown by area, excluding drilling credits is as follows:
($ millions) Q4 2010 Full Year 2010% of Full Year
2010 Spending Full Year 2009
Focus Areas (1)
Swan Hills 50.7 136.4 38% 59.1
Groundbirch 32.7 37.3 10% –
Lindbergh 3.0 3.6 1% 9.4
Olds/Garrington 21.2 44.3 12% 11.9
107.6 221.6 62% 80.4
Other Resource Plays
Shallow Gas & Coalbed Methane 2.8 16.0 5% 23.9
Heavy Oil 2.8 11.5 3% 13.6
Horn River (0.5) 12.5 3% 4.9
Weyburn Unit 3.3 14.0 4% 6.1
Conventional Resource Plays 7.4 28.8 8% 26.7
15.8 82.8 23% 75.2
Drilling, Completions & Facilities 123.4 304.4 85% 155.6
Maintenance 7.5 41.0 11% 48.5
Land & Seismic Acquisitions 1.5 7.9 2% 7.4
Other 1.9 4.4 1% 5.2
Total Capital Expenditures 134.3 357.7 100% 216.7
(1) Spending amounts reflect the activity for both operated and partner operated properties.
10 PENGROWTH 2010 Management’s Discussion & Analysis

Focus Areas
Swan Hills TrendThe Swan Hills Trend is a significant oil resource area where Pengrowth is a legacy landholder with an estimated 2.3 billion barrelsof original oil in place. It is an extensive carbonate oil reservoir that is providing Pengrowth with many opportunities to put itsexpertise in horizontal drilling and multi-stage fracturing of carbonate reservoirs to work on its operated interests in Judy Creek,Carson Creek, House Mountain, and Deer Mountain.
Pengrowth’s operated Carson Creek production comes from two units: Carson Creek North Beaverhill Lake (BHL) Unit 1, whichprimarily produces oil, and the Carson Creek BHL Unit 1, which primarily produces liquids-rich gas. Pengrowth has beendeveloping a new BHL gas pool, the Carson C Pool, where production averaged approximately 2,900 boe per day during the fourthquarter.
Seven horizontal wells (6.6 net wells) drilled in the Carson C Pool in 2010 were successfully multi-stage acid fractured and tested inthe third and fourth quarters of 2010, adding on average approximately 750 boe per day of initial production per well. All seven wellswere on production in early 2011 and total projected cost for this project is estimated at $30 million.
At House Mountain two BHL platform horizontal wells (2.0 net wells) were drilled during 2010 at an estimated drilling andcompletion cost of $10 million. Both wells were multi-stage acid fractured and tested in the third quarter at a five day initial rate of350 boe per day and placed on production early in the fourth quarter.
At Deer Mountain Unit No 1, six horizontal wells (5.1 net wells) were drilled by the end of the fourth quarter; four of these wellswere multi-stage acid fractured and tested, averaging 360 barrels of oil per day; the last two wells were completed in February2011. Total capital spent in 2010 at Deer Mountain Unit No.1 was approximately $18 million.
GroundbirchPengrowth’s Groundbirch asset is our major Montney gas property which was acquired through the acquisition of MontereyExploration Ltd. in 2010. This property provides Pengrowth access to a large resource with a long reserve life index with thepotential of approximately 124 gross (107 net) additional drilling locations.
During the fourth quarter, construction was completed on a 28 mmcf per day gas plant. The plant went on production onDecember 18, 2010 and five wells were tied in. By achieving production before December 30, 2010, four wells qualify for a reducedroyalty rate of two percent for the next twelve months. An additional five wells have been drilled and will be fractured in the firstquarter of 2011. Approximately $37 million has been spent on the operations in the Groundbirch area, subsequent to September 15,2010, of this approximately $7 million was spent on the construction of the gas plant.
Lindbergh Steam Assisted Gravity Drainage (“SAGD”) ProjectPengrowth's entry into operated SAGD operations resulted from the 2004 acquisition of our Lindbergh property. In 2010, a newleader was assigned to the Lindbergh Project and a team, sourced both internally and externally, was in place by the end of thefourth quarter. A detailed review and update on the Lindbergh project was completed, an amendment to the existing Lindberghregulatory application and responses to outstanding Supplemental Information Requests by the regulators was completed andsubmitted to both the Energy Resources Conservation Board and Alberta Environment. Late in 2010, three observation wells weredrilled for the SAGD pilot. Subject to regulatory approvals, it is anticipated that construction will begin in the third quarter of 2011followed by first steam at the SAGD pilot in the first quarter of 2012.
Olds/GarringtonDuring 2010 two proof of concept programs were tested in order to define the resources in the Cardium and Viking formations. Ninewells (5.8 net wells) were drilled in this program, one of which was junked and abandoned. Six wells were on production by the endof 2010 and with their results being evaluated to define future development. Total spending on these two programs wasapproximately $25 million.
During 2010 four Elkton wells (3.3 net wells) were drilled in the Harmattan area for approximately $9 million. Initial production fromthe wells drilled early in the year was 800 boe per day. Results from this program are positive with additional locations scheduledfor the first quarter of 2011.
2011 Capital ProgramPengrowth currently anticipates the 2011 capital program, excluding acquisitions, to be $400 million, an increase of 12 percent from2010 total capital spending of $358 million. It is designed to be flexible, scalable and responsive to uncertain commodity prices andmarket conditions. Management believes that the capital guidance is an appropriate level of capital spending to replace a significantportion of production.
PENGROWTH 2010 Management’s Discussion & Analysis 11

RESERVES AND PERFORMANCE MEASURESReserves – Company Interest
Reserves Summary 2010 2009 2008
Proved Reserves
Drill + Revisions (mmboe) for the year 20.5 11.3 17.6
Net Acquisitions (mmboe) for the year 11.2 (0.9) 6.4
Total Proved Reserves at period end 221.0 216.6 235.2
Proved Reserve replacement ratio excluding acquisitions 75% 39% 59%
Proved Reserve replacement ratio including acquisitions 116% 36% 80%
Proved plus Probable Reserves (P+P)
Drill + Revisions (mmboe) for the year 27.1 2.6 23.9
Net Acquisitions (mmboe) for the year 22.8 (1.3) 9.7
Total Proved plus Probable Reserves at period end 318.4 295.7 323.5
P+P Reserve replacement ratio excluding acquisitions 99% 9% 80%
P+P Reserve replacement ratio including acquisitions 183% 4% 112%
Pengrowth reported year-end proved reserves of 221.0 mmboe and proved plus probable reserves of 318.4 mmboe for 2010compared to 216.6 mmboe and 295.7 mmboe, respectively at year end 2009. During 2010, Pengrowth’s development andoptimization activities resulted in the addition of 20.5 mmboe of Proved Reserves and 27.1 mmboe of Total Proved plus ProbableReserves including revisions. Acquisitions net of some minor dispositions in 2010 also added 11.2 mmboe of Proved Reserves and22.8 mmboe of total proved plus probable reserves. The reserve additions in 2010 resulted in a reserve replacement ratio of99 percent for total proved plus probable reserves excluding acquisitions, and 183 percent including acquisitions.
Further details of Pengrowth’s 2010 year-end reserves, F&D and FD&A calculations are provided in the AIF which is filed on SEDAR(www.sedar.com) or the 40-F filed on Edgar (www.sec.gov).
Performance Measures
Finding & Development Costs & Recycle Ratio 2010 2009 2008 3 yr average
Excluding Acquisitions (F&D)
Excluding Changes in FDC
Recycle Ratio (1) 2.17 0.32 2.14 1.69
F&D costs per boe $12.15 $ 78.46 $16.27 $17.17
Including Changes in FDC
Recycle Ratio (1) 1.72 0.82 1.46 1.46
F&D costs per boe $15.32 $ 30.81 $23.82 $19.85
Including Acquisitions (FD&A)
Excluding Changes in FDC
Recycle Ratio (2) 1.80 0.17 2.25 1.70
FD&A costs per boe – proved plus probable $14.61 $151.45 $15.47 $17.04
Including Changes in FDC
Recycle Ratio (2) 1.43 0.44 1.65 1.44
FD&A costs per boe – proved plus probable $18.46 $ 57.16 $21.13 $20.11
(1) Recycle Ratio is calculated as operating netback per boe divided by F&D costs per boe based on proved plus probable reserves.(2) Recycle Ratio is calculated as operating netback per boe divided by FD&A costs per boe based on proved plus probable reserves.
The 2010 total proved plus probable finding and development cost (F&D), including changes in future development capital, were$15.32 per boe, a 50 percent decrease from the 2009 F&D cost per boe. The improvement year over year illustrates Pengrowth’sability to create efficiencies through the drill bit by focusing on the development of repeatable resource plays in such areas as theSwan Hills Trend and at the newly acquired Groundbirch area. In addition, the 2009 F&D cost per boe was higher than Pengrowth’shistoric average largely due to the impact of the 2009 reserve revisions.
12 PENGROWTH 2010 Management’s Discussion & Analysis

Recycle ratio is an important performance measure in assessing investment profitability and provides a comparison to ourcompetitors. Pengrowth’s operating results and capital program in 2010 yielded a recycle ratio, excluding acquisition and includingchanges in FDC, of 1.72 and on a three year average was 1.46. The three year average recycle ratio was impacted by the 2009reserve revisions while the 2010 recycle ratio reflects the lower F&D cost per boe.
Pengrowth’s goal over longer periods is to maintain or modestly grow production and reserves per debt adjusted share. The trendover the last three years for production per debt adjusted share has been relatively flat while reserves per debt adjusted share hasimproved in 2010, demonstrating Pengrowth’s ability to replace production with reserve adds from development activities.
Performance Measures 2010 2009 2008
Production per debt adjusted share (boe/share) (1) 0.07 0.08 0.07
Reserves per debt adjusted share (boe/share) (1) 0.78 0.74 0.76
(1) Debt adjusted shares equals the shares outstanding plus the number of shares needed to retire all total long term debt at the year-end shareprice.
ACQUISITIONS & DISPOSITIONSOn September 15, 2010, Pengrowth successfully completed the acquisition of Monterey for total consideration of $445 million (seeNote 4 to the financial statements for additional details of this transaction). This acquisition has provided Pengrowth with 21.0 gross(19.0 net) sections at Groundbirch in northeast British Columbia, a highly prospective Montney focused resource asset.
During the first quarter of 2010, Pengrowth completed the disposition of various gross overriding royalty interests. Proceeds of thedisposition were approximately $38.4 million net of adjustments. Proceeds from this disposition were used for debt repayment.
PRODUCTION
Three months ended Twelve months ended
Daily productionDec 31,
2010% oftotal
Sept 30,2010
% oftotal
Dec 31,2009
% oftotal
Dec 31,2010
% oftotal
Dec 31,2009
% oftotal
Light crude oil (bbls) 21,762 29 20,967 29 21,948 28 21,743 29 22,841 29
Heavy oil (bbls) 6,673 9 6,585 9 7,235 9 6,789 9 7,551 9
Natural gas (mcf) 218,044 48 217,712 50 232,682 50 219,302 49 237,217 50
Natural gas liquids (bbls) 10,177 14 8,867 12 9,564 13 9,611 13 9,590 12
Total boe per day 74,953 72,704 77,529 74,693 79,518
Average daily production increased three percent in the fourth quarter of 2010 compared to the third quarter of 2010. Fourthquarter volumes were positively affected by production from the Monterey assets acquired in mid-September and the start-up ofGroundbirch production in mid-December. Also positively impacting the fourth quarter was production from development activities,particularly Swan Hills trend production at Deer Mountain, House Mountain, and new production at Olds/Garrington. Optimizationwork completed at various field sites also had a positive impact. Also impacting the quarter were unplanned production outages inQuirk Creek, Sable Offshore Energy Project (“SOEP”) and Olds. Both fourth quarter and full year production decreased as a result ofminor property dispositions, unscheduled production outages and production declines.
Pengrowth’s 2011 capital program should allow us to maintain average daily production volumes of between 74,000 and 76,000 boeper day. The capital program is expected to deliver new production that is split 80 percent crude oil and liquids and 20 percentnatural gas and is designed to be flexible, scalable and responsive to uncertain commodity prices and market conditions. Overall,Pengrowth’s production is projected to remain balanced at approximately 50 percent natural gas and 50 percent crude oil andliquids. The 2011 estimate excludes production from any potential future acquisitions and dispositions.
Light Crude OilFourth quarter light crude oil production increased approximately four percent from the third quarter of 2010. This increase ismainly attributable to new Swan Hills trend production starting from new wells at Deer Mountain, House Mountain and newproduction at Olds/Garrington. Optimization and the resumption of production following third quarter turnaround activity alsoimpacted production.
PENGROWTH 2010 Management’s Discussion & Analysis 13

The one percent decrease in light crude oil in the current quarter compared to the fourth quarter of 2009, is a result of productiondeclines, partially offset by the development work mentioned above, the late 2009 acquisition of an additional working interest inHouse Mountain Unit #1, and additional production from well optimizations, particularly in the Jenner and Bantry areas. The year-over-year decrease of approximately five percent is a result of increased planned maintenance shutdown work in 2010, particularlythe Judy Creek turnaround.
Heavy OilHeavy oil production increased approximately one percent in the fourth quarter of 2010 compared to the third quarter of 2010. Thisincrease is attributable to volumes back on production after third quarter planned maintenance shutdowns at Bodo andTangleflags, offset by production declines.
The eight percent decrease between the fourth quarters of 2010 and 2009 and the ten percent decrease year-over-year isattributable to production declines due to reduced capital investment during 2009, second quarter power outages in 2010 andincreased downtime from surface and sub-surface maintenance work at partner operated Tangleflags.
Natural GasNatural gas production increased marginally in the fourth quarter compared to the third quarter of 2010. Included in the fourthquarter are a full three months of production from the Monterey acquisition, successful optimization work in the Princess area andapproximately two weeks of initial production from Groundbirch. These additional volumes were partially offset by productiondeclines and unscheduled maintenance at Olds, SOEP and Quirk Creek.
Production volumes were lower by approximately six percent comparing the fourth quarter of 2010 with the same quarter in 2009.The decrease is attributable to non-core gas focused asset dispositions in late 2009, scheduled and unscheduled downtimepreviously mentioned and natural declines. Partially offsetting these declines were production from the acquisition of Monterey,liquid rich gas development in the Harmattan area and the start-up of Groundbirch.
Production volumes decreased approximately eight percent comparing the full year of 2010 to the same period of 2009. Thesedecreases are a result of the previously mentioned property divestitures and production declines. Partially offsetting the decreasesare additional production volumes from development and optimization activity in Carson Creek, the previously mentioneddevelopment program at Harmattan and the volumes added from the acquisition of Monterey.
NGLsNGL production increased approximately 15 percent in the fourth quarter of 2010 compared to the third quarter of 2010 and sixpercent comparing fourth quarter 2010 with the same period of 2009. The increase in both time periods is a result of lower miscibleflood demand resulting in higher sales at Judy Creek and additional production from new liquids rich horizontal gas wells in CarsonCreek C pool which came on stream mid-way through the third quarter 2010.
NGL volumes remained relatively flat comparing full year 2010 with full year 2009 with the increased NGL production at CarsonCreek and Harmattan offset by lower sales volumes at Judy Creek resulting from the previously mentioned turnaround and reducedthird party demand for miscible flood injectants plus production declines.
14 PENGROWTH 2010 Management’s Discussion & Analysis

COMMODITY PRICE
Average Realized Prices
Three months ended Twelve months ended(Cdn$) Dec 31, 2010 Sept 30, 2010 Dec 31, 2009 Dec 31, 2010 Dec 31, 2009
Light crude oil (per bbl) 77.37 72.18 74.37 74.89 63.94
after realized commodity risk management 74.98 73.93 75.79 75.04 72.36
Heavy oil (per bbl) 60.42 57.80 62.16 60.22 52.72
Natural gas (per mcf) 3.68 3.56 4.28 4.08 3.97
after realized commodity risk management 4.87 4.67 5.45 5.00 5.14
Natural gas liquids (per bbl) 56.74 53.55 54.52 56.99 42.12
Total per boe 46.25 43.24 46.44 46.59 40.29
after realized commodity risk management 49.01 47.07 50.35 49.34 46.19
Other production income 0.39 0.40 0.02 0.30 0.08
Total oil and gas sales per boe 49.40 47.47 50.37 49.64 46.27
Benchmark prices
WTI oil (U.S.$ per bbl) 85.24 76.21 76.13 79.61 62.09
AECO spot gas (Cdn$ per mmbtu) 3.61 3.54 4.61 3.99 3.99
NYMEX gas (U.S.$ per mmbtu) 3.98 4.23 4.93 4.38 4.16
Currency (U.S.$/Cdn$) 0.99 0.96 0.95 0.97 0.88
The WTI benchmark crude oil prices increased significantly in 2010, averaging U.S. $79.61 per bbl compared to an average price of$62.09 per bbl in 2009. On a year over year basis, Pengrowth’s average realized price, after risk management activities increasedapproximately seven percent from last year mainly as a result of higher benchmark crude prices in 2010.
U.S. based NYMEX natural gas benchmark prices started 2010 on a strong note with prices rallying above U.S. $5.00 per mmbtu asbelow normal temperatures across much of the consuming eastern U.S. and improved demand help support the early price rally.However, prices weakened as the year progressed and continued to experience downward pressure for much of the year. NYMEXgas prices averaged U.S. $4.38 per mmbtu in 2010, a slight improvement from 2009 average prices of U.S. $4.16 per mmbtu.
In Canada, the AECO spot market continued to trade at a discount to the NYMEX benchmark. The strengthening Canadian dollartogether with U.S. production growth, an abundance of natural gas in Canadian storage and reduced Canadian exports to the U.S.have contributed to a wider basis for AECO compared to the NYMEX natural gas price. Our corporate realized natural gas price afterrisk management activities was $5.00 per mmbtu in 2010, an approximate three percent decrease over 2009 realized prices of$5.14 per mmbtu due to a lower hedged gas price in 2010.
Pengrowth’s average realized price was $49.01 per boe in the fourth quarter 2010, a four percent increase from the third quarter2010 and a three percent decrease over the fourth quarter of 2009. Benchmark prices increased in the fourth quarter compared tothe third quarter contributing to higher average prices for oil and natural gas.
The Canadian dollar strengthened significantly versus its U.S. counterpart in 2010 averaging $0.97 (U.S.$/Cdn$) compared to$0.88 (U.S.$/Cdn$) in 2009. A stronger outlook on the Canadian economy coupled with improved pricing for major commoditieswere the primary contributors to the surge in the Canadian dollar.
PENGROWTH 2010 Management’s Discussion & Analysis 15
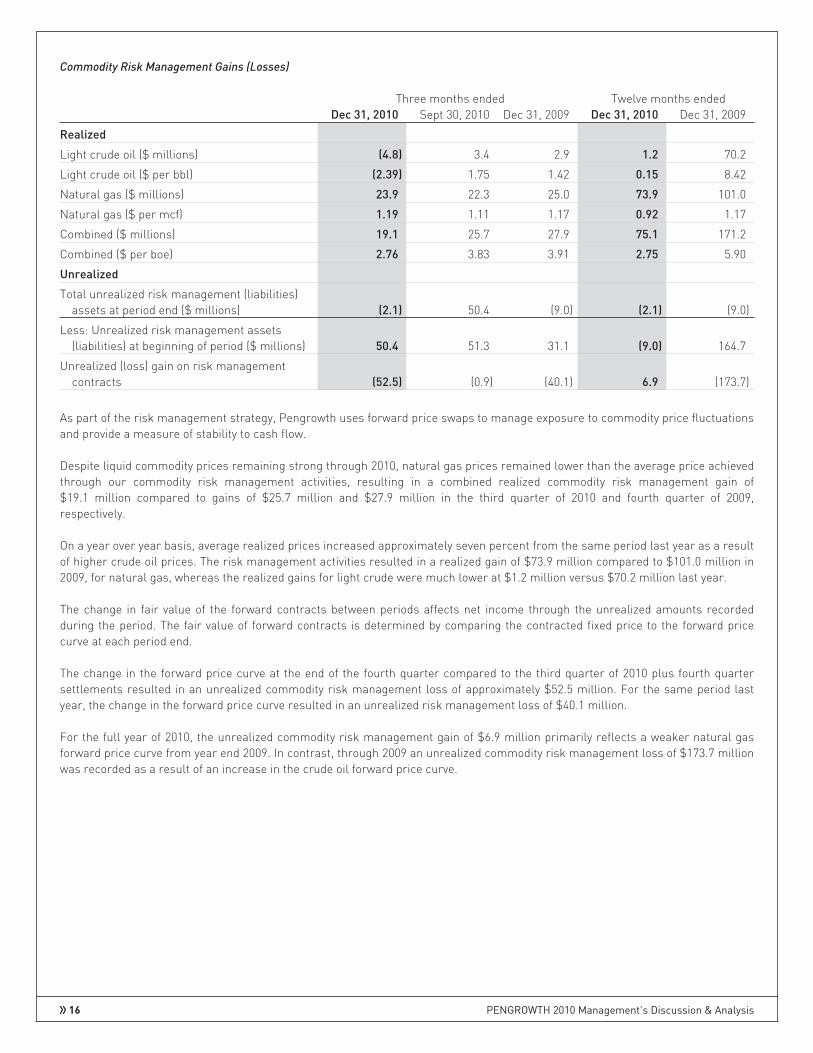
Commodity Risk Management Gains (Losses)
Three months ended Twelve months endedDec 31, 2010 Sept 30, 2010 Dec 31, 2009 Dec 31, 2010 Dec 31, 2009
Realized
Light crude oil ($ millions) (4.8) 3.4 2.9 1.2 70.2
Light crude oil ($ per bbl) (2.39) 1.75 1.42 0.15 8.42
Natural gas ($ millions) 23.9 22.3 25.0 73.9 101.0
Natural gas ($ per mcf) 1.19 1.11 1.17 0.92 1.17
Combined ($ millions) 19.1 25.7 27.9 75.1 171.2
Combined ($ per boe) 2.76 3.83 3.91 2.75 5.90
Unrealized
Total unrealized risk management (liabilities)assets at period end ($ millions) (2.1) 50.4 (9.0) (2.1) (9.0)
Less: Unrealized risk management assets(liabilities) at beginning of period ($ millions) 50.4 51.3 31.1 (9.0) 164.7
Unrealized (loss) gain on risk managementcontracts (52.5) (0.9) (40.1) 6.9 (173.7)
As part of the risk management strategy, Pengrowth uses forward price swaps to manage exposure to commodity price fluctuationsand provide a measure of stability to cash flow.
Despite liquid commodity prices remaining strong through 2010, natural gas prices remained lower than the average price achievedthrough our commodity risk management activities, resulting in a combined realized commodity risk management gain of$19.1 million compared to gains of $25.7 million and $27.9 million in the third quarter of 2010 and fourth quarter of 2009,respectively.
On a year over year basis, average realized prices increased approximately seven percent from the same period last year as a resultof higher crude oil prices. The risk management activities resulted in a realized gain of $73.9 million compared to $101.0 million in2009, for natural gas, whereas the realized gains for light crude were much lower at $1.2 million versus $70.2 million last year.
The change in fair value of the forward contracts between periods affects net income through the unrealized amounts recordedduring the period. The fair value of forward contracts is determined by comparing the contracted fixed price to the forward pricecurve at each period end.
The change in the forward price curve at the end of the fourth quarter compared to the third quarter of 2010 plus fourth quartersettlements resulted in an unrealized commodity risk management loss of approximately $52.5 million. For the same period lastyear, the change in the forward price curve resulted in an unrealized risk management loss of $40.1 million.
For the full year of 2010, the unrealized commodity risk management gain of $6.9 million primarily reflects a weaker natural gasforward price curve from year end 2009. In contrast, through 2009 an unrealized commodity risk management loss of $173.7 millionwas recorded as a result of an increase in the crude oil forward price curve.
16 PENGROWTH 2010 Management’s Discussion & Analysis

As of December 31, 2010, the following commodity risk management contracts were in place:
Crude Oil:
Reference Point Volume (bbl/d) Remaining Term Price per bbl (2)
Financial:
WTI (1) 12,000 Jan 1, 2011 - Dec 31, 2011 $87.87
WTI (1) 5,000 Jan 1, 2012 - Dec 31, 2012 $91.04
Natural Gas:
Reference Point Volume (mmbtu/d) Remaining Term Price per mmbtu (2)
Financial:
AECO 45,021 Jan 1, 2011 - Dec 31, 2011 $ 5.60
Chicago MI (1) 5,000 Jan 1, 2011 - Dec 31, 2011 $ 6.78
Power:
Reference Point Volume (MW) Remaining Term Price per MW (2)
Financial:
AESO 25 Jan 1, 2011 - Dec 31, 2011 $46.34
(1) Associated Cdn $/U.S. $ foreign exchange rate has been fixed.
(2) All prices are referenced in Canadian dollars
Based on our 2011 production forecast the above contracts represent approximately 32 percent of total liquids volumes at anaverage price of $87.87 per bbl and 22 percent of natural gas volumes at $5.71 per mmbtu. The power contract representsapproximately 25 percent of estimated 2011 consumption.
Each $1 per barrel change in future oil prices results in approximately $6.2 million pre-tax change in the value of the crudecontracts, while each $0.25 per mmbtu change in future natural gas prices results in approximately $4.6 million pre-tax change inthe value of the natural gas contracts. The changes in the fair value of the forward contracts directly affects reported net incomethrough the unrealized amounts recorded in the statement of income during the period. The effect on cash flow will be recognizedseparately only upon settlement of the contracts, which could vary significantly from the unrealized amount recorded due to timingand prices when each contract is settled. However, if each contract were to settle at the contract price in effect at December 31,2010, future revenue and cash flow would be $2.1 million lower than that otherwise achievable if the contracts were not in placebased on the estimated fair value of the risk management asset at period end. The $2.1 million net liability is composed of a netasset of $4.6 million relating to contracts expiring within one year and a liability of $6.7 million relating to contracts expiring beyondone year. Pengrowth fixes the Canadian dollar exchange rate at the same time it swaps U.S. dollar denominated commodity in orderto protect against changes in the foreign exchange rate.
Each $1 per MW change in future power prices would result in approximately $0.2 million pre-tax change in the fair value of the riskmanagement contracts.
Pengrowth has not designated any outstanding commodity contracts as hedges for accounting purposes and therefore recordsthese contracts on the balance sheet at their fair value and recognizes changes in fair value in the income statement as unrealizedcommodity risk management gains or losses. There will continue to be volatility in earnings to the extent that the fair value ofcommodity contracts fluctuate, however these non-cash amounts do not impact Pengrowth’s operating cash flow. Realizedcommodity risk management gains or losses are recorded in oil and gas sales on the income statement and impacts cash flow atthat time.
In accordance with policies approved by the Board of Directors, Pengrowth may sell forward its production by product volume orpower consumption as follows:
Percent of Monthly Company Interest Production Forward Period
Up to 65% 1 - 12 Months
Up to 45% 13 - 24 Months
Up to 30% 25 - 36 Months
PENGROWTH 2010 Management’s Discussion & Analysis 17

Each commodity risk management transaction for natural gas or crude oil shall not exceed 20,000 mmbtu per day and 2,500 bblsper day respectively. Each power consumption risk management transaction shall not exceed 25 MW.
OIL AND GAS SALES
Contribution Analysis
The following table shows the contribution of each product to the overall sales revenue inclusive of realized commodity riskmanagement activity.
Three months ended Twelve months endedSales Revenue($ millions except percentages)
Dec 31,2010
% oftotal
Sept 30,2010
% oftotal
Dec 31,2009
% oftotal
Dec 31,2010
% oftotal
Dec 31,2009
% oftotal
Light crude oil 150.1 44 142.6 45 153.0 43 595.5 44 603.2 45
Natural gas 97.6 29 93.5 29 116.8 33 400.4 30 444.8 33
Natural gas liquids 53.1 16 43.7 14 47.9 13 199.9 15 147.4 11
Heavy oil 37.1 11 35.0 11 41.4 11 149.2 11 145.3 11
Brokered sales/sulphur 2.8 – 2.7 1 0.2 – 8.3 – 2.5 –
Total oil and gas sales 340.7 317.5 359.3 1,353.3 1,343.2
Price and Volume Analysis
The following table illustrates the effect of changes in prices and volumes on the components of oil and gas sales including theimpact of realized commodity risk management activity, for the fourth quarter of 2010 compared to the fourth quarter of 2009.
($ millions) Light oil Natural gas NGLs Heavy oil Other (1) Total
Quarter ended December 31, 2009 153.0 116.8 47.9 41.4 0.2 359.3
Effect of change in product prices 6.0 (12.4) 2.1 (1.1) – (5.4)
Effect of change in sales volumes (1.3) (5.8) 3.1 (3.2) – (7.2)
Effect of change in realized commodity risk management activities (7.7) (1.1) – – – (8.8)
Other 0.1 0.1 – – 2.6 2.8
Quarter ended December 31, 2010 150.1 97.6 53.1 37.1 2.8 340.7
(1) Primarily sulphur sales
The following table illustrates the effect of changes in prices and volumes on the components of oil and gas sales including theimpact of realized commodity risk management activity, for the full year of 2010 compared to same period of 2009.
($ millions) Light oil Natural gas NGLs Heavy oil Other (1) Total
Year ended December 31, 2009 603.2 444.8 147.4 145.3 2.5 1,343.2
Effect of change in product prices 86.9 9.0 52.2 18.6 – 166.7
Effect of change in sales volumes (25.6) (26.0) 0.3 (14.7) – (66.0)
Effect of change in realized commodity risk management activities (68.9) (27.1) – – – (96.0)
Other (0.1) (0.3) – – 5.8 5.4
Year ended December 31, 2010 595.5 400.4 199.9 149.2 8.3 1,353.3
(1) Primarily sulphur sales
18 PENGROWTH 2010 Management’s Discussion & Analysis

ROYALTY EXPENSE
Three months ended Twelve months ended($ millions) Dec 31, 2010 Sept 30, 2010 Dec 31, 2009 Dec 31, 2010 Dec 31, 2009
Royalty expense 60.9 55.3 71.0 252.7 207.6
$ per boe 8.83 8.26 9.95 9.27 7.15
Royalties as a percent of sales 17.9% 17.4% 19.7% 18.7% 15.5%
Royalties as a percent of sales excludingrealized risk management contracts 18.9% 18.9% 21.4% 19.8% 17.7%
Royalties include Crown, freehold, overriding royalties and mineral taxes. Royalty payments are based on revenue beforecommodity risk management activities; however gains or losses from realized commodity risk management activities are reportedas part of revenue and therefore affect royalty rates as a percentage of sales. Fourth quarter royalty rates remained steadycompared to the third quarter of 2010. Royalty incentives for new wells at Carson Creek positively affected the royalty ratecomparing the fourth quarters of 2010 and 2009. Higher liquid commodity prices through 2010 is the main factor impacting theroyalty rate compared to 2009 where liquids commodity prices were lower and therefore benefited from changes to the Albertaroyalty regime that became effective January 1, 2009.
Royalty expense for 2011 is forecasted to be approximately 20 percent of Pengrowth’s sales excluding the impact of riskmanagement contracts.
OPERATING EXPENSES
Three months ended Twelve months ended($ millions) Dec 31, 2010 Sept 30, 2010 Dec 31, 2009 Dec 31, 2010 Dec 31, 2009
Operating expenses(1) 108.8 84.9 94.0 371.7 384.4
$ per boe 15.77 12.69 13.18 13.63 13.24
(1) Prior period restated to conform to presentation in the current period.
Operating expenses in the fourth quarter of 2010 were approximately 28 percent higher than the third quarter of 2010 (24 percent ona per boe basis). During the fourth quarter, operations teams increased maintenance activities in areas with winter only access(approximately $5 million) and were able to accelerate one time proactive maintenance work (approximately $4 million). In addition,fourth quarter operating expenses were impacted by continued subsurface and optimization activity particularly at Judy Creek(approximately $4 million), higher power costs (approximately $3 million), a prior period operating expense settlement in Fenn BigValley (approximately $3 million), and additional operating costs from the conventional properties acquired with Monterey(approximately $2 million).
Fourth quarter 2010 operating costs compared to the fourth quarter of 2009 increased 16 percent (20 percent on a per boe basis)primarily attributable to higher power costs in the current quarter and unfavourable prior period adjustments stemming fromprevious property acquisitions. Continued effort in overall expense reduction coupled with the absence of unfavourable prior periodadjustments experienced in 2009, resulted in lower operating expenses on a year-over-year basis.
2011 operating expenses are forecast to be $370 million or $13.54 per boe. Power costs are approximately 40 percent ofPengrowth’s operating costs. Pengrowth expects that power costs will remain essentially flat when compared to 2010 and willcontinue to actively manage these costs through its power shedding and risk management programs.
PROCESSING AND OTHER INCOME
Three months ended Twelve months ended($ millions) Dec 31, 2010 Sept 30, 2010 Dec 31, 2009 Dec 31, 2010 Dec 31, 2009
Processing & other income(1) 5.8 4.4 4.1 20.6 18.8
$ per boe 0.84 0.65 0.58 0.76 0.65
(1) Prior period restated to conform to presentation in the current period.
PENGROWTH 2010 Management’s Discussion & Analysis 19

Processing and other income is derived from sales of casinghead gas, fees charged for processing and gathering third party gas,road use, and oil and water processing. Income increased in the fourth quarter of 2010 due to higher road use income andcasinghead sales being recorded. Casinghead sales increased during the fourth quarter and for the full year of 2010 from additionaldevelopment activity at Carson Creek.
This income primarily represents the partial recovery of operating expenses reported separately.
NET OPERATING EXPENSES
Three months ended Twelve months ended($ millions) Dec 31, 2010 Sept 30, 2010 Dec 31, 2009 Dec 31, 2010 Dec 31, 2009
Net operating expenses(1) 103.0 80.5 89.9 351.1 365.6
$ per boe 14.93 12.04 12.60 12.87 12.59
(1) Prior period restated to conform to presentation in the current period.
Included in the table above are operating expenses net of processing and other income.
TRANSPORTATION COSTS
Three months ended Twelve months ended($ millions) Dec 31, 2010 Sept 30, 2010 Dec 31, 2009 Dec 31, 2010 Dec 31, 2009
Light oil transportation 1.9 2.0 1.2 7.3 4.7
$ per bbl 0.92 1.05 0.58 0.92 0.56
Natural gas transportation 2.4 1.5 2.9 8.5 8.8
$ per mcf 0.12 0.08 0.14 0.11 0.10
The increase in light oil transportation comparing the fourth quarters and full years of 2010 and 2009 is mainly attributable totrucking of sales quality NGLs from Carson Creek to the sales point at Whitecourt. Impacting natural gas transportation in thefourth quarter are additional costs incurred from volumes associated with the Monterey acquisition and the non-recurrence of afavorable third quarter adjustment.
Pengrowth incurs transportation costs for its natural gas production once the product enters a pipeline at a title transfer point.Pengrowth also incurs transportation costs on its oil production that includes clean oil trucking charges and pipeline costs up to thecustody transfer point. The transportation cost is dependent upon third party rates and distance the product travels on the pipelineprior to changing ownership or custody. Pengrowth has the option to sell some of its natural gas directly to markets outside ofAlberta by incurring additional transportation costs. Pengrowth sells most of its natural gas without incurring significant additionaltransportation costs. Similarly, Pengrowth has elected to sell approximately 75 percent of its crude oil at market points beyond thewellhead but at the first major trading point, requiring minimal transportation costs.
AMORTIZATION OF INJECTANTS FOR MISCIBLE FLOODS
Three months ended Twelve months ended($ millions) Dec 31, 2010 Sept 30, 2010 Dec 31, 2009 Dec 31, 2010 Dec 31, 2009
Purchased and capitalized 0.3 2.1 4.9 9.3 13.3
Amortization 3.0 3.5 4.4 15.1 20.0
The cost of injectants (primarily natural gas and ethane) purchased for injection in the miscible flood program at Judy Creek andSwan Hills is amortized equally over the period of expected future economic benefit. The costs of purchased injectants areamortized over a 24 month period. As of December 31, 2010, the balance of unamortized injectant costs was $ 10.0 million.
The amount of injectants purchased and capitalized in the fourth quarter of 2010 was lower than the third quarter of 2010 and fourthquarter of 2009 due to timing and the requirements of this program. The value of Pengrowth’s proprietary injectants is not recordedas an asset or a sale; the cost of producing these injectants is included in operating expenses.
20 PENGROWTH 2010 Management’s Discussion & Analysis

OPERATING NETBACKSThere is no standardized measure of operating netbacks and therefore operating netbacks, as presented below, may not becomparable to similar measures presented by other companies. Pengrowth’s operating netbacks have been calculated by takingGAAP balances directly from the income statement and dividing by production. Certain assumptions have been made in allocatingoperating expenses, processing and other income and royalty injection credits between light crude, heavy oil, natural gas andNGL production.
Pengrowth recorded an average operating netback of $24.58 per boe in the fourth quarter of 2010 compared to $26.12 per boe inthe third quarter of 2010 and $26.63 per boe for the fourth quarter of 2009. The decrease in the netback in the fourth quarter of 2010compared to the third quarter of 2010 and the fourth quarter of 2009 is primarily due to higher operating costs. For the full year of2010, operating netbacks were higher than in 2009 as a result of higher net revenues.
The sales price used in the calculation of operating netbacks is after realized commodity risk management gains or losses.Three months ended Twelve months ended
Combined Netbacks ($ per boe) Dec 31, 2010 Sept 30, 2010 Dec 31, 2009 Dec 31, 2010 Dec 31, 2009Oil & gas sales (after commodity risk management) 49.40 47.47 50.37 49.64 46.27Processing and other income (1) 0.84 0.65 0.58 0.76 0.65Royalties (8.83) (8.26) (9.95) (9.27) (7.15)Operating expenses (1) (15.77) (12.69) (13.18) (13.63) (13.24)Transportation costs (0.62) (0.53) (0.57) (0.58) (0.46)Amortization of injectants (0.44) (0.52) (0.62) (0.55) (0.69)Operating netback(1) 24.58 26.12 26.63 26.37 25.38
Three months ended Twelve months endedLight Crude Netbacks ($ per bbl) Dec 31, 2010 Sept 30, 2010 Dec 31, 2009 Dec 31, 2010 Dec 31, 2009Sales price (after commodity risk management) 74.98 73.93 75.79 75.04 72.36Other production income 0.71 0.94 0.23 0.61 0.32Oil & gas sales 75.69 74.87 76.02 75.65 72.68Processing and other income 0.60 0.34 0.46 0.47 0.71Royalties (17.32) (15.04) (17.35) (17.32) (13.65)Operating expenses (1) (18.81) (14.01) (17.86) (16.39) (16.38)Transportation costs (0.92) (1.05) (0.58) (0.92) (0.56)Amortization of injectants (1.52) (1.81) (2.19) (1.90) (2.40)Operating netback (1) 37.72 43.30 38.50 39.59 40.40
Three months ended Twelve months endedHeavy Oil Netbacks ($ per bbl) Dec 31, 2010 Sept 30, 2010 Dec 31, 2009 Dec 31, 2010 Dec 31, 2009Oil & gas sales 60.42 57.80 62.16 60.22 52.72Processing and other income (2) 0.63 1.20 (0.84) 0.19 0.53Royalties (11.25) (9.89) (12.81) (11.84) (8.91)Operating expenses (1) (16.86) (17.22) (12.01) (15.95) (14.35)Operating netback (1) 32.94 31.89 36.50 32.62 29.99
Three months ended Twelve months endedNatural Gas Netbacks ($ per mcf) Dec 31, 2010 Sept 30, 2010 Dec 31, 2009 Dec 31, 2010 Dec 31, 2009Sales price (after commodity risk management) 4.87 4.67 5.45 5.00 5.14Other production income 0.06 0.04 (0.01) 0.04 –Oil & gas sales 4.93 4.71 5.44 5.04 5.14Processing and other income (1) 0.21 0.15 0.18 0.20 0.13Royalties (0.31) (0.45) (0.58) (0.42) (0.31)Operating expenses (1) (2.39) (1.88) (1.85) (2.01) (1.91)Transportation costs (0.12) (0.08) (0.14) (0.11) (0.10)Operating netback (1) 2.32 2.45 3.05 2.70 2.95
Three months ended Twelve months endedNGLs Netbacks ($ per bbl) Dec 31, 2010 Sept 30, 2010 Dec 31, 2009 Dec 31, 2010 Dec 31, 2009Oil & gas sales 56.74 53.55 54.52 56.99 42.12Royalties (13.97) (13.77) (17.06) (14.80) (12.08)Operating expenses (1) (13.56) (12.02) (11.78) (12.17) (12.23)Operating netback (1) 29.21 27.76 25.68 30.02 17.81
(1) Prior period restated to conform to presentation in the current period.(2) Heavy oil processing and other income includes a prior period adjustment for processing income at Tangleflags.
PENGROWTH 2010 Management’s Discussion & Analysis 21

INTEREST AND FINANCING CHARGES
Three months ended Twelve months ended($ millions) Dec 31, 2010 Sept 30, 2010 Dec 31, 2009 Dec 31, 2010 Dec 31, 2009
Interest and Financing charges 19.6 17.0 18.3 70.5 80.3
At December 31, 2010, Pengrowth had long term debt outstanding of $1,024.4 million the majority of which is denominated inforeign currency and $22.0 million in bank indebtedness. Of this, 94 percent is fixed at a weighted average interest rate of6.2 percent, with the remaining six percent subject to floating rates which are presently three percent. The reduction in interestexpense in 2010 compared to 2009 reflects the significant strengthening of the Canadian dollar and the decrease in outstandingindebtedness achieved over the past year and the redemption of the Convertible Unsecured Debentures.
Relative to the third quarter 2010, interest and financing charges increased $2.6 million due to fees related to the renewal of thecredit facility and the resulting adjustment of its fee structure to current market rates.
GENERAL AND ADMINISTRATIVE EXPENSES
Three months ended Twelve months ended($ millions) Dec 31, 2010 Sept 30, 2010 Dec 31, 2009 Dec 31, 2010 Dec 31, 2009
Cash G&A expense 12.1 10.7 14.7 46.3 54.1
$ per boe 1.76 1.60 2.06 1.70 1.86
Non-cash G&A expense (1.0) 0.3 (0.6) 4.6 8.1
$ per boe (0.16) 0.04 (0.08) 0.17 0.28
Total G&A 11.1 11.0 14.1 50.9 62.2
$ per boe 1.61 1.63 1.98 1.87 2.14
The cash component of general and administrative (G&A) expenses increased $1.4 million in the fourth quarter of 2010 compared tothe third quarter of 2010 mainly attributable to legal fees, the special trust unitholders’ meeting and other costs incurred related tothe corporate conversion. In comparing to the same periods of 2009, a shift in focus for the corporation in 2010 coupled with costcontrol initiatives led to expense savings in a number of areas including third party consulting fees and legal fees related tobusiness development activities.
The non-cash component of G&A represents the compensation expense associated with Pengrowth’s Long Term Incentive Plans(LTIP) see Note 13 to the financial statements. The compensation costs associated with these plans are expensed over theapplicable vesting period. The decrease in the fourth quarter and for the full year of 2010 was primarily due to a change in theestimated performance multiplier on the 2008 Deferred Entitlement Unit grant vesting in the first quarter of 2011 (this change inestimate impacted non-cash G&A approximately $5.3 million year-over-year).
Total G&A costs are expected to increase for 2011 to $2.69 per boe when compared to full year 2010 of $1.87 per boe. Included inPengrowth's 2011 G&A forecast, are non-cash G&A costs of approximately $0.47 per boe compared to $0.17 per boe in 2010.
RELATED PARTY TRANSACTIONSThe management agreement with Pengrowth Management Limited (“the Manager”) expired on June 30, 2009. No fees to theManager have been incurred subsequent to the second quarter of 2009, where the total amount paid was $2.8 million.
A senior officer of the Corporation was a member of the Board of Directors of Monterey, a company that Pengrowth acquired inSeptember 2010 (see Note 4 to the financial statements).
OTHER EXPENSE (INCOME)Included in other income and expenses for the full year of 2010 is a $16.7 million gain composed of a $5.4 million gain realized onpurchasing drilling credits from a third party, and an $11.3 million gain resulting from a property disposition where the proceedsreceived consisted of $17.0 million of drilling credits.
22 PENGROWTH 2010 Management’s Discussion & Analysis

GAIN ON EQUITY INVESTMENTPengrowth completed an acquisition of Monterey on September 15, 2010 as described in Note 4 of the consolidated financialstatements. Under the new accounting guidance for business combinations, Pengrowth was required to fair value it’s previouslyheld equity investment in Monterey and as a result, a non-cash gain of $73.8 million arising from the difference between the fairvalue and the book value of this investment prior to the acquisition was recorded in the consolidated statements of income. The fairvalue of Pengrowth’s previously held equity investment in Monterey was included in the purchase consideration.
TAXES
Future Income Taxes
Future income tax is a non-cash item relating to temporary differences between the accounting and tax basis of Pengrowth’s assetsand liabilities and has no immediate impact on Pengrowth’s cash flows. During the year ended December 31, 2010, Pengrowthrecorded a future tax reduction of $44.8 million. The future income tax reduction includes approximately $77.6 million related totaxable income earned by the Trust where both the income tax and future tax liabilities are the responsibility of the trustunitholders, offset by temporary differences relating to unrealized risk management gains. See Note 11 to the financial statementsfor additional information.
FOREIGN CURRENCY GAINS & LOSSES
Three months ended Twelve months ended($ millions) Dec 31, 2010 Sept 30, 2010 Dec 31, 2009 Dec 31, 2010 Dec 31, 2009
Unrealized foreign exchange gain (loss) ontranslation of U.S. dollar denominated debt 31.0 32.1 17.1 50.7 144.5
Unrealized foreign exchange gain (loss) ontranslation of U.K. pound sterlingdenominated debt 3.3 (1.3) 0.6 7.4 3.8
34.3 30.8 17.7 58.1 148.3
Unrealized (loss) gain on foreign exchange riskmanagement contract on U.K. pound sterlingdenominated debt (4.5) (0.2) 0.4 (8.1) 0.9
Total Unrealized foreign exchange gain 29.7 30.6 18.1 49.9 149.2
Realized foreign exchange gain (loss) – 0.5 (0.1) (2.1) 0.5
The total unrealized foreign exchange gain in the fourth quarter was $29.7 million compared to an unrealized foreign exchange gainof $30.6 million and $18.1 million in the third quarter 2010 and fourth quarter 2009, respectively. The primary source of Pengrowth’sunrealized foreign exchange gains and losses is attributed to the translation of the foreign denominated long term debt. The gainsor losses are calculated by comparing the translated Canadian dollar balance of foreign denominated long term debt from onequarter end to another. The unrealized foreign exchange gain this quarter was mainly the result of an increase in the closingexchange rate of the Canadian dollar to U.S. dollar since September 30, 2010.
As some realized commodity prices are derived from U.S. denominated benchmarks, a weaker U.S. dollar negatively impacts oil andgas revenues. To mitigate this, Pengrowth elects to hold a portion of its long term debt in U.S. dollars as a natural hedge. Therefore,a decline in revenues as a result of foreign exchange fluctuations will be partially offset by a reduction in U.S. dollar interestexpense.
DEPLETION, DEPRECIATION AND ACCRETION
Three months ended Twelve months ended($ millions) Dec 31, 2010 Sept 30, 2010 Dec 31, 2009 Dec 31, 2010 Dec 31, 2009
Depletion and depreciation 132.4 128.8 144.3 529.4 591.4
$ per boe 19.20 19.25 20.23 19.42 20.38
Accretion 5.7 5.8 7.1 23.0 27.7
$ per boe 0.83 0.87 1.00 0.84 0.95
PENGROWTH 2010 Management’s Discussion & Analysis 23

Depletion and depreciation of property, plant and equipment is calculated using the unit of production method based on total provedreserves. Depletion and depreciation expense decreased ten percent year over year as a result of lower production volumes andlower cost reserve additions in 2010. On a per boe basis, the depletion cost was relatively flat in the fourth quarter of 2010 comparedto the third quarter of 2010, however higher production volumes yielded a slightly higher depletion and depreciation expense in thefourth quarter. The prior year depletion and depreciation also reflects the impact of 2009 reserve negative revisions which increasedthe depletion rate per boe.
Pengrowth’s Asset Retirement Obligations (ARO) liability is increased for the passage of time (unwinding of the discount) through acharge to earnings that is referred to as accretion. Accretion is charged to net income over the lifetime of the producing oil and gasassets. Accretion expense decreased year over year and in the fourth quarter of 2010 compared to the same period last year as aresult of reductions to the ARO liability at the end of 2009 and in the latter part of this year. The reduction to the ARO liability in 2010were due to changes in the inflation rate assumption used in the calculation from two percent per annum to one and one halfpercent per annum and changes to the estimated timing of abandonment and reclamation. Management reviews the cost estimatesand timing assumptions related to the ARO liability at least annually which may result in a revision to the ARO liability.
CEILING TESTUnder Canadian GAAP, a ceiling test is applied to the carrying value of the property, plant and equipment and other assets. Thecarrying value is assessed to be recoverable when the sum of the undiscounted cash flow expected from the production of provedreserves, the lower of cost and market of unproved properties, and the cost of major development projects exceeds the carryingvalue. When the carrying value is not assessed to be recoverable, an impairment loss is recognized to the extent that the carryingvalue of assets exceeds the sum of the discounted cash flow expected from the production of proved and probable reserves, thelower of cost and market of unproved properties, and the cost of major development projects. The cash flow is estimated usingexpected future product prices and costs and are discounted using a risk-free interest rate, when required. There was a significantsurplus in the Canadian GAAP ceiling test at December 31, 2010 and 2009.
ASSET RETIREMENT OBLIGATIONSThe total future ARO is based on management’s estimate of costs to remediate, reclaim and abandon wells and facilities havingregard for Pengrowth’s working interest and the estimated timing of the costs to be incurred in future periods. Pengrowth hasdeveloped an internal process to calculate these estimates which considers applicable regulations, actual and anticipated costs,type and size of well or facility and the geographic location.
For the year ended December 31, 2010 Pengrowth’s ARO liability decreased $29.3 million, including a revision of approximately$42 million. The revision was primarily a result of changes to the inflation rate from two percent per annum to one and one halfpercent per annum and changes to the timing of future abandonment, reclamation and remediation work. The inflation rate isbased on current expectations and experience. The change in estimate was made on a prospective basis; a correspondingadjustment was made to the related asset. Pengrowth has estimated the net present value of its total ARO to be $260 million as atDecember 31, 2010 (December 31, 2009 – $289 million), based on a total escalated future liability of $1.8 billion (December 31,2009 – $2.0 billion). These costs are expected to be incurred over 50 years with the majority of the costs incurred between 2041 and2061. A credit adjusted risk free rate of eight percent was used to calculate the net present value of the ARO.
REMEDIATION TRUST FUNDS AND REMEDIATION AND ABANDONMENT EXPENSEDuring 2010, Pengrowth contributed $7.6 million into trust funds established to fund certain abandonment and reclamation costsassociated with Judy Creek and SOEP. The balance in these remediation trust funds was $42.1 million at December 31, 2010.
Every five years Pengrowth must evaluate the value of the assets in the Judy Creek remediation trust fund and the outstanding ARO,and make recommendations to the former owner of the Judy Creek properties as to whether contribution levels should be changed.The next evaluation is anticipated to occur in 2012. Contributions to the Judy Creek remediation trust fund may change based onfuture evaluations of the fund.
As a working interest holder in SOEP, Pengrowth is under a contractual obligation to contribute to a remediation trust fund. Thefunding levels are based on the feedstock handled and delivered to the various facilities; funding levels for this fund may changeeach year pending a review by the owners.
Pengrowth takes a proactive approach to managing its well abandonment and site restoration obligations. There is an on-goingprogram to abandon wells and reclaim well and facility sites. Through December 31, 2010, Pengrowth spent $20.9 million onabandonment and reclamation (December 31, 2009 – $18.0 million). Pengrowth expects to spend approximately $19 million in 2011on reclamation and abandonment, excluding contributions to remediation trust funds and orphan well levies from the AlbertaEnergy Resources Conservation Board.
24 PENGROWTH 2010 Management’s Discussion & Analysis

CLIMATE CHANGE PROGRAMSSince becoming effective July 1, 2007, Alberta regulates GHG emissions under the Climate Change and Emissions Management Act,the Specified Gas Reporting Regulation (the “SGRR”), which imposes GHG emissions reporting requirements, and the Specified GasEmitters Regulation (the “SGER”) which imposes GHG emissions limits. These regulations require Alberta facilities that emit morethan 100,000 tonnes of greenhouse gases a year to reduce emissions intensity by 12 percent over the average emission levels of2003, 2004 and 2005. Companies can make their reductions through improvements to their operations; by purchasing Alberta-based offset credits or by contributing to the Climate Change and Emissions Management Fund. Pengrowth currently operates twofacilities that are subject to the Alberta climate change regulations. Collectively, these facilities have reduced emissions byapproximately 29 percent from the base line emissions (2009 data). This reduction exceeds current-day requirements. Pengrowth isassessing options for meeting future greenhouse gas emission requirements. However, if the emissions remain at the currentlevels, Pengrowth may experience additional annual costs of as much as $0.5 million for the acquisition of credits relating to thefacilities to meet future baseline requirements. For further information, see Pengrowth’s AIF. Pengrowth is waiting on additionalinformation from other jurisdictions to assess the impact it will have on its operations.
GOODWILLAs at December 31, 2010, Pengrowth had a recorded goodwill amount of $712.7 million. The $51 million increase in goodwill in thecurrent period is due to the acquisition of Monterey.
In accordance with GAAP, the goodwill balance must be assessed for impairment at least annually or more frequently if events orchanges in circumstances indicate that the balance might be impaired. If such impairment exists, it would be charged to income inthe period in which the impairment occurs. Management has assessed goodwill for impairment and determined there is noimpairment at December 31, 2010.
WORKING CAPITALThe working capital deficiency decreased at December 31, 2010 by $125.4 million compared to December 31, 2009. The change inworking capital is primarily attributable to the maturity of the U.S. $150 million term notes on April 23, 2010. The repayment of theU.S. term notes was financed with the issuance of new U.S. dollar term notes in May 2010.
FINANCIAL RESOURCES AND LIQUIDITYAs at ($ thousands) : Dec 31, 2010 Dec 31, 2009 ChangeTerm credit facilities $ 39,000 $ 60,000 $ (21,000)Senior unsecured notes (1) 985,367 847,599 137,768Current portion of long term debt – 157,546 (157,546)Convertible debentures – 74,828 (74,828)Total outstanding debt 1,024,367 1,139,973 (115,606)Working capital deficiency excluding current portion of long term debt 91,629 59,461 32,168Total debt including convertible debentures $1,115,996 $1,199,434 $ (83,438)Total debt excluding convertible debentures $1,115,996 $1,124,606 $ (8,610)
Years Ended Dec 31, 2010 Dec 31, 2009 ChangeNet income $ 230,257 $ 84,853 $ 145,404Add:
Interest and financing charges 70,464 80,274 (9,810)Future tax reduction (44,829) (142,945) 98,116Depletion, depreciation, amortization and accretion 552,356 619,032 (66,676)Other non-cash (income) expenses (115,566) 44,482 (160,048)
EBITDA $ 692,682 $ 685,696 $ 6,986Total debt including convertible debentures to EBITDA 1.6 1.7 (0.1)Total debt excluding convertible debentures to EBITDA 1.6 1.6 –Total Capitalization including convertible debentures (2) (3) $4,211,343 $3,935,174 $ 276,169Total Capitalization excluding convertible debentures (2) (3) $4,211,343 $3,860,346 $ 350,997Total debt including convertible debentures as a percentage of total capitalization (2) 26.5% 30.5% (4.0%)Total debt excluding convertible debentures as a percentage of total capitalization (2) 26.5% 29.1% (2.6%)
(1) Non-current portion of long term debt.(2) Prior period restated to conform to presentation in the current period.(3) Total capitalization includes total outstanding debt plus Shareholders’ Equity.
(Total outstanding debt excludes working capital deficit (excess) but includes current portion of long term debt.)
PENGROWTH 2010 Management’s Discussion & Analysis 25

Term Credit Facilities
At December 31, 2010, Pengrowth had a $1.0 billion revolving credit facility which was renewed during the fourth quarter of 2010.The credit facility was reduced by $39 million in borrowings and $18 million in outstanding letters of credit. The credit facility alsoincludes a $250 million expansion feature. In total, the credit facility provides Pengrowth with up to $1.25 billion of credit capacityfrom a syndicate of seven Canadian and three foreign banks and expires on October 29, 2013. Pengrowth also maintains a$50 million demand operating facility with one Canadian bank which is reduced by borrowings of $22 million and $5 million inoutstanding letters of credit. Together these two facilities provide Pengrowth with up to $1.2 billion of available credit atDecember 31, 2010.
Senior Unsecured Notes
On April 23, 2010, U.S $150 million in senior unsecured notes matured resulting in the realization of a cumulative $66 millionforeign exchange gain previously recognized. The maturity was temporarily funded with borrowings from the revolving credit facilityuntil a new issue of U.S. $187 million senior unsecured notes closed on May 11, 2010. The new notes were issued in two tranches,U.S. $71.5 million due May 2015 and U.S $115.5 million due May 2020 bearing interest at 4.67 and 5.98 percent respectively.
Convertible Debentures
On January 14, 2010, Pengrowth redeemed all of the outstanding Convertible Unsecured Subordinated Debentures.
Financial Covenants
Pengrowth’s senior unsecured notes and credit facilities are subject to a number of covenants, all of which were met at all timesduring the preceding twelve months, and at December 31, 2010. All loan agreements are filed on SEDAR (www.sedar.com) as“Other” or “Material Document”.
The calculation for each financial covenant is based on specific definitions, is not in accordance with GAAP and cannot be readilyreplicated by referring to Pengrowth’s financial statements. The financial covenants are substantially similar between the creditfacilities and the senior unsecured notes.
Key financial covenants are summarized below:
1. Total senior debt must not exceed 3.0 times EBITDA for the last four fiscal quarters;
2. Total debt must not exceed 3.5 times EBITDA for the last four fiscal quarters;
3. Total senior debt must be less than 50 percent of total book capitalization; and
4. EBITDA must not be less than four times interest expense.
There may be instances, such as financing an acquisition, where it would be acceptable for total debt to trailing EBITDA to betemporarily offside. In the event of a significant acquisition, certain credit facility financial covenants are relaxed for two fiscalquarters after the close of the acquisition. Pengrowth may prepare pro forma financial statements for debt covenant purposes andhas additional flexibility under its debt covenants for a set period of time. This would be a strategic decision recommended bymanagement and approved by the Board of Directors with steps taken in the subsequent period to restore Pengrowth’s capitalstructure based on its capital management objectives.
Failing a financial covenant may result in one or more of Pengrowth’s loans being in default. In certain circumstances, being indefault of one loan will, absent a cure, result in other loans also being in default. In the event that non compliance continued,Pengrowth would have to repay the debt, refinance the debt or negotiate new terms with the debt holders and may have to suspenddividends to shareholders.
If certain financial ratios reach or exceed certain levels, management may consider steps to improve these ratios. These steps mayinclude, but are not limited to, raising equity, property dispositions, reducing capital expenditures or dividends. Details of thesemeasures are included in Note 19 to the December 31, 2010, audited consolidated financial statements.
Dividend Reinvestment Plan
In conjunction with the conversion of the Trust into a corporation, Pengrowth revised its Dividend Reinvestment Plan (“DRIP”). DRIPentitles shareholders to reinvest cash dividends in additional shares of the Corporation. Under the revised DRIP, the shares areissued from treasury at a five percent discount to the weighted average closing price of all shares traded on the TSX for the fivetrading days preceding a dividend payment date.
26 PENGROWTH 2010 Management’s Discussion & Analysis

Previously, the Trust had a similar program where unitholders were entitled to reinvest cash distributions in additional trust units ofthe Trust. The trust units under this plan were issued from treasury at a five percent discount to the weighted average closing priceof all trust units traded on the TSX for the 20 trading days preceding a distribution payment date.
For the year ended December 31, 2010, 2.3 million trust units were issued for cash proceeds of $24.1 million under thereinvestment plan compared to 3.0 million trust units for cash proceeds of $26.3 million at December 31, 2009.
Pengrowth does not have any off balance sheet financing arrangements.
FINANCIAL INSTRUMENTSFinancial instruments are utilized by Pengrowth to manage its exposure to commodity price fluctuations, foreign currency andinterest rate exposures. Pengrowth’s policy is not to utilize financial instruments for trading or speculative purposes. Please seeNote 2 to the financial statements for a description of the accounting policies for financial instruments and Note 20 to the financialstatements for additional information regarding market risk, credit risk, liquidity risk and fair value of Pengrowth’s financialinstruments.
CASH FLOW AND DISTRIBUTIONS/DIVIDENDSThe following table provides cash flow from operating activities, net income and distributions declared with the excess (shortfall)over distributions and payout ratio:
Three months ended Twelve months ended($ thousands, except per trust unit amounts) Dec 31, 2010 Sept 30, 2010 Dec 31, 2009 Dec 31, 2010 Dec 31, 2009
Cash flow from operating activities 137,783 159,926 149,933 605,995 551,350
Net income 1,937 125,632 50,523 230,257 84,853
Distributions declared 45,118 (1) 65,254 60,880 232,584 (1) 287,853
Distributions declared per trust unit 0.14 (1) 0.21 0.21 0.77 (1) 1.08
Excess of cash flow from operating activitiesover distributions declared 92,665 94,672 89,053 373,411 263,497
Per trust unit 0.28 0.32 0.32 1.24 1.00
(Shortfall) Surplus of net income (loss) overdistributions declared (43,181) 60,378 (10,357) (2,327) (203,000)
Per trust unit (0.13) 0.20 (0.04) (0.01) (0.77)
Payout Ratio 33% 41% 41% 38% 52%
(1) Reflects one month less of distribution declared as a result of the corporate conversion.
As a result of the depleting nature of Pengrowth's oil and gas assets, capital expenditures are required to offset production declineswhile other capital is required to maintain facilities, acquire prospective lands and prepare future projects. Capital spending andacquisitions may be funded by the excess of cash flow from operating activities over distributions declared, through additional debtor the issuance of equity. Pengrowth does not deduct capital expenditures when calculating cash flow from operating activities.However, Pengrowth does deduct costs associated with environmental activities when calculating cash flow from operatingactivities.
Cash flow from operating activities is derived from producing and selling oil, natural gas and related products. As such, cash flowfrom operating activities is highly dependent on commodity prices. Pengrowth entered into forward commodity contracts to mitigateprice volatility and to provide a measure of stability to monthly cash flow. Details of commodity contracts are contained in Note 20 tothe financial statements.
DIVIDENDSThe board of directors and management regularly review the level of dividends. The board considers a number of factors, includingexpectations of future commodity prices, capital expenditure requirements, and the availability of debt and equity capital. As a resultof the volatility in commodity prices, changes in production levels and capital expenditure requirements, there can be no certaintythat Pengrowth will be able to maintain current levels of dividends and dividends can and may fluctuate in the future. Pengrowthhas no restrictions on the payment of its dividends other than maintaining its financial covenants in its borrowings.
PENGROWTH 2010 Management’s Discussion & Analysis 27

Cash dividends are generally paid to shareholders on or about the 15th day of the month. Pengrowth paid $0.21 per trust unit ascash distributions in each of the quarters of 2010.
SUMMARY OF QUARTERLY RESULTSThe following table is a summary of quarterly information for 2010 and 2009.
2010 Q1 Q2 Q3 Q4
Oil and gas sales ($000's) 358,131 336,957 317,505 340,690
Net income/(loss) ($000's) 108,816 (6,128) 125,632 1,937
Net income/(loss) per share ($) 0.37 (0.02) 0.42 0.01
Net income/(loss) per share – diluted ($) 0.37 (0.02) 0.42 0.01
Cash flow from operating activities ($000's) 146,736 161,550 159,926 137,783
Distributions declared ($000's) 61,037 61,175 65,254 45,118 (1)
Distributions declared per unit ($) 0.21 0.21 0.21 0.14 (1)
Daily production (boe) 75,627 75,517 72,704 74,953
Total production (mboe) 6,806 6,872 6,689 6,896
Average realized price ($ per boe) 52.49 48.75 47.07 49.01
Operating netback ($ per boe) 27.58 27.16 26.12 24.58
2009 Q1 Q2 Q3 Q4
Oil and gas sales ($000's) 322,973 335,634 325,264 359,296
Net income/(loss) ($000's) (54,232) 10,272 78,290 50,523
Net income/(loss) per share ($) (0.21) 0.04 0.30 0.18
Net income/(loss) per share – diluted ($) (0.21) 0.04 0.30 0.18
Cash flow from operating activities ($000's) 94,386 144,116 162,915 149,933
Distributions declared ($000's) 77,212 77,526 72,235 60,880
Distributions declared per unit ($) 0.30 0.30 0.27 0.21
Daily production (boe) 80,284 82,171 78,135 77,529
Total production (mboe) 7,226 7,478 7,188 7,133
Average realized price ($ per boe) 44.57 44.74 45.22 50.35
Operating netback ($ per boe) (2) 26.63 24.71 26.28 23.87
(1) Reflects one month less of distribution declared as a result of the corporate conversion.
(2) Prior period restated to conform to presentation in the current period.
In addition to natural decline, production changes over these quarters was a result of non-core property dispositions in the fourthquarter of 2009 and production limitations due to plant turnarounds and unscheduled maintenance in the third quarter of 2010 andthe second and third quarters of 2009, partly offset by the Monterey acquisition in the third quarter of 2010. Changes in commodityprices have affected oil and gas sales, which have been partially muted by risk management activity to mitigate price volatility and toprovide a measure of stability to monthly cash flow. Quarterly net income (loss) in 2010 and 2009 has also been impacted bynon-cash charges, in particular depletion, depreciation and amortization, accretion of ARO, unrealized mark-to-market gains andlosses, unrealized foreign exchange gains and losses, and future taxes. Cash flow was impacted by changes in operating andgeneral and administrative costs.
28 PENGROWTH 2010 Management’s Discussion & Analysis

SELECTED ANNUAL INFORMATION
The table below provides a summary of selected annual financial information for the years ended 2010, 2009, and 2008.
Twelve months ended December 31($ thousands) 2010 2009 2008
Oil and gas sales 1,353,283 1,343,167 1,919,049
Net income 230,257 84,853 395,850
Net income per share (1) ($) 0.76 0.32 1.58
Net income per share (1) – diluted ($) 0.76 0.32 1.58
Distributions declared per trust unit ($) 0.77 (2) 1.08 2.59
Total assets 5,042,766 4,693,604 5,317,341
Long term debt(3) 1,024,367 982,427 1,599,418
Shareholders' equity (1) 3,186,976 2,795,201 2,663,805
Number of shares outstanding at year end (thousands) (1) 326,024 289,835 256,076
(1) Comparative amounts are Trust units and Trust Unitholders' Equity.
(2) Reflects one month less of distribution declared as a result of the corporate conversion.
(3) Includes long term debt and convertible debentures.
Oil and gas sales for 2010 increased as a result of higher liquids prices through the year partly offset by lower production volumesprimarily due to natural decline. Higher realized commodity prices for the first three quarters of 2008 were the main contributor tohigher oil and gas sales values compared to 2009 and 2010. Net income and dividends declared are strongly linked to oil and gassales. Long term debt is lower at December 31, 2010 and 2009 than in 2008 due mainly to $285 million of net proceeds from anequity issue being applied to the credit facility, and the repayment of the convertible debentures early in 2010.
COMMITMENTS AND CONTRACTUAL OBLIGATIONS
($ thousands) 2011 2012 2013 2014 2015 thereafter Total
Long term debt (1)(2) – – 88,730 – 148,679 791,285 1,028,694
Interest payments on long term debt (3) 63,087 63,087 60,985 59,078 56,600 120,848 423,685
Other (4) 13,571 13,430 13,335 12,840 12,153 23,268 88,597
76,658 76,517 163,050 71,918 217,432 935,401 1,540,976
Purchase obligations
Pipeline transportation 28,477 27,286 17,489 15,862 14,469 393 103,976
CO2 purchases (5) 3,114 2,811 2,828 2,843 2,860 818 15,274
31,591 30,097 20,317 18,705 17,329 1,211 119,250
Remediation trust fund payments 250 250 250 250 250 11,250 12,500
108,499 106,864 183,617 90,873 235,011 947,862 1,672,726
(1) The debt repayment includes the principal owing at maturity on foreign denominated fixed rate debt translated using the year end exchangerate. (see Note 9 of the financial statements)
(2) The revolving credit facility matures in 2013. (see Note 9 of the financial statements)
(3) Interest payments are calculated at period end exchange rates and interest rates except for foreign denominated fixed rate debt which iscalculated at the actual interest rate.
(4) Includes office rent and vehicle leases.
(5) For the Weyburn CO2 project, prices are denominated in U.S. dollars and have been translated at the year-end exchange rate.
PENGROWTH 2010 Management’s Discussion & Analysis 29

SUMMARY OF COMMON SHARE TRADING DATA
High Low Close Volume (000s) Value ($ millions)
TSX - PGF ($ Cdn)
2010 1st quarter 11.96 10.15 11.75 33,376 372.7
2nd quarter 12.00 8.50 9.73 34,038 361.0
3rd quarter 11.44 9.40 11.34 47,522 488.8
4th quarter 13.38 11.29 12.78 70,469 896.9
Year 13.38 8.50 12.78 185,405 2,119.4
2009 1st quarter 12.33 5.84 7.10 30,564 252.6
2nd quarter 9.81 6.71 9.18 26,934 233.8
3rd quarter 11.33 7.49 11.33 28,766 269.0
4th quarter 11.39 9.40 10.15 42,483 439.2
Year 12.33 5.84 10.15 128,747 1,194.6
NYSE - PGH ($ U.S.)
2010 1st quarter 11.78 9.78 11.66 20,473 218.8
2nd quarter 11.97 7.67 9.16 26,059 268.7
3rd quarter 11.10 8.85 11.06 20,153 200.0
4th quarter 13.25 11.02 12.86 19,810 245.0
Year 13.25 7.67 12.86 86,493 932.5
2009 1st quarter 10.11 4.51 5.58 28,538 195.8
2nd quarter 9.00 5.30 7.90 27,305 205.8
3rd quarter 10.54 6.43 10.51 23,914 203.1
4th quarter 10.52 8.81 9.63 29,823 290.7
Year 10.54 4.51 9.63 109,580 895.4
BUSINESS RISKSThe amount of dividends available to shareholders and the value of Pengrowth common shares are subject to numerous riskfactors. As the common shares allow investors to participate in the net cash flow from Pengrowth’s portfolio of producing oil andnatural gas properties, the principal risk factors that are associated with the oil and gas business include, but are not limited to, thefollowing influences:
Risks associated with Commodity Prices• The prices of Pengrowth’s products (crude oil, natural gas, and NGLs) fluctuate due to many factors including local and
global market supply and demand, weather patterns, pipeline transportation and political and economic stability.
• Production could be shut-in at specific wells or fields in low commodity prices.
• Substantial and sustained reductions in commodity prices or equity markets, including Pengrowth’s share price, in somecircumstances could result in Pengrowth reducing the recorded book value of some of its assets.
Risks associated with Liquidity• Capital markets may restrict Pengrowth’s access to capital and raise its borrowing costs. To the extent that external
sources of capital become limited or cost prohibitive, Pengrowth’s ability to fund future development and acquisitionopportunities may be impaired.
• Pengrowth is exposed to third party credit risk through its oil and gas sales, financial hedging transactions and jointventure activities. The failure of any of these counterparties to meet their contractual obligations could adversely impactPengrowth. In response, Pengrowth has established a credit policy designed to mitigate this risk and monitors itscounterparties on a regular basis.
30 PENGROWTH 2010 Management’s Discussion & Analysis

• Changing interest rates influence borrowing costs and the availability of capital.
• Failing a financial covenant may result in one or more of Pengrowth’s loans being in default. In certain circumstances,being in default of one loan will result in other loans also being in default. In the event that non compliance continued,Pengrowth would have to repay the debt, refinance the debt or negotiate new terms with the debt holders and may have tosuspend dividends to shareholders.
• Pengrowth’s indebtedness may limit the amount of dividends that we are able to pay our shareholders, and if we default onour debts, the net proceeds of any foreclosure sale would be allocated to the repayment of our lenders, note holders andother creditors and only the remainder, if any, would be available for dividend to our shareholders.
Risks associated with Legislation and Regulatory Changes• Government royalties, income taxes, commodity taxes and other taxes, levies and fees have a significant economic impact
on Pengrowth’s financial results. Changes to federal and provincial legislation governing such royalties, taxes and feescould have a material impact on Pengrowth’s financial results and the value of Pengrowth’s common shares.
• Environmental laws and regulatory initiatives impact Pengrowth financially and operationally. We may incur substantialcapital and operating expenses to comply with increasingly complex laws and regulations covering the protection of theenvironment and human health and safety. In particular, we may be required to incur significant costs to comply withfuture regulations to reduce greenhouse gas and other emissions.
• Changes to accounting policies, including the implementation of IFRS, may result in significant adjustments to ourfinancial results, which could negatively impact our business, including increasing the risk of failing a financial covenantcontained within our credit facility.
Risks associated with Operations• The marketability of our production depends in part upon the availability, proximity and capacity of gathering systems,
pipelines and processing facilities. Operational or economic factors may result in the inability to deliver our products tomarket.
• Increased competition for properties could drive the cost of acquisitions up and expected returns from the propertiesdown.
• Timing of oil and gas operations is dependent on gaining timely access to lands. Consultations, that are mandated bygoverning authorities, with all stakeholders (including surface owners, First Nations and all interested parties) arebecoming increasingly time consuming and complex, and are having a direct impact on cycle times.
• A significant portion of Pengrowth’s properties are operated by third parties whereby Pengrowth has less control over thepace of capital and operating expenditures. If these operators fail to perform their duties properly, or become insolvent, wemay experience interruptions in production and revenues from these properties or incur additional liabilities and expensesas a result of the default of these third party operators.
• Geological and operational risks affect the quantity and quality of reserves and the costs of recovering those reserves. Ouractual results will vary from our reserve estimates and those variations could be material.
• Oil and gas operations carry the risk of damaging the local environment in the event of equipment or operational failure.The cost to remediate any environmental damage could be significant.
• Delays in business operations could adversely affect Pengrowth’s dividends to shareholders and the market price of thecommon shares.
During periods of increased activity within the oil and gas sector, the cost of goods and services may increase and it may be moredifficult to hire and retain professional staff.
• Attacks by individuals against facilities and the threat of such attacks may have an adverse impact on Pengrowth and theimplementation of security measures as a precaution against possible attacks would result in increased cost toPengrowth’s business.
• Actual production and reserves will vary from estimates, and those variations could be material and may negatively affectthe market price of the common shares and dividends to our shareholders.
Risks associated with Strategy• Capital re-investment on our existing assets may not yield the expected benefits and related value creation. Drilling
opportunities may prove to be more costly or less productive than anticipated. In addition, the dedication of a largerpercentage
PENGROWTH 2010 Management’s Discussion & Analysis 31

of our cash flow to such opportunities may reduce the funds available for dividend payment to shareholders. In such anevent, the market value of the common shares may be adversely effected.
• Pengrowth’s oil and gas reserves will be depleted over time and our level of cash flow from operations and the value of ourcommon shares could be reduced if reserves and production are not replaced. The ability to replace production dependson the amount of capital invested and success in developing existing reserves, acquiring new reserves and financing thisdevelopment and acquisition activity within the context of the capital markets.
• Incorrect assessments of value at the time of acquisitions could adversely affect the value of our common shares anddividends to our shareholders.
• Our dividends and the market price of the common shares could be adversely affected by unforeseen title defects, whichcould reduce dividends to our shareholders.
General Business Risks• Investors’ interest in the oil and gas sector may change over time which would affect the availability of capital and the
value of Pengrowth common shares.
• Inflation may result in escalating costs, which could impact dividends and the value of Pengrowth common shares.
• Canadian / U.S. exchange rates influence revenues and, to a lesser extent, operating and capital costs. Pengrowth is alsoexposed to foreign currency fluctuations on the U.S. dollar denominated notes for both interest and principal payments.
• The ability of investors resident in the United States to enforce civil remedies may be negatively affected for a number ofreasons.
These factors should not be considered exhaustive. Additional risks are outlined in the AIF of the Corporation available on SEDAR atwww.sedar.com.
SUBSEQUENT EVENTSSubsequent to December 31, 2010, Pengrowth has entered into additional fixed price commodity sales contracts with third parties(see Note 23 to the financial statements).
On January 1, 2011, Pengrowth experienced a pipeline incident at the Swan Hills gas gathering pipeline system in North CentralAlberta. The incident resulted in the shut-in of approximately 1,500 barrels of oil equivalent per day of production, net to Pengrowth.On March 2, 2011, the line was placed back in service.
OUTLOOKAt this time, Pengrowth anticipates spending $400 million on its capital program in 2011. The 2011 capital program is designed tobe flexible, scalable and responsive to uncertain commodity prices and market conditions. The capital program of $400 millionrepresents a 12 percent increase compared with the $358 million 2010 program.
Pengrowth's 2011 production volumes are projected to be flat year-over-year and to deliver average daily production volumes ofbetween 74,000 and 76,000 boe per day.
2011 operating costs are forecast to be $370 million or $13.54 per boe, essentially flat to 2010.
Total G&A costs are expected to increase for 2011 to $2.69 per boe when compared to full year 2010 of $1.87 per boe. Included inPengrowth's 2011 G&A forecast, are non-cash G&A costs of approximately $0.47 per boe compared to $0.17 per boe in 2010.
INTERNATIONAL FINANCIAL REPORTING STANDARDS (IFRS)
What is IFRS?
International Financial Reporting Standards (“IFRS”) are a set of accounting standards developed by the International AccountingStandards Board. The goal of IFRS is to provide a global framework for how public companies prepare and disclose their financialstatements. IFRS provides general guidance for the preparation of financial statements rather than setting rules for industryspecific reporting. IFRS is now required or permitted in over 100 countries, including the European Union and much of the PacificRim. Canadian publicly accountable enterprises are required to adopt IFRS, in full, and without modification, in place of CanadianGAAP for interim and annual periods beginning on or after January 1, 2011. In the United States there is no current plan for theadoption of IFRS, although the Securities and Exchange Commission has eliminated the IFRS/U.S. GAAP reconciliation requirementfor foreign-filers, like Pengrowth, when fully implemented and audited.
32 PENGROWTH 2010 Management’s Discussion & Analysis

IFRS Project Plan
Pengrowth commenced its IFRS conversion project in 2008 and has established a formal governance structure. This structureincludes a full time IFRS Project Coordinator, a steering committee consisting of senior members of the finance team on anongoing basis and includes information technology, treasury and operations personnel as required. Pengrowth has also engaged anexternal expert advisory firm. Regular IFRS project reporting is provided to senior management and to the Audit Committee of theBoard of Directors. Senior management and the Board of Directors have participated in IFRS sessions to gain an understanding ofthe relevant aspects of IFRS.
Pengrowth’s project consists of four phases: diagnostic; design and planning; solution development; and implementation.
• Diagnostic – This phase involves performing a high-level review of the major differences between Canadian GAAP and IFRSand to identify information technology and business processes that may be impacted by the transition to IFRS.Status – The diagnostic analysis was completed in mid-2008.
• Design and planning – The results of the diagnostic were ranked according to complexity, time to complete and potentialimpact on the financial position and results of operations. A detailed plan was developed in order to address the issuesidentified and ranked in the diagnostic phase. The planning is updated and progress is reported to the Audit Committee ona regular basis.Status – Pengrowth completed the initial design and planning in mid-2009. The planning is updated and progress isreported to the Audit Committee of the Board of Directors on a regular basis.
• Solution development – In this phase, items identified in the diagnostic phase are addressed according to the priorityassigned. This phase involves detailed analysis of the applicable IFRS standard in relation to current practice anddevelopment of alternative policy choices. In addition, certain potential differences are further investigated to assesswhether there may be broader impact to Pengrowth’s debt agreements, compensation arrangements or managementreporting systems. The conclusion of the solution development phase will require the Audit Committee of the Board ofDirectors to review and approve significant accounting policy choices as recommended by the IFRS Steering Committee.Status – Solution development began in late 2008 for classification of exploration and evaluation expenditures, depletion,cash generating units and impairment of capital assets, share based payments, business combinations, financialinstruments, trust unit holder’s equity and shareholder’s equity, risk sharing arrangements (farm-outs, assets swaps, etc)and the initial adoption of IFRS. Pengrowth has completed its analysis but not finalized its position regarding provisions(including ARO) and income taxes.
• Implementation – Involves implementing all of the changes approved in the solution development phase and may includechanges to accounting policies, information systems, business processes, modification to agreements and training of staffimpacted by the conversion.Status – Implementation of information technology changes began in 2009. Training for the IFRS Steering Committeemembers commenced in 2008. Internal education of the Audit Committee, Board of Directors and key financial andaccounting personnel began in the fourth quarter of 2009. Detailed implementation meetings involving internal personneldirectly affected by IFRS also began in the fourth quarter of 2009. Continued training and implementation meetingsoccurred throughout 2010. We are currently in the implementation phase, including making systems and proceduralchanges necessary to produce 2010 IFRS comparative financial statements. The review of the expected changes in the2010 IFRS financial statements, both internally and by our external auditors, began in the second quarter of 2010 and isongoing. The implementation phase is expected to conclude upon issuance of 2011 audited annual financial statements inMarch 2012.
First – Time Adoption of IFRS
The IFRS adoption date of January 1, 2011 for Canadian publicly accountable enterprises will require the restatement, forcomparative purposes, of amounts reported by Pengrowth for the year ended December 31, 2010, including the opening IFRSbalance sheet as of January 1, 2010.
IFRS 1, “First-Adoption of International Financial Reporting Standards“ (“IFRS 1“), sets out the procedures that an entity mustfollow when it adopts IFRS for the first time as the basis for preparing its general purpose financial statements. In addition, IFRS 1provides entities adopting IFRS for the first time with a number of optional exemptions and mandatory exceptions in certain areas tothe general requirement of full retrospective application of IFRS. Pengrowth continues to review the potential adjustments to theJanuary 1, 2010 opening IFRS balance sheet and the effects of transition to IFRS are subject to change. The most significantaccounting policies that have been identified and the key differences that may impact the January 1, 2010 IFRS opening balancesheet are as follows:
Deemed Cost Exemption – Under Canadian full cost accounting, Pengrowth has historically accounted for exploration anddevelopment costs of oil and gas properties in the development and production phases in a single Canada wide full cost accounting
PENGROWTH 2010 Management’s Discussion & Analysis 33

pool. Under IFRS, exploration and evaluation expenditures will be reclassified as intangible exploration assets. IFRS 1 contains anexemption that would allow Pengrowth to measure oil and gas assets at the date of transition as follows:
(i) exploration and evaluation assets are reclassified from the full cost pool to intangible exploration assets at the amountthat was recorded under Canadian GAAP; and
(ii) the remaining full cost pool is allocated to the producing/development assets and components pro rata using reservevalues or reserve volumes.
Pengrowth intends to make use of this exemption. The reclassification of exploration and evaluation assets is expected to result in a$68 million increase in intangible exploration assets with a corresponding decrease in property, plant and equipment at January 1,2010. The remaining full cost pool will be allocated on the basis of total proved plus probable using reserve values andJanuary 1, 2010 forecast pricing. The total value of exploration and producing oil and gas assets will remain unchanged.
Impairment of Property, Plant & Equipment (“PP&E”) assets – Pengrowth is required to assess the PP&E assets for impairmentupon transition to IFRS. Currently, impairment of PP&E is assessed at a consolidated level under Canadian GAAP. Under IFRS,impairment of PP&E must be assessed at a more detailed level. Impairment calculations will be performed at the Cash GeneratingUnit (“CGU”) level, using the greater of fair value less costs to sell or the value in use. We do not currently expect to record anyimpairment of oil and gas assets on transition to IFRS.
Impairment of Goodwill – Pengrowth is required to assess goodwill for impairment upon transition to IFRS. Currently impairment ofgoodwill is assessed at a consolidated level under Canadian GAAP. Under IFRS, goodwill is identified with specific CGUs or group ofCGUs and consequently impairment must be assessed at a more detailed level. Impairment testing of goodwill will be performed inrelation to the individual CGU or groups of CGUs that the goodwill relates to. We do not currently expect to record any impairmentof goodwill on transition to IFRS.
Business Combinations – IFRS 1 would allow Pengrowth to adopt the IFRS policies for business combinations on a prospectivebasis rather than retrospectively restating all prior business combinations. Pengrowth is expecting to use this IFRS 1 exemptionand not restate any business combinations prior to the IFRS transition date of January 1, 2010. The IFRS policies for businesscombinations are converged with the new CICA Handbook section 1582 that are effective for business combinations completed onor after January 1, 2011; however, early adoption under Canadian GAAP is permitted. Early adoption would eliminate the majority ofdifferences between Canadian GAAP, U. S. GAAP and IFRS for business combinations completed prior to December 31, 2010.Pengrowth has early adopted CICA 1582, effective January 1, 2010. The acquisition of Monterey in the third quarter of 2010 is thefirst transaction affected by this change.
Provisions – Under IFRS, contract liabilities and decommissioning obligations are classified as provisions. Accounting for contractliabilities remains unchanged under IFRS. Decommissioning obligations, disclosed as asset retirement obligations under CanadianGAAP, are anticipated to be calculated using a risk free discount rate under IFRS, which is currently estimated to be four percent. Inaddition, the timing and cost estimates are being revised to reflect the best estimate of what Pengrowth would rationally pay tosettle the obligation, as permitted under IFRS. The net effect of using a risk free discount rate, partly offset by revised timing andcost estimates is expected to result in approximately $162 million or 56% increase to decommissioning liabilities as presented onthe January 1, 2010 opening IFRS Balance Sheet. Under Canadian GAAP, Pengrowth used a credit adjusted risk free rate of 8%. Dueto the use of the aforementioned IFRS 1 election for full cost oil and gas entities, the increase to the decommissioning liabilities isrequired to be recognized directly in opening equity, resulting in a corresponding increase to the opening deficit estimated to beapproximately $99 million, after tax. The International Accounting Standards Board and its Interpretations Committee continue todebate the inclusion of an entity’s own credit risk in the discount rate used for long-term provisions. It is unclear if clarification ofthe requirement to use a risk free discount rate will be forthcoming before the filing of the Q1 2011 interim financial statementsprepared in accordance with IFRS.
Income Tax – Any changes to income tax reporting are expected to be predominantly caused by changes in the book value of assetsand changes in tax rates applied, not due to the change in income tax accounting methodology. IFRS requires that all future taxesbe disclosed as non-current assets or liabilities and designated as deferred taxes. In addition, as the Trust was classified as amutual fund trust on the transition date, for Canadian tax purposes, the income tax assets and liabilities of the Trust must be taxeffected using the top marginal rate of 39% upon transition to IFRS which is expected to result in a reduction to the future taxliability of $164 million. This adjustment, in addition to the tax affect of other IFRS opening balance sheet adjustments, is expectedto result in a total reduction to future income taxes of approximately $226 million and a decrease to the deficit of approximately$219 million and an increase to equity of approximately $7 million upon transition. It is also anticipated that a significant portion ofthis transition adjustment will reverse through deferred tax expense in the fourth quarter 2010 IFRS comparative income statementas a result of Pengrowth’s conversion to a dividend paying corporation on December 31, 2010.
34 PENGROWTH 2010 Management’s Discussion & Analysis

Financial Instruments – IFRS allows a one-time opportunity to re-examine the designation of financial instruments. Pengrowthexpects to re-designate the Judy Creek Remediation Trust Fund from held-to-maturity to fair-value-through-profit-or-loss and thePrivate Company investment from available-for-sale to fair-value-through-profit-or-loss upon transition to IFRS and thereforerecord these assets at fair value. This would result in a $7 million increase to other assets at January 1, 2010 with a correspondingdecrease to opening deficit upon transition to IFRS. Future changes in the fair value would be recognized in income.
Trust Unit-Holders Equity – If unable to qualify for classification as equity, Pengrowth trust units would be classified as liabilities onthe balance sheet prior to December 31, 2010. After a detailed review of Pengrowth’s trust indenture, we believe that Pengrowth’strust unit holder’s equity will continue to be classified in equity. The significance of this issue is minimized as Pengrowth convertedto a dividend paying corporation on December 31, 2010 and the common shares of Pengrowth Energy Corporation are classified asequity under IFRS.
Pengrowth has completed its initial assessment of the adoption of IFRS and anticipates changes to the January 1, 2010 openingbalance sheet as noted below. Management has not yet finalized its accounting policies and as such the expected opening balancesheet may change. In addition, due to potential changes to IFRS prior to Pengrowth’s adoption of IFRS, management’s plan andaccounting policy decisions are subject to change based on new facts and circumstances that arise after the date of this MD&A. Theeffects of transition to IFRS on Provisions and Deferred Income Taxes, in particular, may be subject to change due to uncertaintyover discount rates, future expected costs and treatment of temporary tax differences within the Trust.
Preliminary Reconciliation of the Opening Balance Sheet items impacted by IFRS, as of January 1, 2010
($ thousands) Cdn GAAP
Reclassificationupon transition
to IFRS
Effect oftransition
to IFRS IFRS
Future income tax assets (d) 969 (969) – –
Other assets (c) 46,027 – 6,984 53,011
Deferred income taxes (d) – (180,671) 225,991 45,320
Property, plant and equipment (a) 3,789,369 (67,597) – 3,721,772
Intangible exploration assets (a) – 67,597 – 67,597
Current portion of contract liabilities (b) 1,728 (1,728) – –
Current portion of provisions (b) – 21,227 – 21,227
Contract liabilities (b) 7,952 (7,952) – –
Provisions (b) – 277,249 161,815 439,064
Asset retirement obligations (b) 288,796 (288,796) – –
Future income taxes (d) 181,640 (181,640) – –
Trust unitholders’ equity (e) 4,920,945 – 6,379 4,927,324
Deficit (e) (2,144,521) – 64,781 (2,079,740)
(a) IFRS 1 election for full cost oil and gas entities
Pengrowth expects to elect an IFRS 1 exemption whereby the Canadian GAAP full cost pool will be measured upon transition toIFRS as follows:
(i) exploration and evaluation assets are reclassified from the full cost pool to intangible exploration assets at the amountthat was recorded under Canadian GAAP; and
(ii) the remaining full cost pool is allocated to the producing/development assets and components pro rata using total provedplus probable reserve values and January 1, 2010 forecasted prices.
This would result in a $68 million increase in intangible exploration assets with a corresponding decrease in property, plant andequipment.
(b) Provisions
Under IFRS, contract liabilities and decommissioning obligations are classified as provisions.
PENGROWTH 2010 Management’s Discussion & Analysis 35

Accounting for contract liabilities remains unchanged under IFRS.
Decommissioning obligations, disclosed as asset retirement obligations under Canadian GAAP, are anticipated to be calculatedusing a risk free discount rate under IFRS, which is currently estimated to be four percent. In addition, the timing and costestimates are being revised to reflect the best estimate of what Pengrowth would rationally pay to settle the obligation, as permittedunder IFRS. The net effect of using a risk free discount rate, partly offset by revised timing and cost estimates is expected to resultin an approximately $162 million or 56% increase to decommissioning liabilities as presented on the Balance Sheet. Due to the useof the aforementioned IFRS 1 election for full cost oil and gas entities, the offset to the increase to the decommissioning liabilities isrequired to be recognized directly in opening equity, resulting in a corresponding increase to the opening deficit. In the absence ofthe use of this IFRS 1 election for full cost oil and gas entities, the offset to the increase in the decommissioning liability would berecognized as an increase to the net book value of the related assets, resulting in an increase to property, plant and equipment of$162 million. In addition, $19 million of these expenditures are expected to be made in 2010 and are thus classified as currentliabilities.
The International Accounting Standards Board and its Interpretations Committee continue to debate the inclusion of an entity’s owncredit risk in the discount rate used for long-term provisions. It is unclear if clarification of the requirement to use a risk freediscount rate will be forthcoming before the filing of the Q1 2011 interim financial statements prepared in accordance with IFRS.
The estimated effect on Provisions of the implementation of IFRS, assuming the use of a four percent discount rate, can bequantified as follows:
Increase in Decommissioning Liabilities $161,815
Tax Effect (63,108)
Increase to opening deficit $ 98,707
(c) Other assets
Pengrowth expects to re-designate the Judy Creek Remediation Trust Fund from held-to-maturity to fair-value-through-profit-or-loss and the Private Company Investment from available-for-sale to fair-value-through-profit-or-loss upon transition toIFRS and recorded these assets at fair value. This would result in a $7.0 million increase to other assets at January 1, 2010 with acorresponding decrease to opening deficit upon transition to IFRS. Future changes in the fair value would be recognized in income.
The estimated effect on Other Assets of the implementation of IFRS can be quantified as follows:
Increase in Other Assets $6,984
Tax Effect (891)
Decrease to opening deficit $6,093
(d) Deferred income taxes
Under IFRS, all deferred income taxes are reported as non-current, resulting in a reclassification of the $1.0 million deferred taxasset to long term deferred tax liabilities at January 1, 2010.
The change in the net present value of the decommissioning liability is expected to result in a $63 million decrease in the deferredtax liability. The change in the carrying value of the Judy Creek remediation fund and Private Company investment is expected toresult in a $1 million increase in the deferred tax liability. At January 1, 2010, the Trust was a flow-through entity that paid asignificant portion of its taxable income to the unit-holders. The temporary tax difference of the Trust under IFRS must be taxaffected at the top marginal tax rate in Canada resulting in a reduction of the deferred tax liability of $164 million and a resultingdecrease in the opening deficit of $157 million and an increase to trust unit-holders’ capital of $7 million. A significant portion ofthis tax recovery is expected to reverse through the IFRS comparative income statement as deferred tax expenses in the fourthquarter of 2010 as Pengrowth converted to a dividend paying corporation on December 31, 2010.
36 PENGROWTH 2010 Management’s Discussion & Analysis

The estimated effect on Deferred Income Taxes of the implementation of IFRS can be quantified as follows:
Decrease in tax liability due to increase in provisions $ 63,108
Increase in tax liability due to increase in other assets (891)
Decrease in tax liability due to changes to book value of net assets $ 62,217
Decrease in tax liability due to changes in effective tax rate 163,774
Decrease in opening deferred tax liability $ 225,991
Cdn GAAP Future Tax Liability $(180,671)
Decrease in opening deferred tax liability 225,991
IFRS Deferred Tax Asset $ 45,320
(e) Opening Deficit
Under IFRS 1 – First Time Adoption of International Financial Reporting Standards (“IFRS 1”) most changes to the January 1, 2010opening balance sheet are applied retrospectively through opening deficit. This includes changes to Provisions, Other Assets andDeferred Taxes as described above.
The estimated effect on the Opening Deficit of the implementation of IFRS can be quantified as follows:
Increase due to increase to provisions $ (98,707)
Decrease due to change to other assets 6,093
Decrease in tax liability due to changes in effective tax rates 157,395
Decrease to opening deficit $ 64,781
Increase to trust unitholders’ capital to change in effective tax rate $ 6,379
Ongoing IFRS differences post first time adoption
In addition to the IFRS differences affecting the January 1, 2010 opening balance sheet, Pengrowth continues to review the potentialadjustments to ongoing application of IFRS after the initial transition. Due to potential changes to IFRS prior to Pengrowth’sadoption of IFRS, management’s plan and accounting policy decisions are subject to change based on new facts and circumstancesthat arise after the date of this MD&A. The most significant ongoing accounting policies that have been identified and the keydifferences that may impact the financial statements are as follows:
• Accounting for Exploration and Evaluations (“E&E”) expenditures – Upon transition to IFRS, Pengrowth will reclassify E&Eexpenditures that are currently included in the PP&E balance on the Consolidated Balance Sheet. This will be comprisedof the book value of Pengrowth’s unproven properties of approximately $68 million that was excluded from Depletion atDecember 31, 2009 (see note 6 to the 2009 audited annual financial statements) and is expected to increase through 2010due to expenditures on exploration and evaluation activities and the acquisition of additional exploration and evaluationproperties. E&E assets will not be depleted but must be assessed for impairment when there are indicators for possibleimpairment, such as allowing the mineral rights lease to expire or a decision to no longer pursue exploration andevaluation of a specific E&E asset. The majority of the property, plant and equipment acquired in the Monterey acquisitionwas allocated to unproven and development properties, which significantly increased the net book value of E&E assets asof December 31, 2010.
• Impairment of PP&E assets – Impairment of PP&E is currently assessed at a single consolidated level using an annualceiling test. Under IFRS, impairment of PP&E must be assessed at a more detailed level whenever there is an indication ofimpairment such as changes in commodity prices or operational performance. Under IFRS, impairment calculations willbe performed at the Cash Generating Unit (“CGU”) level, using the greater of fair value less costs to sell or the value inuse. This may result in more frequent impairments of assets under IFRS given the smaller size of the entity or CGU beingevaluated.
• Calculation of Depletion Expense – Pengrowth currently calculates depletion of production and development assets on aconsolidated basis based on total production and total proved reserves. Under IFRS, depletion will be calculated at a moredetailed level and at least at the level of cash generating units. In addition, under IFRS Pengrowth has chosen to use totalproven plus probable reserves for its depletion calculation. The use of total proven plus probable reserve base forcalculating depletion would be expected to result in a decrease to the consolidated depletion expense of approximately$4.25 to $4.75 per boe of production or $28 million to $33 million per quarter.
• Risk Sharing Arrangements and Dispositions – Risk sharing arrangements where Pengrowth cedes a portion of its workinginterest to a partner are generally considered disposals of property, plant and equipment under IFRS. Canadian full cost
PENGROWTH 2010 Management’s Discussion & Analysis 37

accounting guidelines require that no gain or loss be recorded on these or other dispositions where the change inconsolidated depletion is less than 20 percent. No such guidance exists under IFRS. As a result, it is expected thatPengrowth will record gains or losses on these transactions under IFRS. The significance of these gains or losses will bedependant on the details of specific transactions and cannot be reasonably quantified. The first transaction identified, thepreviously disclosed GORR sale in Q1 2010, is expected to result in a gain of approximately $8 million as compared to nogain under current GAAP.
• Financial Covenants – Pengrowth has analyzed the impact of IFRS on financial covenants and financing relationships. Theprimary impact will be an increase in the debt-to-equity ratio as a result of the IFRS opening balance sheet adjustments tothe deficit. Pengrowth nonetheless expects to be fully compliant with all financial debt covenants upon transition to IFRS.
• Compensation Arrangements – Pengrowth does not expect any material changes to compensation arrangements,including all share based compensation plans, due to the transition to IFRS. Pengrowth has reviewed internalcompensation arrangements and determined that the anticipated changes to financial measures as a result of IFRS willnot directly affect any of these compensation arrangements.
In addition to the accounting policy differences, Pengrowth’s transition to IFRS will impact the internal controls over financialreporting, the disclosure controls and procedures and IT systems as follows:
• Internal controls over financial reporting – As the review of Pengrowth’s accounting policies is completed, an assessmenthas been made to determine changes required for internal controls over financial reporting. For example, additionalcontrols will be implemented for the IFRS 1 changes and preparation of comparative information. This will be an ongoingprocess to ensure that changes in accounting policies include the appropriate additional controls and procedures forfuture IFRS reporting requirements.
• Disclosure controls and procedures – Throughout the transition process, Pengrowth will be assessing stakeholders’information requirements and will ensure that adequate and timely information is provided so that stakeholders are keptapprised.
• IT Systems – Pengrowth has completed the system modifications required for IFRS reporting. Pengrowth’s IT systems didnot require significant modifications to track PP&E and E&E at a more detailed level within the financial reportingsystems. Pengrowth’s IFRS staff has worked with IT and operational staff to ensure all costs are captured and recorded ina manner consistent with IFRS depletion, impairment cost center groupings and accounting for asset retirementobligations. Insignificant changes to procedures and systems outside the accounting and finance department have beenmade. Changes were also made to allow Pengrowth to account for certain transactions and prepare Canadian GAAP andIFRS financial statements in 2010. Additional systems modifications may be required.
Pengrowth continues to make progress on its IFRS convergence plan and management believes that Pengrowth will be in a positionto prepare IFRS financial statements in the first quarter of 2011. Pengrowth has not made any final determination as to whatoptions it may select upon conversion to IFRS. Changes in financial reporting under some options may be significantly different. Thefinal decisions are subject to the approval of Pengrowth’s Audit Committee and Board of Directors and the concurrence ofPengrowth’s auditors. Pengrowth continues to monitor the IFRS adoption efforts of many of its peers and participates in relatedprocesses, as appropriate. Pengrowth is currently involved in an IFRS working group composed of intermediate to large oil and gasproducers and an IFRS and Financial Reporting group consisting of a peer group of former income trusts.
Recent Accounting PronouncementsAs of January 1, 2010, Pengrowth early adopted the following new Canadian standards:
CICA 1582 “Business Combinations”, which replaces the previous business combinations standard. The standard requires assetsand liabilities acquired in a business combination, consideration paid, contingent consideration and certain acquired contingenciesto be measured at fair value on the date of acquisition. In addition, acquisition related and restructuring costs are recognizedseparately from the business combination and are included in the statement of income. The adoption of this standard impacts theaccounting treatment of business combinations entered on or after January 1, 2010. With respect to the Monterey acquisition in2010 (Note 4), the most significant impact of the new standards was the recognition of a $73.8 million gain on existing equityinvestment in Monterey. In addition, the share consideration paid for Monterey was valued using the closing date trust unit priceversus the announcement date trust unit price which increased the consideration paid by $40.0 million.
CICA 1601 "Consolidated Financial Statements", which together with Section 1602 below replace the former consolidated financialstatements standard. Section 1601 establishes the requirements for the preparation of consolidated financial statements. Theadoption of this standard had no material impact on Pengrowth’s financial statements.
CICA 1602 "Non-controlling Interests” establishes the accounting for a non-controlling interest in a subsidiary in consolidatedfinancial statements subsequent to a business combination. The standard requires a non-controlling interest in a subsidiary to beclassified as a separate component of equity. In addition, net earnings and components of other comprehensive income are
38 PENGROWTH 2010 Management’s Discussion & Analysis

attributed to both the parent and non-controlling interest. The adoption of this standard had no impact on the consolidated financialstatements.
DISCLOSURE CONTROLS AND PROCEDURESAs a Canadian reporting issuer with securities listed on both the TSX and the NYSE, Pengrowth is required to comply withMultilateral Instrument 52-109 – Certification of Disclosure in Issuers’ Annual and Interim Filings, as well as the Sarbanes Oxley Act(SOX) enacted in the United States. Both the Canadian and U.S. certification rules include similar requirements where both theChief Executive Officer (“CEO”) and the Chief Financial Officer (“CFO”) must assess and certify as to the effectiveness of thedisclosure controls and procedures as defined in Canada by Multilateral Instrument 52-109 – Certification of Disclosure in Issuers’Annual and Interim Filings and in the United States by Rules 13a-15(e) and 15d-15(e) under the Securities Exchange Act of 1934, asamended.
The CEO, Derek Evans, and the CFO, Christopher Webster, evaluated the effectiveness of Pengrowth’s disclosure controls andprocedures for the year ending December 31, 2010. This evaluation considered the functions performed by its DisclosureCommittee, the review and oversight of all executive officers and the board, as well as the process and systems in place for filingregulatory and public information. Pengrowth’s established review process and disclosure controls are designed to providereasonable assurance that all required information, reports and filings required under Canadian securities legislation and UnitedStates securities laws are properly submitted and recorded in accordance with those requirements.
Based on that evaluation, the CEO and CFO concluded that the design and operation of our disclosure controls and procedures wereeffective at the reasonable assurance level as at December 31, 2010, to ensure that information required to be disclosed by us inreports that we file under Canadian and U.S. securities laws is gathered, recorded, processed, summarized and reported within thetime periods specified under Canadian and U.S. securities laws and is accumulated and communicated to the management ofPengrowth Energy Corporation, including the CEO and CFO, to allow timely decisions regarding required disclosure as requiredunder Canadian and U.S. securities laws.
It should be noted that while Pengrowth’s CEO and CFO believe that Pengrowth’s disclosure controls and procedures provide areasonable level of assurance that they are effective, they do not expect that Pengrowth’s disclosure controls and procedures orinternal control over financial reporting will prevent all errors and fraud. A control system, no matter how well conceived oroperated, can provide only reasonable, not absolute, assurance that the objectives of the control system are met.
INTERNAL CONTROL OVER FINANCIAL REPORTINGOur management is responsible for establishing and maintaining adequate internal control over financial reporting as defined inRules 13a-15(f) and 15d-15(f) under the Securities Exchange Act of 1934, as amended and in Canada as defined in MultilateralInstrument 52-109 – Certification of Disclosure in Issuers’ Annual and Interim Filings. Our internal control over financial reportingis designed to provide reasonable assurance regarding the reliability of our financial reporting and the preparation of our financialstatements for external purposes in accordance with accounting principles generally accepted in Canada and reconciling toaccounting principles generally accepted in the U.S. for note disclosure purposes. Our internal control over financial reportingincludes those policies and procedures that: pertain to the maintenance of records that in reasonable detail accurately and fairlyreflect our transactions and disposition of the assets; provide reasonable assurance that transactions are recorded as necessary topermit preparation of our financial statements in accordance with generally accepted accounting principles and that receipts andexpenditures of our assets are being made only in accordance with authorizations of our management and directors; and providereasonable assurance regarding prevention or timely detection of unauthorized acquisition, use or disposition of our assets thatcould have a material effect on our financial statements. Because of its inherent limitations, internal control over financial reportingmay not prevent or detect misstatements. Also, projections of any evaluation of effectiveness to future periods are subject to therisk that controls may become inadequate because of changes in conditions, or that the degree of compliance with the policies orprocedures may deteriorate.
Our management, with the participation of our principal executive officer and principal financial officer, evaluated the effectivenessof our internal control over financial reporting as of December 31, 2010. In making this evaluation, management used the criteriaset forth by the Committee of Sponsoring Organizations of the Treadway Commission (“COSO”) in Internal Control-IntegratedFramework.
Based on our evaluation, management concluded that our internal control over financial reporting was effective as of December 31,2010.
The effectiveness of internal control over financial reporting as of December 31, 2010 was audited by KPMG LLP, an independentregistered public accounting firm, as stated in their report, which is included with our audited consolidated financial statements forthe year ended December 31, 2010. No changes were made to our internal control over financial reporting during the year endingDecember 31, 2010 that have materially affected, or are reasonably likely to materially affect, the internal controls over financialreporting.
PENGROWTH 2010 Management’s Discussion & Analysis 39

MANAGEMENT’S REPORT TO SHAREHOLDERS
MANAGEMENT’S RESPONSIBILITY TO SHAREHOLDERS
The financial statements are the responsibility of the management of Pengrowth Energy Corporation. They have been prepared inaccordance with generally accepted accounting principles, using management’s best estimates and judgments, where appropriate.
Management is responsible for the reliability and integrity of the financial statements, the notes to the financial statements, andother financial information contained in this report. In preparation of these statements, estimates are sometimes necessarybecause a precise determination of certain assets and liabilities is dependant on future events. Management believes suchestimates have been based on careful judgments and have been properly reflected in the accompanying financial statements.
Management is also responsible for ensuring that management fulfills its responsibilities for financial reporting and internalcontrol, including management’s requirement to assess the effectiveness of internal control over financial reporting as atDecember 31, 2010. The Board is assisted in exercising its responsibilities through the Audit Committee of the Board, which iscomposed of four non-management directors. The Committee meets periodically with management and the auditors to satisfy itselfthat management’s responsibilities are properly discharged, to review the financial statements and to recommend approval of thefinancial statements to the Board.
KPMG LLP, the independent auditors appointed by the shareholders, have audited Pengrowth Energy Corporation’s consolidatedfinancial statements in accordance with generally accepted auditing standards and provided an independent professional opinion.The auditors have full and unrestricted access to the Audit Committee to discuss the audit and their related findings as to theintegrity of the financial reporting process.
Derek W. Evans Christopher G. WebsterPresident and Chief Executive Officer Chief Financial Officer
March 8, 2011
40 PENGROWTH 2010 Financial Results
INDEPENDENT AUDITORS’ REPORT OF REGISTEREDPUBLIC ACCOUNTING FIRM
TO THE SHAREHOLDERS AND BOARD OF DIRECTORS OF PENGROWTH ENERGY CORPORATION
We have audited the accompanying consolidated financial statements of Pengrowth Energy Corporation, which comprise theconsolidated balance sheets as at December 31, 2010 and 2009, the consolidated statements of income and deficit, and cash flowfor years then ended, and notes, comprising a summary of significant accounting policies and other explanatory information.
MANAGEMENT’S RESPONSIBILITY FOR THE CONSOLIDATED FINANCIAL STATEMENTS
Management is responsible for the preparation and fair presentation of these consolidated financial statements in accordance withCanadian generally accepted accounting principles, and for such internal control as management determines is necessary toenable the preparation of consolidated financial statements that are free from material misstatement, whether due to fraud orerror.
AUDITORS’ RESPONSIBILITY
Our responsibility is to express an opinion on these consolidated financial statements based on our audits. We conducted our auditsin accordance with Canadian generally accepted auditing standards and the standards of the Public Company Accounting OversightBoard (United States). Those standards require that we comply with ethical requirements and plan and perform the audit to obtainreasonable assurance about whether the consolidated financial statements are free from material misstatement.
An audit involves performing procedures to obtain audit evidence about the amounts and disclosures in the consolidated financialstatements. The procedures selected depend on our judgment, including the assessment of the risks of material misstatement ofthe consolidated financial statements, whether due to fraud or error. In making those risk assessments, we consider internalcontrol relevant to the entity’s preparation and fair presentation of the consolidated financial statements in order to design auditprocedures that are appropriate in the circumstances. An audit also includes evaluating the appropriateness of accounting policiesused and the reasonableness of accounting estimates made by management, as well as evaluating the overall presentation of theconsolidated financial statements.
We believe that the audit evidence we have obtained in our audits is sufficient and appropriate to provide a basis for our auditopinions.
OPINION
In our opinion, the consolidated financial statements present fairly, in all material respects, the consolidated financial position ofthe Pengrowth Energy Corporation as at December 31, 2010 and 2009 and its consolidated results of operations and consolidatedcash flow for the years then ended in accordance with Canadian generally accepted accounting principles.
EMPHASIS OF MATTER
We draw your attention to Note 3 to the consolidated financial statements which describes the early adoption of Canadian Instituteof Chartered Accountants (“CICA”) Handbook Section 1582 “Business Combinations”. Our opinion is not qualified in respect of thismatter.
OTHER MATTER
We also have audited, in accordance with the standards of the Public Company Accounting Oversight Board (United States), thePengrowth Energy Corporation’s internal control over financial reporting as of December 31, 2010, based on the criteria establishedin Internal Control – Integrated Framework issued by the Committee of Sponsoring Organizations of the Treadway Commission(COSO), and our report dated March 8, 2011 expressed an unmodified opinion on the effectiveness of the Pengrowth EnergyCorporation’s internal control over financial reporting.
Chartered AccountantsCalgary, CanadaMarch 8, 2011
PENGROWTH 2010 Financial Results 41

REPORT OF INDEPENDENT REGISTEREDPUBLIC ACCOUNTING FIRM
TO THE SHAREHOLDERS AND BOARD OF DIRECTORS OF PENGROWTH ENERGY CORPORATION
We have audited Pengrowth Energy Corporation’s internal control over financial reporting as of December 31, 2010, based on thecriteria established in Internal Control – Integrated Framework issued by the Committee of Sponsoring Organizations of theTreadway Commission (COSO). Pengrowth Energy Corporation’s management is responsible for maintaining effective internalcontrol over financial reporting and for its assessment of the effectiveness of internal control over financial reporting, included inthe accompanying Management’s Report to the Shareholders. Our responsibility is to express an opinion on Pengrowth EnergyCorporation’s internal control over financial reporting based on our audit.
We conducted our audit in accordance with the standards of the Public Company Accounting Oversight Board (United States). Thosestandards require that we plan and perform the audit to obtain reasonable assurance about whether effective internal control overfinancial reporting was maintained in all material respects. Our audit included obtaining an understanding of internal control overfinancial reporting, assessing the risk that a material weakness exists, and testing and evaluating the design and operatingeffectiveness of internal control based on the assessed risk. Our audit also included performing such other procedures as weconsidered necessary in the circumstances. We believe that our audit provides a reasonable basis for our opinion.
An entity’s internal control over financial reporting is a process designed to provide reasonable assurance regarding the reliabilityof financial reporting and the preparation of financial statements for external purposes in accordance with generally acceptedaccounting principles. An entity’s internal control over financial reporting includes those policies and procedures that (1) pertain tothe maintenance of records that, in reasonable detail, accurately and fairly reflect the transactions and dispositions of the assets ofthe entity; (2) provide reasonable assurance that transactions are recorded as necessary to permit preparation of financialstatements in accordance with generally accepted accounting principles, and that receipts and expenditures of the entity are beingmade only in accordance with authorizations of management and directors of the entity; and (3) provide reasonable assuranceregarding prevention or timely detection of unauthorized acquisition, use, or disposition of the entity’s assets that could have amaterial effect on the financial statements.
Because of its inherent limitations, internal control over financial reporting may not prevent or detect misstatements. Also,projections of any evaluation of effectiveness to future periods are subject to the risk that controls may become inadequate becauseof changes in conditions, or that the degree of compliance with the policies or procedures may deteriorate.
In our opinion, Pengrowth Energy Corporation maintained, in all material respects, effective internal control over financial reportingas of December 31, 2010, based on the criteria established in Internal Control – Integrated Framework issued by the Committee ofSponsoring Organizations of the Treadway Commission (COSO).
We also have audited, in accordance with Canadian generally accepted auditing standards and the standards of the Public CompanyAccounting Oversight Board (United States), the consolidated balance sheets of the Pengrowth Energy Corporation as ofDecember 31, 2010 and 2009, and the related consolidated statements of income and deficit and cash flow for the years then ended,and our report dated March 8, 2011 expressed an unqualified opinion on those consolidated financial statements.
Chartered AccountantsCalgary, CanadaMarch 8, 2011
42 PENGROWTH 2010 Financial Results

CONSOLIDATED BALANCE SHEETS
(Stated in thousands of dollars)
As atDecember 31 2010
As atDecember 31 2009
ASSETSCurrent Assets
Cash and term deposits $ 2,849 $ –Accounts receivable 189,616 182,342Fair value of risk management contracts (Note 20) 13,550 14,001Future income taxes (Note 11) – 969
206,015 197,312Other Assets (Note 5) 47,114 46,027Property, Plant And Equipment (Note 6) 4,076,976 3,789,369Goodwill (Note 4) 712,661 660,896TOTAL ASSETS $ 5,042,766 $ 4,693,604
LIABILITIES AND SHAREHOLDERS’ EQUITYCurrent Liabilities
Bank indebtedness (Note 9) $ 22,000 $ 11,563Accounts payable 240,952 185,337Distributions payable (Note 14) 22,534 40,590Fair value of risk management contracts (Note 20) 9,278 17,555Future income taxes (Note 11) 1,203 –Contract liabilities (Note 7) 1,677 1,728Current portion of long-term debt (Note 9) – 157,546
297,644 414,319Fair Value of Risk Management Contracts (Note 20) 31,416 23,269Contract Liabilities (Note 7) 6,275 7,952Convertible Debentures (Note 8) – 74,828Long Term Debt (Note 9) 1,024,367 907,599Asset Retirement Obligations (Note 10) 259,538 288,796Future Income Taxes (Note 11) 236,550 181,640Shareholders’ Equity
Shareholders’ capital (Notes 1 and 12) 3,167,383 –Trust unitholders’ capital (Note 12) – 4,920,945Equity portion of convertible debentures (Note 8) – 160Contributed surplus (Note 12) 19,593 18,617Deficit (Note 14) – (2,144,521)
3,186,976 2,795,201Commitments (Note 21)Contingencies (Note 22)Subsequent Event (Note 23)TOTAL LIABILITIES AND SHAREHOLDERS’ EQUITY $ 5,042,766 $ 4,693,604
See accompanying notes to the consolidated financial statements.
Approved on behalf of the Board of Directors of Pengrowth Energy Corporation.
Director Director
PENGROWTH 2010 Financial Results 43

CONSOLIDATED STATEMENTS OF INCOME AND DEFICIT
(Stated in thousands of dollars, except per share amounts)
Year Ended December 312010 2009
REVENUES
Oil and gas sales $ 1,353,283 $ 1,343,167
Unrealized gain (loss) on commodity risk management (Note 20) 6,949 (173,726)
Processing and other income 20,598 18,758
Royalties, net of incentives (252,699) (207,563)
1,128,131 980,636
EXPENSES
Operating 371,716 384,412
Transportation 15,739 13,467
Amortization of injectants for miscible floods 15,056 19,989
Interest and financing charges 70,464 80,274
General and administrative 50,894 62,195
Management fee (Note 17) – 2,793
Realized foreign exchange loss (gain) (Note 15) 2,061 (489)
Unrealized foreign exchange gain (Note 15) (49,918) (149,233)
Depletion, depreciation and amortization 529,396 591,355
Accretion (Note 10) 22,960 27,677
Gain on equity investment (Note 4) (73,756) –
Other (income) expenses (11,909) 6,288
942,703 1,038,728
Income (loss) before taxes 185,428 (58,092)
Future income tax reduction (Note 11) (44,829) (142,945)
NET INCOME AND COMPREHENSIVE INCOME $ 230,257 $ 84,853
Deficit, beginning of year (2,144,521) (1,941,521)
Distributions declared (Notes 1 and 14) (232,584) (287,853)
Elimination of deficit (Notes 1 and 14) 2,146,848 –
DEFICIT, END OF YEAR (Note 14) $ – $ (2,144,521)
Net income per share (Notes 1 and 18)
Basic and Diluted $ 0.76 $ 0.32
See accompanying notes to the consolidated financial statements.
44 PENGROWTH 2010 Financial Results

CONSOLIDATED STATEMENTS OF CASH FLOW
(Stated in thousands of dollars)
Year Ended December 312010 2009
CASH PROVIDED BY (USED FOR):
OPERATING
Net income and comprehensive income $ 230,257 $ 84,853
Depletion, depreciation and accretion 552,356 619,032
Future income tax reduction (Note 11) (44,829) (142,945)
Contract liability amortization (1,728) (2,483)
Amortization of injectants 15,056 19,989
Purchase of injectants (9,324) (13,298)
Expenditures on remediation (Note 10) (20,926) (18,042)
Unrealized foreign exchange gain (Note 15) (49,918) (149,233)
Unrealized (gain) loss on commodity risk management (Note 20) (6,949) 173,726
Trust unit based compensation (Note 12) 4,565 8,125
Non-cash gain on equity investment (Note 4) (73,756) –
Other items 1,192 4,248
Changes in non-cash operating working capital (Note 16) 9,999 (32,622)
605,995 551,350
FINANCING
Distributions paid (Notes 1 and 14) (250,640) (334,405)
Bank indebtedness 10,437 8,932
Repayment of Monterey bank debt (Note 4) (41,883) –
Repayment of long term debt (Note 9) (172,600) (312,000)
Private placement of term notes, net of costs (Note 9) 189,902 –
Redemption of convertible debentures (Note 8) (76,610) –
Other financing costs (3,110) –
Proceeds from equity issues 26,980 321,605
(317,524) (315,868)
INVESTING
Expenditures on property, plant and equipment (333,842) (207,451)
Other property acquisitions (20,171) (35,655)
Proceeds on property dispositions 60,721 41,885
Other investments (2,906) 852
Change in remediation trust funds (Note 5) (6,952) (7,656)
Change in non-cash investing working capital (Note 16) 17,528 (27,457)
(285,622) (235,482)
CHANGE IN CASH AND TERM DEPOSITS 2,849 –
CASH AND TERM DEPOSITS AT BEGINNING OF YEAR – –
CASH AND TERM DEPOSITS AT END OF YEAR $ 2,849 $ –
See accompanying notes to the consolidated financial statements.
PENGROWTH 2010 Financial Results 45

NOTES TO CONSOLIDATED FINANCIAL STATEMENTS
YEARS ENDED DECEMBER 31, 2010 AND 2009
(Tabular amounts are stated in thousands of dollars except per share amounts and as otherwise stated)
1. CORPORATE STRUCTURE
Pengrowth Energy Corporation (the “Corporation”) is a Canadian resource company that is engaged in the production, development,exploration and acquisition of oil and natural gas assets. The Corporation was formed through a unitholder and Court approvedreorganization involving Pengrowth Energy Trust (the “Trust”), Pengrowth Corporation, its subsidiaries and the security holders ofthe Trust and Pengrowth Corporation pursuant to a Plan of Arrangement (the “Arrangement”) under the Business Corporations Act(Alberta).
On December 31, 2010 (the “Date of Conversion”), the Trust completed its conversion from an open-end investment trust to acorporation through a business combination resulting in the unitholders of the Trust and the exchangeable shareholders ofPengrowth Corporation owning all the common shares of the Corporation. Unitholders of the Trust received common shares in theCorporation on a one-for-one basis. Exchangeable shareholders of Pengrowth Corporation received 1.02308 common shares of theCorporation for each exchangeable share held. Pursuant to the Arrangement agreement, shareholders’ capital was reduced by theamount of the consolidated deficit of the Trust on December 31, 2010. The management team and Board of Directors of theCorporation are comprised of the former management team and elected members of the Board of Directors of the Trust.
The Corporation effected an internal reorganization subsequent to the date of conversion whereby, among other things, the Trustand its subsidiaries were dissolved and the Corporation received all the assets and assumed all the liabilities of the Trust.
The Arrangement has been accounted for on a continuity of interest basis and accordingly, the consolidated financial statements forperiods prior to the date of conversion reflect the financial position, results of operations and cash flows as if the Corporation hadalways carried on the business formerly carried on by the Trust. These financial statements may at times refer to common shares,shareholders, shareholders’ capital and dividends which, prior to the Arrangement, were referred to as trust units, trustunitholders, trust unitholders’ capital and distributions, respectively. References made to trust units are those issued by the Trust.Comparative amounts in these financial statements will also reflect the history of the Trust and its subsidiaries.
2. SIGNIFICANT ACCOUNTING POLICIES
BASIS OF PRESENTATIONThese financial statements have been prepared in accordance with Generally Accepted Accounting Principles (“GAAP”) in Canadaon a consolidated basis and include the accounts of the Corporation, the Trust and its subsidiaries, collectively referred to as“Pengrowth”. All inter-entity transactions have been eliminated.
Effective January 1, 2011, Pengrowth will be required to prepare financial statements in accordance with International FinancialReporting Standards (“IFRS”).
JOINT INTEREST OPERATIONSA significant proportion of Pengrowth’s petroleum and natural gas development and production activities are conducted with othersand accordingly, the accounts reflect only Pengrowth’s interest in such activities.
PROPERTY, PLANT AND EQUIPMENTPengrowth follows the full cost method of accounting for oil and gas properties and facilities whereby all costs of developing andacquiring oil and gas properties are capitalized. These costs include lease acquisition costs, geological and geophysicalexpenditures, costs of drilling and completion of wells, plant and production equipment costs and related overhead charges.Pengrowth capitalizes a portion of general and administrative costs associated with exploration and development activities.
Pengrowth excludes the cost of acquiring and evaluating certain unproved properties and costs associated with major developmentprojects from the cost base subject to depletion as quantified in Note 6. Capitalized costs, including future development costs andexcluding the cost of unproven properties and major development projects, are depleted on a unit of production method based ontotal proved reserves before royalties as estimated by independent engineers. The fair value of future estimated asset retirementobligations associated with properties and facilities are capitalized and included in the depletion calculation. The associated assetretirement obligations on future development capital costs are also included in the cost base subject to depletion. Costs of
46 PENGROWTH 2010 Financial Results

unproven properties are subject to depletion as proven reserves are established or if an impairment of these costs has occurred.Capitalized costs associated with major development projects are subject to depletion when the property begins producing or whendevelopment of the property ceases. If impairment occurs for a major development project, the associated costs with the projectare also subject to depletion. The amount of major development costs transferred to the depletable cost pool is on a proportionatebasis of the land developed and producing at the end of the period. Natural gas production and reserves are converted to equivalentunits of crude oil using their relative energy content of 6:1, as per industry standards.
Repairs and maintenance costs are expensed as incurred.
Proceeds from disposals of oil and gas properties and equipment are credited against capitalized costs unless the disposal wouldalter the rate of depletion and depreciation by more than 20 percent, in which case a gain or loss on disposal is recorded.
There is a limit on the carrying value of property, plant and equipment and other assets, which may be depleted against revenues offuture periods (the “ceiling test”). Initially, the carrying value is assessed to be recoverable when the sum of the undiscounted cashflows expected from the production of proved reserves, and the lower of cost and recoverable amount of unproved properties andmajor development projects exceeds the carrying value. If the carrying value is not assessed to be recoverable, an impairment lossis recognized to the extent that the carrying value of assets exceeds the sum of the discounted cash flows expected from theproduction of proved and probable reserves including the lower of cost and recoverable amount of unproved properties and the costof major development projects. The cash flows are estimated using expected future product prices and costs and are discountedusing a risk-free interest rate. The carrying value of property, plant and equipment and other assets subject to the ceiling testincludes asset retirement costs.
Pengrowth performs a separate recoverability test for capitalized costs associated with unproven properties and majordevelopment projects. Indicators are used to assess whether capitalized costs may be impaired which include, but are not limitedto, the following: the Corporation’s plans to actively pursue exploration, evaluation or development of the property, the timing ofleases expiring on the undeveloped land and the economic outlook for commodity prices and costs. If impairment has beenassessed, Pengrowth will determine the amount of capitalized costs to transfer to the depletable cost base on a property specificbasis or based on specific factors related to the group of capitalized costs determined to be impaired. The amount transferred maybe based on the excess of the capitalized costs over the expected cash flows for the property or if the entire property or project isimpaired, the total accumulated capitalized costs for the property or project would be depleted.
GOODWILLGoodwill, which represents the excess of the total purchase price over the estimated fair value of the net identifiable assets andliabilities acquired, is not amortized but instead is assessed for impairment annually or as events occur that could suggestimpairment exists. Impairment is assessed by determining the fair value of the reporting entity and comparing this fair value to thebook value of the reporting entity. If the fair value of the reporting entity is less than the book value, impairment is measured byallocating the fair value of the reporting entity to the identifiable assets and liabilities of the reporting entity as if the reporting entityhad been acquired in a business combination for a purchase price equal to its fair value. Any excess of the fair value of the reportingentity over the assigned values of the identifiable assets and liabilities is the fair value of the goodwill. Any excess of the book valueof goodwill over this implied fair value is the impairment amount. Impairment is charged to earnings in the period in which itoccurs. Goodwill is stated at cost less impairment.
INJECTANT COSTSInjectants (mostly natural gas and ethane) are used in miscible flood programs to stimulate incremental oil recovery. The cost ofhydrocarbon injectants purchased from third parties for miscible flood projects is deferred and amortized over the period ofexpected future economic benefit which is currently estimated as 24 months.
ASSET RETIREMENT OBLIGATIONSPengrowth initially recognizes the fair value of an Asset Retirement Obligation (“ARO”) in the period in which it is incurred when areasonable estimate of the fair value can be made. The fair value of the estimated ARO is recorded as a liability, with acorresponding increase in the carrying amount of the related asset. The capitalized amount is depleted on the unit of productionmethod based on proved reserves. The liability amount is increased each reporting period due to the passage of time and theamount of accretion is expensed to income in the period. Actual costs incurred upon the settlement of the ARO are charged againstthe ARO. Management reviews the ARO estimate and changes, if any, are applied prospectively. Revisions made to the ARO estimateare recorded as an increase or decrease to the ARO liability with a corresponding entry made to the carrying amount of the relatedasset.
PENGROWTH 2010 Financial Results 47

Pengrowth has placed cash in segregated remediation trust accounts to fund certain ARO for the Judy Creek properties and theSable Offshore Energy Project (“SOEP”).
INCOME TAXESPengrowth follows the asset and liability method of accounting for income taxes. Under this method, income tax liabilities andassets are recognized for the estimated tax consequences attributable to differences between the amounts reported in the financialstatements and their respective tax bases, using substantively enacted income tax rates. The effect of a change in income tax rateson future income tax liabilities and assets is recognized in income in the period the change occurs. Pengrowth’s policy for incometax uncertainties is to recognize tax benefits only when it is more likely than not the position will be sustained on examination.
SHARE BASED COMPENSATION PLANSPengrowth has share based compensation plans, which are described in Note 13. Compensation expense is based on the estimatedfair value of the share based compensation award at the date of grant. Compensation expense associated with the share basedcompensation plans are recognized in income over the vesting period of the plan with a corresponding increase to contributedsurplus. Pengrowth estimates the forfeiture rate for each type of share based award at the date of grant. Any consideration receivedupon the exercise of share unit rights and options together with the amount of non-cash compensation expense recognized incontributed surplus is recorded as an increase in shareholders’ capital.
Pengrowth does not have any outstanding share based compensation plans that call for settlement in cash or other assets. Grantsof such items, if any, will be recorded as liabilities, with changes in the liabilities charged to net income, based on the intrinsic value.
FINANCIAL INSTRUMENTSFinancial instruments are utilized by Pengrowth to manage its exposure to commodity price fluctuations, foreign currency andinterest rate exposures. Pengrowth’s policy is not to utilize financial instruments for trading or speculative purposes.
Financial instruments are classified into one of five categories: held for trading, held to maturity investments, loans andreceivables, available for sale financial assets or other liabilities. Pengrowth has designated cash and term deposits as held fortrading which are measured at fair value. Accounts receivable are classified as loans and receivables which are measured atamortized cost. Investments held in the remediation trust funds have been designated as held to maturity and held for tradingbased on the type of investments in the fund. Other investments included in other assets have been designated as held for tradingand available for sale based on the type of investment. Changes in fair value of held for trading investments are recorded asunrealized gains (losses) and are included in other expenses (income) in the consolidated statements of income and deficit. Theavailable for sale securities included in other assets is recorded at cost as the investment is in a private entity whose shares are notquoted in an active market. Held to maturity investments are measured at amortized cost. Bank indebtedness, accounts payable,dividends payable and long term debt have been classified as other liabilities which are measured at amortized cost using theeffective interest rate method.
All derivatives are classified as held for trading which are measured at fair value with changes in fair value over a reporting periodrecognized in net income. Changes in the fair value of derivatives used in certain hedging transactions for which cash flow hedgeaccounting is permitted would be recorded in other comprehensive income. Pengrowth does not have any risk managementcontracts outstanding for which hedge accounting is being applied.
Comprehensive income includes net income and transactions and other events from non-owner sources such as unrealized gainsand losses on effective cash flow hedges. There are no amounts that Pengrowth would include in other comprehensive incomeexcept for net income.
Transaction costs incurred in connection with the issuance of term debt instruments with a maturity of greater than one year arededucted against the carrying value of the debt and amortized to net income using the effective interest rate method over theexpected life of the debt.
Pengrowth capitalizes transaction costs incurred in connection with the renewal of the revolving credit facility with a maturity dategreater than one year and amortizes the cost to net income on a straight line basis over the term of the facility.
FOREIGN CURRENCYThe U.S. dollar and U.K. Pound Sterling denominated debt are translated into Canadian dollars at the exchange rate in effect on thebalance sheet date. Foreign exchange gains and losses on the U.S. dollar and U.K. Pound Sterling denominated debt are included inincome.
48 PENGROWTH 2010 Financial Results

EQUITY INVESTMENTPengrowth utilizes the equity method of accounting for investments subject to significant influence. Under this method, investmentsare initially recorded at cost and adjusted thereafter to include Pengrowth’s pro rata share of post-acquisition earnings. Anydividends received or receivable from the investee would reduce the carrying value of the investment.
MEASUREMENT UNCERTAINTYThe preparation of financial statements in conformity with Canadian GAAP requires management to make estimates andassumptions that affect the reported amounts of assets and liabilities at the date of the financial statements and revenues andexpenses for the period then ended.
The amounts recorded for depletion, depreciation, amortization of injectants, goodwill, future income taxes, fair value of riskmanagement contracts and ARO are based on estimates. Management reviews the cost estimates and timing assumptions relatedto the ARO liability on an annual basis which may result in a revision to the ARO liability. The ceiling test calculation is based onestimates of proved and probable reserves, production rates, oil and natural gas prices, future costs and other relevantassumptions. The impairment assessment of goodwill is based on the estimated fair value of Pengrowth which is referenced toPengrowth’s common share price and an estimate of the premium that an arm’s length party would pay to acquire all of theoutstanding common shares. By their nature, these estimates are subject to measurement uncertainty and may impact theconsolidated financial statements of future periods.
NET INCOME PER SHAREBasic net income per share is calculated using the weighted average number of shares outstanding for the year. Diluted net incomeper share amounts includes the dilutive effect of share unit rights and options and deferred entitlement share units using thetreasury stock method. The treasury stock method assumes that any proceeds obtained on the exercise of in-the-money share unitrights and options would be used to purchase common shares at the average trading price during the period. Diluted net incomeper share amounts also include the dilutive effect of convertible debentures using the “if-converted” method which assumes thatthe convertible debentures were converted at the beginning of the period.
REVENUE RECOGNITIONRevenue from the sale of oil and natural gas is recognized when the product is delivered and collection is reasonably assured.Revenue from processing and other miscellaneous sources is recognized upon completion of the relevant service.
CASH AND TERM DEPOSITSCash and term deposits include demand deposits and term deposits with original maturities of less than 90 days.
COMPARATIVE FIGURESCertain comparative figures have been reclassified to conform to the presentation adopted in the current year.
3. CHANGE IN ACCOUNTING POLICIES
As of January 1, 2010, Pengrowth early adopted the following new Canadian standards:
CICA 1582 “Business Combinations”, which replaces the previous business combinations standard. The standard requires assetsand liabilities acquired in a business combination, consideration paid, contingent consideration and certain acquired contingenciesto be measured at fair value on the date of acquisition. In addition, acquisition related and restructuring costs are recognizedseparately from the business combination and are included in the statement of income. The adoption of this standard impacts theaccounting treatment of business combinations entered on or after January 1, 2010. With respect to the Monterey acquisition in2010 (Note 4), the most significant impact of the new standards was the recognition of a $73.8 million gain on Pengrowth’s existingequity investment in Monterey. In addition, the share consideration paid for Monterey was valued using the closing date trust unitprice versus the announcement date trust unit price which increased the consideration paid by $40.0 million.
CICA 1601 “Consolidated Financial Statements”, which together with Section 1602 below replace the former consolidated financialstatements standard. Section 1601 establishes the requirements for the preparation of consolidated financial statements. Theadoption of this standard had no material impact on Pengrowth’s financial statements.
PENGROWTH 2010 Financial Results 49

CICA 1602 “Non-controlling Interests” establishes the accounting for a non-controlling interest in a subsidiary in consolidatedfinancial statements subsequent to a business combination. The standard requires a non-controlling interest in a subsidiary to beclassified as a separate component of equity. In addition, net earnings and components of other comprehensive income areattributed to both the parent and non-controlling interest. The adoption of this standard had no impact on the consolidated financialstatements.
4. MONTEREY ACQUISITION
Pengrowth and Monterey Exploration Ltd. (“Monterey”) completed a business combination (the “Combination”) whereby eachMonterey securityholder elected to receive either: (i) 0.8298 of a trust unit or (ii) 0.8298 of an exchangeable share of PengrowthCorporation with each exchangeable share being exchangeable to a trust unit. The Combination closed on September 15, 2010 withPengrowth acquiring 100% of the voting interest in Monterey and resulted in the issuance of 28 million trust units and 5 millionexchangeable shares of Pengrowth Corporation to the former Monterey securityholders.
The trust units and exchangeable shares issued in the Combination were valued at $11.00 per trust unit/exchangeable share basedon the closing trading price of the trust units on the date of the Combination. Prior to the Combination, Pengrowth heldapproximately nine million common shares or approximately 20 percent of the outstanding common shares of Monterey. Under thenew Canadian accounting standards for business combinations early adopted on January 1, 2010, Pengrowth was required to fairvalue its previously held equity investment in Monterey and, as a result, recorded a gain of $73.8 million arising from the differencebetween the fair value on closing date and the book value of the investment prior to the Combination. The fair value of Pengrowth’spreviously held equity investment in Monterey was included in the purchase consideration.
The Combination was accounted for as an acquisition of Monterey by Pengrowth as follows:
Acquired net assets:
Property, plant and equipment $ 570,367
Goodwill 51,765
Bank debt (41,883)
Asset retirement obligations (7,888)
Working capital deficit (25,667)
Future income taxes (102,043)
$ 444,651
Consideration:
Trust units $ 307,648
Exchangeable shares 54,939
Fair value of previous equity investment 82,064
$ 444,651
The estimated fair value of property, plant and equipment was determined using both internal estimates and an independentreserve evaluation. Property, plant and equipment acquired in the Combination included approximately $49 million of producingassets and $521 million of unproven and development properties. The amount of the unproven and development properties wasinitially excluded from the depletion calculation in accordance with Pengrowth’s accounting policy. The future income tax liabilitywas determined based on applying Pengrowth’s effective future income tax rate of approximately 26 percent to the differencebetween the book and tax basis of the assets acquired. The asset retirement obligations were determined using Pengrowth’sestimated costs to remediate, reclaim and abandon the wells and facilities, the estimated timing of the costs to be incurred infuture periods, an inflation rate of two percent, and a discount rate of eight percent. Transaction costs relating to legal and advisoryfees incurred in the Combination of approximately $1.4 million were expensed in the period and included in other expenses(income).
The acquisition of Monterey is consistent with Pengrowth’s strategic focus of acquiring and developing operated unconventionalresource plays in the Western Canadian Sedimentary Basin. Pengrowth recognized goodwill of approximately $52 million in theCombination representing, in part, the value of establishing a new core area with resource assets in the Montney play. Pengrowth’sability to increase this value beyond what Monterey could realize is partially a result of Pengrowth’s ability to fund the developmentof the necessary capital infrastructure with a lower cost of capital. Goodwill is also impacted by recognizing a future tax liability onthe acquisition at an undiscounted amount as required under Canadian accounting standards. Goodwill is not deductible for taxpurposes.
50 PENGROWTH 2010 Financial Results

The consolidated financial statements include the results of operations and cash flows from Monterey subsequent to the closingdate of September 15, 2010. The impact of the Combination on revenue and net income is not material for pro-forma disclosures.
5. OTHER ASSETS
2010 2009
Remediation trust funds $ 42,114 $ 34,837
Equity investment in Monterey Exploration Ltd. – 5,039
Other investments 5,000 6,151
$ 47,114 $ 46,027
REMEDIATION TRUST FUNDSPengrowth has a contractual obligation to make contributions to a remediation trust fund that is used to cover certain ARO of theJudy Creek properties. Pengrowth makes monthly contributions to the fund of $0.10 per boe of production from the Judy Creekproperties and an annual lump sum contribution of $250,000. Every five years, Pengrowth must evaluate the assets in the trust fundand the outstanding ARO, and make recommendations to the former owner of the Judy Creek properties as to whether contributionlevels should be changed. The next evaluation is anticipated to occur in 2012. Contributions to the Judy Creek remediation trustfund may change based on future evaluations of the fund. The investment in the Judy Creek remediation trust fund is classified asheld to maturity and is measured at amortized cost. Interest income is recognized when earned and included in other expenses(income). As at December 31, 2010, the carrying value of the Judy Creek remediation trust fund was $8.7 million (December 31,2009 – $8.8 million).
Pengrowth has a contractual obligation to make contributions to a remediation trust fund that will be used to fund the ARO of theSOEP properties and facilities. Pengrowth currently makes a monthly contribution to the fund of $0.52 per mmbtu of natural gasproduction and $1.04 per bbl of natural gas liquids production from SOEP. The SOEP remediation trust fund as at December 31,2010 was $33.4 million (December 31, 2009 – $26.0 million). Investment income is recognized when earned and is recorded as otherexpense (income). The investments in the fund have been designated as held for trading and are recorded at fair value.
The following reconciles Pengrowth’s remediation trust funds for 2010 and 2009:
Remediation Trust Funds 2010 2009
Opening balance $ 34,837 $ 27,122
Contributions to Judy Creek Remediation Trust Fund 537 635
Contributions to SOEP Environmental Restoration Fund 7,111 7,579
Remediation funded by Judy Creek Remediation Trust Fund (696) (558)
Change in remediation trust funds 6,952 7,656
Unrealized gain on held for trading investment 325 59
Closing balance $ 42,114 $ 34,837
EQUITY INVESTMENT IN MONTEREYOn September 15, 2010, Pengrowth completed a business combination with Monterey described in Note 4. Prior to the businesscombination, Pengrowth held an equity interest in Monterey. As of December 31, 2009, Pengrowth held approximately 20 percent ofthe outstanding common shares of Monterey. Pengrowth recorded a pre-tax loss of $3.7 million in 2009 to reflect Pengrowth’sproportionate share of Monterey’s net loss in the period. In addition, Pengrowth recorded a pre-tax loss of $1.1 million in 2009 as aresult of decreases in its ownership in Monterey. The decrease in ownership was due to Pengrowth not participating in the shareissuances completed by Monterey. The equity income (loss) and ownership adjustments are included in other expenses (income) inthe consolidated statements of income and deficit.
OTHER INVESTMENTSPengrowth sold the remaining shares it held of a public corporation in January 2010 for proceeds of $1.1 million.
Pengrowth holds an investment in a private company with a carrying value of $5 million (December 31, 2009 – $5 million). Theinvestment has been designated as available for sale and is recorded at cost as the shares are not quoted in an active market.
PENGROWTH 2010 Financial Results 51

6. PROPERTY, PLANT AND EQUIPMENT
2010 2009
Property, plant and equipment, at cost $ 8,095,143 $ 7,272,408
Accumulated depletion, depreciation and amortization (4,028,160) (3,498,764)
Net book value of property, plant and equipment 4,066,983 3,773,644
Net book value of deferred injectant costs 9,993 15,725
Net book value of property, plant and equipment and deferred injectants $ 4,076,976 $ 3,789,369
In 2010, approximately $12.9 million (2009 – $9.2 million) of general and administrative costs were capitalized.
As at December 31, 2010, approximately $512 million (December 31, 2009 – $68 million) of capitalized costs to acquire and evaluateunproven and development properties has been excluded from depletion.
Pengrowth performed a ceiling test calculation at December 31, 2010 to assess the recoverable value of property, plant andequipment. The oil and gas future prices and costs are based on the January 1, 2011 commodity price forecast of our independentreserve evaluators. These prices have been adjusted for commodity price differentials specific to Pengrowth. The following tablesummarizes the benchmark prices which are provided by an independent recognized valuation firm used in the ceiling testcalculation. Based on these assumptions, the undiscounted value of future net revenues from Pengrowth’s proved reservesexceeded the carrying value of property, plant and equipment at December 31, 2010.
YearWTI Oil
(U.S.$/bbl)
ForeignExchange Rate
(U.S.$/Cdn$)
Edmonton LightCrude Oil
(Cdn$/bbl)AECO Gas
(Cdn$/mmbtu)
2011 $ 88.00 0.980 $ 86.22 $ 4.16
2012 $ 89.00 0.980 $ 89.29 $ 4.74
2013 $ 90.00 0.980 $ 90.92 $ 5.31
2014 $ 92.00 0.980 $ 92.96 $ 5.77
2015 $ 95.17 0.980 $ 96.19 $ 6.22
2016 $ 97.55 0.980 $ 98.62 $ 6.53
2017 $ 100.26 0.980 $ 101.39 $ 6.76
2018 $ 102.74 0.980 $ 103.92 $ 6.90
2019 $ 105.45 0.980 $ 106.68 $ 7.06
2020 $ 107.56 0.980 $ 108.84 $ 7.21
Thereafter + 2.0 percent/yr 0.980 + 2.0 percent/yr + 2.0 percent/yr
At December 31, 2010, Pengrowth has assessed that no impairment exists for capitalized costs associated with unproven anddevelopment properties.
7. CONTRACT LIABILITIES
Contract liabilities are composed of the following amounts:
2010 2009
Current portion of firm transportation contracts $ 1,677 $ 1,728
Non-current portion of firm transportation contracts 6,275 7,952
$ 7,952 $ 9,680
Pengrowth assumed firm transportation commitments in conjunction with certain acquisitions. The fair values of these contractswere estimated on the date of acquisition and the amount recorded is reduced as the contracts settle.
52 PENGROWTH 2010 Financial Results

8. CONVERTIBLE DEBENTURES
On January 14, 2010, Pengrowth redeemed all of the outstanding Convertible Unsecured Subordinated Debentures. The cashredemption amount was approximately $76.8 million, including accrued interest to the redemption date. The debentures boreinterest at 6.5% per annum and were convertible at $25.54 per share.
9. LONG TERM DEBT
2010 2009
U.S. dollar denominated senior unsecured notes:
150 million at 4.93 percent due April 2010 $ – $ 157,546
50 million at 5.47 percent due April 2013 49,638 52,417
71.5 million at 4.67 percent due May 2015 70,731 –
400 million at 6.35 percent due July 2017 396,219 418,530
265 million at 6.98 percent due August 2018 262,354 277,138
115.5 million at 5.98 percent due May 2020 114,206 –
$ 893,148 $ 905,631
U.K. Pound Sterling denominated 50 million unsecured notes at 5.46 percent due December2015 77,219 84,514
Canadian dollar 15 million senior unsecured notes at 6.61 percent due August 2018 15,000 15,000
Canadian dollar revolving credit facility borrowings 39,000 60,000
Total long term debt $ 1,024,367 $ 1,065,145
Current portion of long term debt due April 2010 – (157,546)
Non-current portion of long term debt $ 1,024,367 $ 907,599
SENIOR UNSECURED NOTESOn April 23, 2010, U.S. $150 million in senior unsecured notes matured resulting in the realization of a cumulative $66 millionforeign exchange gain.
On May 11, 2010, Pengrowth closed a U.S. $187 million private placement of senior unsecured notes. The notes were offered in twotranches of U.S. $71.5 million at 4.67 percent due May 2015 and U.S. $115.5 million at 5.98 percent due May 2020. Similar to otheroutstanding series, these notes contain certain financial maintenance covenants and interest is paid semi-annually. Costs incurredin connection with issuing the notes, in the amount of $1.2 million, were deducted from the carrying amount of the debt and areamortized to income over the expected term of the notes.
As of December 31, 2010, an unrealized cumulative foreign exchange gain of $63.0 million (December 31, 2009 – gain of$77.6 million) has been recognized on the U.S. dollar term notes since the date of issuance. As of December 31, 2010, an unrealizedcumulative foreign exchange gain of $36.5 million (December 31, 2009 – gain of $29.2 million) has been recognized on theU.K. Pound Sterling denominated term notes since Pengrowth ceased to designate existing foreign exchange swaps as a hedge onJanuary 1, 2007.
The five year schedule of long term debt repayment based on current maturity dates and assuming the revolving credit facility is notrenewed is as follows: 2011 – nil, 2012 – nil, 2013 – $89 million, 2014 – nil, 2015 – $149 million.
CREDIT FACILITIESPengrowth has a committed unsecured $1.0 billion syndicated extendible revolving credit facility. The facility may be renewed at anytime prior to its maturity subject to lender approval. In the event Lenders do not agree to a renewal, the outstanding balance is dueupon maturity. During the fourth quarter, Pengrowth elected to extend the maturity date of the facility by three years to October 29,2013. In conjunction with the renewal of the credit facility, Pengrowth incurred fees of $3.1 million which will be amortized toincome over the term of the facility.
The credit facility provides up to $1.25 billion of credit capacity from a syndicate of seven Canadian and three foreign banks. Of thiscapacity, $1.0 billion is committed while the remaining $250 million is available under an expansion feature subject to lenderparticipation. This facility carries floating interest rates that are expected to range between 2.00 percent and 3.25 percent over
PENGROWTH 2010 Financial Results 53

bankers’ acceptance rates, depending on Pengrowth’s consolidated ratio of senior debt to earnings before interest, taxes andnon-cash items. The facility was reduced by drawings of $39 million and outstanding letters of credit in the amount of approximately$18 million at December 31, 2010.
Pengrowth also maintains a $50 million demand operating facility. This facility was reduced by borrowings of $22 million andoutstanding letters of credit of approximately $5 million at December 31, 2010. All borrowings under this facility are included inbank indebtedness on the balance sheet.
10. ASSET RETIREMENT OBLIGATIONS
The ARO was estimated by management based on Pengrowth’s working interest in wells and facilities, estimated costs toremediate, reclaim and abandon the wells and facilities and the estimated timing of the costs to be incurred, considering variousfactors including the annual reserves evaluation of Pengrowth’s properties from the independent reserve evaluators. Pengrowthhas estimated the net present value of its ARO to be $260 million as at December 31, 2010 (December 31, 2009 – $289 million),based on a total escalated future liability of $1,790 million (December 31, 2009 – $2,016 million). These costs are expected to bemade over 50 years with the majority of the costs incurred between 2041 and 2061. Pengrowth’s credit adjusted risk free rate ofeight percent (2009 – eight percent) and an inflation rate of one and one half percent per annum (2009 – two percent per annum)were used to calculate the net present value of the ARO.
The following reconciles Pengrowth’s ARO:
2010 2009
ARO, beginning of year $ 288,796 $ 344,345
Increase (decrease) in liabilities during the year related to:
Acquisitions 10,309 365
Dispositions (1,145) (2,195)
Additions 1,510 3,146
Revisions (1) (41,966) (66,500)
Accretion expense 22,960 27,677
Liabilities settled in the year (20,926) (18,042)
ARO, end of year $ 259,538 $ 288,796
(1) A corresponding adjustment was made to the related asset.
In 2010, Pengrowth recorded a reduction to the ARO liability of $42.0 million (2009 – $66.5 million reduction) as a result of changesto the inflation rate from two percent per annum to one and one half percent per annum and changes to the estimated timing ofabandonment and reclamation. The change in estimate was made on a prospective basis and a corresponding adjustment wasmade to the related asset.
The following summarizes Pengrowth’s expenditures on ARO for 2010 and 2009:
Expenditures on ARO 2010 2009
Expenditures on ARO not covered by the trust funds $ 20,230 $ 17,484
Expenditures on ARO covered by the trust funds (Note 5) 696 558
$ 20,926 $ 18,042
54 PENGROWTH 2010 Financial Results

11. INCOME TAXES
A reconciliation of tax expense calculated based on the income (loss) before taxes at the statutory tax rate to the actual provision forincome taxes is as follows:
2010 2009
Income (loss) before taxes $ 185,428 $ (58,092)
Combined federal and provincial tax rate 28.40% 29.50%
Expected income tax expense (reduction) 52,668 (17,137)
Net income of the Trust (1) (77,590) (98,851)
Foreign exchange gain (2) (8,320) (21,956)
Effect of change in corporate tax rate 7,666 5,968
Gain on equity investment (20,949) –
Change in valuation allowance (273) (6,170)
Other including stock based compensation (3) 1,969 (4,799)
Future income tax reduction $ (44,829) $ (142,945)
(1) Relates to distributions of taxable income in the Trust for the year ended December 31, 2010 of $273.2 million x 28.40% (December 31,2009 –$334.4 million x 29.56%) where the income tax liability was the responsibility of the trust unitholder.
(2) Reflects the 50% non-taxable portion of foreign exchange gains and losses.
(3) Primarily income that is not taxable and other adjustments.
The future income tax rates in 2010 and 2009 were approximately 25 percent and were applied to the temporary differencescompared to the federal and provincial statutory rate of approximately 28 percent for the 2010 taxation year and 29 percent for the2009 taxation year.
The net future income tax liability is composed of:
2010 2009
Future income tax assets:
Asset retirement obligation $ 66,750 $ 68,890
Non-capital losses 131,222 135,263
Unrealized commodity loss 7,645 7,312
Other 2,271 2,824
207,888 214,289
Less: Valuation allowance – (273)
207,888 214,016
Future income tax liabilities:
Property, plant and equipment and other assets (425,821) (382,285)
Foreign exchange gain (19,820) (12,402)
Net future tax liability $ (237,753) $ (180,671)
In calculating the future income tax liability in 2010, Pengrowth included $514.4 million (2009 – $539.4 million) related tonon-capital losses available for carryforward to reduce taxable income in future years. These losses expire between 2012 and 2030.
12. SHAREHOLDERS’ EQUITY
SHAREHOLDERS’ CAPITALPengrowth is authorized to issue an unlimited number of common shares and up to 10 million preferred shares. No preferredshares have been issued.
PENGROWTH 2010 Financial Results 55

The following provides the number of common shares issued under the Arrangement (Note 1) and the total number of commonshares outstanding as at December 31, 2010:
Number ofCommon Shares Amount
Issued to trust unitholders 321,910,802 $ 5,270,006
Issued to exchangeable shareholders (1) 4,113,238 44,225
Elimination of the deficit (Notes 1 and 14) – (2,146,848)
Balance at December 31, 2010 326,024,040 $ 3,167,383
(1) Common shares issued after applying the exchange ratio of 1.02308 per exchangeable share held.
TRUST UNITHOLDERS’ CAPITALAs a result of the conversion from an income trust to a corporation described in Note 1, all outstanding trust units of the Trust wereexchanged on a one-for-one basis for common shares of the Corporation on December 31, 2010.
The following provides a continuity of trust unitholders’ capital for the years ended 2010 and 2009:
2010 2009
Trust Units IssuedNumber ofTrust Units Amount
Number ofTrust Units Amount
Balance, beginning of year 289,834,790 $ 4,920,945 256,075,997 $ 4,588,587
Issued on redemption of Deferred Entitlement Trust Units(DEUs) (non-cash) 257,607 2,966 416,043 5,741
Issued for cash on exercise of trust unit rights 587,314 3,661 299,684 1,918
Issued for cash under Distribution Reinvestment Plan (DRIP) 2,282,912 24,072 3,026,166 26,319
Issued for the Monterey business combination (Note 4) 27,967,959 307,648 – –
Issued on redemption of Exchangeable shares (1) 980,220 10,714 – –
Issued for cash under At The Market (ATM) Plan – – 1,169,900 10,723
Issued for cash on equity issue – – 28,847,000 300,009
Trust unit rights incentive plan (non-cash exercised) – 623 – 346
Issue costs net of tax – (623) – (12,698)
Trust units exchanged for common shares under theArrangement (Note 1) (321,910,802) (5,270,006) – –
Balance, end of year – $ – 289,834,790 $ 4,920,945
(1) Trust units issued based on the exchange ratio in effect at the time of redemption.
EXCHANGEABLE SHARESPengrowth issued exchangeable shares in the Monterey acquisition described in Note 4. These exchangeable shares were includedin equity based on Canadian accounting standards that permit the inclusion of certain exchangeable shares in equity as theexchangeable shares were exchangeable into trust units based on the exchange ratio in effect at the time of redemption. Theexchange ratio increased with each cash distribution and was calculated by multiplying the distribution per trust unit by the openingexchange ratio and dividing by the ten day weighted average trading price of the trust units on the Toronto Stock Exchange prior tothe distribution record date.
On December 31, 2010, all outstanding exchangeable shares were exchanged into 1.02308 common shares of the Corporation foreach exchangeable share held.
56 PENGROWTH 2010 Financial Results

The following provides a continuity of the exchangeable shares from the date of issue to December 31, 2010:
Number ofShares Amount
Issued for the Monterey business combination (Note 4) 4,994,426 $ 54,939
Redeemed for trust units (973,980) (10,714)
Exchanged for common shares under the Arrangement (Note 1) (4,020,446) (44,225)
Balance at December 31, 2010 – $ –
DIVIDEND REINVESTMENT PLANIn conjunction with the conversion, Pengrowth revised its Dividend Reinvestment Plan (DRIP). DRIP entitles the shareholder toreinvest cash dividends in additional shares of Pengrowth. Under the revised DRIP, the shares are issued from treasury at a fivepercent discount to the weighted average closing price of all shares traded on the TSX for the five trading days preceding a dividendpayment date.
Previously, the Trust had a similar program where unitholders were entitled to reinvest cash distributions in additional trust units ofthe Trust. The trust units under this plan were issued from treasury at a five percent discount to the weighted average closing priceof all trust units traded on the TSX for the twenty trading days preceding a distribution payment date.
“AT THE MARKET” DISTRIBUTIONThe Equity Distribution Program permitted the Trust to distribute up to 25 million trust units from time to time at prevailing marketrates through either the New York or Toronto Stock Exchanges. The program expired in January 2010 and was not reinstatedsubsequent to the Arrangement. No trust units were issued under the program in 2010 (2009 – 1.2 million units).
CONTRIBUTED SURPLUS
2010 2009
Balance, beginning of year $ 18,617 $ 16,579
Trust unit rights incentive plan (non-cash expensed) 1,172 2,953
Deferred entitlement units plan (non-cash expensed) 3,393 5,172
Trust unit rights incentive plan (non-cash exercised) (623) (346)
Deferred entitlement units plans (non-cash exercised) (2,966) (5,741)
Balance, end of year $ 19,593 $ 18,617
13. SHARE BASED COMPENSATION PLANS
Pengrowth has several share based compensation plans. The new Long Term Incentive Plan (LTIP) as described below will be usedto grant awards of share based compensation on or after January 1, 2011. The long term incentive plan that was used by the Trust iscurrently being phased out with no new awards to be issued under the previous incentive plans. Up to four and one half percent ofthe issued and outstanding common shares, in aggregate, may be reserved for issuance under the share based compensationplans.
NEW LONG TERM INCENTIVE PLAN (LTIP)Effective January 1, 2011, the following plans under the new LTIP were implemented:
(a) Performance Share Units (PSUs)PSUs entitle the holder to a number of common shares to be issued in the third year after grant. PSUs are awarded toemployees, officers and special consultants. The number of shares issued will be subject to a performance factor ranging fromzero to two times the number of shares granted plus the amount of reinvested notional dividends.
(b) Restricted Share Units (RSUs)RSUs are awarded to employees, officers and special consultants and entitle the holder to a number of common shares plusreinvested notional dividends to be issued at vesting over three years. The RSUs will vest on the first, second and thirdanniversary date from the date of grant.
PENGROWTH 2010 Financial Results 57

(c) Deferred Share Units (DSUs)The DSU plan is currently intended for members of the Board of Directors. Each DSU entitles the holder to a number ofcommon shares upon the holder ceasing to be a Director of Pengrowth. The number of common shares ultimately issued willbe equal to the number of DSUs initially granted to the holder plus the amount of reinvested notional dividends accruing duringthe term of the DSUs.
The Board of Directors retains certain discretion with respect to performance criteria and other aspects of the LTIP.
PREVIOUS LONG TERM INCENTIVE PLAN(a) Deferred Entitlement Share Units Plan (formerly the DEU Plan)
The DEU Plan that was effective under the Trust was renamed on conversion to the Deferred Entitlement Share Units Plan(DESU). The DESU plan comprises of two types of awards being performance and non-performance related share units. Theperformance related share units issued to each participant at the end of the three year vesting period will be subject to aperformance test which compares Pengrowth’s three year average total return to the three year average total return of a peergroup of other energy corporations such that upon vesting, the number of shares issued from treasury may range from zero totwo times the total of the number of shares granted plus accrued shares through the deemed reinvestment of notionaldividends. The non-performance related share units generally vest equally over three years and entitles the holder in eachvesting year to one third of the number of common shares initially granted plus the amount of any reinvested notionaldividends.
The following provides a continuity of DESUs for the years ended 2010 and 2009:
2010 2009
DESUsNumber
of DESUsWeighted
average priceNumber
of DESUsWeighted
average price
Outstanding, beginning of year 2,291,469 $ 12.38 1,270,750 $ 19.38
Granted 1,469,536 11.21 1,174,601 6.55
Forfeited (548,323) 11.12 (120,637) 12.63
Exercised (459,074) 18.82 (297,184) 20.57
Deemed DRIP (1) 194,980 11.20 263,939 14.05
Outstanding, end of year 2,948,588 $ 10.95 2,291,469 $ 12.38
Comprised of:
Performance related DESUs 1,957,660 $ 10.47 2,104,400 $ 12.18
Non-Performance related DESUs 990,928 11.91 187,069 14.61
Outstanding, end of year 2,948,588 $ 10.95 2,291,469 $ 12.38
(1) Weighted average deemed DRIP price is based on the average of the original grant prices.
Compensation expense related to the DESU plan is based on the fair value of the share units at the date of grant. The fair value ofthe performance related share units is determined at the date of grant using the closing share price and is adjusted for theestimated performance multiplier. The amount of compensation expense is reduced by an estimated forfeiture rate at the date ofgrant, which has been estimated at 25 percent for officers and employees. The number of shares awarded at the end of the vestingperiod is subject to certain performance conditions. Fluctuations in compensation expense may occur due to changes in estimatingthe outcome of the performance conditions.
Pengrowth recorded compensation expense of approximately $3.4 million in 2010 (2009 – $5.2 million) related to the DESU plan.Compensation expense associated with the DESUs granted in 2010 was based on the weighted average grant date fair value of$11.21 per DESU (2009 – $6.55 per DESU). As at December 31, 2010, the amount of compensation expense to be recognized overthe remaining vesting period was $10.0 million (December 31, 2009 – $6.6 million) or $4.26 per DESU (2009 – $4.34 per DESU),subject to the determination of the performance multiplier. The unrecognized compensation cost will be expensed to net incomeover the remaining weighted average vesting period of 1.6 years (2009 – 1.6 years).
(b) Common Share Rights Incentive Plan (formerly the Trust Unit Rights Incentive Plan)The Trust Unit Rights Incentive Plan that was effective under the Trust was renamed as the Common Share Rights IncentivePlan. This plan consists of two types of awards being share unit options exercisable at a fixed price and share unit rightsexercisable at the original grant price or at a reduced price that is calculated in accordance with the plan. The Common ShareRights Incentive Plan provides the holder the right to purchase common shares over a five year period. In 2010 there were noexercise price reductions under this plan (2009 – $0.03 per share unit right).
58 PENGROWTH 2010 Financial Results
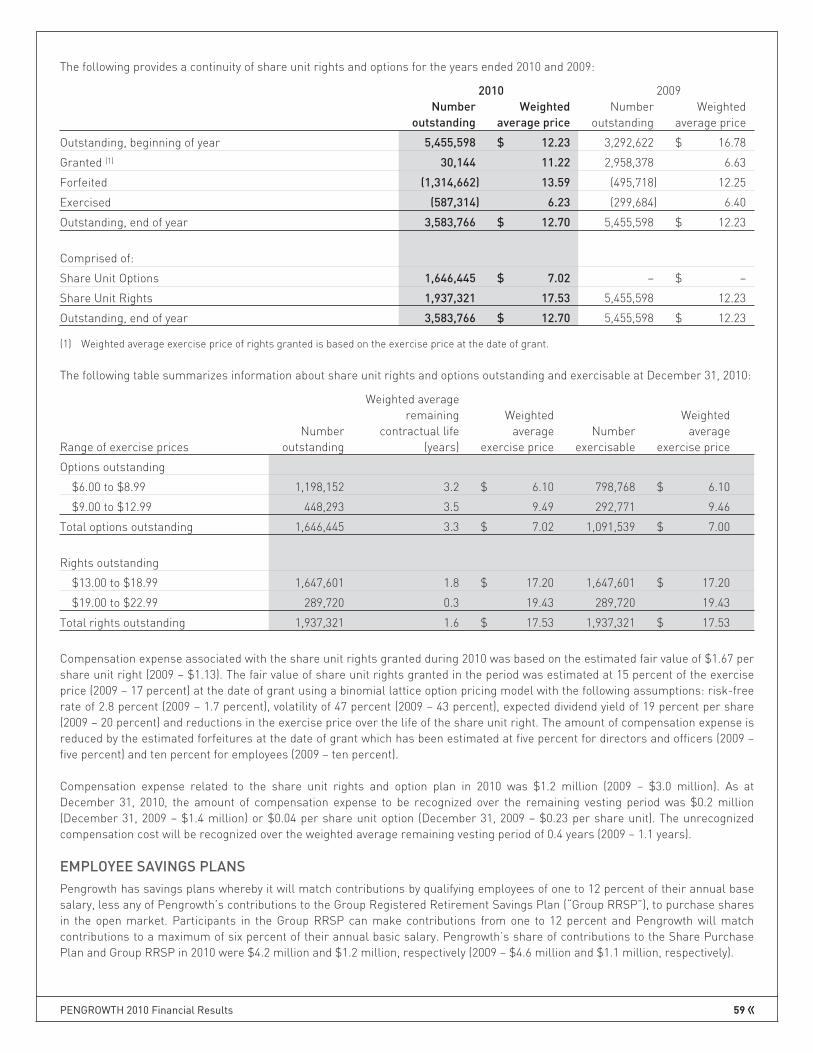
The following provides a continuity of share unit rights and options for the years ended 2010 and 2009:
2010 2009Number
outstandingWeighted
average priceNumber
outstandingWeighted
average price
Outstanding, beginning of year 5,455,598 $ 12.23 3,292,622 $ 16.78
Granted (1) 30,144 11.22 2,958,378 6.63
Forfeited (1,314,662) 13.59 (495,718) 12.25
Exercised (587,314) 6.23 (299,684) 6.40
Outstanding, end of year 3,583,766 $ 12.70 5,455,598 $ 12.23
Comprised of:
Share Unit Options 1,646,445 $ 7.02 – $ –
Share Unit Rights 1,937,321 17.53 5,455,598 12.23
Outstanding, end of year 3,583,766 $ 12.70 5,455,598 $ 12.23
(1) Weighted average exercise price of rights granted is based on the exercise price at the date of grant.
The following table summarizes information about share unit rights and options outstanding and exercisable at December 31, 2010:
Range of exercise pricesNumber
outstanding
Weighted averageremaining
contractual life(years)
Weightedaverage
exercise priceNumber
exercisable
Weightedaverage
exercise price
Options outstanding
$6.00 to $8.99 1,198,152 3.2 $ 6.10 798,768 $ 6.10
$9.00 to $12.99 448,293 3.5 9.49 292,771 9.46
Total options outstanding 1,646,445 3.3 $ 7.02 1,091,539 $ 7.00
Rights outstanding
$13.00 to $18.99 1,647,601 1.8 $ 17.20 1,647,601 $ 17.20
$19.00 to $22.99 289,720 0.3 19.43 289,720 19.43
Total rights outstanding 1,937,321 1.6 $ 17.53 1,937,321 $ 17.53
Compensation expense associated with the share unit rights granted during 2010 was based on the estimated fair value of $1.67 pershare unit right (2009 – $1.13). The fair value of share unit rights granted in the period was estimated at 15 percent of the exerciseprice (2009 – 17 percent) at the date of grant using a binomial lattice option pricing model with the following assumptions: risk-freerate of 2.8 percent (2009 – 1.7 percent), volatility of 47 percent (2009 – 43 percent), expected dividend yield of 19 percent per share(2009 – 20 percent) and reductions in the exercise price over the life of the share unit right. The amount of compensation expense isreduced by the estimated forfeitures at the date of grant which has been estimated at five percent for directors and officers (2009 –five percent) and ten percent for employees (2009 – ten percent).
Compensation expense related to the share unit rights and option plan in 2010 was $1.2 million (2009 – $3.0 million). As atDecember 31, 2010, the amount of compensation expense to be recognized over the remaining vesting period was $0.2 million(December 31, 2009 – $1.4 million) or $0.04 per share unit option (December 31, 2009 – $0.23 per share unit). The unrecognizedcompensation cost will be recognized over the weighted average remaining vesting period of 0.4 years (2009 – 1.1 years).
EMPLOYEE SAVINGS PLANSPengrowth has savings plans whereby it will match contributions by qualifying employees of one to 12 percent of their annual basesalary, less any of Pengrowth’s contributions to the Group Registered Retirement Savings Plan (“Group RRSP”), to purchase sharesin the open market. Participants in the Group RRSP can make contributions from one to 12 percent and Pengrowth will matchcontributions to a maximum of six percent of their annual basic salary. Pengrowth’s share of contributions to the Share PurchasePlan and Group RRSP in 2010 were $4.2 million and $1.2 million, respectively (2009 – $4.6 million and $1.1 million, respectively).
PENGROWTH 2010 Financial Results 59

14. DEFICIT
2010 2009
Accumulated earnings $ 2,386,298 $ 2,156,041
Accumulated distributions declared (4,533,146) (4,300,562)
Elimination of deficit (Note 1) 2,146,848 –
$ – $ (2,144,521)
Pursuant to the Arrangement described in Note 1, shareholders’ capital was reduced by the amount of the consolidated deficit ofthe Trust on December 31, 2010. The Trust historically under its Royalty and Trust Indentures and NPI agreement distributed tounitholders a significant portion of its cash flow from operations. Cash flow from operations typically exceeds net income or loss asa result of non-cash expenses such as unrealized gains (losses) on commodity contracts, unrealized foreign exchange gains(losses), depletion, depreciation and accretion.
Actual cash distributions paid in 2010 were cash distributions of the Trust of $251 million (2009 – $334 million). The final distributionpayment to the Trust unitholders of record on December 31, 2010 was paid on January 17, 2011. Distributions payable to theunitholders of the Trust at year end represents this final distribution payment.
15. FOREIGN EXCHANGE (GAIN) LOSS
2010 2009
Unrealized foreign exchange gain on translation of U.S. dollar denominated debt $ (50,692) $ (144,455)
Unrealized foreign exchange gain on translation of U.K. Pound Sterling denominated debt (7,366) (3,840)
(58,058) (148,295)
Unrealized loss (gain) on foreign exchange risk management contracts on U.K. Pound Sterlingdenominated debt 8,140 (938)
Unrealized foreign exchange gain $ (49,918) $ (149,233)
Realized foreign exchange loss (gain) 2,061 (489)
$ (47,857) $ (149,722)
16. OTHER CASH FLOW DISCLOSURES
CHANGE IN NON-CASH OPERATING WORKING CAPITAL
Cash provided by (used for): 2010 2009
Accounts receivable $ 3,590 $ 15,284
Accounts payable 6,409 (48,529)
Due from Pengrowth Management Limited – 623
$ 9,999 $ (32,622)
CHANGE IN NON-CASH INVESTING WORKING CAPITAL
Cash provided by (used for): 2010 2009
Accounts receivable $ 495 $ (495)
Accounts payable and capital accruals 17,033 (26,962)
$ 17,528 $ (27,457)
CASH INTEREST PAYMENTS
2010 2009
Interest and financing charges $ 71,529 $ 85,566
60 PENGROWTH 2010 Financial Results

17. RELATED PARTY TRANSACTIONS
Pengrowth Management Limited “the Manager” provided certain services pursuant to a management agreement which expired onJune 30, 2009. There were no charges to Pengrowth in 2010 for management fees (2009 – $2.8 million) nor for reimbursement ofgeneral and administrative expenses incurred by the Manager (2009 – $2.1 million).
A senior officer of Pengrowth was a member of the Board of Directors of Monterey, a company that was acquired in September 2010(Note 4).
18. AMOUNTS PER SHARE
The following reconciles the weighted average number of shares used in the basic and diluted net income per share calculations:
2010 2009
Weighted average number of shares – basic 301,026,164 264,121,262
Dilutive effect of share unit rights, options and DESUs 2,200,484 1,779,172
Weighted average number of shares – diluted 303,226,648 265,900,434
In 2010, 2.4 million shares (2009 – 5.8 million) from share unit rights, options and DESUs were excluded from the diluted net incomeper share calculation as their effect is anti-dilutive. The weighted average number of exchangeable shares has been included in thebasic weighted average number of shares outstanding using the “if converted” method.
19. CAPITAL DISCLOSURES
Pengrowth defines its capital as shareholders’ equity, long term debt, bank indebtedness and working capital.
Pengrowth’s goal over longer periods is to maintain or modestly grow production and reserves on a debt adjusted per share basis.Pengrowth seeks to retain sufficient flexibility with its capital to take advantage of acquisition opportunities that may arise.
Pengrowth must comply with certain financial debt covenants. Compliance with these financial covenants is closely monitored bymanagement as part of Pengrowth’s overall capital management objectives. The covenants are based on specific definitionsprescribed in the debt agreements and are different between the credit facility and the term notes. Throughout the period,Pengrowth was in compliance with all financial covenants.
Management monitors capital using non-GAAP financial metrics, primarily total debt to the trailing twelve months earnings beforeinterest, taxes, depletion, depreciation, amortization, accretion, and other non-cash items (EBITDA) and total debt to totalcapitalization. Pengrowth seeks to manage the ratio of total debt to trailing EBITDA and total debt to total capitalization ratio withthe objective of being able to finance its growth strategy while maintaining sufficient flexibility under the debt covenants. However,there may be instances where it would be acceptable for total debt to trailing EBITDA to temporarily fall outside of the normaltargets set by management such as in financing an acquisition to take advantage of growth opportunities. This would be a strategicdecision recommended by management and approved by the Board of Directors with steps taken in the subsequent period torestore Pengrowth’s capital structure based on its capital management objectives.
In order to maintain its financial condition or adjust its capital structure, Pengrowth may issue new debt, refinance existing debt,issue additional equity, adjust the level of dividends paid to shareholders, adjust the level of capital spending or dispose of non-coreassets to reduce debt levels.
Pengrowth’s objectives, policies and processes for managing capital have remained substantially consistent from the prior year.Management believes that current total debt to trailing EBITDA and total debt to total capitalization are within reasonable limits.
PENGROWTH 2010 Financial Results 61

The following is a summary of Pengrowth’s capital structure, excluding shareholders’ equity:
As at December 31: 2010 2009
Term credit facilities $ 39,000 $ 60,000
Senior unsecured notes (1) 985,367 847,599
Working capital deficiency 91,629 217,007
Convertible debentures – 74,828
Total debt including convertible debentures $ 1,115,996 $ 1,199,434
(1) Non-current portion of long term debt.
20. FINANCIAL INSTRUMENTS
Pengrowth’s financial instruments are composed of accounts receivable, accounts payable, fair value of risk management assetsand liabilities, remediation trust funds, other investments in another entity, dividends payable to shareholders, bank indebtednessand long term debt.
Details of Pengrowth’s significant accounting policies for recognition and measurement of financial instruments are disclosed inNote 2.
RISK MANAGEMENT OVERVIEWPengrowth has exposure to certain market risks related to volatility in commodity prices, interest rates and foreign exchange rates.Derivative instruments are used to manage exposure to these risks. Pengrowth’s policy is not to utilize financial instruments fortrading or speculative purposes.
The Board of Directors and management have overall responsibility for the establishment of risk management strategies andobjectives. Pengrowth’s risk management policies are established to identify the risks faced by Pengrowth, to set appropriate risklimits, and to monitor adherence to risk limits. Risk management policies are reviewed regularly to reflect changes in marketconditions and Pengrowth’s activities.
MARKET RISKMarket risk is the risk that the fair value, or future cash flows of financial assets and liabilities, will fluctuate due to movements inmarket prices. Market risk is composed of commodity price risk, foreign currency risk and interest rate risk.
Commodity Price RiskPengrowth is exposed to commodity price risk as prices for oil and gas products fluctuate in response to many factors includinglocal and global supply and demand, weather patterns, pipeline transportation, political stability and economic factors. Commodityprice fluctuations are an inherent part of the oil and gas business. While Pengrowth does not consider it prudent to entirelyeliminate this risk, it does mitigate some of the exposure to commodity price risk to protect the return on acquisitions and provide alevel of stability to operating cash flow which enables Pengrowth to fund its capital development program and dividends. Pengrowthutilizes financial contracts to fix the commodity price associated with a portion of its future production. The use of forward andfutures contracts are governed by formal policies and is subject to limits established by the Board of Directors. The Board ofDirectors and management may re-evaluate these limits as needed in response to specific events such as market activity,additional leverage, acquisitions or other transactions where Pengrowth’s capital structure may be subject to more risk fromcommodity prices.
As at December 31, 2010, Pengrowth had fixed the price applicable to future production as follows:
Crude Oil:
Reference Point Volume (bbl/d) Term Price per bbl
Financial:
WTI (1) 12,000 Jan 1, 2011 – Dec 31, 2011 $ 87.87 Cdn
WTI (1) 5,000 Jan 1, 2012 – Dec 31, 2012 $ 91.04 Cdn
(1) Associated Cdn $/U.S. $ foreign exchange rate has been fixed.
62 PENGROWTH 2010 Financial Results

Natural Gas:
Reference Point Volume (mmbtu/d) Term Price per mmbtu
Financial:
AECO 45,021 Jan 1, 2011 – Dec 31, 2011 $ 5.60 Cdn
Chicago MI (1) 5,000 Jan 1, 2011 – Dec 31, 2011 $ 6.78 Cdn
(1) Associated Cdn $/U.S. $ foreign exchange rate has been fixed.
Commodity Price Sensitivity
Each Cdn $1 per barrel change in future oil prices would result in approximately Cdn $6.2 million pre-tax change in the unrealizedgain (loss) on commodity risk management contracts as at December 31, 2010 (December 31, 2009 – $4.7 million). Similarly, eachCdn $0.25 per mmbtu change in future natural gas prices would result in approximately Cdn $4.6 million pre-tax change in theunrealized gain (loss) on commodity risk management contracts (December 31, 2009 – $12.8 million).
As at close December 31, 2010, the AECO spot gas price was approximately $4.05 per mmbtu (December 31, 2009 – $5.81 permmbtu) and the WTI prompt month price was US $91.38 per barrel (December 31, 2009 – $79.36 per barrel).
Power Price RiskAs at December 31, 2010, Pengrowth had fixed the price applicable to future power costs as follows:
Power:
Reference Point Volume (MW) Term Price per MW
Financial:
AESO 25 Jan 1, 2011 – Dec 31, 2011 $ 46.34 Cdn
Power Price Sensitivity
Each Cdn $1 per MW change in future power prices would result in approximately Cdn $0.2 million (2009 $0.2 million) pre-taxchange in the unrealized gain (loss) on power risk management contracts.
As at close December 31, 2010, the Alberta average power pool spot price was approximately Cdn $26.99/MW (December 31, 2009 –$43.79 per MW).
Foreign Exchange RiskPengrowth is exposed to foreign currency fluctuations as crude oil and natural gas prices received are referenced to U.S. dollardenominated prices. Pengrowth has mitigated some of this exchange risk by entering into fixed Canadian dollar crude oil andnatural gas price swaps as outlined in the commodity price risk section above.
Pengrowth is exposed to foreign currency fluctuation on the U.S. dollar denominated notes for both interest and principal payments.Pengrowth has not entered into any contracts to mitigate the foreign exchange risk associated with the U.S. dollar denominatedterm notes as the U.S. dollar denominated interest payments partially offset U.S. dollar denominated revenues.
Pengrowth entered into foreign exchange risk management contracts in conjunction with issuing U.K. Pounds Sterling 50 millionten year term notes which fixed the Canadian dollar to U.K. Pound Sterling exchange rate on the interest and principal of the U.K.Pound Sterling denominated debt at approximately 0.4976 U.K. Pounds Sterling per Canadian dollar.
Foreign Exchange Rate Sensitivity
The following summarizes the sensitivity on a pre-tax basis of a change in the foreign exchange rate on unrealized foreign exchangegains (losses) related to the translation of the foreign denominated term debt and on unrealized gains (losses) related to the changein the fair value of the foreign exchange risk management contracts, holding all other variables constant:
Cdn $0.01 Exchange Rate ChangeForeign Exchange Sensitivity as at December 31, 2010 Cdn - U.S. Cdn - U.K.
Unrealized foreign exchange gain or loss on foreign denominated debt $ 9,020 $ 500
Unrealized foreign exchange risk management gain or loss – 578
PENGROWTH 2010 Financial Results 63
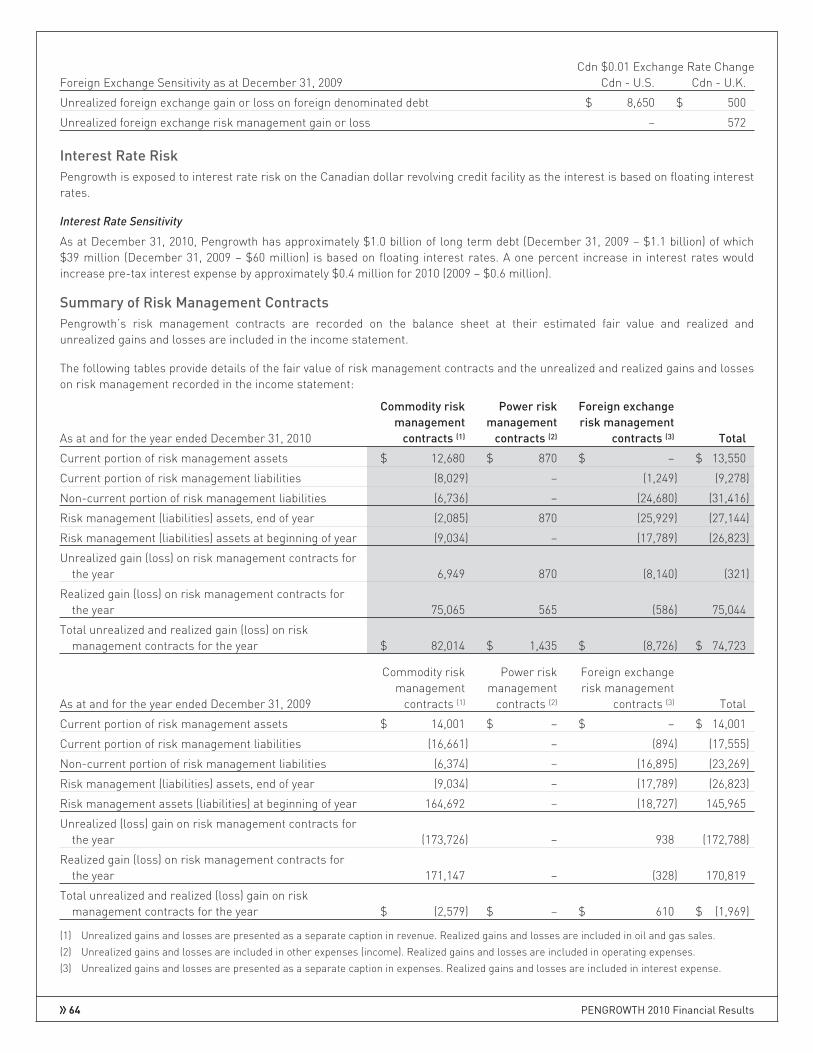
Cdn $0.01 Exchange Rate ChangeForeign Exchange Sensitivity as at December 31, 2009 Cdn - U.S. Cdn - U.K.
Unrealized foreign exchange gain or loss on foreign denominated debt $ 8,650 $ 500
Unrealized foreign exchange risk management gain or loss – 572
Interest Rate RiskPengrowth is exposed to interest rate risk on the Canadian dollar revolving credit facility as the interest is based on floating interestrates.
Interest Rate Sensitivity
As at December 31, 2010, Pengrowth has approximately $1.0 billion of long term debt (December 31, 2009 – $1.1 billion) of which$39 million (December 31, 2009 – $60 million) is based on floating interest rates. A one percent increase in interest rates wouldincrease pre-tax interest expense by approximately $0.4 million for 2010 (2009 – $0.6 million).
Summary of Risk Management ContractsPengrowth’s risk management contracts are recorded on the balance sheet at their estimated fair value and realized andunrealized gains and losses are included in the income statement.
The following tables provide details of the fair value of risk management contracts and the unrealized and realized gains and losseson risk management recorded in the income statement:
As at and for the year ended December 31, 2010
Commodity riskmanagement
contracts (1)
Power riskmanagement
contracts (2)
Foreign exchangerisk management
contracts (3) Total
Current portion of risk management assets $ 12,680 $ 870 $ – $ 13,550
Current portion of risk management liabilities (8,029) – (1,249) (9,278)
Non-current portion of risk management liabilities (6,736) – (24,680) (31,416)
Risk management (liabilities) assets, end of year (2,085) 870 (25,929) (27,144)
Risk management (liabilities) assets at beginning of year (9,034) – (17,789) (26,823)
Unrealized gain (loss) on risk management contracts forthe year 6,949 870 (8,140) (321)
Realized gain (loss) on risk management contracts forthe year 75,065 565 (586) 75,044
Total unrealized and realized gain (loss) on riskmanagement contracts for the year $ 82,014 $ 1,435 $ (8,726) $ 74,723
As at and for the year ended December 31, 2009
Commodity riskmanagement
contracts (1)
Power riskmanagement
contracts (2)
Foreign exchangerisk management
contracts (3) Total
Current portion of risk management assets $ 14,001 $ – $ – $ 14,001
Current portion of risk management liabilities (16,661) – (894) (17,555)
Non-current portion of risk management liabilities (6,374) – (16,895) (23,269)
Risk management (liabilities) assets, end of year (9,034) – (17,789) (26,823)
Risk management assets (liabilities) at beginning of year 164,692 – (18,727) 145,965
Unrealized (loss) gain on risk management contracts forthe year (173,726) – 938 (172,788)
Realized gain (loss) on risk management contracts forthe year 171,147 – (328) 170,819
Total unrealized and realized (loss) gain on riskmanagement contracts for the year $ (2,579) $ – $ 610 $ (1,969)
(1) Unrealized gains and losses are presented as a separate caption in revenue. Realized gains and losses are included in oil and gas sales.(2) Unrealized gains and losses are included in other expenses (income). Realized gains and losses are included in operating expenses.(3) Unrealized gains and losses are presented as a separate caption in expenses. Realized gains and losses are included in interest expense.
64 PENGROWTH 2010 Financial Results

FAIR VALUEThe fair value of accounts receivable, accounts payable, bank indebtedness, and dividends payable approximate their carryingamount due to the short-term nature of those instruments. The fair value of the Canadian dollar revolving credit facility is equal toits carrying amount as the facility bears interest at floating rates and credit spreads within the facility are indicative of market rates.
The following tables provide fair value measurement information for financial assets and liabilities as of December 31, 2010 and2009.
Fair Value Measurements Using:
As at December 31, 2010 Carrying Amount Fair Value
(Level 1)Quoted Prices inActive Markets
(Level 2)Significant Other
Observable Inputs
Financial Assets
Remediation trust funds $ 42,114 $ 42,115 $ 42,115 $ –
Fair value of risk management contracts 13,550 13,550 – 13,550
Financial Liabilities
U.S. dollar denominated senior unsecured notes 893,148 988,949 – 988,949
Cdn dollar senior unsecured notes 15,000 15,735 – 15,735
U.K. Pound Sterling denominated unsecured notes 77,219 84,599 – 84,599
Fair value of risk management contracts 40,694 40,694 – 40,694
Fair Value Measurements Using:
As at December 31, 2009 Carrying Amount Fair Value
(Level 1)Quoted Prices in
Active Markets
(Level 2)Significant Other
Observable Inputs
Financial Assets
Remediation trust funds $ 34,837 $ 34,821 $ 34,821 $ –
Fair value of risk management contracts 14,001 14,001 – 14,001
Other Assets – investment in public company 1,151 1,151 1,151 –
Financial Liabilities
U.S. dollar denominated senior unsecured notes 905,631 963,136 – 963,136
Cdn dollar senior unsecured notes 15,000 15,164 – 15,164
U.K. Pound Sterling denominated unsecured notes 84,514 89,724 – 89,724
Convertible debentures 74,828 76,423 76,423 –
Fair value of risk management contracts 40,824 40,824 – 40,824
Level 1 Fair Value Measurements
Financial assets and liabilities are recorded at fair value based on quoted prices in active markets.
Level 2 Fair Value Measurements
Risk management contracts – the fair value of the risk management contracts is based on commodity and foreign exchange curvesthat are readily available or, in their absence, third-party market indications and forecasts priced on the last trading day of theapplicable period.
Term notes – the fair value of the term notes is determined based on the risk free interest rate on government debt instruments ofsimilar maturities, adjusted for estimated credit risk, industry risk and market risk premiums.
CREDIT RISKCredit risk is the risk of financial loss to Pengrowth if a counterparty to a financial instrument fails to meet its contractualobligations. A significant portion of Pengrowth’s accounts receivable are with customers in the oil and gas industry and are subjectto normal industry credit risks. Uncertainty in the credit markets, should it exist, may restrict the ability of Pengrowth’s normalbusiness counterparties to meet their obligations to Pengrowth. Additional credit risk could exist where little or none previously
PENGROWTH 2010 Financial Results 65

existed. Pengrowth manages its credit risk by performing a credit review on each marketing counterparty and following a creditpractice that limits transactions according to the counterparty’s credit rating as assessed by Pengrowth. In addition, Pengrowthmay require letters of credit or parental guarantees from certain counterparties to mitigate some of the credit risk associated withthe amounts owing by the counterparty. The use of financial swap agreements involves a degree of credit risk that Pengrowthmanages through its credit policies which are designed to limit eligible counterparties to those with investment grade credit ratingsor better. The carrying value of accounts receivable and risk management assets represents Pengrowth’s maximum creditexposure.
Pengrowth sells a significant portion of its oil and gas to a limited number of counterparties. Pengrowth has three counterpartiesthat individually account for more than ten percent of annual revenue. All of these counterparties are large, well-establishedcompanies supported by investment grade credit ratings.
Pengrowth considers amounts over 90 days as past due. As at December 31, 2010 and 2009, the amount of accounts receivable thatwere past due was not significant. Pengrowth has not recorded a significant allowance for doubtful accounts during 2010 and 2009and has no significant bad debt provision at December 31, 2010 and 2009. Pengrowth’s objectives, processes and policies formanaging credit risk have not changed from the previous year.
LIQUIDITY RISKLiquidity risk is the risk that Pengrowth will not be able to meet its financial obligations as they fall due. Pengrowth’s approach tomanaging liquidity is to ensure, as much as possible, that it will always have sufficient liquidity to meet its liabilities when due,under normal and stressed conditions. Management closely monitors cash flow requirements to ensure that it has sufficient cashon demand or borrowing capacity to meet operational and financial obligations over the next three years. Pengrowth maintains acommitted $1.0 billion term credit facility with an additional $250 million available under an expansion feature subject to lenderapproval and a $50 million demand operating line of credit. Pengrowth’s long term notes and bank credit facilities are unsecuredand equally ranked.
All of Pengrowth’s financial liabilities are current and due within one year, except as follows:
As at December 31, 2010CarryingAmount
ContractualCash Flows Within 1 year 1-2 years 2-5 years
More than 5years
Cdn dollar revolving credit facility (1) $ 39,000 $ 42,644 $ 1,289 $ 1,289 $ 40,066 $ –
Cdn dollar senior unsecured notes (1) 15,000 22,578 992 992 2,975 17,619
U.S. dollar denominated seniorunsecured notes (1) 893,148 1,288,764 56,571 56,571 281,108 894,514
U.K. Pound Sterling denominatedunsecured notes (1) 77,219 98,393 4,235 4,235 89,923 –
Remediation trust fund payments – 12,500 250 250 750 11,250
Commodity risk management contracts 6,736 6,911 – 6,911 – –
Foreign exchange risk managementcontracts 24,680 150 30 30 90 –
(1) Contractual cash flows include future interest payments calculated at period end exchange rates and interest rates except for term notes whichare calculated at the actual interest rate.
66 PENGROWTH 2010 Financial Results

As at December 31, 2009CarryingAmount
ContractualCash Flows Within 1 year 1-2 years 2-5 years
More than 5years
Cdn dollar revolving credit facility (1) $ 60,000 $ 60,892 $ 613 $ 60,279 $ – $ –
Cdn dollar senior unsecured notes (1) 15,000 23,571 992 992 2,977 18,610
U.S. dollar denominated senior unsecurednotes (1) 748,085 1,131,180 49,009 49,009 194,858 838,304
U.K. Pound Sterling denominatedunsecured notes (1) 84,514 112,384 4,637 4,637 13,923 89,187
Convertible debentures (1)(2) 74,828 79,599 – 79,599 – –
Remediation trust fund payments – 12,500 250 250 750 11,250
Commodity risk management contracts 6,374 6,517 – 6,517 – –
Foreign exchange risk managementcontracts 16,895 180 30 30 90 30
(1) Contractual cash flows include future interest payments calculated at period end exchange rates and interest rates except for term notes whichare calculated at the actual interest rate.
(2) Convertible debentures were redeemed on January 14, 2010 using proceeds from the revolving credit facility. The repayment of the convertibledebentures has been shown in the above table as due in 1-2 years with the revolving credit facility.
21. COMMITMENTS
2011 2012 2013 2014 2015 Thereafter Total
Operating leases $ 13,571 $ 13,430 $ 13,335 $ 12,840 $ 12,153 $ 23,268 $ 88,597
Operating leases include office rent and vehicle leases.
22. CONTINGENCIES
Pengrowth is sometimes named as a defendant in litigation. The nature of these claims is usually related to settlement of normaloperational issues and labour issues. The outcome of such claims against Pengrowth is not determinable at this time; however,their ultimate resolution is not expected to have a materially adverse effect on Pengrowth as a whole.
23. SUBSEQUENT EVENT
Subsequent to December 31, 2010 and prior to March 8, 2011, Pengrowth has entered into fixed price commodity sales contractswith third parties as follows:
Crude Oil:
Reference Volume (bbl/d) Term Price per bbl
Financial:
WTI (1) 1,500 Mar 1, 2011 - Dec 31, 2011 $ 100.68 Cdn
WTI (1) 2,500 Apr 1, 2011 - Dec 31, 2011 $ 100.01 Cdn
WTI (1) 5,000 Jan 1, 2012 - Dec 31, 2012 $ 99.20 Cdn
(1) Associated Cdn $/U.S. $ foreign exchange rate has been fixed.
24. RECONCILIATION OF FINANCIAL STATEMENTS TO UNITED STATES GENERALLY
ACCEPTED ACCOUNTING PRINCIPLES
The significant differences between Canadian generally accepted accounting principles (Canadian GAAP) which, in most respects,conforms to United States generally accepted accounting principles (U.S. GAAP) as they apply to Pengrowth, are as follows:
(a) Under U.S. GAAP, the carrying value of petroleum and natural gas properties and related facilities, net of future income taxes,is limited to the present value of after tax future net revenue from proven reserves, discounted at ten percent based on theaverage of the prices on the first day of each month for the prior twelve-month period plus the lower of cost and fair value ofunproven properties. At December 31, 2010 and 2009, the application of the full cost ceiling test under U.S. GAAP did not resultin a write-down of capitalized costs.
Where the amount of a ceiling test write-down under Canadian GAAP differs from the amount of the write-down underU.S. GAAP, the charge for depletion will differ in subsequent years. In addition, under U.S. GAAP depletion is calculated based
PENGROWTH 2010 Financial Results 67

on the reserve assignments in accordance with SEC requirements (based on the average of the prices on the first day of eachmonth for the prior twelve month period) as opposed to escalated dollar reserves required under Canadian GAAP. As such, thedepletion rate under U.S. GAAP differs from Canadian GAAP. The effect of ceiling test impairments in prior years and a differentdepletion rate under U.S. GAAP has reduced the 2010 depletion charge by $155.7 million (2009 – $189.4 million). Depletion anddepreciation on a per unit of production under U.S. GAAP was $13.42 per BOE (2009 – $13.53).
(b) Other comprehensive income under U.S. GAAP differs from that presented under Canadian GAAP as a result of designating acash flow hedge at different dates under U.S. GAAP as compared to Canadian GAAP. Effective January 1, 2007, Pengrowthceased to designate its foreign exchange swaps as a cash flow hedge of the U.K. term debt. The amount deferred inaccumulated other comprehensive income pertaining to this hedging relationship when the hedge was de-designated of$2.4 million is being amortized to income over the life of the foreign exchange swap under U.S. GAAP.
(c) Under U.S. GAAP, the exchangeable shares were classified as a non-controlling interest. The conversion of the exchangeableshares into trust units or common shares would be measured under U.S. GAAP at the fair value of the trust units or commonshares issued and any gain or loss would be recorded as an addition or reduction of trust unitholders’ capital or shareholders’capital, respectively. Under Canadian GAAP, the exchangeable shares were recognized as another form of equity and there wasno gain or loss on redemption. There is no Canadian to U.S. GAAP difference to total shareholders’ equity as a result of thediffering treatment of exchangeable shares.
Prior to December 31, 2010, the trust units were redeemable at the option of the holder at a redemption price equal to thelesser of 95% of the average closing price of the trust units for the 10 trading days after the trust units have been surrenderedfor redemption and the closing price on the date the trust units have been surrendered for redemption. However, the totalamount payable by the Trust in cash in any one calendar month was limited to a maximum of $25,000. Redemptions in excessof the cash limit had to be satisfied by way of a distribution in specie of a pro rata share of royalty units and other assets,excluding facilities, pipelines or other assets associated with oil and gas production, which were held by the Trust at the timethe trust units were to be redeemed. As a result of the significant limitation on the cash amount payable by the Trust in respectof redemptions, and that any royalty units issued would have similar characteristics of the trust units and be convertible backinto trust units, the trust units were not classified as redeemable equity for the purposes of U.S. GAAP. The common sharesoutstanding as of December 31, 2010 are not redeemable.
(d) Under U.S. GAAP, an entity that is subject to income tax in multiple jurisdictions is required to disclose income tax expense ineach jurisdiction. Pengrowth is subject to tax at the federal and provincial level. The portion of the income tax reduction at thefederal level for the year ended December 31, 2010 is $1.7 million (2009 – $42.0 million). The portion of income tax reduction atthe provincial level is $1.0 million (2009 – $23.4 million).
(e) Additional disclosures required under U.S. GAAP with respect to Pengrowth’s equity incentive plans is provided below.
The intrinsic value of the DESUs and Share Unit Rights and Options exercised was as follows:
2010 2009
NumberExercised
IntrinsicValue
NumberExercised
IntrinsicValue
DESUs 459,074 $ 2,874 297,184 $ 3,121
Share Unit Rights and Options 587,314 3,037 299,684 867
Total 1,046,388 $ 5,911 596,868 $ 3,988
The following table summarizes information about DESUs and Share Unit Rights and Options vested and expected to vest:
At December 31, 2010 DESUsShare Unit Rights
and Options
Number vested and expected to vest 2,000,547 3,528,275
Weighted average exercise price per unit (1) $ – $ 12.79
Aggregate intrinsic value (2) $ 25,567 $ 9,160
Weighted average remaining life (years) 1.6 2.3
68 PENGROWTH 2010 Financial Results

At December 31, 2009 DESUsShare Unit Rights
and Options
Number vested and expected to vest 1,570,348 5,218,787
Weighted average exercise price per unit (1) $ – $ 12.39
Aggregate intrinsic value (2) $ 15,939 $ 8,238
Weighted average remaining life (years) 1.4 3.3
(1) No proceeds are received upon exercise of DESUs.
(2) Based on December 31 closing common share price.
The following table summarizes information about DESUs and Share Unit Rights and Options outstanding:
At December 31, 2010 DESUsShare Unit Rights
and Options
Number exercisable (1) 249,839 3,028,860
Weighted average exercise price per unit (2) $ – $ 13.74
Aggregate intrinsic value (3) $ 3,193 $ 6,309
Weighted average remaining life (years) – 2.2
At December 31, 2009 DESUsShare Unit Rights
and Options
Number exercisable (1) 158,981 3,087,494
Weighted average exercise price per unit (2) $ – $ 14.95
Aggregate intrinsic value (3) $ 1,614 $ 2,217
Weighted average remaining life (years) – 2.7
(1) DESUs exercisable at December 31, 2010 and 2009 were granted to directors, vest immediately and are only exercisable upon retirement.
(2) No proceeds are received upon exercise of DESUs.
(3) Based on December 31 closing common share price.
(f) Under Canadian GAAP, the convertible debentures are classified as debt with a portion, representing the estimated fair value ofthe conversion feature at the date of issue, being allocated to equity. In addition, under Canadian GAAP a non-cash interestexpense or income representing the effective yield of the debt component is recorded in the consolidated statements of incomewith a corresponding credit or debit to the convertible debenture liability balance to accrete the balance to the principal due onmaturity as a result of the portion allocated to equity.
Under U.S. GAAP, the convertible debentures, in their entirety, are classified as debt. The non-cash interest expense recordedunder Canadian GAAP related to the equity portion of the debenture would not be recorded under U.S. GAAP.
On January 14, 2010, Pengrowth redeemed all of the outstanding Convertible Unsecured Subordinated Debentures. The cashredemption amount was approximately $76.8 million, including accrued interest to the redemption date. Non-cash interest of$0.1 million was recognized upon redemption.
(g) The following table summarizes the unrecognized tax benefits under U.S. GAAP:
2010 2009
Balance, January 1 $ 19,288 $ 21,239
Additions (decreases) based on tax positions in the year – (1,260)
Decrease due to change in tax rates (292) (691)
Balance, December 31 $ 18,996 $ 19,288
PENGROWTH 2010 Financial Results 69

The following table summarizes open taxation years at December 31, 2010 by jurisdiction:
Jurisdiction Years
Federal 2004 - 2009
Alberta, British Columbia, Saskatchewan, and Nova Scotia 2004 - 2009
The 2004 tax examination by federal authorities is currently in progress.
Interest and penalties related to uncertain tax positions, which are included in income tax expense, were not material for theyears ended December 31, 2010 and 2009.
Unrecognized tax benefits are classified as current or long-term liabilities under U.S. GAAP as opposed to future income taxliabilities. It is anticipated that no amount of the current or prior year unrecognized tax benefit will be realized in the next year.The unrecognized tax benefit, if recognized, would have a favourable impact on Pengrowth’s effective income tax rate in futureperiods.
(h) Fair Value Measurements
The framework for measuring fair value when an entity is required to use a fair value measure for recognition or disclosurepurposes under U.S. GAAP is consistent with the framework under Canadian GAAP, except that Canadian GAAP only requiresdisclosure of the fair value hierarchy for items normally measured at fair value. In addition, under Canadian GAAP theframework only applies to financial assets and liabilities measured at fair value as at December 31, 2010 and 2009 while underU.S. GAAP the framework applies to all financial assets and liabilities and non-financial assets and liabilities measured at fairvalue or for which fair value is disclosed for December 31, 2010 and 2009. Pengrowth’s disclosure under Canadian GAAPincludes assets and liabilities measured at fair value and for which fair value is disclosed, consistent with U.S. GAAP. Theestimated fair value of property, plant and equipment and asset retirement obligations for the business combination describedin Note 4, would have a Level 3 classification as the valuations in this level are primarily those with inputs that are not based onobservable market data. The fair value of Pengrowth’s equity investment in Monterey at the time of the acquisition was a Level1 fair value.
(i) Under U.S. GAAP, unrealized gains or losses on commodity risk management would be included with oil and gas sales.
(j) Effective January 1, 2009, Pengrowth adopted new disclosure standards under U.S. GAAP with respect to derivatives andhedging. These new disclosure standards are similar to Canadian GAAP (see note 20). The following are additional disclosuresrequired under U.S. GAAP with respect to Pengrowth’s derivatives.
Pengrowth has not designated any outstanding risk management contracts as hedges for accounting purposes and thereforerecords these contracts on the balance sheet at their fair value and recognizes changes in fair value on the statement ofincome (loss) as unrealized commodity risk management contracts. The effect on cash flows will be recognized separately onlyupon realization of the contracts, which could vary significantly from the unrealized amount recorded due to timing and priceswhen each contract is settled. The use of commodity contracts involves a degree of credit risk that Pengrowth managesthrough its credit policies which are designed to limit eligible counterparties to those with investment grade credit ratings orbetter. The total of all risk management assets is $30.9 million (2009 – $38.2 million). The total of all risk managementliabilities is $58.1 million (2009 – $65.0 million). Under Canadian and U.S. GAAP, the risk management assets and riskmanagement liabilities are netted by individual counterparty, thus the maximum amount of potential loss due to credit risk isthe carrying amount of the risk management assets recorded on the balance sheet. There are no contingent features of thesecontracts related to Pengrowth’s credit risk.
(k) Upon conversion to a corporation on December 31, 2010, Pengrowth eliminated the accumulated deficit under Canadian GAAPby reducing the shareholders’ capital. This would not normally be permitted under U.S. GAAP. The total shareholders’ equityunder U. S. GAAP remains unchanged.
70 PENGROWTH 2010 Financial Results

CONSOLIDATED STATEMENTS OF INCOMEThe application of U.S. GAAP would have the following effect on net income as reported:
(Stated in thousands of Canadian Dollars, except per share amounts)
Year endedDecember 31, 2010
Year endedDecember 31, 2009
Net income for the year, as reported $ 230,257 $ 84,853
Adjustments:
Depletion and depreciation (a) 155,686 189,371
Amortization of discontinued hedge (b) 272 272
Non-cash interest on convertible debentures (f) (120) 40
Future tax adjustments (47,522) (77,553)
Net income – U.S. GAAP $ 338,573 $ 196,983
Other comprehensive income (loss):
Amortization of discontinued hedge (b) (272) (272)
Comprehensive income – U.S. GAAP $ 338,301 $ 196,711
Net Income per share – U.S. GAAP
Basic $ 1.12 $ 0.74
Diluted $ 1.12 $ 0.74
CONSOLIDATED BALANCE SHEETSThe application of U.S. GAAP would have the following effect on the balance sheets as reported:
(Stated in thousands of Canadian Dollars)
As at December 31, 2010 As ReportedIncrease
(Decrease) U.S. GAAP
Assets
Property, plant and equipment (a) $ 4,076,976 $ (1,406,816) $ 2,670,160
Future income taxes (g) – 146,577 146,577
$ (1,260,239)
Liabilities
Future income taxes (g) $ 237,753 $ (237,753) $ –
Other long term liabilities (g) – 18,996 18,996
Shareholders’ equity:
Accumulated other comprehensive income (b) $ – $ 1,358 $ 1,358
Shareholders’ equity (c) 3,186,976 (1,042,840) 2,144,136
$ (1,260,239)
PENGROWTH 2010 Financial Results 71

As at December 31, 2009 As ReportedIncrease
(Decrease) U.S. GAAP
Assets
Property, plant and equipment (a) $ 3,789,369 $ (1,562,502) $ 2,226,867
Future income taxes (g) – 251,473 251,473
$ (1,568,507)
Liabilities
Convertible debentures $ 74,828 $ 40 $ 74,868
Future income taxes (g) 180,671 (180,671) –
Other long term liabilities (g) – 19,288 19,288
Shareholders’ equity:
Accumulated other comprehensive income (b) $ – $ 1,630 $ 1,630
Shareholders’ equity (c) 2,795,201 (1,151,316) 1,643,885
$ (1,568,507)
ADDITIONAL DISCLOSURES REQUIRED UNDER U.S. GAAPThe components of accounts receivable are as follows:
As atDecember 31, 2010
As atDecember 31, 2009
Trade $ 170,702 $ 159,309
Prepaid 18,914 23,033
$ 189,616 $ 182,342
The components of accounts payable are as follows:
As atDecember 31, 2010
As atDecember 31, 2009
Accounts payable $ 65,072 $ 50,998
Accrued liabilities 175,880 134,339
$ 240,952 $ 185,337
72 PENGROWTH 2010 Financial Results

ABBREVIATIONSbbl barrelBcf billion cubic feetboe* barrels of oil equivalentgj gigajouleMbbls thousand barrelsMMbbls million barrelsMboe* thousand barrels of oil equivalent
MMboe* million barrels of oil equivalentMMBtu million British thermal unitsMcf thousand cubic feetMMcf million cubic feetMW mega watt* 6 mcf of gas = 1 barrel of oil equivalent
DIRECTORS OF PENGROWTH ENERGY CORPORATIONJohn B. Zaozirny; ChairmanVice Chairman Canaccord Genuity Corp.
Thomas A. Cumming,Business Consultant
Derek W. EvansPresident and CEO PengrowthEnergy Corporation
Wayne K. FooPresident & CEO, Parax Resources Inc.
James D. McFarlandPresident and CEO, Valeura Energy Inc.
Michael S. ParrettBusiness Consultant
A. Terence Poole Business Consultant
D. Michael G. StewartCorporate Director
OFFICERS OF PENGROWTH ENERGY CORPORATIONDerek W. Evans President and Chief Executive Offi cer
Gillian Basford Vice President, Human Resources
Douglas C. BowlesVice President and Controller
James E.A. CausgroveVice President, Production and Operations
William G. ChristensenVice President, Strategic Planning and Reservoir Exploitation
Steve J. De Maio Vice President, In-Situ Development & Operations
Brent D. Defosse Vice President, Drilling & Completions
David Dean Evans Treasurer
Andrew D. Grasby General Counsel & Corporate Secretary
Robert W. Rosine Executive Vice President, Business Development
Diane J. Shirra Vice President, Montney Gas
Christopher G. WebsterChief Financial Offi cer
TRUSTEEComputershare Trust Company of Canada
BANKERSBank Syndicate Agent: Royal Bank of Canada
AUDITORSKPMG LLP
ENGINEERING CONSULTANTSGLJ Petroleum Consultants Ltd.
Corporate Profi le

PENGROWTH ENERGY CORPORATION Head Offi ce2100, 222 Third Avenue SW Calgary Alberta, T2P 0B4 CanadaPhone: 403.233.0224 | Toll free: 800.223.4122 | Fax: 403.265.6251www.pengrowth.com
Investor Relations For investor relations enquiries, please contact:Investor RelationsPhone: 403.233.0224 | Toll free: 888.744.1111Email: [email protected]
Stock Exchange Listings Toronto Stock Exchange: PGF | New York Stock Exchange: PGH