2010 2020 2030 2040 2050 - class.ece.iastate.edu
TRANSCRIPT

2010 2020 2030 2040 2050

American Physical SocietyFounded in 1899, the American Physical Society (APS) is the largest organization of professional physicists in the United States. Its 46,000 members are drawn from universities, industry and national laboratories. The APS is one of the premier publishers of international physics research, maintaining print and on-line publications, as well as electronically searchable archives dating back to 1893.
For more than forty years, APS has also devoted resources and expertise to a number of public policy areas, including education, energy, innovation and competitiveness, national security and science research programs. As part of its policy work, APS periodically prepares technical analyses on subjects of significant public interest. This report follows in the tradition of past APS studies and represents a fresh look at the subject of energy efficiency, which the Society first examined in 1975.
2008 APS Officers
Arthur Bienenstock, President
Cherry MurrayPresident-Elect
Curtis CallanVice President
Leo KadanoffPast President
Judy FranzExecutive Officer
Joseph SereneTreasurer/Publisher
Gene SprouseEditor-in-Chief

American Physical Societyw w w . a p s . o r g
2010 02022 02030 02040 022050
HOW AMERICA CAN LOOK WITHIN TO ACHIEVE ENERGY SECURITY
AND REDUCE GLOBAL WARMINGS e p t e m b e r 2 0 0 8
h t t p : / / w w w . a p s . o r g / e n e r g y e f f i c i e n c y r e p o r t /
© 2 0 0 8 A M E R I C A N P H Y S I C A L S O C I E T Y
American Physical Society • September 2008 ENERGY FUTURE: Think Efficiency | 1

Study Group Members and Staff . . . . . . . . . . . . . . . . . . . . . . . . . . . . . . . . . . . . . . . . . . . . . . . 3
Review Panel Members . . . . . . . . . . . . . . . . . . . . . . . . . . . . . . . . . . . . . . . . . . . . . . . . . . . . . . 3
Acknowledgements . . . . . . . . . . . . . . . . . . . . . . . . . . . . . . . . . . . . . . . . . . . . . . . . . . . . . . . . . 4
Executive Summary . . . . . . . . . . . . . . . . . . . . . . . . . . . . . . . . . . . . . . . . . . . . . . . . . . . . . . . . . 6
Graphics Gallery . . . . . . . . . . . . . . . . . . . . . . . . . . . . . . . . . . . . . . . . . . . . . . . . . . . . . . . . . . 17
CHAPTERS
Chapter 1: Introduction. . . . . . . . . . . . . . . . . . . . . . . . . . . . . . . . . . . . . . . . . . . . . . . . 19
Chapter 2:Transportation . . . . . . . . . . . . . . . . . . . . . . . . . . . . . . . . . . . . . . . . . . . . . . 28
Chapter 3: Buildings . . . . . . . . . . . . . . . . . . . . . . . . . . . . . . . . . . . . . . . . . . . . . . . . . . 52
Chapter 4: Research and Policy Highlights . . . . . . . . . . . . . . . . . . . . . . . . . . . . . . . . 86
Meeting 1 Agenda (Washington, DC) . . . . . . . . . . . . . . . . . . . . . . . . . . . . . . . . . . . . . . . . . 102
Meeting 2 Agenda (Stanford, CA) . . . . . . . . . . . . . . . . . . . . . . . . . . . . . . . . . . . . . . . . . . . . 103
Study Group Biographies. . . . . . . . . . . . . . . . . . . . . . . . . . . . . . . . . . . . . . . . . . . . . . . . . . . 104
Table of Contents
2 | ENERGY FUTURE: Think Efficiency American Physical Society • September 2008

American Physical Society • September 2008 ENERGY FUTURE: Think Efficiency | 3
George CrabtreeArgonne National Laboratory
Leon GlicksmanMassachusetts Institute of Technology
David GoldsteinNatural Resources Defense Council
David Goldston, Vice-ChairHarvard UniversityFormer Chief of Staff, House Science Committee
David Greene Oak Ridge National Laboratory
Dan Kammen University of California, Berkeley
Mark LevineLawrence Berkeley National Laboratory
Michael LubellAmerican Physical Society &The City College of CUNY
Burton Richter, ChairStanford Linear Accelerator Center,Stanford University
Maxine SavitzThe Advisory Group
Daniel SperlingUniversity of California, Davis
Study Group Members
Review Panel Members
Study Group Research and Editorial Staff
Study Group Administrative Staff Study Pagination and Graphics
Fred Schlachter John Scofield James DawsonAmerican Physical Society Oberlin College American Institute of Physics
Jeanette RussoAmerican Physical SocietyStudy Administrator
Kerry G. JohnsonAmerican Physical SocietyArt Director and Special Publications Manager
Robert A. FroschSenior Research AssociateScience, Technology and Public Policy ProgramHarvard Kennedy School
T.J. GlauthierPresident and CEOElectricity Innovation Institute
Lee SchipperFellow EmeritusUniversity of California, Berkeley
James Sweeney, ChairProfessor, Management Science & EngineeringSenior Fellow, Stanford Institutefor Economic Policy ResearchStanford University

4 | ENERGY FUTURE: Think Efficiency American Physical Society • September 2008
AcknowledgementsThe APS expresses its gratitude to the Energy Foundation for its generous financial support, especially for defraying the cost of public dissemination of the report. The study committee thanks the many experts who devoted significant amounts of their personal time gratis for providing extraordinarily constructive advice and guidance, without which this report could not have become a reality. The study committee particularly wishes to recognize the following individuals for their assistance:
Dr. Menahem Anderman, Advanced Automotive Batteries
Dr. Vince Bataglia, Lawrence Berkeley National Laboratory
Ms. Erin E. Boedecker, Energy Information Agency, U.S. Department of Energy
Mr. Richard Brown, Lawrence Berkeley National Laboratory
Mr. Kevin Carroll, Office of Management and Budget
Mr. Reid Detchon, Energy Futures Coalition
Mr. Jerome Dion, Office of Energy Efficiency & Renewable Energy, U.S. Department of Energy
Dr. Hunter Fanney, Building & Fire Research Lab, National Institute of Standards & Technology
Mr. John German, American Honda Motor Company
Ms. Dian Grueneich, California Public Utilities Commission
Mr. David Hamilton, Sierra Club
Mr. Patrick Hughes, Oak Ridge National Laboratory
Mr. Revis James, Electric Power Research Institute
Dr. Harriet Kung, Office of Basic Energy Sciences, U.S. Department of Energy
Dr. Alan D. Lamont, Lawrence Livermore National Laboratory
Mr. David Lee, Energy Star Program, U.S. Environmental Protection Agency
Ms. Vivian Loftness, Carnegie Mellon University
Mr. Joe Lope, Alliance to Save Energy
Dr. Arunava Majumdar, Lawrence Berkeley National Laboratory
Dr. James McMahon, Lawrence Berkeley National Laboratory
Dr. Alan K. Meier, Lawrence Berkeley National Laboratory
Dr. Terry Michalski, Sandia National Laboratories
Mr. Mark Monroe, Sun Microsystems
Dr. Richard Newell, Duke University
Ms. Eileen O’Brien, Energy Information Agency, U.S. Dept. of Energy
Dr. Arno Penzias, New Enterprise Associates
Dr. Julia Phillips, Sandia National Laboratories
Mr. Ed Pollock, Office of Energy Efficiency & Renewable Energy, U.S. Dept. of Energy
Mr. Bill Prindle, American Council for an Energy Efficient Economy
Mr. Dan Reicher, Google, Inc.
Dr. David Rodgers, Office of Energy Efficiency & Renewable Energy, U.S. Dept. of Energy

American Physical Society • September 2008 ENERGY FUTURE: Think Efficiency | 5
Dr. Arthur Rosenfeld, California Energy Commission
Dr. Danilo Santini, Argonne National Laboratory
Ms. Katherine E. Seiferlein, Energy Information Agency, U.S. Dept. of Energy
Mr. Stephen Selkowitz, Lawrence Berkeley National Laboratory
Mr. Omar Siddiqui, Electric Power Research Institute
Dr. Fred Sissine, Congressional Research Service
Dr. Venkat Srinivasan, Lawrence Berkeley National Laboratory
Mr. Anant Sudarshan, Stanford University
Dr. Michael Telson, University of California
Dr. Paul Torcellini, National Renewable Energy Laboratory
Ms. Cathy Turner, New Buildings Institute
Dr. David A. Vandenbrouke, U.S. Department of Housing and Urban Development
Mr. Don Von Dollen, Electric Power Research Institute
Mr. Anant Vyas, Argonne National Laboratory
Dr. E.D. Tate, General Motors Corporation
Mr. Charles Zimmerman, Wal-Mart Stores, Inc.

6 | ENERGY FUTURE: Think Efficiency American Physical Society • September 2008
Executive SummaryMaking major gains in energy efficiency is one of the most economical
and effective ways our nation can wean itself off its dependence on foreign oil and reduce its emissions of greenhouse gases. Transportation and build-ings, which account for two thirds of American energy usage, consume far more than they need to, but even though there are many affordable energy efficient technologies that can save consumers money, market imperfections inhibit their adoption. To overcome the barriers, the federal government must adopt policies that will transform the investments into economic and societal benefit. And the federal government must invest in research and development programs that target energy efficiency. Energy efficiency is one of America’s great hidden energy reserves. We should begin tapping it now.
________________________________________________________
Nowhere in the world does energy affect the lives of people more than in the United States, one of the world’s largest per capita consumers of that commodity. Nowhere is the standard of living more rooted in energy than in the United States, and, with its defense forces deployed
in the most distant regions around the world, nowhere is the security of a nation more dependent on energy.
Yet only in times of extreme turbulence — the OPEC (the Organization of Petroleum Exporting Countries) oil embargo in 1973, the overthrow of the shah of Iran in 1979 and the Persian Gulf War in 1991 — when public frustration became politically intolerable did American officials devote serious attention to energy policy. Although some of the policy initiatives yielded significant benefits, others were left on the drafting board as the nation reverted to a business-as-usual energy routine once the turbulence passed and public dissatisfaction dissipated.
Today the American public is again demanding that its elected officials take action. Gasoline prices are soaring, increased transportation costs are driving up the costs of goods, and home-heating oil is becoming prohibitively expensive. The people feel as if they are under siege.
In contrast to previous market instabilities, however, this one may be more enduring. Thirty-five years ago, when OPEC imposed its oil embargo, the United States was importing 6.3 million barrels a day; today it imports 13.5 million barrels a day, two-thirds of the nation’s consumption. Thirty-five years ago, the world’s two most populous countries, China and India, were poor agrarian societies that had minimal need for oil; today they are rapidly developing industrial economies with a greatly increasing demand for energy. Thirty-five years ago, unfriendly nation states posed the greatest risk to oil security; today terrorist groups have added substantially to potential interruptions of global supplies.
By enacting Public Law 110-140, the Energy Independence and Security Act of 2007, Congress and the administration explicitly recognized the national security threat created by our unwholesome dependence on foreign sources of oil. Titles I, III and IV of the act deal specifically with energy efficiency policies in the transportation and buildings sector. Generally this report neither criticizes nor endorses particular portions of those titles, but instead focuses on the scientific and technological opportunities and challenges associated with improving energy efficiency in the transportation and buildings sectors.
American Physical Society • September 2008 ENERGY FUTURE: Think Efficiency | 7
Without question, the United States faces a greater energy risk today than it has at any time in its history. But the nation and the world face another risk that was barely recognized 35 years ago. Global warming and the potential it has for causing major disruptions to Earth’s climate are scientific realities. The precise extent of the human contribution to global warming still needs deeper understanding, but there is virtually no disagreement among scientists that it is real and substantial.
Whether you want the United States to achieve greater energy security by weaning itself off foreign oil, to sustain strong economic growth in the face of worldwide competition or to reduce global warming by decreasing carbon emissions, energy efficiency is where you need to start. Thirty-five years ago the United States adopted national strategies, implemented policies and developed technologies that significantly improved energy efficiency. Science and technology have progressed considerably since then, but U.S. energy policy has not. It is time to revisit the issue.
The American Physical Society set up its Energy Efficiency Study Group to do just that for the transportation and buildings sectors of our economy. In this report we examine the scientific and technological opportunities and policy actions that can make the United States more energy efficient, increase its security and reduce its impact on global warming. We believe the findings and recommendations will help Congress and the next administration to realize those goals. The opportunities are huge and the costs are small.
Some of the targets we identify could be easy to achieve within the next few years using existing technologies. Some of them will be more difficult to realize and might take a decade or two to attain. Some are extremely challenging and lie in the more distant future. But whatever their ease or difficulty, whatever their time horizon, achieving them will require intelligent public policy and serious public commitment. They are worth pursuing not only because they will provide greater energy security and reduce global warming but also because they will provide significant economic benefits.
Identifying which set of policies is likely to have the greatest influence on implementing the recommendations of our study sometimes lies beyond the scope of our report. Indeed, in a number of cases the choice of policies might require additional social science research into how people evaluate risk, how they integrate long-term and short-term benefits and costs, how they react to economic triggers and how they understand and value the energy security and global warming issues. While this report focuses on the physical sciences and was written largely by experts in that field, the panel strongly believes that progress in energy policy will be inadequate without additional social science research and without implementing what social science can already teach us about policies to use energy more efficiently. Even when we refrain from prescribing specific policy choices, we are resolute in our view that appropriate policies must be adopted for technological developments to have the greatest benefit.
Before we address energy efficiency in the transportation and buildings sectors, we need to clarify two issues: (1) What we mean by “energy efficiency” and (2) What criteria we use to circumscribe “energy end use.”
In common parlance energy efficiency denotes the ratio of useful energy or work a device produces to the energy the device consumes. This may seem an intuitively reasonable definition, but in some cases it is too simplistic. Consider two homes both heated with furnaces rated at 80 percent efficiency, one home well insulated and the other so badly insulated that it takes twice as much energy to keep it warm. The furnaces are both 80 percent efficient, but, considered as a system, one home clearly should only receive a 40 percent rating for heating efficiency. This example demonstrates that what

8 | ENERGY FUTURE: Think Efficiency American Physical Society • September 2008
matters is how much primary energy it takes to accomplish a particular task, rather than simply how one element of an integrated system performs. As another example, consider the case of an electric heater. It might receive a 100 percent rating as a single element, but the production and transmission of the electricity it uses comes at a great energy cost: only about 30 percent of the primary energy from the fuel (coal, natural gas, nuclear, etc.) used in a power plant finds its way to the heater.
Ideally we would like to know the ratio of the minimum energy required to do the job to the energy actually used. That is sometimes hard to do, but it is always possible to compare the relative efficiencies of two methods for accomplishing the same task. In this report, we implicitly apply such logic when we conclude that one strategy is more energy efficient than another.
Separating energy end use from energy production and delivery may also seem like a simple task, but it isn’t. Consider the case of plug-in hybrid cars. They have the potential for reducing gasoline consumption and our dependence on foreign oil. But plug-in hybrids need electricity for recharging their batteries, and in most cases the electricity will have to be generated centrally and distributed through the power grid. The efficiency of electricity generation and transmission must be counted in determining the overall energy efficiency, since our definition of efficiency requires starting with the primary energy source. For very large market penetration of plug-in hybrids, electrical generation capacity will have to be increased and the grid will have to be upgraded. A parallel argument applies to hydrogen fuel cell vehicles, which will probably require centralized production of hydrogen and development of a major distribution and delivery infrastructure.
Despite their connection with energy production and distribution, we elected to include plug-in hybrids and fuel cell vehicles in our discussion of energy efficiency, because they have an extraordinary potential for decreasing carbon emissions and increasing our energy security. Some biofuels can replace foreign oil and decrease carbon emissions, as well, but their use has little to do with energy efficiency, and therefore we did not consider them. These examples illustrate the principles we applied to circumscribe the energy end-use applications we considered.
By adopting sensible end-use energy efficiency policies now, we can begin to cut our dependence on foreign oil, strengthen our economy and reduce global warming. In the balance of the Executive Summary we highlight the near-term, medium-term and long-term opportunities for improving energy efficiency and the actions that are required to realize the objectives.

American Physical Society • September 2008 ENERGY FUTURE: Think Efficiency | 9
For Transportation ObjectivesThe fuel economy of conventional gasoline-powered light-duty vehicles, which include cars, •sport utility vehicles and pickup trucks, can be increased to at least 35 miles per gallon by 2020 through steady improvements in internal combustion engines, transmissions, aerodynamics and other technologies. This can be done with technology that is available today or in the pipeline, with minimal changes in the performance of current vehicles. Widespread deployment of hy-brid or diesel technology can improve mpg further.
The federal government’s current research, development and demonstration program should •have a broader focus. A more balanced portfolio is needed now across the full range to enable the deployment of potential medium- and long-range advances in automotive technologies. Increased research is needed in batteries for conventional hybrids, plug-in hybrids and battery electric vehicles, and in various types of fuel cells. This more balanced portfolio is likely to bring significant benefits sooner than the current program through the development of a more diverse range of efficient modes of transportation, and will aid federal agencies in setting suc-cessive standards for reduced emissions per mile for vehicles.
Although this report does not examine energy efficiency issues for tractor-trailers and other •large trucks, we note that a comprehensive study of the subject recently completed by the Na-tional Academy of Sciences, “Review of the 21st Century Truck Partnership,” concludes that the Department of Energy funding for the program does not match its goals or needs and that the program needs restructuring.
For Buildings ObjectivesThe goal of achieving significant levels of construction of cost-effective residential zero energy •buildings (ZEB) – buildings that use no fossil fuels – by 2020 is feasible, except in hot, humid climates. Most of the required technology to compete with traditional housing is available, but inadequately demonstrated. To achieve this goal in hot, humid climates will require increased R&D to develop low-energy dehumidification and cooling technologies and strategies.
More generally, the federal government should raise its R&D spending for next-generation •building technologies, for training building scientists and for supporting the associated national laboratory, university and private sector research programs. The current investment of some-what more than $100 million per year is considerably less than the $250 million invested in 1980 (in inflation adjusted dollars), which led to important innovations. Funding for building R&D should be restored to the $250 million level during the next 3 to 5 years. The existing demonstration program for construction of low-energy residential buildings, along with associ-ated research, should also be expanded. These steps are necessary to achieve the zero energy building goals of 2020 for all residential buildings and of 2030 for commercial buildings.
Federal and state governments should adopt policies to address the wide range of market barri-•ers and market failures that discourage investment in energy-efficient technologies, especially in the highly fragmented buildings sector, where barriers are especially prevalent. A number of policies have proven effective on a large scale in promoting or requiring investment in energy efficiency in buildings, among them (1) For whole buildings: building energy codes, labeling, audit programs and financial incentives for purchase of efficient technology; (2) For appliances, heating and cooling equipment and lighting: (a) Mandatory efficiency standards in the case of appliances and (b) Voluntary standards, such as industry consensus guidelines in the case of lighting usage and federally promoted labels (Energy Star, for example) to highlight excep-tional efficiency performance in the case of appliances.
In th
e n
ear te
rm

10 | ENERGY FUTURE: Think Efficiency American Physical Society • September 2008
The Department of Energy should develop and promulgate appliance efficiency standards •at levels that are cost-effective and technically achievable, as required by the federal leg-islation enabling the standards. DOE should promulgate standards for all products for which it has been granted authority to do so. A streamlined procedure is needed to avoid delays in releasing the standards.
Demand-side management programs in which a central agency, often a utility company, •invests money to assist customers in becoming more energy efficient have proven very effective. Yet, many states have hesitated to create such programs. Where DSM programs do not exist, the federal government should encourage states to initiate them through util-ity companies. The federal role could be to provide rewards to states that have significant and effective DSM programs and disincentives to those that do not.
California has been a leader in developing its own building energy standards, which have •proven very effective. Standards, such as those promulgated in California, should be implemented nationwide. States should be strongly encouraged to set standards for resi-dential buildings and require localities to enforce them. For commercial buildings, per-formance-based standards that rely on computer software to compare a building design with a reference building are implemented only in California. The federal government should develop a computer software tool much like that used in California to enable states to adopt performance standards for commercial buildings. States should set standards tight enough to spur innovation in their building industries.
Reducing energy consumption and the carbon footprint is one of the most important goals •for green buildings. Any green building rating system, such as the Leadership in Energy and Environmental Design (LEED) Green Building Rating System, should give energy efficiency the highest priority and require reporting of energy consumption data.
For Crosscutting ObjectivesThe Department of Energy’s Office of Science has a broad energy-related mission. Through •energy authorization legislation enacted in 2005 and 2007, Congress and the administra-tion have asserted that the DOE Office of Science requires significant funding increases to carry out its basic research mission. Congress should appropriate and the White House should approve for the DOE Office of Science funds that are consistent with the spending profiles specified in the 2005 Energy Policy Act and the 2007 America COMPETES Act. Congress should periodically review the Energy Frontiers Research Centers program to ensure that basic research related to energy efficiency receives adequate attention.
DOE should fully comply with the 2005 Energy Policy Act mandate to improve the coor-•dination between its basic and applied research activities. Congressional oversight com-mittees should ensure that DOE fulfills its obligation. Historically, coordination among basic and applied research programs within the Department of Energy has been far from ideal.
Within DOE, indeed within the federal government as a whole, long-term applied re-•search, whether it is general or strategic in nature, often is the orphan child of science and technology programming. To meet the out-year technology goals we have proposed for energy efficiency, DOE must take steps now to fold long-term applied research into its science and technology programming in a more serious way than it currently does. The department has several options. It can charge the Office of Science with the responsibility and provide the necessary budget, but if it does so, it must protect the culture and budgets
In t
he n
ear
term

In th
e n
ear te
rm
American Physical Society • September 2008 ENERGY FUTURE: Think Efficiency | 11
of its current basic research programs. It can designate the Energy Efficiency and Renew-able Energy Office (EERE) with the responsibility and augment its budget for that purpose, but in that case, DOE must be careful not to allow short-term activities to continue to diminish long-term opportunities. The department can also create a new structure to sup-port long-term applied research or adapt the Advanced Research Projects Agency – Energy (ARPA-E), which was established by the America COMPETES Act.
ARPA-E’s program mission is to facilitate bringing to market the fruits of high-risk, high-•payoff research in the energy sector, but its modus operandi and the nature of its portfolio depend on clarification of its role. For example, if ARPA-E is to function as a venture capi-tal firm, as some advocates believe it should, it needs a venture capital (VC) perspective. If its investments are in partnership with the private sector, as some successful DOE R&D programs have been, it needs to adopt an appropriately different point of view. But whether it invests on its own or functions as a technology bridge between the DOE laboratories and the private sector, ARPA-E would greatly benefit from a group of outside advisors who can bring the competitive private sector’s perspective to bear. We note that ARPA-E is modeled after the Department of Defense’s highly successful DARPA program, but unlike DARPA, ARPA-E’s customers are principally in the private sector and not within the agency that oversees its activities. If ARPA-E is to be successful, it needs to have its purposes better defined, its time horizons clarified and the couplings to its ultimate customer, the private sector, put in better focus.
12 | ENERGY FUTURE: Think Efficiency American Physical Society • September 2008
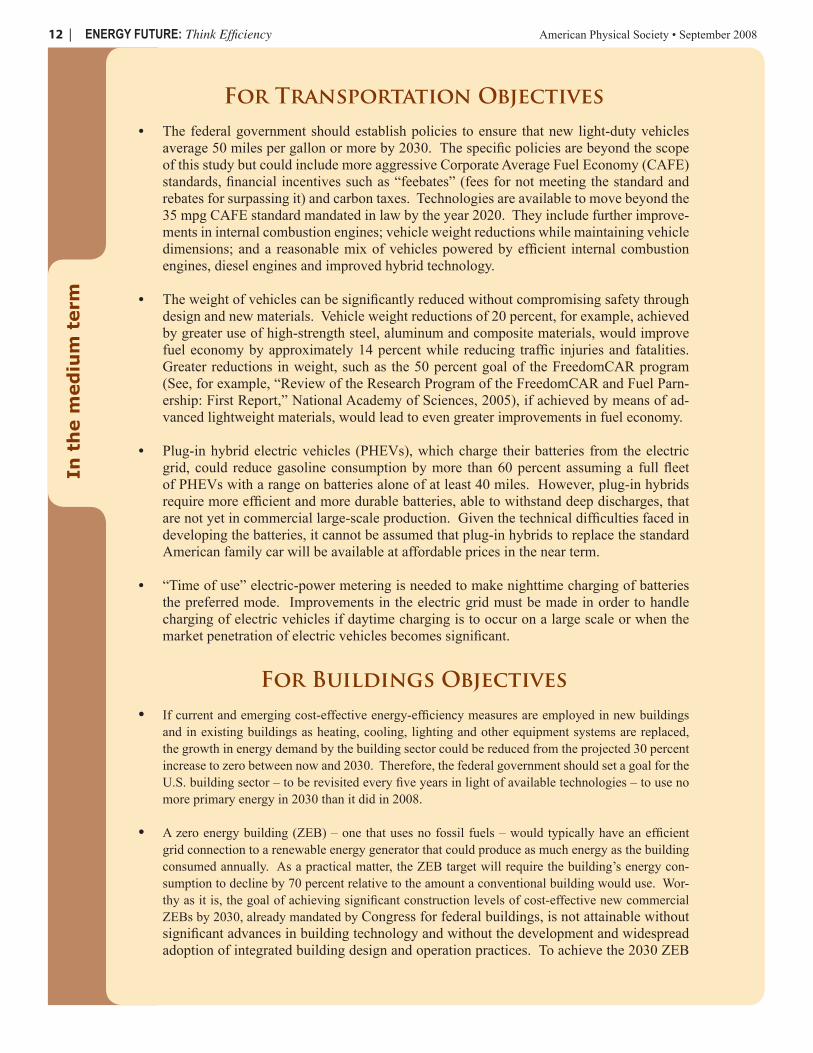
For Transportation ObjectivesThe federal government should establish policies to ensure that new light-duty vehicles •average 50 miles per gallon or more by 2030. The specific policies are beyond the scope of this study but could include more aggressive Corporate Average Fuel Economy (CAFE) standards, financial incentives such as “feebates” (fees for not meeting the standard and rebates for surpassing it) and carbon taxes. Technologies are available to move beyond the 35 mpg CAFE standard mandated in law by the year 2020. They include further improve-ments in internal combustion engines; vehicle weight reductions while maintaining vehicle dimensions; and a reasonable mix of vehicles powered by efficient internal combustion engines, diesel engines and improved hybrid technology.
The weight of vehicles can be significantly reduced without compromising safety through •design and new materials. Vehicle weight reductions of 20 percent, for example, achieved by greater use of high-strength steel, aluminum and composite materials, would improve fuel economy by approximately 14 percent while reducing traffic injuries and fatalities. Greater reductions in weight, such as the 50 percent goal of the FreedomCAR program (See, for example, “Review of the Research Program of the FreedomCAR and Fuel Parn-ership: First Report,” National Academy of Sciences, 2005), if achieved by means of ad-vanced lightweight materials, would lead to even greater improvements in fuel economy.
Plug-in hybrid electric vehicles (PHEVs), which charge their batteries from the electric •grid, could reduce gasoline consumption by more than 60 percent assuming a full fleet of PHEVs with a range on batteries alone of at least 40 miles. However, plug-in hybrids require more efficient and more durable batteries, able to withstand deep discharges, that are not yet in commercial large-scale production. Given the technical difficulties faced in developing the batteries, it cannot be assumed that plug-in hybrids to replace the standard American family car will be available at affordable prices in the near term.
“Time of use” electric-power metering is needed to make nighttime charging of batteries •the preferred mode. Improvements in the electric grid must be made in order to handle charging of electric vehicles if daytime charging is to occur on a large scale or when the market penetration of electric vehicles becomes significant.
For Buildings ObjectivesIf current and emerging cost-effective energy-efficiency measures are employed in new buildings •and in existing buildings as heating, cooling, lighting and other equipment systems are replaced, the growth in energy demand by the building sector could be reduced from the projected 30 percent increase to zero between now and 2030. Therefore, the federal government should set a goal for the U.S. building sector – to be revisited every five years in light of available technologies – to use no more primary energy in 2030 than it did in 2008.
A zero energy building (ZEB) – one that uses no fossil fuels – would typically have an efficient •grid connection to a renewable energy generator that could produce as much energy as the building consumed annually. As a practical matter, the ZEB target will require the building’s energy con-sumption to decline by 70 percent relative to the amount a conventional building would use. Wor-thy as it is, the goal of achieving significant construction levels of cost-effective new commercial ZEBs by 2030, already mandated by Congress for federal buildings, is not attainable without significant advances in building technology and without the development and widespread adoption of integrated building design and operation practices. To achieve the 2030 ZEB
In t
he m
ed
ium
term

American Physical Society • September 2008 ENERGY FUTURE: Think Efficiency | 13
goal for commercial buildings the federal government should create a research, develop-ment and demonstration program that makes integrated design and operation of buildings standard practice. The federal government, state governments and electric utilities should carry out the program co-operatively, with funding from all three entities.
In th
e m
ed
ium
term

14 | ENERGY FUTURE: Think Efficiency American Physical Society • September 2008
In t
he l
on
g t
erm
For Transportation ObjectivesAn all-electric battery-powered vehicle would reduce to zero the use of petroleum as a fuel •for light-duty vehicles. However, achieving the same range as a gasoline-powered car––300 miles is the government target––requires batteries with much larger capacity than is needed for plug-in hybrid electric vehicles (PHEVs). For the standard mid-priced American family vehicle, batteries with the needed energy storage per unit weight and per unit volume do not exist. A long-term R&D program will be required to develop them.
Hydrogen fuel cell vehicles (FCVs) are not a short-term solution to our oil needs, but rather •a long-term option requiring fundamental science and engineering breakthroughs in several areas. Without such breakthroughs, FCVs are unlikely to be more than a niche product. The main challenges are durability and costs of fuel cells, including their catalysts, cost-effective onboard storage of hydrogen, hydrogen production and deployment of a hydrogen-refueling infrastructure.
There are many areas of long-term basic and applied research that offer unusually promising •opportunities for meeting energy efficiency objectives. Among the most notable specifically related to transportation are batteries and energy storage, catalysts, fuel cells and thermo-electric devices. These areas of opportunity require close coordination between basic and applied research, a management gap that DOE must address more effectively, as we noted earlier in the section on Near Term Crosscutting Objectives.
For Buildings ObjectivesLong-range applied R&D in the buildings sector has been neglected for many years, in part •due to the fragmented nature of the industry. We note that the Department of Energy’s focus on near-term research and demonstration programs within the Office of Energy Efficiency and Renewable Energy (EERE) has exacerbated the problem — an issue we draw attention to further in the following section on Crosscutting Objectives. Among the critical longer term applied research opportunities specifically related to buildings are advanced ventila-tion, advanced windows, thermodynamic cycles and ultra-thin insulators.
For Crosscutting ObjectivesThere are many long-term basic and applied research challenges and opportunities in the •area of energy efficiency that transcend the boundaries of the specific transportation and buildings objectives. We call attention to just a few of the most prominent ones: lightweight materials, solid-state lighting and behavioral research.
________________________________________________________
We conclude by emphasizing, as we did earlier, that technology alone will not lead to the potential gains in energy efficiency we identify in this report. Crafting and implementing wise policies are key to any success.

American Physical Society • September 2008 ENERGY FUTURE: Think Efficiency | 15
Summary of RecommendationsThe federal government should establish policies to ensure that new light-duty vehicles average 1.50 miles per gallon or more by 2030.
The federal government’s current transportation R&D program should have a broader focus. A 2.more balanced portfolio is needed across the full range of potential medium- and long-range advances in automotive technologies. Increased research is needed in batteries for conventional hybrids, plug-in hybrids and battery electric vehicles, and in various types of fuel cells. This more balanced portfolio is likely to bring significant benefits sooner than the current program through the development of a more diverse range of efficient modes of transportation, and will aid federal agencies in setting successive standards for reduced emissions per mile for vehicles.
“Time of use” electric-power metering is needed to make nighttime charging of electric vehicle 3.batteries or plug-in hybrid vehicle (PHEV) batteries the preferred mode. Improvements in the electric grid must be made in order to handle charging of electric vehicles if daytime charging is to occur on a large scale or when the market penetration of electric vehicles becomes signifi-cant.
Federally funded social science research is needed to determine how land-use and transporta-4.tion infrastructure can reduce vehicle miles traveled. Studies of consumer behavior as it relates to transportation should be conducted, as should policy and market-force studies on how to re-duce vehicle miles traveled. Estimation of the long-term effects of transportation infrastructure on transportation demand should become a required component of the transportation planning process.
The federal government should set a goal for the U.S. building sector to use no more primary 5.energy in 2030 than it did in 2008. The goal should be revisited at 5-year intervals in light of the available technology and revised to reflect even more aggressive goals if they are justified by technological improvements.
To achieve the 2030 zero energy building (ZEB) goal for commercial buildings – replacing 6.fossil fuels with renewables and reducing energy consumption by 70 percent relative to conven-tional building usage – the federal government should create a research, development and dem-onstration program that makes integrated design and operation of buildings standard practice. The federal government, state governments and electric utilities should carry out the program co-operatively, with funding coming from all three entities.
Any green building rating system, such as the Leadership in Energy and Environmental Design 7.(LEED) Green Building Rating System, should give energy efficiency the highest priority and require reporting of energy consumption data.
The federal government should sharply increase its R&D spending for next-generation building 8.technologies, for training building scientists and for supporting the associated national labora-tory, university, and private sector research programs. Specifically, funding for building R&D should be restored to its 1980 level — $250 million in 2008 dollars — during the next 3 to 5 years from the current level of $100 million. At the end of that period the buildings program should be reviewed carefully to determine (1) how much continued federal funding will be needed for the program to reach its goals; and (2) which parts of the program are ready to be shifted to the private sector.
The existing demonstration program for construction of low-energy residential buildings, along 9.with associated research, should be expanded.

16 | ENERGY FUTURE: Think Efficiency American Physical Society • September 2008
The Department of Energy should develop and promulgate appliance efficiency standards at 10.levels that are cost-effective and technically achievable, as required by the federal legislation enabling the standards. The department should use a streamlined procedure to promulgate the standards for all products for which it has been granted authority to do so.
The federal government should encourage states to initiate demand-side management (DSM) 11.programs through utility companies, where such programs do not exist. Such programs, in which a central agency (often a utility company) assists customers in becoming more energy efficient, have proven cost-effective. The federal government could provide rewards to states that have significant and effective DSM programs and disincentives to those that don’t.
Energy standards for buildings, such as the standards promulgated in California, should be imple-12.mented nationwide. States should be strongly encouraged to set standards for residential build-ings and require localities to enforce them. The federal government should develop a computer software tool much like that used in California to enable states to adopt performance standards for commercial buildings. States should set standards tight enough to spur innovation in their building industries.
Congress should appropriate and the White House should approve for the DOE Office of Science 13.funds that are consistent with the spending profiles specified in the 2005 Energy Policy Act and the 2007 America COMPETES Act. Congress should exercise its oversight responsibility to ensure that basic research related to energy efficiency receives adequate attention in the selection of Energy Frontiers Research Centers.
To meet the out-year technology goals this report sets for energy efficiency, DOE must take steps 14.to fold long-term applied research into its scientific programming in a more serious way than it currently does. The department has several options. It can charge the Office of Science with the responsibility and provide the necessary budget, but if it does so, it must protect the culture and budgets of its current basic research programs. It can designate the Energy Efficiency and Re-newable Energy Office (EERE) with the responsibility and augment its budget for that purpose, but in that case, DOE must be careful not to allow short-term activities to continue to diminish long-term opportunities. The department can also create a new structure to support long-term applied research or adapt Advanced Research Projects Agency – Energy (ARPA-E), which was established by the America COMPETES Act.
The Department of Energy should fully comply with the 2005 Energy Policy Act mandate to im-15.prove the coordination between its basic and applied research activities. Congressional oversight committees should ensure that DOE fulfills its obligation.
ARPA-E, if funded, needs to have its purposes better defined. Its time horizon must be clarified, 16.and the coupling to its ultimate customer, the private sector, needs better focus. This report takes no position on whether ARPA-E should be funded.
Long-term basic and applied research in energy efficiency should be pursued aggressively. In 17.the case of transportation, the opportunities often point up the close connections between basic and applied research and underscore the need for close coordination of the two activities. In the case of buildings, the fragmented nature of the industry and EERE’s focus on near-term research and demonstration programs have led to a serious lack of long-range applied R&D, a deficiency that needs to be rectified.

Graphic Gallery
Figure 5
U.S. miles per gallon Fuel economy of U.S. car and light trucks, 1975-2005
30
25
20
15
10
1975 1985 1995 20050
U.S.
new
veh
icle
MPG
Model year
CarsBoth
Light trucks
1999 2000 2001 2002 2003 2004 2005 2006 2007 2008*
400,000
380,000
360,000
340,000320,000
300,000
380,000
360,000
240,000
220,000
200,000
180,000160,000
140,000
120,000
100,000
80,000
60,000
40,000
20,000
0
Figure 9
Hybrid auto salesin the U.S.
Figure 6
U.S. fuel economy vs. fuel efficiency
Passenger cars Pickups, minivans and SUVs
15
20
25
30
35
40
1975 1980 1985 1990 1995 2000
Model year
Fuel
eco
nom
y (m
pg)
27
30
33
36
39
42
45
Vehi
cle
effic
ienc
y
Efficiency
Fuel economy
10
15
20
25
30
1975 1980 1985 1990 1995 2000
Model year
Fuel
eco
nom
y (m
pg)
20
25
30
35
40
45
Efficiency
Fuel economy
Fuel economy and fuel efficiency for cars and light trucks in the United States for the period 1975 to 2004. (The unit of efficiency in this figure only is ton-miles per gallon. This is the fuel efficiency mentioned in the text multiplied by the weight of the vehicle.)
3.0
2.9
2.8
2.7
2.6
2.5
Figure 10
Fewer miles
In trillions of miles
1998 2000 2002 2004 2006 2008
Vehicle miles traveled as reported by the Federal Highway Administration. Note the decrease in 2008.
Miles driven12-month total, monthly
Source: Environmental Protection Agency (2007)
4,500 15
14
13
12
11
10
9
4,000
3,500
3,000
Figure 7
Vehicle weight and acceleration, 1975-2007
Weight in pounds 0 to 60 seconds
0 to 60 seconds
Weight
1975 1980 20051985 1990 1995 2000
Model year
Vehicle weight initially decreased to help meet the new standards, but has increased ever since.
100%
90%
80%
70%
60%
50%
40%
30%
20%
10%
0%
Daily travel (miles per vehicle)
% of sampled vehicle VMT
0 20 40 60 80 100 120 140 160 180 200 220 240 260 280 300
Figure 11
On the roadPercent of sampled vehicle miles traveled as a function of daily travel.
Distribution of VMT by vehicles in the 2001 NHTS travel day file
Figure 8
Possible technology advances may help
Fuel
eco
nom
y (m
pg)
Potential for advanced conventional technologies to increase fuel economy by 2030.
2005 Base 2030 Advance 2030 Diesel 2030 Turbo SI 2030 Hybrid
100
90
80
70
60
50
40
30
20
10
0
Camry 2.5 LCamry 3.0F-150 Pickup
100%
90%
80%
70%
60%
50%
40%
30%
20%
10%
0%
PHEV electric range (miles)
% of VMT on electricity
0 20 40 60 80 100 120 140 160 180 200 220 240 260 280 300
Figure 12
Electric-powered drivingFraction of vehicle miles traveled driven on electricity as a function of the PHEV electric range.
VMT satisfied by PHEVall electric range
Figure 6U.S. fuel economy vs. fuel efficiency
Page 30
Figure 10Fewer miles traveled
Page 34
Figure 14Projected well-to-wheels greenhouse gas emissions
Page 44
Figure 5U.S. miles per gallon
Page 29
Figure 9Hybrid auto sales in the U.S..
Page 32
Figure 13Transportation greenhouse gas emissions
Page 43
Figure 8Possible technology advances may help
Page 32
Figure 12Electric-powered driving
Page 37
Figure 16Battery performance
Page 46
Figure 7Vehicle weight and acceleration
Page 31
Figure 11On the road
Page 36
Figure 15Where does the energy go in an automobile.
Page 44
Figure 1
Energy usage in the U.S.Distribution of U.S. energy usage in 2006, grouped by end-use sector (transportation, buildings and industry). Annual consumption for 2007 was 101.6 Quads (1015 BTU).
Buildings petroleum 3%
Buildings natural gas 12%
Buildings coal 15%
3%
Buildings nuclear 6%
Transportation petroleum
Transportation natural gas 1%
27% Transportation coal
0%
Transportation renewables 0%
Transportation nuclear 0%
Industry petroleum
Industry natural gas
10%
10%
Industry coal 8%
Industry renewables 3%
Industry nuclear
2%
Buildings renewables
Figure 3
Electricity usage and economic growth for California and the United States
0
5,000
10,000
15,000
20,000
25,000
30,000
35,000
40,000
45,000
50,000
1975 1978 1981 1984 1987 1990 1993 1996 1999 2002 20050
2,000
4,000
6,000
8,000
10,000
12,000
14,00015,000
kWh per capitaGDP per capita
Gross Domestic Product per capita U.S. California
Kilowatts per capita U.S. California
Figure 4
Energy and transportation in the U.S.
Motorcycles 1%
Light vehicles 63%
Heavy duty road 17%
Air 9%
Water 5%Pipeline 3%
Rail 2%
U.S. transportation energy consumption by mode in 2005.
Figure 2U.S. mid-range abatement curve – 2030.
Page 22
Figure 1Energy usage in the U.S.
Page 21
Figure 4Energy and transportation in the U.S.
Page 29
Figure 3Energy efficiency and economic growth Page 23
American Physical Society • September 2008 ENERGY FUTURE: Think Efficiency | 17

Graphic GalleryComparison of present-day Li-ion batteries with DOE hybrid-electric-vehicle goals.
0
10
20
30
40
50
60
70
80
90
100
Specificpower
Power density
Specific available energy
Availableenergydensity
Cycle life
Calendar life
Production price
Operatingtemperature
range
Perc
ent o
f goa
l ach
ieve
d
Figure 17
Battery comparisonsFigure 19
Total primary energy consumptions for buildingsPrimary energy use (including that associated with electric use) for the residential and commercial sectors in Quad (1015 Btu).
1950 1960 1970 1980 1990 2000 2010 2020 2030
30
25
20
15
30
5
0
Residential
Commercial
Qua
drill
ion
(BTU
)
Numbers after 2006 are projections.
Figure 18Residential energy end usage
Page 53
Figure 17Battery comparisons
Page 47
Figure 20Total primary energy consumptions for buildings
Page 55
Figure 19Commerical energy end usage
Page 54
Figure 23
The impact of standards on efficiency of 3 household appliancesGas furnaces
Central air conditioners
Refrigerators
Refrigerators
Central air conditioners
1972 1976 1980 1984 1988 1992 1996 200020
30
40
50
60
70
80
90
100
75%
60%
25%
Inde
x (1
972
= 10
0)
110 Efficiency dates of national standards
Efficiency dates of state standards
Gas furnaces
Figure 22Electric savings from Calif.’s energy efficiency programs
Page 68
Figure 21National lighting energy consumption.
Page 58
Figure 23The impact of standards on effi-ciency of 3 household appliances
Page 69
Figure 24
The flow of energy by sector2006 flows of primary energy into the four end-use sectors (Commercial, Residential, Industrial, and Transportation) by way of the Electric Power Sector. The electric power sector took in
Coal
Coal
35.5%
51.6%
20.7%
15.8%
9.7%
1.6%
0.6%250 TWhT&D Loss
3,650TWhSales
39.7 Q 3,900 Twh
Waste heat26.3 Quad
37.0%
27.3%
0.2%
Commercial
Residential
Industrial
Transportation
Nuclear
Natural gas
Renewables
Petroleum
Other
Figure 25Residential electric savings potential for year 2030 Page 76
Figure 24The flow of energy by sector
Page 74
Table 1Energy density per volume and per weight
Page 43
Tables
Table 3Demand-side management programs
Page 80
Table 2Primary usage of energy in U.S.
Page 75
Figure 22
Electric savings from California’s energy efficiency programsAnnual electric energy savings in California since 1975 associated with appliance standards, building energy standards and utility DSM programs.
0
5,000
10,000
15,000
20,000
25,000
30,000
35,000
40,000
45,000
GW
h pe
r yea
r
Appliance standards
15% of annual electricity use in California in 2003
Utility efficiency programs
Building standards
Figure 26A commercial building with integrated systems design and operations
Page 82
18 | ENERGY FUTURE: Think Efficiency American Physical Society • September 2008

CH
AP
TE
R 1
CH
AP
TE
R 1
American Physical Society • September 2008 ENERGY FUTURE: Think Efficiency | 19
I n t r o d u c t i o nWhether you want the United States to achieve greater energy security by weaning itself off foreign oil, sustain strong economic growth in the face of worldwide competition or reduce global warming by decreasing carbon emissions, energy efficiency is where you need to start. Thirty-five years ago the U.S. adopted national strategies, implemented policies and developed technol-ogies that significantly improved energy efficiency. More than three decades have passed since then, and science and technology have progressed considerably, but U.S. energy policy has not. It is time to revisit the issue.
In this report we examine the scientific and technological oppor-tunities and policy actions that can make the United States more energy efficient, increase its security and reduce its impact on global warming. We believe the findings and recommendations will help Congress and the next administration to realize these goals. Our focus is on the transportation and buildings sectors of the economy. The opportunities are huge and the costs are small.
Nowhere in the world does energy affect the lives of people more than in the United States, one of the world’s largest per capita consumers of that commod-ity. Nowhere is the standard of living more rooted in energy than in the United
States, and, with its defense forces deployed in the most distant regions around the world, nowhere is the security of a nation more dependent on energy.
Yet only in times of extreme turbulence—the OPEC (the Organization of Petro-leum Exporting Countries) oil embargo in 1973, the overthrow of the shah of Iran in 1979 and the Persian Gulf War in 1991—when public frustration became politically intolerable did American officials devote serious attention to energy policy. Although some of the policy initiatives yielded significant benefits, others were left on the draft-ing board, as the nation reverted to a business-as-usual energy routine, once the turbu-lence passed and public dissatisfaction dissipated.
Today the American public is again demanding that its elected officials take ac-tion. Gasoline prices are soaring, increased transportation costs are driving up the costs of goods, and home-heating oil is becoming prohibitively expensive. The people feel as if they are under siege.
In contrast to previous market instabilities, however, this one may be more endur-ing. Thirty-five years ago, when OPEC imposed its oil embargo, the United States was importing 6.3 million barrels a day; today it imports 13.5 million barrels a day, two-thirds of the nation’s consumption. Thirty-five years ago, the world’s two most populous countries, China and India, were poor agrarian societies that had minimal need for oil; today they are rapidly developing industrial economies with a greatly increasing demand for energy. Thirty-five years ago, unfriendly nation states posed the greatest risk to oil security; today terrorist groups have added substantially to potential interruptions of global supplies.

20 | ENERGY FUTURE: Think Efficiency American Physical Society • September 2008
By enacting Public Law 110-140, the Energy Independence and Security Act of 2007, Congress and the administration explicitly recognized the national security threat created by our unwholesome dependence on foreign sources of oil. Titles I, III and IV of the act deal specifically with energy ef-ficiency policies in the transportation and buildings sector. Generally this report neither criticizes nor endorses particular portions of those titles, but instead focuses on the scientific and technological opportunities and challenges associated with improving energy efficiency in the transportation and buildings sectors.
–––––––––––––––––––––––––––––––––––––––––––––––––––––
Without question, the United States faces a greater energy risk today than it has at any time in its history. But the nation and the world face another risk that was barely recognized thirty-five years ago. Global warming and the potential it has for causing major disruptions to Earth’s climate are scientific realities. The precise extent of the human contribution to global warming still needs deeper understanding, but there is virtually no disagreement among scientists that it is real and substantial.
The physics and chemistry of the greenhouse gas effect are well understood and beyond dis-pute. Science has also achieved an overwhelming consensus that the increase in greenhouse gases is largely of human origin, tracing back to the Industrial Revolution and accelerating in recent years, as carbon dioxide and methane—the products of fossil fuel use—have entered the atmosphere in increasing quantities.
Modeling the climate has proven to be a complex scientific task. But although the models are far from perfect, many of their predictions are so alarming that conservative, risk-averse policymaking requires that they be considered with extraordinary gravity.
––––––––––––––––––––––––––––––––––––––––––––––––––––––
Energy is necessary for almost all facets of human existence: oil and gas for cooking and heating; electricity for cooling, lighting, appliances and machines; gasoline and diesel fuel for transportation; and a mix of energy supplies for myriad other purposes. Energy is necessary for every society at every level of development, but as a general rule, energy consumption increases as societies become more developed and their standard of living rises. The United States, for example, which boasts the highest per capita gross domestic product (GDP) among nations of 10 million people or more, has approximately 5 percent of the world’s population but consumes almost 25 percent of the world’s energy supply each year.
Just as the per capita GDP delineates have and have-not nations, so do primary energy reserves. Oil, natural gas and coal are not distributed uniformly around the world. The United States, for ex-ample, is coal rich, possessing far more recoverable reserves than any other nation—about 275 bil-lion tons, or 25 percent of the world’s total. But in the case of oil, the United States has less than 2.5 percent of the world’s known reserves, and at the current rate of domestic production that percentage is shrinking rapidly.
Relying on foreign oil is particularly dangerous for our nation, since two-thirds of the world’s known reserves are in non-democratic countries, some of them overtly hostile to American interests. Replacing oil with other sources of energy and reducing energy consumption are clearly in the best interests of national security.
U.S. policymakers therefore face the challenge of keeping the American economy humming while simultaneously reducing the emission of greenhouse gases and diminishing the nation’s de-pendence on uncertain and insecure sources of foreign oil. The challenge may seem daunting, but the twin goals are achievable if the nation adopts wise policies and makes prudent investments in research and development. A strong industry commitment to short-term applied research and devel-opment, sustained federal government investment in long-term basic and applied research and the adoption of state and federal policies that stimulate the market for greater energy efficiency can re-
American Physical Society • September 2008 ENERGY FUTURE: Think Efficiency | 21
duce greenhouse gas emissions, achieve energy security and enable the American economy to remain robust and competitive. The greatest impact at the least cost can come from improving the energy efficiency in key sectors of our economy.
____________________________________________________
Reducing global carbon emissions while the world’s economies continue to grow will not be easy. Science and technology, coupled with intelligent policymaking, provide the United States with the tools needed to achieve the goal at home and stimulate success in other parts of the world.
Of all policy and technology options, the one that has the greatest potential in the next two de-cades is improving energy efficiency, particularly end-use efficiency in buildings and transportation. These two sectors together account for almost 70% of total domestic carbon emissions. However, elected officials, policymakers, industrial leaders and the public have paid scant attention to energy efficiency in the past. But with oil and gasoline prices skyrocketing, foreign supplies increasingly insecure and global warming widely accepted as a scientific reality, energy efficiency is gaining cur-rency as a policy issue, an economic issue and a research and development issue.
The American Physical Society (APS) is not new to the issue of energy efficiency. It first ad-dressed the question in 1975 [W. Carnahan et al., 1975], and the results of that APS study helped pro-vide the intellectual underpinnings for achieving major efficiency gains, particularly in appliances, heating systems and air conditioning. The current APS study focuses on end-use efficiency in two of the three end-use sectors: transportation and buildings. It does not address industrial energy usage, because the problems there are industry specific and it was not feasible to assemble a set of general-ized findings and recommendations. Nor does this study address the efficiency issues associated with the generation and transmission of electricity, in which 50 percent to 70 percent of the energy created
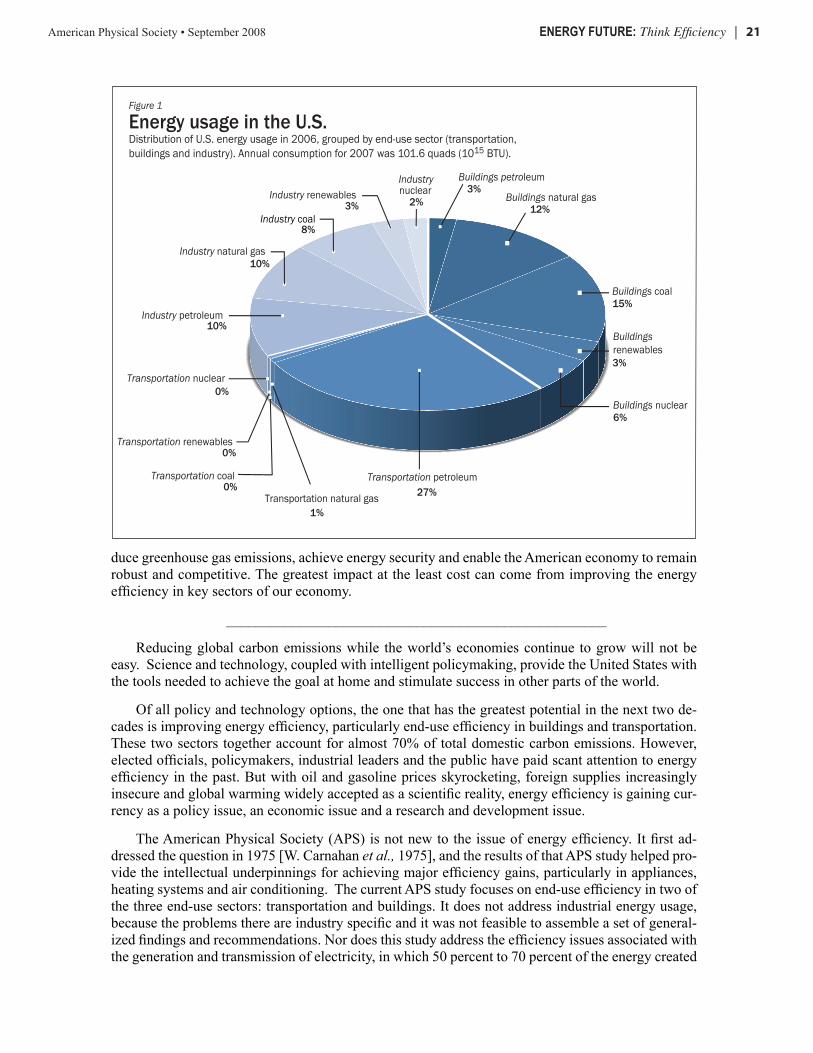
Figure 1
Energy usage in the U.S.Distribution of U.S. energy usage in 2006, grouped by end-use sector (transportation, buildings and industry). Annual consumption for 2007 was 101.6 quads (1015 BTU).
Buildings petroleum 3%
Buildings natural gas 12%
Buildings coal 15%
3%
Buildings nuclear 6%
Transportation petroleum
Transportation natural gas 1%
27% Transportation coal
0%
Transportation renewables 0%
Transportation nuclear 0%
Industry petroleum
Industry natural gas
10%
10%
Industry coal 8%
Industry renewables 3%
Industry nuclear
2%
Buildings renewables

22 | ENERGY FUTURE: Think Efficiency American Physical Society • September 2008
is lost depending on the generating technology.
To put the three sectors—end-use buildings, transportation and industry—in the context of en-ergy security and carbon emissions, we begin by summarizing the amount of U.S. primary energy (petroleum, natural gas, coal, renewables and nuclear) each sector uses. As Figure 1 illustrates, trans-portation accounts for 68 percent of U.S. petroleum consumption. Therefore, improving efficiencies and trimming the use of petroleum in transportation—including greater reliance on rechargeable batteries or fuel cells in the years ahead—provides the greatest potential for reducing America’s de-pendence on foreign oil and for increasing America’s energy security.
Converting the sector data shown in Figure 1 into proportional shares of carbon emissions re-quires taking into account how much carbon each of the three fossil fuels—petroleum, natural gas and coal—contains. Including the carbon emissions from the generation of the electricity used in each sector, the analysis shows that each is responsible for about a third of the emissions: buildings, 36 percent; transportation, 32 percent; and industry, 32 percent. Significant improvements in build-ing and transportation efficiency, which this report will demonstrate are within reach, provide an extraordinary potential for making major reductions in greenhouse gas emissions. Improving energy efficiency is therefore, in a real sense, equivalent to replacing fossil fuels with non-polluting sources of energy.
Reducing carbon emissions will have economic ramifications, and, contrary to common lore, many of them are beneficial, as noted by McKinsey and Company, a private research firm, in its
Source: Reducing U.S. Greenhouse Gas Emissions: How Much at What Cost?, Executive Report, McKinsey & Company, December 2007
Figure 2
U.S. mid-range abatement curve - 2030Abatement costs <$50 per ton
COST: Real 2005 dollars per ton CO2
0
30
60
90
-120
-220
-30
-60
-90
-230
Residential electronics
Commercial electronics
Residential buildings –Lighting
Commercial buildings –LED lighting
Fuel economy packages – Cars
Commercial buildings –CFL lighting
Cellulosicbiofuels
Industry –Combined heat and power
Existing power plant conversion efficiency improvements
Conservation tillage
Fuel economypackages –Light trucks
Commercial buildings –Combined heat and power
Coal mining –Methane management
Commercial buildings –Control systems
Distributed solar PV
Residential buildings –Shell retrofits
Nuclear
builtnewly
Natural gas and petroleum systems management
Active forest management
Afforestationof pastureland
Reforestation
Winter cover crops
Onshore wind –Medium penetration
Coal power plants – CCS new builds with EOR
Biomass power –Cofiring
Onshore wind –High penetration
Industry –CCS new builds on carbon-intensiveprocesses
Coal power plants–CCS new builds
Coal power plants –CCS rebuilds
Coal-to-gas shift - dispatch of existing plants
Car hybridization
Commercial buildings –HVACequipment efficiency
Solar CSP
Residential buildings –HVACequipment efficiency
Industrial process improvements
Residential water heaters
Manufacturing –HFCs management
Coal power plants–CCS rebuilds with EOR
PotentialGigatonsper year
Commercial buildings –New shell improvements
Afforestation of cropland
0
Onshore wind –Low penetration
Residential buildings –New shell improvements
1.0 1.2 1.4 3.21.8 2.00.2 0.4 0.6 0.8 1.6 2.2 2.4 2.6 2.8 3.0
Carbon dioxide abatement: estimated removal cost per ton of CO2 in 2005 dollars and removal potential in gigatons/yr for various strategies.

American Physical Society • September 2008 ENERGY FUTURE: Think Efficiency | 23
2007 report, “Reducing U.S. Greenhouse Gas Emissions: How Much at What Cost?” Although we have not examined the data used in the McKinsey analysis, we find the U.S. Mid-Range Abatement Curve—2030, shown in Figure 2, at least qualitatively instructive. Replacing carbon-emitting fossil fuels with most alternative energy sources, including clean-coal (with carbon sequestration), nuclear power, biomass, wind, solar photovoltaics (PV) and concentrated solar power (CSP), costs the econo-my money (positive bars, expressed in 2005 dollars per ton of CO2 removed from the emission inven-tory). But, improving energy efficiency in transportation and buildings generally saves the economy money (negative bars).
Despite the projected savings, some critics argue that reducing per capita energy use through im-proved efficiency could depress economic growth. But the California experience suggests otherwise. In 1975 California instituted a program to improve electrical energy efficiency—in part as a response to the APS study. California’s policies, including regulations and incentives, have helped hold the state’s per capita electricity use constant for the past 30 years while allowing its economy to flourish. Some of the reduction in energy consumption is attributable to changes in California’s economic mix, but a significant fraction is associated with efficiency gains. During the same 30-year period, electric-ity use per capita in the United States rose by 50 percent, and GDP growth nationally did not even keep pace with California’s GDP increase. Figure 3 summarizes the results graphically.
Notwithstanding the positive California experience, in which the state intervened with regulations and incentives to achieve energy efficiencies, some analysts argue that markets ultimately are efficient and will provide the most beneficial outcomes if left unregulated. Government intervention, they say, is unnecessary and potentially harmful. But in the case of energy efficiency, market imperfections ex-ist and must be remedied if progress is to occur. We highlight a few instances, beginning with support for long-term research.
Source: California Energy Commission
Figure 3
Electricity usage and economic growth for California and the United States
0
5,000
10,000
15,000
20,000
25,000
30,000
35,000
40,000
45,000
50,000
1975 1978 1981 1984 1987 1990 1993 1996 1999 2002 2005
0
2,000
4,000
6,000
8,000
10,000
12,000
14,00015,000
kWh per capitaGDP per capita
Gross Domestic Product (GDP) per capita U.S. California
Kilowatts hours (kWh) per capita U.S. California

24 | ENERGY FUTURE: Think Efficiency American Physical Society • September 2008
Achieving the maximum efficiencies possible in both transportation and buildings will require making significant scientific advances, many of them taking ten, twenty or more years to achieve. Ex-perience of the past few decades has shown that such time horizons are incompatible with the param-eters established by financial markets, which require companies to demonstrate performance every quarter or every year. Money may be patient to some degree, but certainly not for a decade or more.
Long-term research, either basic or applied, is simply not well suited to the abbreviated time frames of the private sector, nor are many of the risks associated with such research generally accept-able to most financial investors. As a result, over the past thirty years, the United States has evolved toward a system in which funding of long-term basic research has become the province of the federal government and investment in short-term applied research and development has remained largely in the domain of private industry. Although the hand-off from public-sector science to private-sector innovation is not perfect, the U.S. model has shown great efficacy and resilience and is now emulated by many other countries.
Even when technologies exist, the market does not always react efficiently. In the case of build-ings, for example, tenants are often responsible for paying for utilities and maintenance. Therefore, builders and landlords have little incentive to spend extra money to achieve energy efficiencies in lighting, heating, cooling and structural design. Few residential consumers have the knowledge or the time to seek energy efficient products. Absent government energy labels, codes and standards, market forces alone will not encourage such investments.
In the case of transportation, especially in the light-vehicle sector, manufacturers in recent years have optimized their profits by building vehicles of ever increasing size and horsepower. While gas prices were low, power and size provided the greatest appeal to consumers and the greatest profits for manufacturers. Absent a penalty for carbon emissions, neither sellers nor buyers had any incentive to favor more efficient and less carbon-polluting vehicles. We note that consumer preference for power and size has changed dramatically in the last year as rapidly rising gasoline prices have driven buyers away from sport-utility vehicles and pick-up trucks. But if gasoline prices fall, the prior pattern of sales could easily resume.
The building and transportation sectors also have significant inertia built into them by the associ-ated lifecycle times. When the costs of energy rise rapidly and unexpectedly or the potential interrup-tion of oil supplies suddenly looms large—both of which we have witnessed over the past year—a market that functions on much longer lifecycle times often cannot react rapidly enough to avoid the adverse societal and economic consequences. Incandescent lamps, which typically burn out after a year, are an exception. But the development of energy-efficient replacement lamps required govern-ment-funded R&D that took place over many years. Appliances generally last 7 to 20 years; cars, 10 to 15 years; heating and cooling systems in commercial buildings, 20 years or more; and building structures, 50 to 100 years.
With such relatively long lifecycles affecting the buildings and transportation sectors, and with energy costs and occasional supply interruptions mostly unpredictable, market forces alone cannot drive the adoption of energy-efficiency technologies in a beneficially sustained manner within the timeframe imposed by the challenges of global warming. Stimulating the markets to behave effi-ciently, given the external realities, requires carefully crafted policies. These could involve selective mandates, such as CAFE (Corporate Average Fuel Efficiency) standards for cars and light trucks, building codes and appliance standards. They could involve taxes, such as those applied to the weight of a vehicle or an engine displacement. They could include incentives such as those that have been ap-plied to hybrid cars or solar panels. Or they could require energy labeling of products or energy audits of buildings that would permit consumers to make choices based on better information.
Identifying which set of policies is likely to have the greatest influence on implementing the recommendations of our study sometimes lies beyond the scope of our report. Indeed, in a number of cases the choice of policies might require additional social science research into how people evalu-

American Physical Society • September 2008 ENERGY FUTURE: Think Efficiency | 25
ate risk, how they integrate long-term and short-term benefits and costs, how they react to economic triggers and how they understand and value the energy security and global warming issues. While this report focuses on the physical sciences and was written largely by experts in that field, the panel strongly believes that progress in energy policy will be inadequate without additional social science research and without implementing what social science can already teach us about policies to use energy more efficiently. Even when we refrain from prescribing specific policy choices, we are reso-lute in our view that appropriate policies must be adopted for technological developments to have the greatest benefit.
Before we address the specifics of energy efficiency in the transportation and buildings sectors, we pause to clarify two issues: what we mean by “energy efficiency” and what criteria we use to cir-cumscribe “energy end use.”
In common parlance “energy efficiency” denotes the ratio of useful energy or work a device pro-duces to the energy the device consumes. For example, a furnace that burns its fuel completely but loses 20 percent of the heat it produces to flue gases escaping up the chimney is said to be 80 percent efficient because it converts 80 percent of the fuel’s energy into usable heat. Similarly, an internal combustion engine that transforms 20 percent of the chemical energy contained in gasoline into a car’s energy of motion (kinetic energy) but loses 80 percent of the gasoline’s energy to waste heat is said to be 20 percent efficient.
The ratio of useful energy output to total energy input may seem an intuitively reasonable defini-tion of energy efficiency, but in some cases it is too simplistic. Consider two homes, for example, both heated with 80 percent efficiency furnaces. One of the homes is well insulated and the other one has little or no insulation. We would certainly view the well insulated home, which might use one-fifth as much energy, as far more energy-efficient, even though the furnaces of both homes carry the same efficiency rating. Similarly, if we could use a “thermoelectric” device to convert some of the waste heat of a car’s engine into electricity to power accessories or recharge a hybrid car’s battery, we could increase the overall efficiency of the car without ever increasing the efficiency of its internal combus-tion engine.
Another definition of energy efficiency has greater utility: the ratio of the minimum amount of energy needed for accomplishing a task to the energy actually used. Although it may not always be possible to determine the minimum amount of primary energy required for a task, it is still possible to compare the relative efficiencies of two methods for accomplishing the same task. In this report, we implicitly apply such logic when we conclude that one strategy is more energy efficient than an-other.
____________________________________________
Separating energy end use from energy production and delivery may seem like a simple task, but it isn’t, particularly in the case of energy efficiency. For example, the use of plug-in hybrid cars or trucks for transportation will reduce oil consumption and in that respect make vehicles more carbon efficient and less dependent on foreign sources of energy. But plug-in hybrids will also need electric-ity for recharging their onboard batteries, and in most cases the electricity will have to be generated centrally and distributed through the power grid. The efficiency of electricity generation has to be counted in determining the overall energy efficiency. If plug-in hybrids become ubiquitous, their widespread use will almost certainly require increasing electrical generation capacity and upgrading the grid. Many of the same things can be said about fuel cell vehicles.
Despite their impact on energy production and distribution, we elected to include plug-in hybrids and fuel cell vehicles in our discussion of energy efficiency in the transportation sector, because we believe they have an extraordinary potential for decreasing carbon emissions and increasing our en-ergy security. By contrast, we elected not to discuss biofuels, including ethanol and biodiesel, because they have minimal impact on energy efficiency.

26 | ENERGY FUTURE: Think Efficiency American Physical Society • September 2008
We recognize that some of our choices regarding which science and technologies to emphasize in this study may seem arbitrary, but we believe they represent the areas that have the greatest poten-tial for increasing our nation’s energy security, decreasing our dependence on foreign sources of oil, reducing the nation’s contribution to greenhouse gas emissions and sustaining our economy. In the following three chapters, we examine the possibilities for improving energy efficiency in two prin-cipal energy sectors: transportation and buildings. We also highlight the research and development opportunities and the public policies that we believe to be most effective in achieving the twin goals of improved energy security and reduced greenhouse gas emissions.
Attaining these objectives may seem like a formidable challenge. But in answer to the question, “Can we do it?” We note that in a speech to the nation during the oil shock of 1973, President Richard Nixon unveiled “Project Independence 1980” [New York Times, 1973]. It was “a series of plans and goals,” he said, “set to insure by the end of this decade Americans will not have to rely on any source of energy beyond our own.” President Nixon resigned from office eight months later, and although the our nation never achieved the energy independence he and his successor Gerald Ford sought, the energy efficiency measures the United States adopted cut energy consumption dramatically even as our economy continued to thrive. The Project Independence report [Federal Energy Administration, 1974] had predicted that American energy needs would double from 75 quads at that time to 150 quads by the turn of century. In fact, by the year 2000, American energy consumption had not yet reached 100 quads, an increase of less than a third, even though the real U.S. gross domestic product (GDP) had more than doubled. The movement from manufacturing to services, perhaps not suffi-ciently foreseen in 1975, played a role in reducing the number of quads consumed per unit of GDP, but so too did major improvements in energy efficiency.
There is no reason why we cannot use gains in efficiency once again to curb our energy con-sumption. Reducing our dependence on foreign oil is at least as important today as it was in 1974, and restricting greenhouse gas emissions, which was not on the scientific radar screen three decades ago, is now a recognized global necessity. As this report shows, we are not remotely near any physi-cal limitations on efficiency improvement. What we need are the innovations, policies and will to achieve the goal.

American Physical Society • September 2008 ENERGY FUTURE: Think Efficiency | 27
C h a p t e r 1 R e f e r e n c e sW. Carnahan, K. W. Ford, A. Prosperetti, G. I. Rochlin, A. Rosenfeld, M. Ross, J. Rothberg, •G. Seidel and R. H. Socolow, eds., “Technical Aspects of the More Efficient Utilization of Energy,” American Institute of Physics, Conference Series, Vol. 25, New York (1975).
Federal Energy Administration, • Project Independence Report, U.S. Government Printing Office (1974).
New York Times, • “Transcript of Nixon’s Address,” November 26, 1973.

CH
AP
TE
R 2
CH
AP
TE
R 2
28 | ENERGY FUTURE: Think Efficiency American Physical Society • September 2008
T r a n s p o r tat i o nEnhancing energy security and reducing global warming through improvements in energy efficiency constitute the two primary objectives of this study. Chapter 2 examines the opportunities and challenges posed by the transportation sector, which consumes 70 percent of the petroleum the United States uses for fuel. Today, our nation imports two out of every three barrels of oil we consume, as we noted in Chapter 1, and U.S. domestic production cannot be increased any time soon. Unless we are able to reduce transportation’s use of petroleum, we will continue to be dependent on potentially unreliable sources of foreign oil, and we will continue to send hundreds of billion of dollars to nations that often do not share our values or global outlook.
Reducing or eliminating transportation’s reliance on petroleum requires developing and deploying technologies and policies that do not place an unaffordable financial burden on consumers or entail rapid changes in where and how people live and work. Unlike many Europeans, who often live in concentrated population centers and have well-developed public transit, most Americans live in suburban and exurban areas and rely heavily on cars to get them to and from work and to perform daily tasks.
In this chapter we focus on technologies and strategies that we believe can get more mileage from existing and emerging technologies, and properly funded and targeted research and development that will likely lead to more options in the future.
Introduction
Last year, Americans driving cars, minivans, sport utility vehicles and pickup trucks burned an average of 270,000 gallons of gasoline a minute. Burning that gasoline dumped the greenhouse gas carbon dioxide into the atmosphere
at the prodigious rate of 2,400 metric tons per minute.
And it wasn’t cheap. Americans paid about $700,000 per minute to the foreign countries that were supplying the oil from which the gasoline was made.
Transportation accounts for 70 percent of the petroleum used for fuel in the U.S., and today we are using more fuel than ever before.1, 2 We import approximately
1. The U.S. transportation sector consumed approximately 18 billion BTUs in 1975 and 40.5 billion BTUs in 2007. (E.I.A.: http://www.eia.doe.gov/emeu/aer/consump.html)
2. “Energyintensitiesarefallingmoreslowlythaneverbeforewhileactualenergyuseincreasedfasterthanatanytimesince1970.”[MurtishawandSchipper2001]

American Physical Society • September 2008 ENERGY FUTURE: Think Efficiency | 29
Source: Davis and Diegel, 2006
Figure 4
Energy and transportation in the U.S.
Motorcycles 1%
Light vehicles 63%
Heavy duty road 17%
Air 9%
Water 5%Pipeline 3%
Rail 2%
U.S. transportation energy consumption by mode in 2005.
65 percent of our petroleum, and each year we pay nearly $600 billion to other nations to keep the oil coming. Transportation’s share of the oil bill is enormous – nearly $450 billion annually.
Overall, transportation represents 28 percent of U.S. fossil fuel usage and more than 30 percent of our carbon emissions.
These facts should leave little doubt the the United States’ dependence on petroleum for transportation threatens our nation’s energy and economic security, as well as the environment. The 1973 OPEC oil embargo made the economic and security risks of that dependence clear, yet in the 35 years since, the transportation sector’s thirst for oil has doubled. And so has the nation’s reliance on imported oil.
–––––––––––––––––––––––––––––
In 1973, the U.S. imported only 33 percent of its oil, but that number climbed to 65 percent because our consumption has increased as domestic oil production and reserves have steadily declined.
But increased consumption and depletion of easily accessible U.S. petroleum resources are not the only differences in today’s American oil market compared to three decades ago. In the early 1970s, much of Asia lacked economic power and placed little demand on international oil resources. Today the United States faces increasing competition for petroleum as worldwide
demand for the resource grows dramatically. Developing countries, especially India and China, are putting unprecedented demands on the world’s oil supplies as they modernize their economies and rapidly increase the size of their vehicle fleets.
We focus in this chapter on the light-vehicle sector – cars, pickup trucks, SUVs and minivans. That is where large savings can be achieved in the shortest amount of time. Figure 4 shows the distribution of energy use in the transportation sector [Davis and Diegel, 2006; EERE 2006] in the United States. Although we can make strides with existing technology to reduce our oil dependence, fully breaking our addiction to oil requires significant, and in some cases revolutionary, technological advances in the vehicles we use. Expanding the use of the relatively new hybrid technology will bring much greater efficiency to the transportation sector. Plug-in hybrids can go even further.
In this chapter we describe how America can improve efficiency in transportation and reduce our dependence on imported oil. The eventual goal is likely to be petroleum-free all-electric vehicles, running either on electricity stored in batteries or generated onboard in a hydrogen fuel cell.
But all-electric and hydrogen fue cell vehicles are proving to be more difficult to develop than
Sources: U.S. Environmental Protection Agency, National Highway Traffic Safety Administration
Figure 5
U.S. miles per gallon Fuel economy of U.S. cars and light trucks, 1975-2005.
30
25
20
15
10
1975 1985 1995 20050
U.S.
new
veh
icle
MPG
Model year
CarsBoth
Light trucks

30 | ENERGY FUTURE: Think Efficiency American Physical Society • September 2008
first thought. Indeed, it may be years before all-electric vehicles can replace the standard family car, and even longer before practical hydrogen fuel-cell vehicles may be on the market (See Endnote 1).
This report does not look at energy efficiency issues for tractor-trailers and other large trucks. Instead, we defer to a comprehensive study of trucks recently completed by the National Academy of Sciences [NAS, 2008a], Review of the 21st Century Truck Partnership. The NAS report concludes that the Department of Energy funding for the program does not match its goals or needs and that the program needs restructuring.
To appreciate the opportunities for improving fuel economy in gasoline engines, it is instructive to look at the fuel-economy trends [NPC 2007] over the past 30 years for new cars by year of sale, shown in Figure 2. In 1975, the first year of the federal government’s Corporate Average Fuel Economy (CAFE) standards mandating increased fuel economy in the U.S. light-vehicle fleet, the average fuel economy was 14 miles per gallon. Twelve years later, in 1987, the fuel economy of new light vehicles had climbed to 28 miles per gallon for cars and 22 miles per gallon for pickup trucks, minivans, and SUVs. Since then there has been no improvement. In fact, today’s fuel-economy figure for new cars is no better than what the auto industry achieved in 1983, a quarter of a century ago.3
We define fuel economy as vehicle miles per gallon of fuel, or how far you can go on a gallon of fuel. Where different fuels with different energy contents are compared (e.g., gasoline, diesel, ethanol) the energy differences are noted. In general, economy is not equivalent to efficiency. Efficiency relates to the fraction of the energy content of fuel used to move the vehicle.
Both fuel efficiency and fuel economy began to improve with the implementation of the CAFE standards program in 1975, but what is
surprising is that when the standards stopped increasing in 1985, fuel efficiency continued to improve while fuel economy leveled off. Instead of using the technology-driven increases in the fuel efficiency of gasoline internal combustion engines to continue the increases in fuel economy, the auto industry used the increases to build bigger, more powerful cars, minivans, SUVs and pickup trucks. Light-duty vehicles now account for nearly half of all U.S. oil consumption and contribute about 20 percent of all CO2 emissions. (See Endnote 2.) The entire transportation sector produced nearly 2 billion metric tons of CO2 [EIA, 2007a] in 2005, more climate-changing CO2 than was produced by every other nation on Earth except China [EIA, 2007b].
Source: Lutsey and Sperling, 2005
Figure 6
U.S. fuel economy vs. fuel efficiency
Passenger cars Pickups, minivans and SUVs
15
20
25
30
35
40
1975 1980 1985 1990 1995 2000
Model year
Fuel
eco
nom
y (m
pg)
27
30
33
36
39
42
45
Vehi
cle
effic
ienc
y
Vehi
cle
effic
ienc
y
Efficiency
Fuel economy
10
15
20
25
30
1975 1980 1985 1990 1995 2000
Model year
Fuel
eco
nom
y (m
pg)
20
25
30
35
40
45
Efficiency
Fuel economy
Fuel economy and fuel efficiency for cars and light trucks in the United States for the period 1975 to 2004. (The unit of efficiency in this figure only is ton-miles per gallon. This is the fuel efficiency mentioned in the text multiplied by the weight of the vehicle.)
3.ThisreportusesEnvironmentalProtectionAgency(EPA)“unadjusted”fuel-economyvaluesforvehiclemileagefigures.ThesearethefiguresthattheNationalHighwayTrafficSafetyAdministrationusestoratecompliancewithCAFEstandardsasrequiredbylaw.TheunadjustedfiguresarebasedonEPAlaboratoryestimates.In2007,theEPAannounceditwouldbeginreporting“adjusted”fuel-economynumbersaswell,tobetterreflectreaL-worldexperience.Theadjustednumbersareabout25percentlowerthantheunadjustedfigures.

American Physical Society • September 2008 ENERGY FUTURE: Think Efficiency | 31
As serious as we consider the impact of light-duty transportation on greenhouse gas emissions to be, we cannot overemphasize how strongly we also believe that our dependence on petroleum, especially imported petroleum, undermines our energy security and puts our nation at economic risk. It is not just extreme events, like an oil embargo, that threaten the United States – the current skyrocketing price of oil is a threat to the stability of our economy. The United States imports between 13 and 14 million barrels of oil per day at a cost of about $120 per barrel (as of August 5); this is a cost of approximately $1.6 billion dollars per day, or approximately $600 billion per year. The doubling of the use of petroleum since the 1973 oil embargo makes it clear that for the transportation sector the lessons of that crisis were not learned. And the added threat of global warming makes our addiction to petroleum a more serious problem than it was in 1973.
Finding 1: The fuel economy of conventional gasoline-powered light-duty vehicles, which include cars,
SUVs, minivans and pickup trucks, can be increased to at least 35 miles per gallon by 2020 through improvements in internal combustion engines, transmissions, aerodynamics, and other technologies. This can be done with existing technology––meaning technology that is available today or in the pipeline—with minimal changes in the performance of current vehicles and without hybrid or diesel technology.
Discussion:Light-duty vehicles consume 63 percent of transportation energy in the United States and nearly
all are powered by internal-combustion engines that use gasoline, with a small percent using diesel, ethanol or other fuel. (See Endnote 3.)
Fuel economy remained constant from 1987 to 2007 while fuel efficiency increased by more than 20 percent, as shown [Lutsey and Sperling, 2005] in Figure 6. Automakers instead increased the weight and power of vehicles [EPA, 2007] as shown in Figure 4. Had the increase in fuel efficiency instead been used to increase fuel economy, light vehicles could have increased the miles-per-gallon rating by the same 20 percent.
The 1973 oil embargo showed how vulnerable the economy was to changes in the international oil market. The embargo stimulated the passage of the Federal Energy Policy and Conservation Act in 1975, which set the CAFE standards for new light-duty-vehicle sales. The CAFE standards led to substantial efficiency gains in the automobile and light truck fleet over the next decade. The increases in fuel economy in the first years of the standards came through both increases in fuel efficiency and significant decreases in the weight of new vehicles. By 1985 fuel economy had been boosted to 27.5 miles per gallon for cars and 20.7 for light trucks. (See Figure 6.)
Many of the initial gains were related to automakers decreasing the size, weight and power of cars as well as improvements in efficiency (Figure 7). The efficiency
Source: Environmental Protection Agency, 2007
4,500 15
14
13
12
11
10
9
4,000
3,500
3,000
Figure 7
Vehicle weight and acceleration, 1975-2007
Weight (pounds) 0 to 60 mph (seconds)
0 to 60 mph
Weight
1975 1980 20051985 1990 1995 2000
Model year
Vehicle weight initially decreased to help meet the new standards, but has increased ever since.

32 | ENERGY FUTURE: Think Efficiency American Physical Society • September 2008
improvements continue to this day due to many small improvements, including such things as switching from rear-wheel to front-wheel drive (which reduced drive train losses) improving engines and transmissions and making increasing use of computer-controlled engine combustion.
But, as Figure 5 shows, two years after the CAFE fuel-economy targets were met in 1985, the average combined fuel economy for new cars and light trucks
began to decrease, largely because of the increasing fraction in the mix of light trucks and SUVs. These larger vehicles only had to meet lower CAFE standards as they rolled out of auto plants. The result is that although the fuel economy of both cars and light trucks has increased over the long term, the increased ratio of trucks to cars has caused the combined average fuel economy of the fleet to actually decrease since the mid-1980s.
The effectiveness of the 1975 fuel-economy standards was evaluated by the National Academy of Sciences [NAS, 2002] in 2002 at the request of Congress. The NAS found not only that the standards were effective, but that with existing technologies fuel economy could be improved over a 10 to 15-year period at reasonable cost by 12 to 27 percent in cars and by 25 to 42 percent in light trucks and SUVs.
In 2007, with oil prices climbing dramatically, new CAFE standards were passed by Congress and signed into law by the president. The Energy Independence and Security Act of 2007, Public Law 110-140, sec. 102, sets the new fuel-economy standard at 35 miles per gallon by 2020 and calls for “maximum feasible” increases beyond that date but does not define them.
The new standards will contribute to reducing our petroleum consumption and set a modest lower bound that can be met through incremental i m p r o v e m e n t of existing t e c h n o l o g i e s . Executives of two major automobile manufacturers have 1999 2000 2001 2002 2003 2004 2005 2006 2007 2008*
400,000
380,000
360,000
340,000320,000
300,000
380,000
360,000
240,000
220,000
200,000
180,000160,000
140,000
120,000
100,000
80,000
60,000
40,000
20,000
0
Total
Prius
Camry
HighlanderEscapeCivic
Figure 9
Hybrid auto salesin the U.S.
*2008 forecastSource: www.hybridcars.com
Source: Kromer and Heywood, 2007; Kasseris and Heywood, 2007;
Figure 8
Possible technology advances may help
Fuel
eco
nom
y (m
pg)
Potential for advanced conventional technologies to increase fuel economy by 2030.
2005 Base 2030 Advance 2030 Diesel 2030 Turbo SI 2030 Hybrid
100
90
80
70
60
50
40
30
20
10
0
Toyota Camry 2.5 LToyota Camry 3.0Ford F-150 Pickup

American Physical Society • September 2008 ENERGY FUTURE: Think Efficiency | 33
4. More specifically, an efficiency improvement is cost-effective when its marginal benefit (the benefit of the last increment of efficiency improvement) equals or exceeds its marginal cost (the cost of that increment).
5. Cars with diesel engines in Europe have somewhat better fuel economy (adjusting for the different energy content of gasoline and diesel fuel) and about the same greenhouse gas emissions as gasoline-powered cars. [Schipper 2008]
assured us that a 2.5 percent improvement in fuel efficiency per year is possible on a continuing basis. Cylinder deactivation, turbocharging, and improvements in controlling engine valves – all possible with existing technology – can increase efficiency and thereby improve fuel economy. Additionally, aerodynamics can be improved, as can tire technology to reduce rolling resistance. Still greater gains can be achieved through the introduction of emerging technology.
Finding 2:The average fuel economy of new light-duty vehicles can be increased to at least 50 miles per
gallon by 2030 through a combination of more advanced technologies, including further improvements in internal combustion engines; decreasing vehicle weight while maintaining vehicle dimensions; and a fleet with a reasonable mix of vehicles powered by efficient internal combustion engines, diesel engines and improved hybrid technology.
Discussion: We describe energy-efficiency improvements as cost-effective when the value they return
exceeds their cost.4 The value produced by energy-efficiency improvements comes from cost savings over the life of a vehicle. Typically, energy-efficient equipment comes with a higher initial cost, and determining cost, effectiveness even in its simplest form, involves discounting future benefits. Because future energy prices are uncertain, cost effectiveness inherently involves uncertainty, especially when looking at future technologies whose cost and performance are not known.
Because energy use involves external costs, such as national energy security or its impact on global climate change, determining cost effectiveness often must include difficult-to-measure societal and environmental benefits. A rigorous consideration of these issues is beyond the scope of this report.
For proven technologies, where the value of future energy savings is likely to more than compensate for initial costs, we describe the technology as cost effective. For future technologies, we intend only that the technology appears to have the potential to be cost effective, given an appropriate level of research and development.
Improving fuel economy from the CAFE standard of 35 miles per gallon by 2020 to 50 miles per gallon by 2030 is achievable if technological improvements are focused on reducing fuel consumption. The potential for advanced technologies to increase automotive fuel economy by 2030 is shown in Figure 8, based on MIT analyses.
Diesel engines currently have a fuel economy as much as 30 percent greater than gasoline engines (diesel fuel contains 11 percent more energy than gasoline per volume). In Europe, 50 percent of new cars sold have diesel engines5, primarily because of historically lower diesel-fuel prices, government tax incentives and weaker emission controls on diesel engines than on gasoline engines. Greater market penetration of diesel-powered vehicles in the United States would help reach the 2030 goal (Figure 8). However, the current cost premium of diesel fuel compared to gasoline may be a barrier, as may be concerns with U.S. particulate emission standards.
Most automobile manufacturers are doing research on a form of combustion – homogeneous charge compression ignition (HCCI) – that could combine the best of diesel and gasoline engines. An HCCI engine would have the high efficiency of a diesel engine and the relatively low emissions of a gasoline engine. Other technologies that could come into play in reaching the 2030 goal include engines with variable compression ratios, engines that switch between two and four-stroke operation and engines without camshafts.

34 | ENERGY FUTURE: Think Efficiency American Physical Society • September 2008
Weight reduction, discussed in greater detail below, is another critical part of increasing fuel economy to 50 miles per gallon. Each 10 percent reduction in vehicle weight translates to a 6 or 7 percent increase in fuel economy. The development of strong, lightweight materials, when they become available at an affordable price, could have a dramatic effect on fuel economy while improving overall vehicle safety.
Conventional hybrid vehicles, such as the Toyota Prius, are currently the most efficient widely available vehicles in the United States, with average fuel-economy ratings between 45 and 48 miles per gallon, depending on the hybrid system and the size of the vehicle. Hybrids make up more than 3 percent of the U.S. market, and sales are rapidly increasing (Figure 9) because of rising gasoline prices. According to JDPower, [www.jdpower.com] hybrid sales in the U.S. increased from 250,000 in 2006 to 350,000 in 2007.
The energy efficiency of conventional hybrids can be considerably increased through a number of near-term and long-term improvements, some of which are already in use. Engines could be run at lower revolutions per minute (rpm), and they could be turbocharged. Mechanical pumps and other systems could be replaced with electrical pumps. There are a host of other improvements based on existing technology that could make the relatively efficient hybrid vehicles even more efficient.
But if the steady growth in vehicle miles traveled (VMT) in the United States were to continue even with this doubling of today’s fuel economy, there could be very little reduction in overall petroleum use or in greenhouse gas emissions. Recently, however, VMT has decreased (Figure 10). A recent Federal Highway Administration report notes that cumulative travel for the first six months of 2008 dropped by 4.7 percent compared to June 2007, and the cumulative travel for 2008 as of June dropped by 2.8 percent.
Americans are reducing the number of miles they drive because of today’s high fuel prices. It is unclear what long-term impact higher prices will have on driving habits; an ongoing decrease in VMT would be consistent with the significant impact on driving behavior in the face of increasing gasoline
prices.6 Even larger reductions in VMT might be achieved by limiting urban sprawl through changes in the way land use is regulated and financed. Because urban sprawl encourages more driving, developing better models and criteria for transportation infrastructure and factoring vehicle use into urban planning could reduce VMT. (See finding 7 below.)
Finding 3:
The weight of vehicles can be significantly reduced through design and new materials without compromising safety. Vehicle weight reductions of 20 percent, for example, achieved by greater use of high-strength steel, aluminum and composite materials, would improve fuel economy by approximately 14 percent while reducing traffic injuries and fatalities. Greater reductions in weight, such as the 50 percent goal of the FreedomCAR program, if achieved by means of advanced lightweight materials, would lead to even greater improvements in fuel economy.7
6. There are many more aspects to consumer habits and VMT, for example, telecommuting and the impact of the Internet. These issues are not in the scope of this report.
7. The use of strong, light-weight materials in light-duty vehicles is important for improving fuel economy and will likely occur as the cost of materials comes down.
Source: Federal Highway Administration
3.0
2.9
2.8
2.7
2.6
2.5
Figure 10
Fewer miles
In trillions of miles
1998 2000 2002 2004 2006 2008
The New York Times (used with permission)
Vehicle miles traveled as reported by the Federal Highway Administration. Note the decrease in 2008.
Miles driven12-month total, monthly

American Physical Society • September 2008 ENERGY FUTURE: Think Efficiency | 35
Discussion: Reducing the weight of vehicles by using lighter, stronger materials even while maintaining
vehicle size, will significantly improve fuel economy. The new CAFE standards are likely to encourage automobile manufacturers to turn to lighter materials to squeeze more miles per gallon out of the same engines. A 10 percent reduction in weight, for example, yields a 6 or 7 percent increase in fuel economy.
A 2002 National Academy of Science study [NAS, 2002] linked the reduction in the weight of a vehicle to a possible increase in fatalities. That view was not unanimous among the NAS panelists, and many experts believe that with advanced materials, vehicles can be made both lighter and safer. This is one of the goals of the FreedomCAR program [EERE, 2005].
While it is obvious that in a head-on collision between a very large truck and a car, the passengers in the car will be the losers, that is not necessarily true when the weight differences are not so dramatic. A 2007 International Council on Clean Transportation study (ICCT, an independent organization of transportation experts) [Wenzel et al 2006] looked at the relationship of fuel economy and safety in light vehicles and noted that “the linkages among fuel economy, vehicle size, weight, and safety are manageable and are more a function of smart vehicle design than any other single factor.” The report concluded that no trade-off is required between a vehicle’s weight and safety. Indeed, other researchers have found that reducing vehicle weight while maintaining the key dimensions of wheelbase and track width could decrease the total number of fatalities [Van Auken and Zellner, 2004].
However, there is a crucial difference between making the cars lighter and making them smaller. Smaller cars may indeed be less safe for their occupants than their larger counterparts because of reduced space for “crush zones” in the front and rear; this can be mitigated by proper design. Advanced air-bag technology and smart design mean small cars are safer than they once were, but adequate crush zones are critical for passenger safety. The Insurance Institute for Highway Safety [Institute for Highway Safety 2008], after running crash tests, recently gave its highest safety rating to the diminutive Smart Car, a micro car that weighs only 1800 pounds and is a full three feet shorter and 700 pounds lighter than a Mini Cooper. So it is crush zones and other safety technologies, such as side curtain air bags, electronic stability control, lower bumpers and stronger roofs, that ultimately make vehicles safer.
Additional information can be found in Evans 2004, which emphasizes the role of drivers in
accidents, and Ahmad and Greene 2005.
Recommendation 1: Technology is available to move beyond the 35 mpg CAFE standard mandated in law to be
reached by the year 2020. The federal government should establish policies to ensure that new light-duty vehicles average 50 miles per gallon if not more by 2030. The specific policies are beyond the scope of this study but could include more aggressive and longer-horizon CAFE standards, financial incentives such as “feebates” (fees for not meeting the standard and rebates for surpassing it) and carbon taxes.
Finding 4:Plug-in hybrid electric vehicles (PHEV), which charge their batteries from the electric grid,
could reduce gasoline consumption by 60 percent or more, assuming a range on batteries alone of at least 40 miles. However, plug-in hybrids require more efficient and more durable batteries, able to withstand deep discharges that are not yet in commercial large-scale production. Given the technical difficulties faced in developing the batteries, it cannot be assumed that plug-in hybrids to replace the standard American family car will be available at affordable prices in the near term.

36 | ENERGY FUTURE: Think Efficiency American Physical Society • September 2008
Discussion: Plug-in hybrid electric
vehicles are different from the conventional hybrids in that they can travel extended distances on their batteries alone, as well as in the conventional hybrid combined mode. They charge their batteries from the electric power grid when the vehicles are not in use. Current hybrids like the Prius, because of the small battery size, are not designed to run on their battery alone except in very low-power conditions. Current hybrids’ battery packs cannot be charged from the electric grid because the integrated design of existing systems only allows the battery to be charged within a narrow range.
Ordinary hybrid electric vehicles like Toyota’s Prius get all their energy from gasoline, achieving high fuel economy
through a combination of methods. They recover some of the energy that non-hybrid vehicles waste as heat when braking; they use smaller internal-combustion engines that typically operate in their most efficient range; and they shut off the engine when the car is idling.
Plug-in hybrids get some of their energy from gasoline and some from the electric grid. PHEVs have the efficiency advantage of a conventional hybrid and the additional advantage of drawing some of their energy from the grid, not from gasoline. All-electric battery-powered vehicles, which are discussed later, get all of their energy from the grid.
Figure 11 shows the distribution of daily vehicle miles traveled, using data from the 2001 National Household Travel Survey by the U.S. Department of Transportation [Santini and Vyas 2008; Vyas and Santini, 2008]. The chart shows, for example, that 30 percent of all miles traveled are in vehicles that go less than 40 miles per day. If vehicles could run for 40 miles per charge on batteries alone, charged from the electric power grid, as much as 30 percent of vehicle miles in any one day would not require use of gasoline.
Figure 12 shows the percentage of all vehicle miles traveled on electricity as a function of PHEV electric only range. If all vehicles had a 40-mile PHEV electric range, the amount of fuel used in the entire fleet would decrease by 63 percent relative to what was required without the PHEV40 technology. If all trips of less than 40 miles were on batteries alone, and the first 40 miles of longer daily travel were on batteries, the effective fuel economy for a full fleet of PHEV40 vehicles, taking into account only gasoline put into the tank (not primary energy) would be 135 miles per gallon, assuming a 50 mpg fuel economy when operating with the gasoline engine [Vyas and Santini, 2008; Santini and Vyas, 2008; Dr. E.D. Tate, General Motors, private communication].8
8. “Effective miles per gallon” means the ratio of miles driven to gasoline put in the tank, averaged over a fleet of cars. It does not take into account the primary energy used to produce the electricity. A car with electric drive is more efficient “well-to-wheels” in terms of primary energy use than a car with an internal combustion engine. (See Endnote 3.)
Sources: Santini and Vyas 2008; Vyas and Santini 2008
100%
90%
80%
70%
60%
50%
40%
30%
20%
10%
0%
Daily travel (miles per vehicle)
% of sampled vehicle VMT
0 20 40 60 80 100 120 140 160 180 200 220 240 260 280 300
Figure 11
On the roadPercent of sampled vehicle miles traveled (VMT) as a function of daily travel.
Distribution of VMT by vehicles in the 2001 NHTS travel day file

American Physical Society • September 2008 ENERGY FUTURE: Think Efficiency | 37
Sources: Santini and Vyas 2008
100%
90%
80%
70%
60%
50%
40%
30%
20%
10%
0%
PHEV electric range (miles)
% of VMT on electricity
0 20 40 60 80 100 120 140 160 180 200 220 240 260 280 300
Figure 12
Electric-powered drivingFraction of vehicle miles traveled (VMT) driven on electricity as a function of the plug-in hybrid electric vehicle (PHEV) electric range.
VMT satisfied by PHEVall electric range
9. There are issues regarding PHEVs that tend to make the curve in Figure 12 the maximum that can be expected. These include limited market penetration, variability of choice of PHEV range by consumers, battery performance, and the driving profile of vehicles
This would amount to a 63 percent saving of gasoline per day.9 This estimate is an upper bound, as it assumes that batteries are fully charged each morning and have not deteriorated since purchase. Nonetheless, the impact on both fuel imports and on greenhouse gas emission would be dramatic, with the reduction of greenhouse gas emission depending on how green is the electric power system used to charge the PHEV batteries (the balance among coal, natural gas, nuclear, renewables and so on).
The key requirement for a PHEV is a battery with large electrical storage capacity and high energy density – the measure of how much energy a battery of a given weight and size can hold. Gasoline stores a remarkable amount of energy for its weight and volume: the energy density of gasoline is 50 times that of a lithium-ion battery when measuring volume, and 100 times that of a lithium-ion battery when measuring weight.
A conventional hybrid utilizes a relatively small battery, now typically a nickel-metal-hydride battery (NiMH), to keep costs low. Additionally, the battery is used primarily to store energy recovered from braking. A Prius, for example, has a battery with a capacity of approximately 1.3 kWh; about 15 percent of that capacity is allowed to be used, a necessary tradeoff to give the battery a long life.
A PHEV must have a considerably larger battery in order to store significant electrical energy from the grid. A PHEV running on electricity for 40 miles will consume approximately 14 kWh (industry standard of 350 Wh/mile). The battery pack should be approximately 28 kWh (twice as large) to allow for the less-than-complete discharging required for a long battery life. A PHEV battery must also have a reasonable weight, size, cost and recharging time, and, to be commercially viable, must last many years. (See Endnote 4.) The cost of a battery with 28-kWh capacity is roughly $20,000 at the present time, meaning that costs will have to come down considerably before a PHEV40 is feasible for the consumer market.
General Motors says it will produce the Chevrolet Volt, a commercial PHEV, by 2010. The Volt, according to GM, will use a new type of lithium-ion battery, have an electric range of about 40 miles in urban driving, and utilize about 50 percent of the capacity of its battery. Toyota has also announced a new PHEV to appear in 2010; it is expected to have a pair of lithium-ion batteries and an electric range of about 7 miles.
If PHEVs come into widespread use, there are implications for the electrical grid. Charging times for PHEVs are typically several hours, and if a large number of the vehicles are recharged during the day, when electricity demand is already high, the strain on the grid could be significant. If

38 | ENERGY FUTURE: Think Efficiency American Physical Society • September 2008
the vehicles are charged at night then the impact on the grid should be minimal. This topic has been discussed recently in California with the conclusion that, as long as daytime, on-peak charging is avoided, a million vehicles could be charged before a new generation of transmission investments are required [Lemoine, Kammen and Farrel 2008]. Differential pricing of electricity – cutting the cost for electricity used “off peak” – could reduce the daytime demand.
Given the current price of electricity, driving a vehicle powered by electricity would be much cheaper per mile than driving on the power from gasoline. Off-peak electricity costs in California are 9 cents per kWh corresponding to a cost of about 3 cents per mile for the electric mode in the PHEV. With gas at $4.50 per gallon, even a 50-mpg vehicle will cost 8 to 9 cents per mile for fuel. The cost per mile is one-third as much for an electric car as for today’s hybrid car.10
However, major technical and infrastructure issues must be faced before PHEVs can become a large part of the light vehicle fleet, including:
The batteries being developed for the PHEVs to be introduced in 2010 are not yet in •production, so the actual capability and cost are not known. Present battery costs are too high for a commercial market.
Access to electrical charging stations is obviously required, and many dwellings, such as •apartment buildings and condominiums, do not have them.
Daytime charging will have to be avoided if PHEVs are adopted on a large scale. Note that a •car with a 40-mile electric range will only run on electricity for a 20-mile commute one-way. Otherwise daytime charging at the workplace will be required or the return trip will be done on gasoline power.
Finding 5: An all-electric battery-powered vehicle would reduce to zero the use of petroleum as a fuel for
light-duty vehicles. However, achieving the same range as a gasoline-powered car–– 300 miles–– requires batteries with much larger capacity than is needed for PHEVs. For the standard mid-priced American family vehicle, batteries with the needed energy storage per unit weight and per unit volume do not exist. A long term R&D program will be required to develop them.
Discussion: The target range in the Department of Energy’s program for an all-electric vehicle is 300 miles,
a much more difficult challenge than that for the PHEV. If the battery technology used to make a vehicle with an electric range of 300 miles is the same technology used to make a vehicle with a 40-mile electric range, the 300-mile vehicle would require a battery of 7.5 times the weight, volume and cost of the 40-mile vehicle. (See Endnote 4.)
The all-electric vehicle is appealing because it would reduce use of gasoline to zero and reduce consumption of primary energy by roughly 50 percent since electric drive is much more efficient than internal combustion. This reduction includes the electric drive efficiency advantage combined with the average efficiency of 31 percent for electricity delivered from primary energy to the wall plug. The greenhouse gas emission reduction depends on the greening of the electric power generation system. Meeting the all-electric range goal is going to be more difficult than the range goals of PHEVs.
There have been all-electric vehicles before, and there are new ones now. The GM EV-1 and the Toyota RAV-4 were examples using NiMH battery technology. They had relatively short range, but
10. A comparison of the cost of running a car on gasoline or electricity should include a correction for taxes. The present federal tax on gasoline is $0.184/gallon; state taxes vary, but are of this magnitude. However, there are also local taxes on electricity; in many areas of the country the tax on electricity is of a similar magnitude to the combined state and federal gasoline tax.

American Physical Society • September 2008 ENERGY FUTURE: Think Efficiency | 39
11. A new National Academy of Sciences report on fuel-cell vehicles was published as this report was being completed. It primarily ad-dresses long-term infrastructure needs for a hydrogen economy assuming the basic problems have been solved. The conclusions of the report are similar to those of previous NAS studies [Transitions to Alternative Transportation Technologies: a Focus on Hydrogen. National Academies Press 2008. ISBN: 978-0-309-12100-2].
were very popular with their few users. The hardware and software developed for those cars are the starting point for the new generation. Tesla Motors’ new two-seater has a range of over 200 miles, very fast acceleration typical of electric propulsion and a price tag of about $100,000. Nissan Motors plans to introduce a small electric car with a 100-mile range, a top speed of 75 miles per hour and an 8-hour recharge time. These are a start on an evolutionary road that together with the Toyota and GM PHEV will move the fuel for light-duty vehicles from petroleum to electricity generated at central power plants.
Even though PHEVs or all-electric battery-powered vehicles will use little or no gasoline, they are not zero energy vehicles. The electricity they use is made from a primary energy source, e.g. fossil, nuclear or renewable fuels. However, the high wheel-to-tank efficiency of an electric vehicle, the existence of the grid, and the potential for freedom from fossil fuels, all favor using electricity to power cars, assuming development of suitable batteries at an acceptable price. In the future, as policies are implemented to reduce greenhouse gas emissions, grid electricity will become a cleaner and cleaner energy source [EIA 2008].
Finding 6:Hydrogen fuel cell vehicles (FCVs) are unlikely to be more than a niche product without scientific
and engineering breakthroughs in several areas. The main challenges are durability and costs of fuel cells, including their catalysts, cost-effective onboard storage of hydrogen, hydrogen production and deployment of a hydrogen-refueling infrastructure.
Discussion: Hydrogen fuels and fuel cell vehicle technology were heavily promoted by government and
industry beginning in the late 1990s. The early promises were not met. The challenge of developing a new technology (fuel cells) and deploying a new fuel supply system proved daunting. A collection of reports by the American Physical Society [Davis et al. 2003], the Basic Energy Sciences division of the DOE Office of Science [http://www.sc.doe.gov/bes/hydrogen.pdf] and the National Academy of Sciences [NAS 2005] highlighted the challenges. By 2006 it had been recognized that the original plans presented by the automotive companies and a wide range of leaders in the European Union and the United States were not achievable in the near term. A more reasoned view has now emerged, highlighting the breakthroughs that are needed and the longer time to deployment.
Hydrogen vehicles are no longer seen as a short-term or even intermediate-term solution to our oil needs, but as a long-term option requiring fundamental breakthroughs in several areas. The recent NAS report on the FreedomCar and Fuel Partnership program [NAS 2008] says that even now, “There remain many barriers to achieving the objectives of the Partnership. These barriers include cost and performance at the vehicle, system, and component levels. To be overcome, some of these barriers will require invention, and others will require new understanding of the underlying science.” A new NAS report looks at deployment scenarios after the fundamental issues are solved.11
There are four principal barriers to large-scale use of fuel-cell vehicles – the fuel cells themselves, onboard hydrogen storage, hydrogen production, and a distribution infrastructure. The fuel cells must be efficient in turning hydrogen into electricity, long lived, and affordable. (See Endnote 5.) While considerable progress has been made in the past few years, the necessary cost-effective performance has not yet been achieved. The membranes that are at the heart of fuel cells do not have the durability, permeability, or conductivity to work efficiently in a mass-market vehicle. In addition, a relatively large amount (roughly 60 grams) of the platinum catalyst is presently required to make the chemical reaction run at the necessary rate. This much platinum is too expensive and the material too rare for a mass-market vehicle. Progress in both the membrane and catalyst area is being made. For example, it

40 | ENERGY FUTURE: Think Efficiency American Physical Society • September 2008
has recently been shown that control of the atomic structure of the catalyst can, in principle, improve its performance by a factor of 10 or more.
Onboard hydrogen storage remains a significant barrier to development and commercialization of a hydrogen vehicle. Hydrogen has high energy content per molecule, but is a gas at room temperature. Compressed hydrogen systems, the kind typically used on hydrogen demonstration cars, use ultrahigh-pressure containers that are heavy, large and typically contain only one-seventh the energy per unit volume of gasoline. Liquid hydrogen has to be stored at lower than -400 ºF in special highly insulated containers and 30-40 percent of its energy is lost in the liquefaction-evaporation cycle. An alternative to compressed gas or liquid is highly desirable.
A practical, commercial hydrogen vehicle will most likely have some form of solid-state storage, near atmospheric pressure. In solid-state storage, hydrogen molecules are absorbed onto or chemically bound up in the storage medium. Storage has seen promising new approaches – computer prediction of structure and performance of storage media, and the release of hydrogen from high density storage media by reaction to structurally different compounds, a process called “destabilization.” The latest NAS FreedomCar review notes that finding a solid-state storage material is critical to fulfillment of the vision for the hydrogen economy, and urges that basic and applied research be conducted to establish the necessary technical base. The scientific community has responded to the hydrogen challenge with vigor – the publication rate and activity at meetings on catalysts and membranes for fuel cell reactions and on hydrogen storage media have increased significantly.
Hydrogen production is as important as storage and fuel cells. The United States now produces 90 percent of its hydrogen by reforming natural gas, a process that combines gas and water at high temperature to produce hydrogen and carbon dioxide. If this were to be the source of hydrogen, widespread use of hydrogen cars would simply shift our dependence on oil to a dependence on imported natural gas with only modest greenhouse gas reduction.
Producing the required hydrogen from coal would be acceptable if carbon capture and storage technology that would eliminate the CO2 produced in the process were to be commercially successful. More attractive are innovative methods to produce hydrogen with carbon-free sources of energy. These include high-temperature electrolysis in which heat and electricity are both available from solar or nuclear energy, and photo-biological processes that produce hydrogen directly from sunlight. None of these more advanced processes are yet ready for commercialization, but progress is being made.
The last of the four barriers is the hydrogen distribution system. If done by pipeline like natural gas, a new system will be required. It would be far too expensive to transport hydrogen by truck or rail either as a gas or a liquid because of its low energy density. Perhaps one of the solid-state storage solutions will allow the transportation of large amounts of the material.
While large-scale commercialization will not occur any time soon, automakers are planning to produce demonstration fleets. The Honda FCV Clarity will be available in limited numbers (200) over the next 3 years for lease to customers near hydrogen stations in the Los Angeles area. This vehicle uses a fuel cell in a hybrid-electric vehicle, with hydrogen stored as a pressurized gas at 5,000 pounds per square inch, giving it a range of 270 miles. Each vehicle costs several hundred thousand dollars to produce and will receive special servicing from Honda. This demonstration vehicle is a fully functional substitute for gasoline cars, but the cost remains far too high and the life of the fuel cell too short for widespread use in the vehicle fleet now. Honda intends to have 1000 FCVs on the road by 2013; the target for the start of high-volume production is 2015.
GM announced it will release a hydrogen fuel-cell vehicle by the end of 2008 and plans to have a

American Physical Society • September 2008 ENERGY FUTURE: Think Efficiency | 41
fleet of 100 Chevrolet Equinox fuel cell SUVs on the road by the end of the year. Toyota and Daimler have similar plans to release hydrogen fuel-cell vehicles in demonstration programs.12
Recommendation 2: The federal government’s current R&D program should have a broader focus. A more balanced
portfolio is needed across the full range of potential medium- and long-range advances in automotive technologies. Increased research is needed in batteries for conventional hybrids, plug-in hybrids and battery electric vehicles, and in various types of fuel cells. This more balanced portfolio is likely to bring significant benefits sooner than the current program through the development of a more diverse range of efficient modes of transportation, and will aid federal agencies in setting successive standards for reduced emissions per mile for vehicles.
Recommendation 3: “Time of use” electric power metering is needed to make charging of batteries at night the preferred
mode. Improvements in the electric grid must be made if daytime charging of electric vehicles is to occur on a large scale or when the market penetration of electric vehicles becomes significant.
Finding 7:There are clearly societal issues that effect fuel use in the transportation sector. Reforms in public
policy for land use and urban and transportation infrastructure planning can potentially contribute to energy efficiency by reducing vehicle miles traveled, as can expansions of public transit and various pricing policies. Some could be introduced in the near term, while others, such as changes in land use, would phase in over decades, but might still have significant effects in 10-15 years.
Discussion: It is clear from more than 20 years of research that changes in current policies for urban land use,
transportation infrastructure investment, parking and auto insurance can reduce vehicle miles traveled (VMT) and save energy. These are mainly social science issues. Current policies have resulted in growth rates for urban land that exceed the growth rates of population. There has been a similar disproportionate increase in vehicle miles traveled (VMT) since 1973 that cannot be explained by increasing incomes, the cost of driving or the building of more roads – highway congestion has increased since 1973 [Eaken and Goldstein, 2007; Boarnet and Crane, 2001; Ewing et al., 2007; Handy et al., 2006; Johnston, 2008; Handy, et al., 2005].
Residential density, the availability of public transportation, proximity to jobs, pedestrian friendliness and the mixed-use nature of a community all influence the number of miles people drive. The general conclusions of research on the role of urban planning on vehicle use indicate that to high densities, proximity to reliable public transit, and inclusion of sidewalks and bike lanes correlate with lower household VMT.
An effort to maximize energy efficiency in the transportation sector would require a combination of short-term pricing policies and medium- and longer-term land use and infrastructure investment policies.
A significant obstacle to informing policymakers and the public about these policy options is the lack of an agreed-upon method for quantifying these issues. Different studies frame the questions in different ways, and different sources provide different predictions that are qualitatively in agreement but yield slightly different—or mutually incomparable—predictions.
12. BMW has recently introduced a car, the Hydrogen 7, which stores hydrogen as a liquid and uses hydrogen as a fuel in an internal com-bustion engine. Gasoline is also carried onboard. As noted, the energy cost of producing liquid hydrogen is high. U. Bossel, B. Eliasson and G. Taylor, The Future of the Hydrogen Economy: Bright or Bleak? Final Report. April 2003. [www.hyweb.de/News/Bossel-Eliasson_2003_Hydrogen-Economy.pdf]

42 | ENERGY FUTURE: Think Efficiency American Physical Society • September 2008
Recommendation 4: Federally funded social-science research is needed to determine how land-use and transportation
infrastructure can reduce vehicle miles traveled. Studies of consumer behavior as it relates to transportation should be conducted, as should policy and market-force studies on how to reduce VMT. Estimation of the long-term effects of transportation infrastructure on transportation demand should become a required component of the transportation planning process. This program needs a home.

American Physical Society • September 2008 ENERGY FUTURE: Think Efficiency | 43
1. Energy and energy densityThe density at which energy can be stored is
critical for transportation applications. The weight and volume of fuel to provide a given amount of energy to power a vehicle are shown in Table 1.
2. Reducing greenhouse gas emissionsGreenhouse gas emissions from different
transportation sectors [Greene and Schafer, 2003] are shown in Figure 13. Passenger cars and light trucks are responsible for 55 percent of greenhouse-gas emission in transportation, and heavy trucks are responsible for another 16 percent.
Improvement in fuel economy for constant vehicle miles traveled will directly translate into a reduction of greenhouse gas emissions without introduction of new technology. A transition to plug-in hybrid vehicles and battery-powered all-electric vehicles in the passenger-car and light-truck fleet has significant implications for production of greenhouse gases. As these vehicles will rely on electricity from the grid, the extent to which the grid is green—generating electricity from nuclear or other “clean” energy sources—will determine the carbon footprint of the vehicles. It may be possible that carbon emission could become negligible. The same consideration applies to widespread use of hydrogen fuel cells: there will be a benefit if the hydrogen can be produced without adding equivalent amounts of carbon to the atmosphere. One recent report estimates that in the absence of carbon-constraining policies, the transition to a hydrogen economy would achieve about the same reduction in emission of carbon dioxide as a transition to advanced gasoline-electric hybrid vehicles. Drastic reduction of well-to-wheel CO2 emission is possible with a significant carbon policy [Greene et al., 2007].
Figure 14, from a recent MIT study [Kromer and Heywood, 2007], shows well-to-wheel greenhouse-gas emissions for a variety of advanced vehicles; advanced hybrid-electric vehicles, plug-in hybrid vehicles, fuel-cell vehicles and battery-electric vehicles all have the potential to reduce CO2 emissions from motor vehicles by two-thirds. However, Greene [2008] notes that these calculations assume that electricity and hydrogen will be produced in the
Table 1
Energy density per volumeGasoline 34.6 MJ/l = 9.7 kWh/l
Diesel fuel 38.6 MJ/l = 10.7 kWh/l
Ethanol 24 MJ/l = 6.4 kWh/l
Hydrogen at 1 atmosphere pressure 0.009 MJ/l = 0.0025 kWh/l
Hydrogen at 10,000 psi 4.7 MJ/l = 1.3 kWh/l
Liquid hydrogen 10.1 MJ/l = 2.6 kWh/l
NiMH battery 0.3-1.0 MJ/l = 0.1-0.3 kWh/l
Lithium-ion battery (present time) 0.7 MJ/l = 0.2-kWh/l
Energy density per weight13
(1 MJ = 0.278 kWh)
Gasoline 47.5 MJ/kg = 13.2 kWh/kg
Diesel fuel 45.8 MJ/kg = 12.7 kWh/kg
Ethanol 30 MJ/kg = 7.9 kWh/kg
Hydrogen at 10,000 psi 143 MJ/kG = 39 kWh/kg
Liquid hydrogen 143 MJ/kG = 39 kWh/kg
NiMH battery 0.34 MJ/kg = 0.1 kWh/kg
Lithium-ion battery (present time) 0.5 MJ/kg = 0.14 kWh/kg
Lithium-ion battery (future) 1 MJ/kg = 0.28 kWh/kg
13. Energy density by weight shown is the co-called higher heating value. The so-called lower heating value takes into account the energy required for a phase change. The difference depends on the chemical composition of the fuel, and is about 10 percent for gasoline and 7% for diesel fuel.
C h a p t e r 2 E n d n o t e s
Source: U.S. Environmental Protection Agency
Figure 13
Emissions of greenhouse gases in transportation by sector
Passengercars 36%
Heavy trucks 16%
Aircraft10%
Marine5%
Rail2%
Buses1%
Other11%
Light trucks19%
Figures are from year 2000.

44 | ENERGY FUTURE: Think Efficiency American Physical Society • September 2008
future by the same methods that are presently employed. Use of nuclear or renewable sources and/or carbon sequestration could reduce future emission of CO2 to very low levels.
3. Transportation efficiencyAn internal-combustion engine (ICE) is used to power most cars on the road today. Chemical
energy stored in gasoline is converted to mechanical motion by combustion in the engine, which turns a drive shaft that then turns the wheels. This process is not very efficient: Figure 15 [U.S. EPA] illustrates the flow of energy from gasoline (100%) to mechanical energy out (18.2%) to 12.6 percent finally powering the wheels.
The 12.6 percent efficiency of converting gasoline energy into mechanical energy is called the “tank-to-wheel” efficiency. The “well-to-tank” efficiency of gasoline is approximately 90 percent, with the additional 10 percent being the energy cost of producing and distributing gasoline. The “well-to-wheel” efficiency in the case of an ICE is therefore approximately 16 percent to the drive train, and only 11 percent to the wheels.
0
50
100
150
200
250
300
2006Base
2030NA SI
2030Turbo SI
2030Diesel
2030HEV
2030PHEV10
2030PHEV30
gCO
2 /
km
2030PHEV60
2030H2 FCV
2030BEV
Source: Kromer and Heywood, 2007: Assumes H2 from natural gas and electricity in EIA 2030 mix
NormallyAspirated
Figure 14
Projected well-to-wheels greenhouse gas emissions of advanced vehicle technologies
Tank-to-wheels
Well-to-tank
Spark Ignition Plug-InHybrid Electric
Vehicle
Plug-InHybrid Electric
Vehicle
Plug-InHybrid Electric
Vehicle
Fuel CellVehicle
BatteryElectric Vehicle
Hybrid ElectricVehicle
Figure 15
Where does the energy go?
How energy flows for a vehicle powered by an internal-combustion engine. The diagram shows the energy uses and losses from a typical vehicle.
Source: www.fueleconomy.gov
Aerodynamic drag
Engine losses
Rolling resistance
Inertia
Braking5.8%
Standby / idling
Drive line losses
Accessories 4.2%
2.6%
100% 18.2% 12.6%
62.4%
5.6%
2.2%
17.2%

American Physical Society • September 2008 ENERGY FUTURE: Think Efficiency | 45
An electric motor-inverter is about 90 percent efficient in converting electric energy into mechanical motion, and charging a battery is about 90 percent efficient. The tank-to-wheel efficiency is therefore about 81 percent. For a well-to-tank efficiency of production and distribution of 30 percent for electricity, the well-to-wheel efficiency is about 24 percent.14
Additional energy savings of up to 30 percent is possible by capturing energy from braking and by shutting off the engine when the car is idling. The result is a saving in primary energy for an electric car of more than a factor of two compared with a car powered by gasoline and an internal combustion engine.
4. Batteries for plug-in hybrid and all-electric vehiclesBatteries for plug-in hybrid and battery-electric vehicles must have high charge storage capacity;
be of a reasonable size, weight and cost; be able to be deeply discharged; have a long service life; and operate with a high degree of safety. Existing batteries do not meet those requirements.
According to a leading expert in the auto battery community [Anderman, private communication, 2007], the estimated cost of a battery that could meet the requirements is $625/kWh, assuming a modest production level, which puts the cost of the battery for a 55-kWh all-electric vehicle at about $35,000. A 28-kWh battery, needed to give a plug-in hybrid vehicle a range of 40 miles and allowing for discharge cycles and lifetime, would cost nearly $18,000. For a production level of a million units per year, the cost is expected to decrease by a factor of two, which will still make it expensive for the consumer market.
Although some companies are getting into the market, no widespread industrial capability currently exists for volume production of lithium-ion batteries for automotive applications; that is expected to soon change. At present a battery for consumer electronics applications has a lifetime of only 2–3 years, while batteries for automotive applications will have to have considerably longer lifetimes.
The energy density of present batteries is about one-hundredth that of gasoline, which means it is a major challenge to store enough energy in a battery that is small, light and powerful enough to give an electric vehicle acceptable range. To make a plug-in hybrid or an all-electric battery-powered vehicle practical, it will be necessary to significantly increase the battery’s energy density, reduce the vehicle’s energy consumption per mile and design a vehicle that can accommodate a large battery and presumably a little cargo.
Lithium-ion batteries are being developed for use in hybrid vehicles and in plug-in hybrid vehicles. Figure 16 [Srinivasan, private communication, 2007] shows the specific energy versus specific power, along with DOE goals, and Figure 17 shows a comparison with DOE goals for all the relevant battery parameters. (Note that calendar life and cycle life are not shown, as they are as yet undetermined.) Present batteries show promise, but energy-storage issues must still be overcome for them to be practical for an American family vehicle. However, Toyota and Chevrolet, among other vehicle manufacturers, will soon place plug-in hybrid vehicles on the market, likely as demonstration vehicles if they have a large electric range––say 40 miles––and possibly for sale if they have a short electric range––say up to 10 miles.
5. Catalysts for fuel cellsPlatinum or other platinum-group metals (PGM) are required as a catalyst for present-day fuel
cells for automotive use, and these metals are both rare and expensive. The current price for platinum as of May 2008 is $2,200 per once, or about $73 per gram. Prices for these metals have been rising rapidly in the past few years, and this rise is likely to continue.
14. A more complete comparison of ICE and electric cars should take into account that electric cars will have accessories which will use a few percent of the energy, just like ICE cars. Small changes in calculated efficiencies are of the order of the improvement in fuel economy by proper tire inflation.

46 | ENERGY FUTURE: Think Efficiency American Physical Society • September 2008
The major use of platinum and PGM in the transportation sector today is in catalytic converters, required for emission control in automobiles. An automobile catalytic converter contains approximately 1.5 grams of PGM, and the total consumption of platinum for catalytic converters in the United States is approximately 25,000 kilograms out of a total of 40,000 kilograms of platinum used for all U.S. purposes. Worldwide platinum production was less than 200,000 kilograms in 2002. Most of the world’s platinum comes from South Africa (80%) and Russia (20%); there is very limited production in the United States.
With current technology, hydrogen fuel cells for automotive use would also require platinum and PGM. Present designs require approximately 0.8 grams of platinum per kW, and a typical, present-day automotive fuel cell is roughly 75 kW, meaning that it requires approximately 60 grams of platinum, costing $4,400 at today’s price.
The need for platinum introduces at least three obstacles to widespread use of fuel cells for transportation: cost, the total quantity of platinum available in the world, and vulnerability to supply disruption. Research in these areas is needed.
The solution is to find methods of making fuel cells that require very little or no platinum. This is a topic of considerable research today, because reducing or eliminating the need for platinum would simultaneously surmount all three obstacles.
If the amount of platinum now required for a fuel cell could be reduced by a factor of 50, a fuel cell would contain about the same amount of the metal as a catalytic converter. One promising new approach is to alter the electronic structure of the subsurface layers of platinum by substituting a a different material, leaving a pure platinum surface [Stamenkovic et al., 2007] Stamenkovic’s work achieved a factor-of-10 improvement in catalytic activity for the oxygen-reduction reaction in fuel cells by adjusting the near-surface composition of platinum single crystals. Single crystals could not be used in fuel cells, so this is a proof of concept rather than a technological advance.
The path to improving catalysts to make PEM (Polymer Electrolyte Membrane) fuel cells practical involves a combination of basic and applied research. Achieving large decreases in platinum use requires qualitative changes in the way platinum catalysts are prepared and implemented in fuel cells. Obtaining a factor-of-10 reduction requires a thorough understanding of what the catalytically active site is, and control of the internal structure and external morphology of the platinum catalyst using nanoscale fabrication.
1
10
4
100
2
1,000
Spec
ific
ener
gy (W
h/kg
)Ra
nge
Average/peak specific power (W/kg)
-
Fuel Cells
Internal combustion engine
Acceleration
Lead-acid battery
Lithium-ion battery
Nickel metal hydride battery
CapacitorsHybrid-electric goal
3.6 seconds36 seconds6 minutes 1 hour
PHEV-40
PHEV-20
Source: Venkat Srinivasan
Figure 16
Battery performanceThis graphic compares the energy in watt hours per kilogram of vehicle power sources. The chart indicates their range, power and acceleration.
Electric vehicle goal

American Physical Society • September 2008 ENERGY FUTURE: Think Efficiency | 47
These breakthroughs are well beyond the reach of incremental advances in the present state of the art. To make them happen, there needs to be significant investment in basic research using creative approaches and tools of nanoscience, followed by a concerted engineering effort to apply this knowledge to practical fuel-cell technology. This has to be done by government, as it is too risky for industry.
0
10
20
30
40
50
60
70
80
90
100
Specificpower
Power density
Specific available energy
Availableenergydensity
Cycle life
Calendar life
Production price
Operatingtemperature
range
Perc
ent o
f goa
l ach
ieve
d
Battery characteristic
Source: Environmental Protection Agency (Adapted from a figure provided by Srinivasan, 2007)
Figure 17
Battery capabilitiesBattery capabilities with PHEV comparisons of 40-mile electric range goals.

48 | ENERGY FUTURE: Think Efficiency American Physical Society • September 2008
S. Ahmad and D. L. Greene, “Effect of Fuel Economy on Automobile Safety,” Transportation •Research Record: Journal of the Transportation Research Board 1941, 1-7 (2005).
M. Anderman, private communication (2007).•
L. Bailey and P. Mokhtarian, A. Little, “The Broader Connection Between Public Transportation, •Energy Conservation and Greenhouse Gas Reduction”, ICF International, Fairfax, VA (2008).
M. G. Boarnet and R. Crane, “Travel by Design: The Influence of Urban Form on Travel,” •Oxford University Press, New York (2001).
J. Bordoff, and P. Noel,“Pay As You Drive Insurance: A Simple Way to Reduce Driving-Related •Harms and Increase Equity,” Brookings Institution, Washington, DC (2008).
R. Cervero and C. Radisch, “Travel Choices in Pedestrian Versus Automobile Oriented •Neighborhoods,” University of California Transportation Center, Berkeley (1995).
L. Cheah, C. Evans, A. Bandivadekar and J. Heywood, “Factor of Two: Halving the Fuel •Consumption of New U.S. Automobiles by 2035,” pub. no. LFEE 2007-04 RP, MIT, Cambridge, MA (2007).
C. Davis, B. Edelstein, B. Evenson, A. Brecher and D. Cox, • Hydrogen Fuel-Cell-Vehicle Study, report prepared for the Panel on Public Affairs, American Physical Society, New York (2003).
S. C. Davis and S.W. Diegel, • Transportation Energy Data Book, edition 26, ORNL-6978, Oak Ridge National Laboratory, Oak Ridge, Tennessee, http://cta.ornl.gov/data/index.shtml.
A. M. Eaken and D. B. Goldstein; “Quantifying the Third Leg: The Potential for Smart Growth •to Reduce Greenhouse Gas Emissions,” in Proceedings of the 2008 ACEEE Summer Study on Energy Efficiency in Building, in press.
EERE 2005: U.S. Department of Energy, • Energy Efficiency and Renewable Energy, FreedomCAR and Fuel Technical Partnership Technical Goals, (2005), http://www1.eere.energy.gov/vehiclesandfuels/about/partnerships/freedomcar/fc_goals.html.
EIA 2007a: Energy Information Administration, “Executive Summary—Carbon,” in • Emissions of Greenhouse Gases in the United States, 2005,. http://www.eia.doe.gov/oiaf/1605/ggrpt/summary/carbon.html.
EIA 2007b http://www.eia.doe.gov/environment.html.•
Energy Information Administration, Energy Market and Economic Impacts of S. 2192, the • Lieberman-Warner Climate Security Act of 2007, SR/OIAF/2008-01, U.S. Department of Energy, Washington, D.C., April 2008.
Environmental Protection Agency, • Light-Duty Automotive Technology and Fuel-Economy Trends: 1975 through 2007, http://www.epa.gov/otaq/fetrends.htm#2, (2007).
Environmental Protection Agency (EPA), U.S. Department of Energy, Washington, DC, • http://www.fueleconomy.gov/FEG/atv.shtml
C h a p t e r 2 R e f e r e n c e s

American Physical Society • September 2008 ENERGY FUTURE: Think Efficiency | 49
R. Ewing and R. Cervero, “Travel and the Built Environment: A Synthesis,” • Transportation Research Record 1780: 87-114 (2001); T. Litman, Land Use Impacts on Transport, Victoria Transport Policy Institute, Victoria, BC (2005); Center for Clean Air Policy, CCAP Transportation Emissions Guidebook, Part 1: Land Use, Transit, and Travel Demand Management, Washington, DC (2005).
R. Ewing, K. Bartholomew, S. Winkelman, J. Walters and D. Chen, • Growing Cooler: The Evidence on Urban Development and Climate Change, Urban Land Institute, Chicago (2007).
Federal Highway Administration, Traffic Volume Trend, FHWA, Washington, DC (2008), • http://www.fhwa.dot.gov/ohim/tvtw/tvtpage.htm
D. B. Goldstein, J. Holtzclaw and T. Litman, “Overcoming Barriers to Smart Growth: Surprisingly •Large Role of Better Transportation Modeling,” in Proceedings of the 2006 Summer Study on Energy Efficiency in Buildings, American Council for an Energy Efficient Economy, Washington, DC, August 2006.
D. Gordon, D. L. Greene, M. H. Ross and T. P. Wenzel, • Increasing Vehicle Fuel Economy without Sacrificing Safety, International Council on Clean Transportation, Washington, DC (2006).
D. L. Greene and A. Schafer, • Reducing Greenhouse Gas Emission from U. S. Transportation, Pew Center, on Global Climate Change, 2003.
D. L. Greene, P. N. Leiby and D. Bowman, “Integrated Analysis of Market Transformation scenarios •with HyTrans”, ORNL/TM-2007/094, 2007.
D. L. Greene, private communications (2008).•
S. L. Handy, L. Weston and P. L. Mokhtarian “Driving by Choice or Necessity?” • Transportation Research Part A 39 (3), 183 – 203 (2005).
S. Handy, X. Cao and P. L. Mokhtarian, “Self-Selection in the Relationship between the Built •Environment and Walking,” Journal of the American Planning Association 72 (1), 55-74 (2006).
J. Holtzclaw, • Explaining Urban Density and Transit Impacts on Auto Use, Natural Resources Defense Council and Sierra Club, submission to State of California Energy Resources Conservation and Development Commission, 2001; see also J. Holtzclaw, R. Clear, H. Dittmar, D. Goldstein, and P. Haas. “Location Efficiency: Neighborhood and Socio-Economic Characteristics Determine Auto Ownership and Use – Studies in Chicago, Los Angeles and San Francisco,” Transportation Planning and Technology Journal 25 (1) (March 2002).
Insurance Institute for Highway Safety, press release May 14, 2008, http://www.iihs.org/news/rss/•pr051408.html.
R. A. Johnston, • Review of U.S. and European Regional Modeling Studies of Policies Intended to Reduce Transportation Greenhouse Gas Emissions, Institute of Transportation Studies, University of California, Davis, research report UCD-ITS-RR-08-12.
E. P. Kasseris and J. B. Heywood, • Comparative Analysis of Powertrain Choices for the Near to Mid-term Future, master’s thesis, MIT, Cambridge, MA (2006).

50 | ENERGY FUTURE: Think Efficiency American Physical Society • September 2008
M. A Kromer and J. B. Heywood, “Electric Powertrains: Opportunities and Challenges in the U.S. •Light-duty Fleet,” LFEE 2007-03 RP, MIT, Cambridge, MA (May 2007).
D. M. Lemoine, D. M. Kammen and A. E. Farrell, “An Innovative and Policy Agenda for •Commercially Competitive Plug-in Hybrid Electric Vehicles,” Environ. Res. Lett. 3, 014003 (2008).
N. Lutsey and D. Sperling, “Energy Efficiency, Fuel Economy, and Policy Implications,” •Transportation Research Record 1941, 8 (2005).
A. D. May and D. S. Milne, “Effects of Alternative Road Pricing Systems on Network Performance,” •Transportation Research A, 34 ( 6) pp. 407-436 (2000).
S. Murtishaw and L. Schipper, “Disaggregated Analysis of US Energy Consumption in the 1990s: •Evidence of the Effects of the Internet and Rapid Economic Growth,” Energy Policy 29, 1335 (2001).
NAS 2002: National Academy of Sciences, • Effectiveness and Impact of Corporate Average Fuel Economy (CAFE) Standards, NAS, Washington, DC (2002).
NAS 2005: National Academy of Sciences, • Review of the Research Program of the FreedomCAR and Fuel Partnership: First Report, NAS, Washington, DC (2005), http://books.nap.edu/openbook.php?isbn=0309097304
NAS 2008a: National Academy of Sciences, • Review of the 21st Century Truck Partnership, NAS, Washington, DC (2008), http://books.nap.edu/openbook.php?record_id=12258&page=R1
NAS 2008b: National Academy of Sciences, • Review of the Research Program of the FreedomCAR and Fuel Partnership: Second Report, NAS, Washington, DC (2008).
National Petroleum Council 2007, • Hard Truths; citing U.S. EPA/NHTSA, Light-Duty Automotive Technology and Fuel Economy Trends: 1975-2006.
C. Rodier, • A Review of the International Modeling Literature: Transit, Land Use, and Auto Pricing Strategies to Reduce Vehicle Miles Traveled and Greenhouse Gas Emissions, Transportation Sustainability Research Center, University of California, Berkeley (2008).
D. Santini and A. Vyas, “How to Use Life-cycle Analysis Comparisons of PHEVs to Competing •Powertrains,” presented at 8th International Advanced Automotive Battery and Ultracapacitor Conference May 12-16, 2008, Tampa, Florida; D. Santini and A. Vyas, “More Complications in Estimation of Oil Savings via Electrification of Light-duty Vehicles,” presented at PLUG-IN 2008 Conference in San Jose, CA, July 2008.
L. Schipper, 2008, http://embarq.wri.org/en/Article.131.aspx.•
D. Shoup, • The High Cost of Free Parking, American Planning Association Press, Chicago (2004).
Smart Growth America and National Association of Realtors, 2004• National Community Preference Survey, 2004
V. Srinivasan, private communication (2007).•

American Physical Society • September 2008 ENERGY FUTURE: Think Efficiency | 51
V. R. Stamenkovic• et al., Science 315, 493 (2007).
R. M. Van Auken and J. W. Zelner, “An Assessment of the Effects of Vehicle Weight and Size on •Fatality Risk in 1985 to 1998 Model Year Passenger Cars and 1985 to 1997 Model Year Light Trucks and Vans,” SAE Transactions 114 (6) 1354 (2004).
A. Vyas and D. Santini, “Use of National Surveys for Estimating ‘Full’ PHEV Potential for Oil-•use Reduction,” presented at PLUG-IN 2008 Conference in San Jose, CA, July 2008.
A. Vyas, D. Santini, M. Duoba M. Alexander, “Plug-in Hybrid Electric Vehicles: How Does •One Determine Their Potential for Reducing U.S. Oil Dependence?” presented at the EVS-23 symposium, Anaheim, CA, December 2007.

52 | ENERGY FUTURE: Think Efficiency American Physical Society • September 2008
B u i l d i n g s
1. In this report energy used by buildings includes energy used by building contents—appliances, vending machines, com-puters, etc., the so-called “plug loads.” It also includes external loads, such as parking lot lights and swimming pools, that use energy on building properties.
2. Sunlight, oil, natural gas, nuclear, coal, etc. are primary forms of energy–forms that are available on earth to be collected and used. Electricity is a secondary form of energy—a convenient energy carrier that must be produced from primary en-ergy.
3. All CO2 emissions are reported in metric tons (1000 kg). 1 Mt = 1 megaton = 1 million metric tons; 1Gt = 1 gigaton = 1 billion metric tons.
Commercial and residential buildings consume only one-ninth as much petroleum as the transportation sector, but they still account for almost two-fifths of our nation’s primary energy usage and more than one-third of our nation’s carbon emissions. The technological potential for reducing energy consumption and carbon emissions in the buildings sector is considerable. However, as this chapter demonstrates, significant progress likely will occur only if public policies are adopted that address imperfections in the marketplace. This is true even though the measures we suggest will result in net savings for consumers.
This chapter identifies technologies and policies that can increase the efficiency of energy use in commercial and residential buildings. There are substantial opportunities for achieving gains across the entire sector, including structures, systems and appliances. In the case of commercial buildings, a concept called integrated design provides extremely fertile ground for research, development and demonstration projects.
Introduction
Americans spend 90 percent of their time indoors, working, living, shopping and entertaining in buildings that consume enormous amounts of energy.1 In 2006, buildings — more than 118 million residential and commercial structures —
were responsible for 39 percent of the nation’s primary energy consumption, a level of energy use that has a significant impact on global climate change and potentially on U.S. energy security.2
Since most of their energy comes directly or indirectly from fossil fuels, buildings are responsible for large quantities of greenhouse gas (GHG) emissions — about 36 percent of the of CO2 associated with the nation’s total annual energy consumption.3 Building energy consumption and the resulting GHG emissions, which have been steadily rising, are projected by the Energy Information Administration (EIA) to increase another 30 percent by 2030.
Yet a large fraction of the energy delivered to buildings is wasted because of inefficient building technologies. How much of this energy can ultimately be saved is an open question — as much as 70 percent by the year 2030 in new buildings and perhaps more
CH
AP
TE
R 3
CH
AP
TE
R 3

American Physical Society • September 2008 ENERGY FUTURE: Think Efficiency | 53
than 90 percent in the long term if there were pressing reasons to go that far. These energy savings can be made not by reducing the standard of living, but by utilizing more efficient technologies to provide the same, or higher, levels of comfort and convenience we have come to enjoy and appreciate. Some of these technologies are available today; others are beyond our present grasp, but achievable in the future with strong investment in research and development (R&D). Today significant energy can be saved by making cost-effective efficiency improvements in buildings and their equipment—which will reduce our nation’s energy consumption and GHG emissions and provide significant economic savings to consumers.
Buildings consume 72 percent of the nation’s electricity, more than 50 percent of which is generated from coal, our nation’s most abundant energy resource but one with CO2 emissions greater than other fossil fuels, according to the EIA. The advantage of electricity is that it is a form of energy that can be fully converted to work and is easy to distribute over the electric grid. Its disadvantage is that it is generated and distributed with 31 percent efficiency—which means 69 percent of the primary energy used to generate electricity is lost as waste heat before reaching the end user.
Building structures pose a more difficult problem than either the equipment they contain or automobiles due to their long lifetimes and slow replacement rates. Whereas vehicles and appliances wear out after a decade or so, buildings typically last for the better part of a century. Most buildings were constructed during the years when energy was cheap, and as a result, they were not designed or built with energy efficiency in mind. The overall number of buildings in the United States is growing by only 1 to 2 percent per year. Hence a major reduction in building energy consumption must involve both improvements in existing buildings and new construction.
Fortunately, widespread use of existing energy efficiency technologies and those that can be developed over the near term would eliminate a sizable portion of the current waste of energy, significantly reducing building energy consumption and greenhouse gas emissions. For the foreseeable future, reducing primary energy consumption through improved efficiency is likely to remain far cheaper than expanding renewable energy production [Glicksman, 2008]. (For a detailed definition of energy efficiency. (See Endnote 1.)
Residential BuildingsIn 2005, residential buildings in the United States consisted of 113 million residences totaling an
estimated 180 billion gross square feet, including standalone houses and mobile homes, as well as dwellings located in apartment buildings and other multiresidence units [2007 Building Energy Data Book, p. 2-1].
Figure 18
Residential energy end usageIn 2006 the residential sector consumed 21.8 quads4 of primary energy. This chart shows the relative amounts going to various residential end uses.5
Electronics Cooking Computers
20 40 60 80 100
OtherLighting Refrigeration Wet cleaningWater heatingSpace coolingSpace heating 6
32% 13% 13% 12% 8% 8% 5% 5% 3%
1%
Source: Energy Data Book (2007); EERE, U.S. Department of Energy
4. 1 Btu = British thermal unit, the amount of heat it takes to raise the temperature of 1 pound of water by 1 degree Fahrenheit. 1 quad = 1 quadrillion Btu = 1015 Btu. 1 Btu is also equal to 1054 joules, 1 joule being the metric unit of energy.
5. Numbers differ slightly from those in the DOE Building Energy Databook as the 4.7% adjustment has been eliminated and distributed proportionally to all other categories.
6. Energy for “space heating” is the energy used to heat a building. Energy used to heat domestic hot water is included in the category “wet cleaning

54 | ENERGY FUTURE: Think Efficiency American Physical Society • September 2008
Data from recent Department of Housing and Urban Development surveys show that the average rate of new construction is about 1.4 percent per year, and when demolition, condemnation, and conversion of residences are factored in, the net growth per year is about 1.2 percent. Once built, a residential building is likely to be usable for about one hundred years [Johnstone, 2001].
In 2000 (the latest year for which data are available), the average existing residential unit consisted of 1,591 square feet and a household size of 2.7 people [2007 Building Energy Data Book, pp.2-1]. Although the housing market is currently extremely volatile, the trend for at least a half-century has been toward larger residences. The average new single-family home constructed in 2006 was 2,470 square feet, 42 percent larger than in 1980 [2007 Building Energy Data Book, p. 2-3].
Primary energy consumption based on end use for residential buildings in 2005 is summarized in Figure 18. The single largest end use is space heating (32%), followed by air conditioning or space cooling (13%), water heating (13%) and lighting (12%). Note that these four combined account for 70% of the energy consumption.
Commercial BuildingsIn the United States in 2000, 4.7 million commercial buildings provided 68.5 billion square feet.
From 2000 to 2005, the commercial building stock grew by 15 percent to 74.3 billion square feet,
double the growth rate of the residential sector [2007 Building Energy Data Book, p.2-5].
The commercial space breaks down as follows: offices (17%), mercantile (16%), education (14%), warehouse and storage (14%) and lodging (7%), with numerous other functions making up the remaining 32 percent.
Primary energy consumption based on end use for commercial buildings for 2005 is summarized in Figure 19. The single largest end use is lighting (27%), followed by space heating (15%), space cooling (14%) and water heating (7%).7 Together these four end-uses account for 63 percent of primary energy consumption, somewhat lower than the case for the residential sector. Although commercial buildings presently consume less primary energy than residential buildings, the energy use in the commercial sector is experiencing nearly double the growth rate. (See Figure 20.)
7.NumbersdifferslightlyfromthoseintheDOEBuildingEnergyDatabookasthe5.5%adjustmenthasbeeneliminatedanddistributedproportionallytoallothercategories.Non-buildingcommercialuseincludeselectricityforstreet lights,water treatmentplants,airportlights,etc.Allthesenumbersforenergyusesshouldbeviewedasroughapproximations—moreusefulforcomparingtherelativesizesofvariousenergyusesthanasprecisefiguresofanyspecificenergyuse.
8.Sincelightingandspacecoolingarepredominantlyaccomplishedwithelectricenergy,theirrelativeimportancecomparedtootherendusesdependsstronglyonwhetherthefocusisonprimary(source)energyorsiteenergy.
Source: Energy Data Book (2007); EERE, U.S. Department of Energy
0 20
OtherCookingComputers
RefrigerationVentilation
ElectronicsWater heating
Space cooling 8Space heatingLighting 8
27% 15% 14% 7% 7% 6% 4% 3% 2% 15%
Figure 19
Commercial energy end usageIn 2006 the commercial sector consumed 17.9 quads of primary energy. This chart shows the relative amounts going to various end uses.7 The category “Other” includes non-building commercial use such as street lighting, lighting in garages, etc.
0
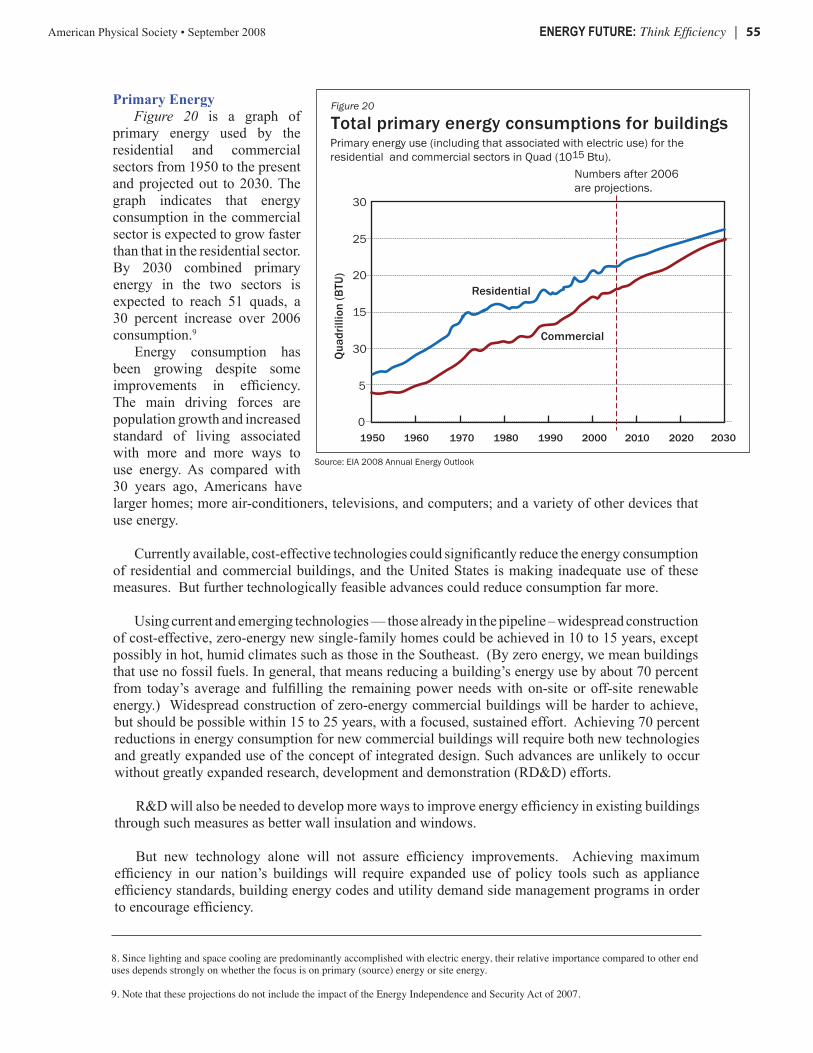
American Physical Society • September 2008 ENERGY FUTURE: Think Efficiency | 55
Figure 20
Total primary energy consumptions for buildingsPrimary energy use (including that associated with electric use) for the residential and commercial sectors in Quad (1015 Btu).
Source: EIA 2008 Annual Energy Outlook
1950 1960 1970 1980 1990 2000 2010 2020 2030
30
25
20
15
30
5
0
Residential
CommercialQ
uadr
illio
n (B
TU)
Numbers after 2006 are projections.
8.Sincelightingandspacecoolingarepredominantlyaccomplishedwithelectricenergy,theirrelativeimportancecomparedtootherendusesdependsstronglyonwhetherthefocusisonprimary(source)energyorsiteenergy.
9.NotethattheseprojectionsdonotincludetheimpactoftheEnergyIndependenceandSecurityActof2007.
Primary EnergyFigure 20 is a graph of
primary energy used by the residential and commercial sectors from 1950 to the present and projected out to 2030. The graph indicates that energy consumption in the commercial sector is expected to grow faster than that in the residential sector. By 2030 combined primary energy in the two sectors is expected to reach 51 quads, a 30 percent increase over 2006 consumption.9
Energy consumption has been growing despite some improvements in efficiency. The main driving forces are population growth and increased standard of living associated with more and more ways to use energy. As compared with 30 years ago, Americans have larger homes; more air-conditioners, televisions, and computers; and a variety of other devices that use energy.
Currently available, cost-effective technologies could significantly reduce the energy consumption of residential and commercial buildings, and the United States is making inadequate use of these measures. But further technologically feasible advances could reduce consumption far more.
Using current and emerging technologies — those already in the pipeline – widespread construction of cost-effective, zero-energy new single-family homes could be achieved in 10 to 15 years, except possibly in hot, humid climates such as those in the Southeast. (By zero energy, we mean buildings that use no fossil fuels. In general, that means reducing a building’s energy use by about 70 percent from today’s average and fulfilling the remaining power needs with on-site or off-site renewable energy.) Widespread construction of zero-energy commercial buildings will be harder to achieve, but should be possible within 15 to 25 years, with a focused, sustained effort. Achieving 70 percent reductions in energy consumption for new commercial buildings will require both new technologies and greatly expanded use of the concept of integrated design. Such advances are unlikely to occur without greatly expanded research, development and demonstration (RD&D) efforts.
R&D will also be needed to develop more ways to improve energy efficiency in existing buildings through such measures as better wall insulation and windows.
But new technology alone will not assure efficiency improvements. Achieving maximum efficiency in our nation’s buildings will require expanded use of policy tools such as appliance efficiency standards, building energy codes and utility demand side management programs in order to encourage efficiency.

56 | ENERGY FUTURE: Think Efficiency American Physical Society • September 2008
Clearly, reducing building energy consumption is critical to our nation’s future. A first step on the path to limiting greenhouse gas emissions, reducing the national energy bill, avoiding unnecessary construction of power plants and diminishing stresses on fossil energy resources is recognizing that buildings (including factories) as well vehicles now consume vastly more energy than they need to operate efficiently. (See Endnote 2.)
Finding 1:If current and emerging cost-effective energy efficiency measures10 are employed in new buildings,
and in existing buildings as their heating, cooling, lighting and other equipment are replaced, the growth in energy demand by the building sector could be reduced from the projected 30 percent increase to zero between now and 2030. (See Endnote 3.)
Discussion: There are a wide variety of technologies and strategies now available that can significantly
lower building energy consumption without any loss of service or comfort. Some are appropriate for residential buildings, some for commercial buildings, and some for both. We are not suggesting that all of these items are cost-effective in all cases.
Space heating is the largest residential user of energy, and cooling is a close second. Focusing on those two systems, measures for both new construction and renovation that can save significant amounts of energy include:
Increasing insulation in walls, roof, floor and basement to cost-effective levels. •
Using window coatings, chosen based on climate, to reduce the amount of heat gain and •loss through thermal transmission.
Moving heating and cooling ducts into the conditioned space (so that air from leaks is •not lost to the outside) for new construction and reducing leakage for new and existing homes.
Improving heating systems through the use of furnaces that send less than 10% of their •heat out the flue, variable-speed and higher efficiency motors/fans for air circulation and efficient ground-source or gas-fired heat pumps.
Upgrading equipment for cooling to achieve better heat transfer from an air conditioner’s •evaporator and condenser coils. Using variable-speed drives that allow units to operate efficiently at partial load (rather than turning on and off frequently). In addition to saving energy, this partial load operation also controls humidity more effectively and reduces the internal heat loads on the air conditioner.
Changing ventilation system installation (mostly for new construction) from the current •practice of relying on construction errors and accidental leakage to provide sufficient fresh air to a process that uses the proper amount of mechanical ventilation while sealing the home to nearly airtight standards.
Controlling ventilation can mitigate problems with indoor air quality and mold, while also •recovering energy from the exhaust air stream.
10.By“emergingtechnologies,”wemeantechnologiesthatarelikelytobeavailableinthecoming5–10years,assumingcontinuationofthepresentlevelofR&D.By“costeffective,”wemeanatechnologythatiscost-effectivefortheindividualconsumer.Thatis,atcurrentenergyprices,theconsumerwouldsavemoreinreducedenergyconsumptionoverthelifetimeofthetechnologythanhewouldpaytopurchaseandinstallthetechnology,assumingarealdiscountrateof7percent.

American Physical Society • September 2008 ENERGY FUTURE: Think Efficiency | 57
11.Thereducedwaterusagearisesnotfromchangesinbehavior,butfromusingdishwashersandclotheswashersthatprovidethesameutilitywhileusinglesshotwater.
Expanding use of evaporative cooling, using direct evaporation in arid climates, and •evaporation combined with an air-to-air heat exchanger in more humid climates.
Constructing buildings with “cool” roofs that reflect rather than absorb infrared radiation in •warm and hot climates.
Integrating passive solar heating and cooling into home designs. There are considerable •difficulties of custom-designing the orientation and thermal characteristics of individual homes, but when it is done correctly, passive solar construction is a very cost-effective measure for saving energy.
The remaining measures focus on the other high-energy end-uses: hot-water heating, lighting, refrigeration, electronics/computers and other appliances.
In the residential sector, water heating uses as much energy as air cooling. This energy use in all buildings can be cut by utilizing more efficient water heaters, reducing distribution losses in the plumbing system, and reducing the heaviest demands for hot water in the home through water-saving appliances (dishwashers and clothes washers).11
Experience indicates a great deal of energy can be saved through increasing the efficiency of appliances. The best example may be refrigerators. Today’s refrigerators use one-fifth as much energy as comparable refrigerators did 35 years ago. Also they cost less, after inflation. These energy efficiency improvements have come about at least in part in response to federal regulations that require manufacturers to meet appliance energy efficiency standards that are increasingly strict over time.
Additional equipment that will result in significant energy savings in commercial buildings from available technology include:
More efficient lamps, ballasts and luminaires.•
Improved glazing with lower heat loss and appropriate solar gain.•
Improved controls for air conditioning systems.•
Variable speed fans/drives and pumps.•
Lower-pressure fan systems.•
Occupancy sensors for controlling lights and ventilation.•
Efficient designs for building elevators and escalators.•
Although analyses of energy savings stemming from single systems are the easiest to understand, they miss many of the big-picture, cost-effective options that come from integrating systems, such as:
The use of lighting designs that optimize the distribution of light so that it is brightest •where the most light is needed and less intense elsewhere.
The use of envelope designs that permit daylighting (described in the next section), while •controlling solar loads and glare.
Reduction in size and/or complexity of heating, ventilation, and air-conditioning (HVAC) •systems made possible as a consequence of better insulation in walls, roofs, and floors; improved windows; and reduced air leakage.

58 | ENERGY FUTURE: Think Efficiency American Physical Society • September 2008
The use of separate space conditioning and fresh air ventilation systems that allow oc-•cupants to control the systems based on need.
Separate control of cooling and dehumidification, so that cooling systems can be sized •to address cooling alone.
Lighting and window energy-efficiency technologies and strategies are common to residential and commercial buildings, though some lighting technologies are only appropriate for commercial applications. Lighting presents perhaps the greatest opportunity for immediate, cost-effective energy savings in buildings.
Incandescent lamps, a century-old technology, are the major source of light for residential buildings despite converting only 5 percent of their electric energy into light. Electric energy is generated and delivered to end-use sectors with an average of 31 percent efficiency. (See Endnote 2.) This means the overall efficiency of converting primary energy into incandescent light is only 1–2 percent. Clearly lighting is an area in which there is great room for improved efficiency. Figure 21 shows the status of lighting technology in the United States as of 2001.12
One widely available alternative is the compact fluorescent light (CFL), which uses one-quarter of the energy of an incandescent bulb to deliver the same light intensity and quality. Mercury is an environmental concern in all fluorescent lamps; however, replacing incandescent lamps with CFLs releases less mercury into the environment than traditional light bulbs when the mercury released through the burning of coal for electricity generation is taken into account (at current allowable rates of mercury emissions) [U.S. EPA, 2008].
12.PresumablytheexpandedsaleofCFLssince2001hasreducedenergyusedbyincandescentlamps,butwewerenotabletolocatemorerecentdata.
13.Electricenergyistypicallymeasuredinunitsofkilowatt-hours(kWh).1kWh=3,600,000joules.1TWh=1terawatt-hour=1billionkWh.
Figure 21
National lighting energy consumptionIn 2001, the U.S. consumed 8.2 quads of primary energy (corresponding to 765 TWh13 of delivered electricity) for incandescent, fluorescent, high-intensity discharge (HID) and light-emitting diode (LED) lighting technologies. Incandescent lamps remain the dominant lighting technology in the residential sector.
390 billion kWh used for lighting in all commerical buildings in 2001
Annual energy consumption (TWh / year)
Lighting energy consumptionby major sector and light source Breakdown of lighting energy
Sources: Navigant Consulting, Inc., U.S. Lighting Market Characterizations, Volume I, National Lighting Inventory and Energy Consumption Estimate, Final Report for Department of Energy, 2002
0 100 200 300 300 500
Outdoorstationary
Residential27%
Industrial14%
Outdoor stationary 8%
Commercial 51%
Industrial
Residential
Commercial
IncandescentFluorescent
Incandescent40%
LED (<.1%)
HID22%
Fluorescent38%
High intensitydischarge

American Physical Society • September 2008 ENERGY FUTURE: Think Efficiency | 59
To get a sense of the rough potential of improving lighting efficiency, assume that all incandescent lamps in use in 2001 were replaced by lamps that use one-fourth the energy, such as CFLs. The annual electric savings would be about 240 TWh, corresponding to 2.6 quads of primary energy. (No doubt some of these upgrades have been accomplished since 2001, particularly in the commercial sector.) A more precise recent analysis of lighting upgrades found that annual electric energy could be reduced by 120 TWh (1.3 quads primary energy) by upgrading residential incandescent lamps and upgrading ballasts and lamps in commercial buildings [McMahon, 2007].
Lighting upgrades will accelerate due to the enactment of the federal Energy Independence and Security Act of 2007, which phases in limits on the sale of incandescent bulbs. CFL sales are already booming, with annual sales now at 400 million units compared to 50 million units just 5 years ago. Solid-state lighting now being developed promises to produce lamps that double the energy savings from CFLs.
Expanding the use of natural lighting—so-called “daylighting”—can save an estimated 30–60 percent in lighting energy in many commercial buildings [Loftness, 2004]. Daylighting uses sensors and controls to adjust artificial lighting in response to changing natural light coming through windows and skylights. Wal-Mart used this approach to upgrade lighting in its 2,100 stores worldwide with energy savings that have a two-year payback in energy costs alone [Zimmerman, 2007].
Lighting energy can also be reduced by making better use of task lighting combined with sensors and controls that deliver light at appropriate levels where and when needed. Ironically, commercial buildings use about five times as much energy for lighting (per square foot) as do residential buildings, even though residential buildings are used more at night. One of the primary reasons for this is that residential buildings make better use of natural lighting and task lighting.
The rapid expansion of modern electronic equipment has resulted in homes and businesses containing dozens of smaller electronic loads such as computers, printers, faxes, copiers, microwaves, televisions, VCRs, DVD players and cable boxes. Many of these devices go into a standby mode and continue to use power even when turned off. A recent study estimated that an average California home contained more than forty products constantly drawing power. Together, those products consumed nearly 1000 kWh/year while off or in a low-power mode [Meier, 2008]. This represents about 8% of the average U.S. household electric energy consumption. Replacing such devices with Energy Star (http://www.energystar.gov/) rated devices would significantly lower energy consumption, particularly in standby or low-power mode.
––––––––––––––––––––––––––––––––––––––––––
We pause here to discuss combined heat and power (CHP) because it would enable buildings to make more efficient use of electrical generation plants. However, unlike the technologies mentioned above, CHP would require significant additional R&D to be practical in many cases. Also, CHP is not assumed in reaching the 30 percent energy efficiency improvement cited in Finding 1.
In addition to energy efficiency in a building, an energy supply technology directly associated with the building—combined heat and power (CHP)—represents a significant opportunity for energy savings, yet one that remains largely unexploited in the United States. The electric power sector discharges roughly two-thirds of its energy—nearly 26 quads annually—to the environment in the form of low-grade heat. That low-grade heat is being lost at the same time residential and commercial buildings are consuming 7.5 quads of natural gas to produce low-grade heat. Clearly a great deal of energy could be saved if waste heat could be delivered to places that need it. It sounds simple, but is very difficult to accomplish with centralized electric power stations. A few power plants do capture this waste heat and distribute it in district heating systems, but those types of plants are more common in Europe.

60 | ENERGY FUTURE: Think Efficiency American Physical Society • September 2008
For U.S. buildings, existing CHP opportunities are mostly limited to large building complexes such as those associated with colleges, universities and hospitals, which provide heating and cooling from a centralized natural gas or coal plant. These plants have the opportunity to produce both electricity and steam, with improved efficiency over plants that just produce heat or electricity. More opportunities could present themselves if communities develop more compact land use patterns, which is desirable from a transportation systems perspective as well. (See Chapter 2.)
CHP for individual buildings has been demonstrated using natural gas microturbines and fuel cells,14 which generate both electricity and heat for space heating and domestic hot water. Balancing the heat and electric demands proves challenging for a single building. For these technologies to achieve widespread use, R&D efforts are needed to bring down the costs of microturbines and fuel cells and to address a variety of technical and financial challenges [Marnay et al., 2007].
––––––––––––––––––––––––––––––––––––––––––
In determining what efficiency gains are possible with current and emerging technologies, it is useful to start by looking at what is happening under current standard practices. Contractors focused on energy upgrades to existing residential buildings achieve energy efficiency improvements ranging from 15 to 35 percent by installing better and more efficient insulation, windows (in some instances) and lights; by eliminating infiltration and duct leakage; by upgrading furnaces, boilers and air conditioners; by replacing the power supplies that waste electricity when their devices are in standby or low-power mode; and by replacing old appliances with newer, more efficient ones.15
Energy service companies (ESCOs) regularly work with larger commercial customers to perform energy audits followed by upgrades in lighting, HVAC equipment and system controls, by which they achieve cost-effective energy savings. We were unable to locate performance data for U.S. ESCOs. In Berlin, Germany, however, ESCOs have improved the energy efficiency of 1,400 buildings by an average of 24 percent at no cost to building owners and a profit to the ESCO that paid for the upgrade [C40 Cities, 2008]. U.S. results are likely to be similar. Generally, it is easier to achieve efficiency gains in new buildings than in existing ones.
Finding 1 is also based on an analysis conducted in 2000 as part of the Clean Energy Futures study [Brown et al., 2001] and recently updated to determine the potential for improvements in buildings [Brown, Borgeson and Koomey, 2008]. The analysis concludes that using currently available technology upgrades as they become cost-effective for current and new buildings would result in a 30 percent decrease in the annual energy consumption by residential and commercial buildings in 2030. (Endnote 3 explains why Finding 1 is worded more conservatively than the Clean Energy Futures study.) It turns out that the reduction erases the projected increase in energy consumption for the buildings sector, so that 2030 consumption by buildings could be the same as it is today.
Far more energy savings are technologically achievable, but not cost effective between now and 2030 for the individual consumer. Additional upgrades would be cost-effective if societal costs and benefits were taken into account.
As discussed later in this chapter, even the cost-effective energy savings will not be achieved by market forces alone; significant policy tools and incentives will be required. And the policy tools will also likely result in unexpected improvements coming into the marketplace, as has happened in the past.16
15.AnalysisprovidedbyDavidLeeoftheEnvironmentalProtectionAgency’sEnergyStarprogramprojectsthatEnergyStar–recom-mendedcost-effectiveenergyimprovementstoexistinghomesshouldyieldefficiencyincreasesrangingfrom8to38percent,witha28percentnationalaverage.
16.Forexample,refrigeratorsfrom1975topresent;clotheswashersfromabout1990topresent(therewerenostandardsandincentivesbeforethat);andCalifornia’sreductioninhomecoolingenergy[GoldsteinandHoffman,2004].
14.Buildingsuseseveralkindsofhydrogenfuelcells(phosphoricacid,moltencarbonate,solidoxideandPEM)forgeneratingelectricity.Thehydrogenforthesecellsisextractedfromnaturalgaswithareformerbeforegoingtothefuelcell.

American Physical Society • September 2008 ENERGY FUTURE: Think Efficiency | 61
17.Thismayproveimpossibleformultistorycommercialbuildings,inwhichcaseoff-siterenewableenergysourcesmayberequiredtoachievenetzeroenergy.
18.DOE’sEnergyEfficiencyandRenewableEnergy(EERE)BuildingTechnologiesProgramhassetthegoalof2025forZEBcommer-cialbuildings.
Recommendation 1:The federal government should set a goal that the U.S. building sector will use no more primary
energy in 2030 than it does in 2008. That goal should be reviewed every 5 years in light of the available technology and revised to reflect even more aggressive goals if justified by technological improvements. Achieving the goal will require that the federal government implement a set of policies and programs such as those discussed later in this chapter.
––––––––––––––––––––––––––––––––––––––––––Finding 2:
The goal of achieving significant levels of construction of cost-effective new zero-energy commercial buildings by 2030 is not obtainable without significant advancement in building technology and without the development and widespread adoption of integrated building design and operation practices.
Discussion: Zero-energy buildings (ZEBs), or “net-zero buildings,” are an attractive concept achievable by
merging efficient grid-connected buildings with renewable energy generation. The ideal is to use on-site renewable energy sources, typically a photovoltaic (PV) array, to annually generate as much energy as the building uses. A building, at times, buys energy from the grid while at other times, sells energy back to the grid. A ZEB is one that annually sells as much energy as it buys, or more. ZEBs are being built today, but are generally not yet cost-effective. Indeed, if cost and footprint are not constrained, one can simply add whatever renewable energy sources are necessary to achieve net-zero energy, no matter the efficiency of the building. But widespread construction of ZEBs requires that they be cost-effective and that the renewable energy sources fit into the building footprint.17 Since efficiency measures are much cheaper per unit energy than on-site renewable energy, both cost and footprint constraint lead to the requirement that such buildings first be made very efficient. Efficiency is also important to reduce energy consumption so that the required renewable energy sources can fit into the building footprint. A 70 percent reduction in energy consumption (as compared with conventional buildings) has been adopted as a consensus target for ZEB—though it is an estimate.
Various organizations, including the U.S. Congress (in the case of federal buildings), the American Institute of Architects (AIA) and the State of California, have called for all new commercial buildings to be ZEB by 2030.18 The AIA and California have established a 2020 goal for ZEB for all new residential buildings.
Commercial buildings serve a large and widely varying set of occupants and needs. For example, auditoriums and stores may at times be unoccupied, and at other times be crowded with hundreds of people. Some buildings are no larger than small homes while others accommodate 60,000 football fans or 20,000 office workers. And although there are examples of standardized commercial buildings, the largest buildings are often “one-of-a-kind” buildings with specialized criteria. Comfort and health require appropriate ventilation, heating, or more likely, cooling. Design engineers, rightly concerned about liability, commonly design systems for the maximum occupancy, and these systems typically waste enormous amounts of energy when occupancy is low.
There has been growing interest in the construction of green and energy-efficient commercial buildings. The Leadership in Energy and Environmental Design (LEED) certification, introduced in 2000 has rapidly grown in popularity and demand.19 Despite this growing interest there has been relatively little progress in reducing energy consumption in new commercial buildings.

62 | ENERGY FUTURE: Think Efficiency American Physical Society • September 2008
Information about hundreds of green commercial building projects may be found on the internet, many with impressive claims about their projected energy consumption. But obtaining actual energy consumption data for green commercial buildings is difficult. There are a growing number of LEED-certified new commercial buildings (552 through 2006), and the public assumes they are energy efficient, but the only study of their energy use is a recent New Buildings Institute review. The Institute obtained energy performance data for only 21 or 22 percent, of the buildings [Turner and Frenkel, 2008]. Of those, only six achieved site energy consumption levels per square foot that were 70 percent below the average for all commercial buildings per square foot. Only three of the buildings achieved that level of savings in primary energy consumption.20 Still, the New Buildings Institute concluded that the LEED buildings it examined were 25 to 30 percent more efficient than the average new commercial building, but not everyone would reach the same conclusion from the data. Whatever their efficiency, these 121 LEED buildings consume more total energy per square foot (either site or primary) than the average for the entire commercial building stock.
It should be noted that energy efficiency is but one of many criteria for LEED building certification and credits for energy efficiency are awarded based on design simulations, not measured building energy performance. There has been very little work on validating whether projections of performance correspond to actual building performance; that is an area requiring further research. What’s needed is a comprehensive system for rating building energy efficiency. More often than not, constructed buildings actually use more energy than predicted by energy simulations performed during the design process [Sacari et al., 2007]. This may be due to flaws in simulation tools; failures in the design, construction or operation of the building; or energy intensive “plug-loads” that were not included in energy simulations.21 Monthly energy bills cannot distinguish between energy used by building systems (lighting, heating, ventilation, air-conditioning, etc.) and plug-loads. Monthly energy bills for a very efficient hospital are likely to be higher than those for an inefficient elementary school. Neither design energy simulations nor monthly energy bills provide the complete picture of a building’s energy efficiency.
Very-low-energy commercial buildings are so rare largely because they are very difficult to design, construct and operate. The biggest barrier is the complexity of the buildings and their HVAC systems, and the important interactions between the various building systems and components. Significant efficiency improvements have been achieved when all of these factors were taken into account—using a process called “integrated design.”
Integrated design is a process in which all of the design variables are considered together, and hundreds or even thousands of combinations are analyzed to arrive at the optimal design which meets user requirements and minimizes energy consumption. The usual linear design process simply fails to account for interactions between the various building components—and these can have important energy and cost implications. (See Endnote 5.) For instance, the direct energy savings associated with choosing a better window technology may not justify the cost – and the linear design process rejects the upgrade. But the integrated design process goes on to determine that the window upgrade allows a smaller, more efficient HVAC system—with total cost savings that justify the window technology upgrade.
An experimental program run by Pacific Gas and Electric (PG&E) in the 1990s showed that 55–65% energy reduction could be accomplished using an integrated design approach [Brohard et al., 1997]. But the process was time-consuming and hard to replicate. The six low-energy LEED buildings offer further proof that 70% reduction in energy use can be accomplished. The challenge is to develop easily-replicable design and construction processes that achieve such results cost-effectively.
19.Seehttp://www.usgbc.org/.
20.StudydataweremadeavailabletousbyCathyTurneroftheNewBuildingsInstitute.Datafor98buildingsweresufficientlydetailedtocalculateprimaryenergy.Averagesiteandsourceenergyintensityforallnon-vacantcommercialbuildingswereobtainedfromtheEIA2003CommercialBuildingEnergyConsumptionSurvey(CBECS)database,andare95and198kBtu/sf,respectively.
21.Plug-loadsareelectricloadsassociatedwithequipmentandappliancesthatarepluggedintopowerreceptacles,andnotdirectlyassoci-atedwiththeoperatingofthebuildingitself.(LightingandHVACarenotplugloads).

American Physical Society • September 2008 ENERGY FUTURE: Think Efficiency | 63
Although it is a crucial component of the solution, integrated design cannot guarantee low-energy commercial building performance. Even the best-designed buildings, with well-thought-out integrated systems, can suffer in their construction by contractors who lack the skills and experience to implement the details faithfully. And facility managers may not know how to operate a new system properly. A $100 home appliance comes with a setup and operating manual; many buildings do not.
Recommendation 2:To achieve the ZEB goal for commercial buildings by 2030 the federal government should create
a research, development, and demonstration program with the goal of making integrated design and operation of buildings standard practice. Such a program should be carried out co-operatively between the federal government, state governments and electric utilities, with funding coming from all three entities.
Since reducing energy consumption and carbon footprint is one of the most important goals for green buildings, any green building rating system, such as LEED, should give energy efficiency the highest priority, based in part on actual energy performance, and require reporting of energy consumption data.
––––––––––––––––––––––––––––––––––––––––––Finding 3:
The goal of achieving significant levels of construction of cost-effective zero-energy residential buildings by 2020 is feasible, except perhaps for hot, humid climates. Most of the required technology to compete with traditional housing is available but inadequately demonstrated. To achieve this goal in hot, humid climates will require increased R&D to develop low-energy dehumidification and cooling technologies and strategies.
Discussion: Cost-effective zero energy homes are not available today, but there has been significant progress
in developing efficient single-family homes. Employment of cost-effective efficient technologies has resulted in new, low-budget, single-family homes that use half as much primary energy as comparable conventional homes [Norton et al., 2005; Christian, 2007]. And 80 to 90% reduction in energy used for heating (though not total energy) has been achieved by passive solar homes22 in Germany, Austria, Switzerland, Sweden and France [Schnieders, 2008].
The U.S. Department of Energy’s Building America program directly addresses the fundamental problems of bringing energy efficiency to new residential buildings. The program provides technical support for builders to construct very energy-efficient residential buildings at low or no increased first cost to the consumer. Building America works with builders who are responsible for more than 50 percent of new residential construction in the United States. More than 50,000 competitively priced houses have been constructed under the program, with an average energy use for heating and cooling that is 30 to 40 percent less than that of typical new residences. DOE’s new Builders Challenge sets a more ambitious goal of 30 percent savings in total building energy. Still, this program has a long way to go to meet the ultimate goal of constructing and selling zero-energy houses by 2020.
Building America addresses two basic problems in commercializing zero-energy houses: assuring the cost and energy performance of state-of-the art technologies and acquainting the building industry with the techniques to build such houses. There is an R&D effort associated with this program that supports the need to reduce costs, improve energy performance and address the cooling and dehumidification requirements of hot, humid climates.
22.Apassivesolarhomeusesawell-insulatedandtightlysealedthermalenvelopealongwithveryefficientwindowstoreduceheatingload,andmeetsmuchoftheremainingheatingrequirementwithsolarheating.

64 | ENERGY FUTURE: Think Efficiency American Physical Society • September 2008
The Building America approach is an effective way to create new markets for energy-efficient housing. Funds to support more demonstration activities could speed up the process of commercializing very-low-energy houses. Promoting Building America along with programs that show the value of building energy codes and strict efficiency standards for appliances will produce very large gains in energy savings in new houses.
––––––––––––––––––––––––––––––––––––––––––Finding 4:
The federal government is not investing sufficient funds in R&D for next-generation building technologies, for training building scientists or for supporting the associated national laboratory, university and private sector research programs.
Discussion:Federal funding is especially important in the building sector, which is highly fragmented and
consists largely of smaller firms that are unable to conduct R&D or have no economic incentive to do so because of an inability to capture the benefits of R&D. Yet funding for energy efficiency R&D for buildings, especially commercial buildings, has declined significantly.
In the 1980s, when levels of effort were much higher than today, federal R&D on energy efficiency in buildings achieved notable success. A National Academy study [NAP, 2001] estimated the economic benefits from advanced window coatings and electronic fluorescent ballasts to be $23 billion (in 2000 dollars). Both technologies resulted from federally funded energy efficiency R&D efforts that expended far less than $23 billion.
Examples of research, development and demonstration that could enable the achievement of deep savings for the majority of new commercial buildings include:
Computer tools:• Improved computer tools are needed to facilitate integrated design by ana-lyzing interactions among building elements that affect energy use. In addition to continued development of complex computer tools such as EnergyPlus, the simulation developed over years by DOE, there is a need for tools that are simpler to use and appropriate during the early stages of design when key decisions are made. These simpler tools need not be crude; indeed, with the low cost of computing, complex programs like EnergyPlus could be made much more user-friendly to meet this need. Such programs could also be used for building labels.
Monitoring and control technologies: • Advanced technologies are needed to support diag-nostics, fault detection and control in real time for a variety of building energy systems.
More efficient building components:• Among the needs are advances in air conditioning and ventilation systems; advances in LED and conventional lighting and their controls; advanced, affordable coatings for windows; envelope systems that optimize air transfer, wa-ter transfer and heat transfer together on a climate-sensitive basis; and building-integrated photovoltaic systems.
Test facilities: • Controlled experiments for commercial buildings in different climate re-gions would benefit from the creation of test facilities. These facilities would allow tests of advanced facades (walls, roofs and windows) coupled with innovative HVAC systems and next-generation controls and monitoring. Such facilities are needed in different climate zones: cold winter/hot summer; hot humid summer; and mild winter/summer.
Demonstration programs:• Demonstration programs showing that commercial buildings can be built to use 70 percent less energy than current structures would encourage the build-
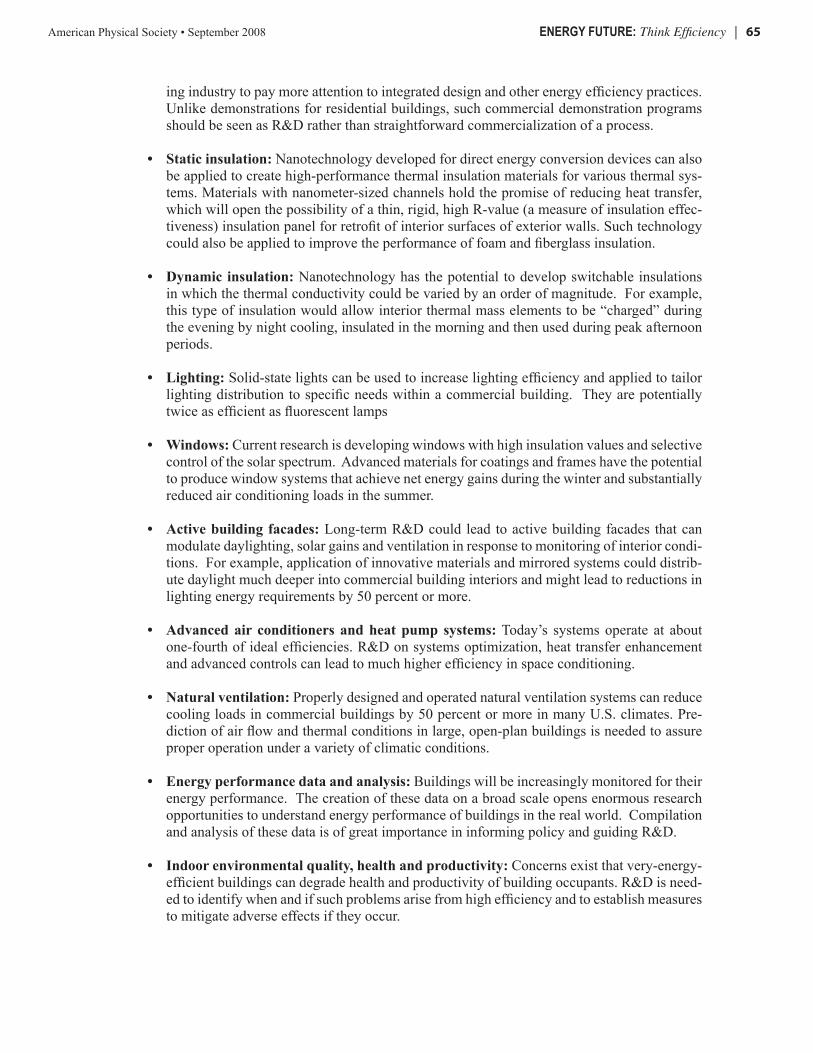
American Physical Society • September 2008 ENERGY FUTURE: Think Efficiency | 65
ing industry to pay more attention to integrated design and other energy efficiency practices. Unlike demonstrations for residential buildings, such commercial demonstration programs should be seen as R&D rather than straightforward commercialization of a process.
Static insulation: • Nanotechnology developed for direct energy conversion devices can also be applied to create high-performance thermal insulation materials for various thermal sys-tems. Materials with nanometer-sized channels hold the promise of reducing heat transfer, which will open the possibility of a thin, rigid, high R-value (a measure of insulation effec-tiveness) insulation panel for retrofit of interior surfaces of exterior walls. Such technology could also be applied to improve the performance of foam and fiberglass insulation.
Dynamic insulation:• Nanotechnology has the potential to develop switchable insulations in which the thermal conductivity could be varied by an order of magnitude. For example, this type of insulation would allow interior thermal mass elements to be “charged” during the evening by night cooling, insulated in the morning and then used during peak afternoon periods.
Lighting:• Solid-state lights can be used to increase lighting efficiency and applied to tailor lighting distribution to specific needs within a commercial building. They are potentially twice as efficient as fluorescent lamps
Windows:• Current research is developing windows with high insulation values and selective control of the solar spectrum. Advanced materials for coatings and frames have the potential to produce window systems that achieve net energy gains during the winter and substantially reduced air conditioning loads in the summer.
Active building facades: • Long-term R&D could lead to active building facades that can modulate daylighting, solar gains and ventilation in response to monitoring of interior condi-tions. For example, application of innovative materials and mirrored systems could distrib-ute daylight much deeper into commercial building interiors and might lead to reductions in lighting energy requirements by 50 percent or more.
Advanced air conditioners and heat pump systems:• Today’s systems operate at about one-fourth of ideal efficiencies. R&D on systems optimization, heat transfer enhancement and advanced controls can lead to much higher efficiency in space conditioning.
Natural ventilation: • Properly designed and operated natural ventilation systems can reduce cooling loads in commercial buildings by 50 percent or more in many U.S. climates. Pre-diction of air flow and thermal conditions in large, open-plan buildings is needed to assure proper operation under a variety of climatic conditions.
Energy performance data and analysis:• Buildings will be increasingly monitored for their energy performance. The creation of these data on a broad scale opens enormous research opportunities to understand energy performance of buildings in the real world. Compilation and analysis of these data is of great importance in informing policy and guiding R&D.
Indoor environmental quality, health and productivity:• Concerns exist that very-energy-efficient buildings can degrade health and productivity of building occupants. R&D is need-ed to identify when and if such problems arise from high efficiency and to establish measures to mitigate adverse effects if they occur.

66 | ENERGY FUTURE: Think Efficiency American Physical Society • September 2008
As a means to insuring that R&D on energy use in buildings is able to thrive over the long term, it is essential to train this and future generations of building researchers and leaders among building energy professionals in government and the private sector. For scientists and engineers, gradu-ate programs with opportunities to pursue energy efficiency research need to be established and expanded.
Recommendation 3:The federal government should increase its investment in R&D to achieve the ZEB goal of 2030
for commercial buildings and 2020 for residential buildings. The current investment of somewhat more than $100 million per year is considerably less in constant dollars than the research program of 1980, which led to important innovations. The 1980 program in today’s dollars would be about $250 million, and we recommend that funding for building R&D be increased to that level in the next 3 to 5 years, after which it should be carefully reviewed. The review should determine the level of continuing federal funding needed for the program to reach its goals, including examining what technology is ready to go to market. One use of the additional spending should be to expand the existing demonstration program for low-energy construction of residential buildings, along with associated research, as noted in Finding 3.
––––––––––––––––––––––––––––––––––––––––––Finding 5:
A wide range of market barriers and market failures discourage investment in energy-efficient technologies.
Discussion:If so many energy efficiency measures are cost-effective why are they not adopted? This question
has stimulated considerable discussion [IEA, 2007; NAP, 1992; Cavanagh, 2004; Goldstein, 2007]. Consider the barriers that inhibit adoption of cost-effective technologies—barriers faced by consumers, manufacturers, builders, designers and suppliers of efficient products.
These include:
Not knowing:• The utility customer knows her total bill but not the contribution of the dif-ferent appliances and the heating and cooling equipment, nor the thermal integrity of the house. Policies such as Energy Star labels and appliance and building standards and labels are essential to overcome this barrier. Even with labels, consumers may not always be aware of highly efficient products on the market or be willing or able to calculate the payback from an initial higher purchase price.
Not caring:• For most consumers, energy is a small cost compared with other expenditures. For example, prior to 2002 typical TVs with remote controls used 5 to 7 watts of standby power when turned off to permit the instant-on feature to function. In 2002 TVs were re-quired to reduce standby power to 3 watts or less to qualify for Energy Star. On November 1, 2008, standby power must be reduced to 1 watt or less for new standalone TVs to qualify. For the individual consumer, the reduction from 6 watts to 1 watt represents just a few dol-lars in savings per TV per year. That sounds trivial, but applied to 300 million televisions across the United States, it represents about $1 billion in electric savings. The cost of making the improvement is small, so the manufacturer has a strong incentive to reduce the standby power to 1 watt to qualify for the Energy Star label. But given the overall cost of operating a TV, the consumer is not likely to care about the slight improvement in standby power ef-ficiency. Split incentives:• If the energy-using equipment or building is owned by a person who does not pay the energy bill, there is little or no incentive to invest in efficiency. Landlords who do not pay for energy, which is typical, are not likely to gain an advantage from installing energy

American Physical Society • September 2008 ENERGY FUTURE: Think Efficiency | 67
efficiency measures. In residential buildings, about one-third of all dwellings are occupied by renters. Split incentives can also apply within a single company: Often the capital budget for building improvements is under one manager while the operating budget is controlled by another.
Stalled demand for innovation:• If manufacturers do not produce energy-efficient products, consumers cannot purchase them. And if consumers do not demand energy efficiency, then producers have little incentive to make their products more efficient. This “chicken and egg” problem applies to appliance manufacturers as well as to builders and building designers. The circle can be broken by policy decisions but is not likely to be resolved by market forces alone.
Reluctance to change: • An important barrier to improved efficiency is inertia. For many years, manufacturers produced appliances with little concern about energy efficiency. After appliance standards were implemented, first by California in 1978, and then by the federal government in 1990, electricity consumption by new refrigerators declined over a 30-year period from 1,72523 to 498 kWh/yr while increasing considerably in size.24 The same phe-nomenon occurred for other appliances, although to a lesser degree. Prior to the standards, energy use had been increasing; for refrigerators it was increasing at 6 percent annually.
Utility profits coupled to sales: • Traditionally utilities (typically electric and natural gas companies) have rate structures that connect their profits to energy sales—the more energy they sell, the more money they make. This offers a disincentive for the utility company to help customers become more efficient and use less energy. Yet utility companies are best positioned to assist customers in identifying ways to improve energy efficiency. Establish-ing rate structures in which utility profits are decoupled from sales removes one of the most important barriers to energy efficiency.
To make the situation even more difficult, the design process itself provides disincentives to incorporate energy efficiency into buildings. For commercial buildings, the lack of coordination between engineers and architects, the payment of design fees that discourage integrated design (which adds to design costs as it later saves in operational costs) and the lack of the required complex knowledge to make the building energy efficient all discourage the use of the best—that is, integrated—approaches to design and construction.
Not only do fragmentation and inefficient design processes provide justification for more federal energy efficiency R&D, they also mean that innovative energy-saving products are unlikely to be produced by manufacturers and thus will not be available to consumers. This problem in the building industry accounts for the inability of the industry to develop first-rate tools for integrated design and operation of buildings.
The example of fluorescent light ballasts makes clear the need for policies to promote energy efficiency. Standard core-coil ballasts were far less efficient than newer ballasts. There was no difference in performance between the two ballasts, and the payback period for the efficient ballast was approximately two years at 1987 electricity prices. In short, the inefficient ballasts made no economic sense. Yet outside of five states that had banned the standard ballasts, inefficient ballasts captured 90 percent of the market in 1987. (The efficient ballasts cost an average of $4.40 more than the inefficient one—$15.40 versus $11—and produced an average savings of $2.15 per year—hence the two-year payback.)
23.Thisincludesmanualdefrost;theaveragefortopfreezerautomaticdefrostinthatyearwas2121kWh/yr.
24.Therefrigeratorstandardthatproducedthegreatestsavings—the1993standard—didnotemergeinavacuumbutwasinformedbysuccessfulOakRidgeNationalLaboratorycompressorresearchthatdemonstratedwhatwaspossible.ThisexampleillustrateshowR&Dandpolicytoolsworktogethertoadvanceefficiency

68 | ENERGY FUTURE: Think Efficiency American Physical Society • September 2008
It is worth noting that the largest portion of purchasers of fluorescent lights are managers of commercial buildings, who might be expected to make purchases with high paybacks and be familiar with technology as simple as fluorescent ballasts. But it took the passage of a federal ban through a 1988 amendment to the National Appliance Energy Conservation Act of 1987 to move the market away from the inefficient ballasts.
These barriers are not unique to the United States. They are observed all over the world. Even developing economies and centrally planned economies are subject to the same failures.
__________________________________________________
Experience has shown that particularly in the case of buildings, even the best cost-effective technologies are not readily adopted without policies to pull them into the market place. This may be especially true for the buildings sector, where unnecessary energy costs that may make little difference to the individual consumer can have large cumulative effects.
Below we discuss several policy tools that we believe should be part of a portfolio of efforts to promote energy efficiency in buildings. The detail about how to apply these tools is beyond the scope of this study, and this is not meant to be a comprehensive list. For example, we do not discuss electric rate decoupling, which would enable utilities to make money from reducing consumption, as mentioned above. Our main point is to emphasize yet again the absolute need for both research and policy to make progress in energy efficiency.
Finding 6:Among the most effective tools for increasing energy efficiency in buildings are building energy
codes, labeling, audit programs and tax and other incentives for the purchase of efficient technology. For appliances, heating and cooling equipment and lighting, both mandatory efficiency standards (e.g. for appliances), voluntary standards (e.g., industry consensus guidelines for lighting usage), and energy labels (e.g., the Energy Star label developed and promoted by the Environmental Protection Agency and DOE) have been effective. Utility demand-side management (DSM) programs that provide
incentives for energy efficiency have been very successful.
Discussion:We limit our discussion to appli-
ance standards, building energy codes, and utility DSM programs, as those have been especially effective in the United States. Figure 22 shows the impact of the three programs in California, calculated conservatively by the California Energy Commission. Since the mid-1970s electric energy use per capita nationally has risen steadily while for California it has remained relatively flat. Today Californians use about 5,000 kWh per person per year less than the average American. Appliance standards, building energy codes, and
Figure 22
Electric savings from California’s energy efficiency programsAnnual electric energy savings in California since 1975 associated with appliance standards, building energy standards and utility DSM programs.
Source: Art Rosenfeld, California Energy Commission
0
5,000
10,000
15,000
20,000
25,000
30,000
35,000
40,000
45,000
GW
h pe
r yea
r
Appliance standards
15% of annual electricity use in California in 2003
Utility efficiency programs
Building standards
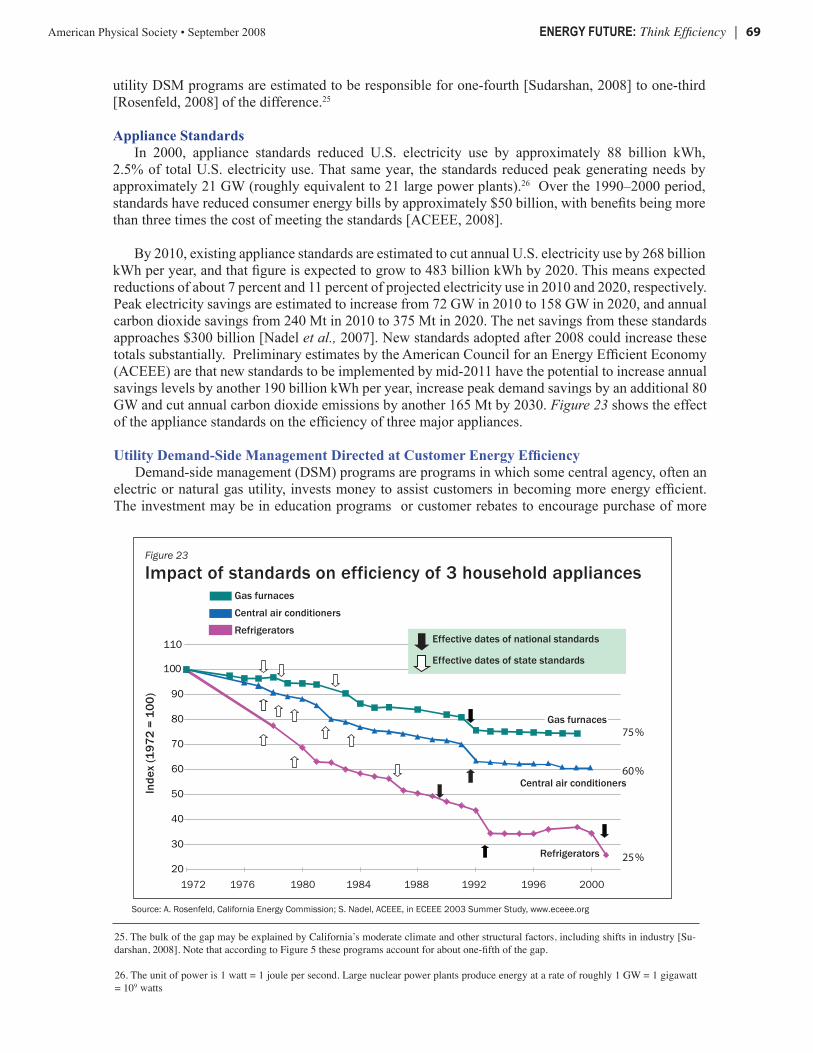
American Physical Society • September 2008 ENERGY FUTURE: Think Efficiency | 69
utility DSM programs are estimated to be responsible for one-fourth [Sudarshan, 2008] to one-third [Rosenfeld, 2008] of the difference.25
Appliance StandardsIn 2000, appliance standards reduced U.S. electricity use by approximately 88 billion kWh,
2.5% of total U.S. electricity use. That same year, the standards reduced peak generating needs by approximately 21 GW (roughly equivalent to 21 large power plants).26 Over the 1990–2000 period, standards have reduced consumer energy bills by approximately $50 billion, with benefits being more than three times the cost of meeting the standards [ACEEE, 2008].
By 2010, existing appliance standards are estimated to cut annual U.S. electricity use by 268 billion kWh per year, and that figure is expected to grow to 483 billion kWh by 2020. This means expected reductions of about 7 percent and 11 percent of projected electricity use in 2010 and 2020, respectively. Peak electricity savings are estimated to increase from 72 GW in 2010 to 158 GW in 2020, and annual carbon dioxide savings from 240 Mt in 2010 to 375 Mt in 2020. The net savings from these standards approaches $300 billion [Nadel et al., 2007]. New standards adopted after 2008 could increase these totals substantially. Preliminary estimates by the American Council for an Energy Efficient Economy (ACEEE) are that new standards to be implemented by mid-2011 have the potential to increase annual savings levels by another 190 billion kWh per year, increase peak demand savings by an additional 80 GW and cut annual carbon dioxide emissions by another 165 Mt by 2030. Figure 23 shows the effect of the appliance standards on the efficiency of three major appliances.
Utility Demand-Side Management Directed at Customer Energy EfficiencyDemand-side management (DSM) programs are programs in which some central agency, often an
electric or natural gas utility, invests money to assist customers in becoming more energy efficient. The investment may be in education programs or customer rebates to encourage purchase of more
25.ThebulkofthegapmaybeexplainedbyCalifornia’smoderateclimateandotherstructuralfactors,includingshiftsinindustry[Su-darshan,2008].NotethataccordingtoFigure5theseprogramsaccountforaboutone-fifthofthegap.
26.Theunitofpoweris1watt=1joulepersecond.Largenuclearpowerplantsproduceenergyatarateofroughly1GW=1gigawatt=109watts
Figure 23
Impact of standards on efficiency of 3 household appliancesGas furnaces
Central air conditioners
Refrigerators
Refrigerators
Central air conditioners
Source: A. Rosenfeld, California Energy Commission; S. Nadel, ACEEE, in ECEEE 2003 Summer Study, www.eceee.org
1972 1976 1980 1984 1988 1992 1996 200020
30
40
50
60
70
80
90
100
75%
60%
25%
Inde
x (1
972
= 10
0)
110 Effective dates of national standards
Effective dates of state standards
Gas furnaces

70 | ENERGY FUTURE: Think Efficiency American Physical Society • September 2008
efficient appliances, or the agent may pay for the bulk of the efficiency upgrade, as in weatherization programs for low-income customers. (See Endnote 4)
DSM programs involving customer energy efficiency have reduced growth in electricity sales in the short run by providing financial incentives for energy efficiency purchases by consumers. Utility DSM has also served to transform markets by aiding the commercialization of new energy-efficient products.
Analysis of specific DSM programs has shown benefits greater than costs. For the nation, total annual utility expenditures on customer energy efficiency from 1995 through 2006 have varied from a low of $880 million in 1998 to a high of $1,700 million in 1995. DSM is returning as a favored utility program, with expenditure in 2008 estimated to be higher than the 1995 level. Levels are expected to continue to increase for the foreseeable future.
Building Energy Codes
Energy codes are adopted at the state or occasionally local level in the United States and are enforced by local code officials at the city or county level. Most states follow national models established by the two nonprofit organizations that write model codes, the International Code Council and the American Society of Heating, Refrigerating and Air-Conditioning Engineers (ASHRAE).
California is one of the states that has not followed these models; it has been a leader in building energy standards that it develops itself. Energy codes adopted since 1975 in California reduced peak power demand in 2003 by 5.75 GW while reducing electric energy use by 11 TWh/yr. The economic value of energy savings is more than $30 billion or more than $2000 per household. The electric energy needed to cool a new home in California has declined by two-thirds (about 2400 kWh/yr to 800) from 1970 to 2006, despite the fact that today’s new home is about 50 percent bigger and is in a warmer climate as new development occurs farther from the coast. The California energy code was revised in 2002, 2005, and 2008; each revision cut energy use by 10–15 percent compared to the previous iteration. This is an annual rate of improvement of about 4 percent.
There is little federal involvement in establishing building energy codes. The federal government, through the Department of Housing and Urban Development, sets standards for manufactured housing and DOE provides modest technical assistance to the model codes organizations.
While energy codes are often thought of in a context limited to new construction, they also save energy in existing buildings. When a new tenant moves into a space in a commercial building and replaces the lights or the HVAC system, that action triggers the energy code requirements. When a home is remodeled, the systems affected must meet energy code: Thus, a kitchen remodel requiring changes to the electrical system in California triggers the need to meet the lighting efficacy standards. A few localities also require retrofits at time of sale for both commercial and residential properties.
Energy codes typically offer two methods of compliance: a prescriptive checklist approach and a performance-based approach that relies on simulated energy performance of the proposed building compared to a comparable reference building. The performance approach is preferred overwhelmingly by builders in states where a usable method of calculating and displaying performance is available, because it allows the builder to meet the energy goal at the lowest first cost. Calculations software that is accessible for use by architectural and engineering firms and consulting companies that provide technical expertise in meeting codes is available nationally for homes, but only widely in California for commercial buildings. The European Union (EU) has requirements that a building energy label be developed for all new buildings and that energy evaluation needs to take place when a building is sold. These will result in easily used software throughout the EU. Efforts are under way to harmonize this development within EU member states and with the residential system used in the United States.

American Physical Society • September 2008 ENERGY FUTURE: Think Efficiency | 71
Recommendation 4:DOE should promulgate appliance efficiency standards at levels that are cost-effective and
technically achievable, as required by the federal legislation enabling the standards. DOE should promulgate standards for all products for which it has been granted authority to do so, including those appliances for which there is not a specific congressional mandate. A streamlined procedure is needed to avoid delays in releasing the standards.
Recommendation 5:Considering the cost effectiveness of utility DSM to date, and the fact that many states have
hesitated in creating such programs, the federal government should encourage states to initiate DSM programs through their utilities. The federal role could be to provide rewards to states that have significant and effective DSM programs and disincentives to those that do not.
Recommendation 6:
Building energy standards, such as those promulgated in California, should be implemented nationwide. States should be strongly encouraged to set standards for residential buildings and require localities to enforce them. For commercial buildings, performance-based standards that rely on computer software to compare a building design with a reference building are implemented only in California. The federal government should develop a computer software tool much like that used in California to enable states to adopt performance standards for commercial buildings. States should set standards that are tight enough to spur innovation in their building industries.

72 | ENERGY FUTURE: Think Efficiency American Physical Society • September 2008
Endnote 1. Energy EfficiencyEnergy efficiency is traditionally defined as the ratio of the “useful energy” to the energy consumed
or taken in.27 A typical coal electric power plant takes in 100 units of coal energy and produces 34 units of electric energy, making the plant 34 percent efficient. As noted in the introduction, an 80 percent efficient natural gas furnace delivers 80 units of heat (useful energy) to a house for every 100 units of natural gas energy consumed, with the remaining 20 units of energy lost as exhaust through the flue.
This traditional definition of energy efficiency is not adequate in identifying many opportunities for reducing (primary) energy consumption through improved technology and alternate strategies. Consider, for instance, two otherwise identical houses, one having no thermal insulation and the other being well-insulated. Both are heated by 80 percent efficient natural gas furnaces. Let us suppose the insulated house uses one-fifth as much energy for heating as does the uninsulated house. We view the insulated house as being more energy efficient—but in what sense? In both cases the energy used to heat is considered “useful energy”; hence both homes by our traditional definition are 80% efficient. But the uninsulated house uses 5 times as much “useful energy.”
Another problem with the traditional definition arises when we consider electric resistive heat. Electric resistive heaters are, in the traditional sense, 100% efficient at converting electric energy into heat (useful energy). Hence replacing the aforementioned natural gas furnace with electric heat would appear to be an improvement in energy efficiency. Yet if we trace the electric energy back to its primary sources we see that the electric-heated home uses considerable more primary energy—and is not to be regarded as more efficient.
Here we adopt a more general definition of energy efficiency that avoids these problems. This definition of energy efficiency is the ratio of the minimum primary energy required to perform a task divided by the actual primary energy consumed by the specific process.28 This second definition tells you how well you are doing as compared with the best possible solution. For the electric power generation from coal described earlier this yields the same 34% efficiency. We note that it is frequently difficult or even impossible to determine the minimum primary energy required to accomplish a certain task. But even without knowing that number, we can compare the efficiencies of two different methods of performing the same task and determine their ratio. Applying this more general definition to our earlier example of two houses, we find the insulated house to be 5 times as efficient (with respect to heating) as the uninsulated house.29
With this new definition of energy efficiency it is instructive to consider again the typical natural gas furnace, providing heat to keep the inside of a house at 70 ºF when the outside temperature is 32º F. The task that this furnace achieves is use of natural gas to deliver heat to the interior of a house. What is the minimum primary energy required? You could start with natural gas to produce electricity with greater than 50% efficiency, then use the electricity to run a heat pump that pumps heat into the house from the outside air or ground with a heating coefficient of performance (COP) that theoretically could be as high as 14 (i.e., it delivers 14 units of heat for 1 unit of electric energy used). Present heat pumps have COPs closer to 3, but, in theory, they could be as high as 14 for the inside and outside temperatures mentioned above [Carnahan et al., 1975]. This method would use less than one-seventh of the energy of our original natural gas furnace. It is a common misconception to believe that there isn’t much room to improve the efficiency of an “efficient” natural gas furnace.
C h a p t e r 3 E n d n o t e s
27.Inthe1975AmericanPhysicalSociety(APS)EnergyEfficiencyStudythiswastermed“first-lawefficiency”[Carnahan et al.,1975].
28.Inthe1975APSEnergyEfficiencyStudythiswastermed,“second-lawefficiency”[Carnahan et al.,1975].
29.Toactuallydeterminetheefficiencyofeitherofthehousesonemustfirstdeterminetheminimumprimaryenergythatmustbesuppliedtoheatthem—thisisasmallnumber,possiblyevenzeroasoccupantsandsunlightmaybesufficienttoheathomes.

American Physical Society • September 2008 ENERGY FUTURE: Think Efficiency | 73
Endnote 2. Electricity, Primary Energy and Site EnergyMost of our energy comes from fossil fuels—oil, natural gas and coal. These are primary energy
sources, as are nuclear, hydro, biomass and a variety of renewable sources including wind and solar. A few primary energy sources, most notably natural gas, are delivered directly to buildings and used on site. Other forms of primary energy, such as nuclear and hydro, are not delivered directly to buildings, but instead are used off site for generating electricity. In the United States, energy content of primary sources is generally measured in British thermal units (Btu), the amount of heat that is required to raise the temperature of one pound of water by one degree Fahrenheit. One quad is equal to one quadrillion or 1015 Btu.30 One Btu is equal to 1054 joules (J), where the joule is the metric unit for energy.
Electricity is a secondary form of energy. It cannot be gathered, mined or pumped from the ground but instead must be produced from primary energy sources. Most of our electric energy is generated from heat produced from coal, natural gas or nuclear energy with an average efficiency of 34 percent—that is, roughly two-thirds of the primary energy used is lost to waste heat, and only one-third is converted into electric energy.31 Moreover, 6-7 percent of the electric energy generated is used at the generating plant or lost in transmission. As a result, only 31 percent of the primary energy consumed is delivered for end use; the remaining 69 percent is lost as waste heat.
Electric energy is measured in kilowatt-hours (kWh) or their common multiples.32 The watt is a measure of power, the rate of use (or production) of energy. One watt is equal to one joule per second. One kWh = 3,600,000 J, the amount of energy used for the length of time of one hour at a rate of 1000 W. This is also equal to 3,416 Btu.
Though electricity is produced with much inefficiency, it is also a far more useful form of energy than heat—it powers motors, advanced lighting, computers, and a host of other devices that require work rather than heat energy. Hence electric energy is vital for buildings. But it is important to recognize that it comes with a particularly high cost in terms of primary energy and associated greenhouse gas emission (GHG).
Seventy-two percent of all electric energy in the United States is consumed by the commercial and residential sectors, with industry and, to a very small degree, transportation, using the rest. Figure 24 shows the flow of primary energy into the electric power sector, and the distribution of electricity generated to the commercial, residential, industrial and transportation end-use sectors.
The heavy reliance of buildings on electric energy combined with the large losses in generation and distribution of electricity complicate the process of tracing building energy consumption back to the primary energy sources. It is far easier simply to total up monthly energy bills and calculate the energy used at the building itself—the so-called site energy.33 From Figure 24 we see that buildings use 2,646 TWh of electric energy, corresponding to 9.0 quads of site energy due to electricity. But the source energy34 or primary energy consumed off-site to provide this electric energy is 28.6 quads. And, since each primary energy source has a different carbon emission factor35, an even more detailed accounting of primary energy is required to determine greenhouse gas emission associated with building energy consumption.
30.Onequadisalsoequalto1.054exajoules,ortheamountofenergycontainedin170millionbarrelsofoil.
31.Newercombined-cyclenaturalgasplantshavemuchhigherefficienciesbutdonotmakeupasignificantfractionofthenation’selectricitygeneratingcapacity.
32.TheseincludeMWh(megawatt-hour=1millionkWh),GWh(gigawatt-hour=1billionkWh),andTWh(terawatt-hour=1trillionkWh).

74 | ENERGY FUTURE: Think Efficiency American Physical Society • September 2008
The primary energy used by buildings directly as fuels (i.e., delivered to buildings) and indirectly through electricity is listed in Table 2. Buildings use a total of 10.3 quads of primary sources on site for fuel, mostly natural gas and petroleum (specifically, home heating oil). Nearly three times as much primary energy, 28.6 quads, is used by buildings indirectly in the form of electricity, which brings total primary energy consumption by buildings to 38.9 quads. The last column of the table lists the associated greenhouse gas emissions in millions of metric tons (megatons) CO2 (MtCO2). Clearly, coal used for generating electricity—nearly 15 quads—is the dominant source of GHG emission associated with buildings.
The large disparity between electric site and source energy leads to considerable confusion when reporting building energy consumption. In this report we use Btu if and only if we are referring to primary energy and kWh when referring to end-use electric energy. Any exception to this convention is made explicit in the text.
It is also clear that site energy, while relatively easy to calculate and of some use in comparing buildings with the same fuel mix, is not a useful concept in determining either GHG emission or energy security. In general, to have a positive national impact on GHG emission and energy security, the goal of energy efficiency must be to reduce primary energy consumption, not site energy consumption.
2006 flows of primary energy into the four end-use sectors (Commercial, Residential, Industrial, and Transportation) by way of the Electric Power Sector. The electric power sector took in 39.7 quads of primary energy and produced 3,900 TWh of electric energy, 3,650 of which were delivered to end-use sectors and 250 TWh either used internally or lost in transmission. The overall efficiency of delivering energy to end-use sectors from primary energy was 31%.
Coal
Coal
35.5%
51.6%
20.7%
15.8%
9.7%
1.6%
0.6%250 TWhT&D Loss
3,650TWhSales
39.7 quads 3,900 TWh
Waste heat26.3 quads
37.0%
27.3%
0.2%
Commercial
Residential
Industrial
Transportation
Nuclear
Natural gas
Renewables
Petroleum
Other
The flow of electric energy by sector
33.Forindividualbuildings,thesiteenergyintensityinBtu/sfisfoundbyaddinguptheannualpurchasedenergyinBtuanddividingbythegrosssquarefootageofthebuilding.Forthiscalculation,1kWhofelectricenergyisequivalentto3,416Btu,ignoringanylossesas-sociatedwithgeneratinganddeliveringelectricenergy.
34.Forindividualbuildings,thesourceenergyintensityinBtu/sfisobtainedsimilarlytothesiteenergyintensity,butbyassigning10,800BtuofprimaryenergytoeachkWhofelectricenergy,therebyaccountingforthe69%averagelossesintheelectricpowersector.
35.CarbonemissionfactorsprovidethemassofcarbonemittedperBtuofenergyreleased.

American Physical Society • September 2008 ENERGY FUTURE: Think Efficiency | 75
Endnote 3. Conservation Supply CurvesA useful approach to determine the cost and benefit of energy-efficient measures is through the
use of “conservation supply curves,” which provide estimates of technical-economic potential energy savings. These are energy savings that can be achieved at a cost lower than the cost of the energy supply. The curves indicate how much energy saving can be “purchased” for a given cost.
Our examination of supply curves is based on a recent study by Brown, Borgeson, and Koomey (BBK) that addresses potential energy savings in 2030 [Brown, Borgeson, and Koomey, 2008]. BBK developed separate conservation supply curves for electric and gas end uses for residential and commercial buildings for the period 2010 to 2030.
Their residential supply curve for electricity use is shown in Figure 25. Also shown is the average cost of residential electricity (red dashed line at 9.4 cents/kWh). Each bar on the graph has a height that indicates the cost/kWh of saved energy and a width that represents the total savings in 2030 for all the cost-effective efficiency measures analyzed in a particular category. The measures chosen were those analyzed in the report Clean Energy Futures (CEF) [Brown et al., 2001]. The authors updated CEF using new forecasts of energy use by end use from the Energy Information Administration’s 2007 Annual Energy Outlook. The cost of conserved energy (CCE) is calculated as the present value of the savings-weighted average for all the measures in that end-use category, using a real discount rate of 7 percent. All savings and costs are expressed in 2007 dollars.
Consider, for instance, lighting efficiency measures, shown as the second bar in Figure 25. An investment of $2.0 billion reduces 2030 electric consumption by an estimated 169 billion kWh, a reduction that corresponds to a 1.2 cents/kWh cost of saved energy. The present value of the saved energy, at an average residential retail rate of 9.4 cents/kWh, is $14.1 billion dollars. This is the kind of savings that occurs at “net negative cost” since the economic value of the energy saved exceeds the investment—in this case, considerably. All of the measures shown in Figure 25 have net negative costs, as each falls below the average price of retail electricity, 9.4 cents/kWh—shown as the horizontal
Table 2
Primary use of energy in the U.S.Primary energy use in residential and commercial sectors in quads (1015 Btu), both direct use of fuels and indirect (i.e., used to generate electric energy supplied). All energy is totaled for the two sectors and estimated associated greenhouse gas (GHG) emissions calculated in millions of metric tons carbon.
Residential Commercial Total Est. Total
Energy Source Fuels Electricity Fuels Electricity Energy GHG (quads) (quads) (quads) (quads) (quads) (MtCO2)
Petroleum 1.4 0.2 0.7 0.2 2.6 190
Natural Gas 4.5 2.3 3.0 2.2 12.1 640
Coal 0.0 7.6 0.1 7.3 14.9 1,460
Renewables 0.5 1.4 0.1 1.4 3.4 0
Nuclear 0.0 3.0 0.0 2.9 5.9 0
Total 6.4 14.6 3.9 14.0 38.9 2,290
Source: Primary energy data from Energy Information Administration 2007 Annual Energy Review; GHG figures are only calculated estimates.

76 | ENERGY FUTURE: Think Efficiency American Physical Society • September 2008
red line in the figure.36 If all of the measures shown in Figure 25 were deployed, they would save 572 billion kWh in 2030 for an investment of $5.2 billion. The value of the saved energy in 2030 at current prices is $54 billion.
Each of the four supply curves estimated by BBK (of which only one, for residential electricity, is shown here) indicate that the forecasted building-sector consumption in 2030 can be reduced by about 30% at a cost less than current retail energy prices. These results are similar to results of conservation supply curves that have been developed over many years. Typically, the cost-effective potential is on the order of 10 to 15% in the very near term (five years) because of low turnover, 25 to 30% in the intermediate term (10–20 years), and much higher (depending on the development and experience with new technologies) in the longer term [Nadel, Shipley and Elliott, 2004].
This approach, like all others, is a simplification. The estimates of technical-economic potentials are undoubtedly low because they ignore any technologies for which market experience is limited, fail to consider system integration (e.g., integrated design of lighting, windows, and air conditioning), do not account for future advances in technology, ignore the economic benefits of reductions in energy prices due to demand reductions and exclude a variety of other factors.
It is also important to note that there can be a large difference between the estimates of cost-effective energy savings and those that can be expected in the real world. Because the conservation supply curve underestimates the technical-economic potential over a 20-year time horizon, we believe it is possible to achieve these levels even in the face of market barriers. This cannot happen, however, without strong energy efficiency policies.37
This 30 percent savings will not be achieved by market forces alone. Significant policy tools and incentives will be required to achieve these results. Yet the committee is skeptical that any reasonable policies will achieve the 100 percent deployment of cost-effective technologies assumed in this study. On the other hand, experience shows that some technological advances will occur between now and 2030 and will provide even further efficiency improvements than those included in the BBK study.
Figure 25
Residential electric savings potential for year 2030Conservation supply curve for electric energy-efficiency improvements in the residential sector. For each measure considered, (the energy savings is achieved at a cost per kWh less than the average residential retail price of 9.4 cents/kWh, shown as the horizontal red dashed line.
0 100 200 300 400 500 600
Cost
of c
onse
rved
ene
rgy
(cen
ts/k
Wh)
2030 Energy savings (TWh)
10
9
8
7
6
5
0
1
2
3
4
Color TV LightingOther uses
Waterheating
Space heaterFurnace fans
Personal computers Space coolingDishwasher
Freezer
Refrigeration
Savings potentialof 572 TWh 30% of reference case
9.4¢ / KWh
Clothes washer
572 TWh
36.ForthosefamiliarwiththeMcKinseyconservationsupplycurve—these“negativecost”measurescorrespondtotheleft-handsideoftheMcKinseycurve.

American Physical Society • September 2008 ENERGY FUTURE: Think Efficiency | 77
The committee believes these two factors are offsetting, so that the 30 percent savings is indeed achievable.
Historically, three policies have had especially important impacts on energy use in buildings in the United States—appliance efficiency standards, building energy codes and utility demand-side management. These are discussed briefly in the text. Here we provide more information.
Endnote 4. Policies That Work
Appliance Standards38
Efficiency standards require products such as refrigerators, electric motors and air conditioners to meet specific energy requirements. Minimum efficiency standards apply to new equipment sold in the United States. Consumers still can choose from a range of efficient products with desired attributes and features.
A History of Federal Support
Minimum efficiency standards for appliances and other equipment were adopted by the federal government in order to address market failures, replace a patchwork of state standards, save consumers money and reduce energy use and peak electrical demand. They were first adopted by states, many of which continue to utilize standards to the extent permitted by federal law. In California, by far the most active state in setting appliance efficiency standards, the initiative to upgrade and extend standards has been a hallmark of both Democratic and Republican governors’ programs.
In 1986, appliance manufacturers and energy efficiency supporters agreed to support uniform •national standards on an array of products. In 1987, President Reagan signed the National Appliance Energy Conservation Act (NAECA). Standards for fluorescent lamp ballasts were added by Congress in 1988, and in 1992, President Bush signed the Energy Policy Act that included efficiency standards for certain types of lamps, electric motors and commercial heating and cooling equipment.
In 1989 and 1991, the elder Bush administration issued tougher standards for refrigerators, •clothes washers and dryers, and dishwashers, and began work on several additional standards, laying the groundwork for the Clinton administration to set new standards for refrigerators, room air conditioners, ballasts, clothes washers, water heaters and residential central air conditioners and heat pumps. (The George W. Bush administration reaffirmed the Clinton clothes washer and water heater standards but tried to weaken the new air conditioner standard to a seasonal energy efficiency ratio (SEER) of 12, down from SEER 13. That attempt was overturned in court.)
Efficiency Standards Overcome Market FailuresMinimum-efficiency standards are needed to overcome market failures that restrict the use of
more efficient products. Among these failures are:
Third-party decision makers (e.g., landlords and builders) who purchase appliances but do not •pay the operating costs of the products they purchase;
Panic purchases that leave little time for consumers to become educated;•
37.Basedonpreviousexperience,especiallythatofCalifornia,whichhashadstrongpoliciestopromoteenergyefficiencyinbuildings,ithasinfactbeenpossibletoachievethetechnical-economicpotentialovera20-yearperiod,thusattainingmuchlowerelectricitygrowththanhadbeenforecast.
38.Source:FactsheetfromtheAmericanCouncilforanEnergyEfficientEconomy,athttp://www.aceee.org/energy/applstnd.htm.

78 | ENERGY FUTURE: Think Efficiency American Physical Society • September 2008
Inadequate and misleading information about the relative energy performance of products; •and
High first costs for efficient equipment due to small production quantities and the fact that •manufacturers frequently combine efficiency features with extra non-energy features in expen-sive trade-up models.
Energy Efficiency Standards Provide Substantial Public Benefits Standards enacted to date are having a significant impact on U.S. energy use while saving
consumers and businesses billions of dollars. Appliance standards rank with automobile fuel economy standards as the two most effective federal energy-saving policies.
In 2000, according to analyses by the U.S. Department of Energy and the American Coun-•cil for an Energy Efficient Economy (ACEEE), standards reduced U.S. electricity use by approximately 88 billion kWh and reduced U.S. total energy use by approximately 1,200 trillion Btu. These savings are 2.5% and 1.3% of U.S. electricity and energy use in 2000, respectively.
In 2000, standards reduced peak generating needs by approximately 21,000 MW — equiv-•alent to displacing seventy 300 MW power plants. Without those savings, the shortages during the electricity crisis in California in 2000 and 2001 would have been significantly worse than they were.
Over the 1990–2000 period, standards have reduced consumer energy bills by approxi-•mately $50 billion. Under standards, equipment prices have risen modestly, but estimates by the Lawrence Berkeley National Laboratory and ACEEE indicate that the benefits are more than three times the costs on a net present value basis.
As old appliances and equipment wear out and are replaced, savings from existing stan-•dards will steadily grow. By 2010, savings will total more than 250 billion kWh (6.5% of projected electricity use) and reduce peak demand by approximately 66,000 MW (a 7.6% reduction). Over 1990–2030, consumers and businesses are projected to save approximate-ly $186 billion (1997 dollars) from standards already adopted.
To meet standards, manufacturers often make investments in improving products, but fiscal •impacts on manufacturers are generally modest. For example, in its 1990 Annual Report, Mor-Flo, a major water heater manufacturer, noted that since NAECA: (1) “we no lon-ger have to produce models to address the varying state energy efficiency standards;” (2) “price increases on ... minimum standard models have more than offset the corresponding cost increases resulting in an improved gross profit margin;” and (3) since the standards took effect, “the Company has been selling a larger number of ‘step-up’ models.”
Building Energy Codes Energy codes have a large influence on energy efficiency in states where they are considered
important. In California, energy codes adopted in 1975 have resulted in energy savings of more than $30 billion, or more than $2,000 per household. To illustrate how effective the codes have been, the California Energy Commission compiled data on the energy needed to cool a new home, and the figure decreased by two-thirds from 1970 to 2006. That decrease came despite the fact that the new homes in 2006 were about 50 percent bigger than the 1970 homes.
California’s code development process shows the value of continuous updating. The state’s energy code was revised in 2002, 2005, and 2008, and each revision cut energy use by another 10 to 15 percent.

American Physical Society • September 2008 ENERGY FUTURE: Think Efficiency | 79
Unlike California, most states don’t develop their own energy codes but instead follow national model codes established by the International Codes Council and the American Society of Heating, Refrigerating and Air-Conditioning Engineers, both nonprofit organizations. ICC and ASHRAE are not mandated to set strict energy efficient standards, and they have routinely produced weaker model standards based on consensus rather than on rigorous evaluation of the cost effectiveness of more stringent standards.
There is little federal presence in this area. The Energy Policy and Conservation Act of 1975 required DOE to set a national code, but the act was repealed in 1981. The only direct federal influence on codes is for manufactured housing, where the Department of Housing and Urban Development (HUD) established a national code decades ago. That code hasn’t been revised since 1994 and is significantly weaker than the International Energy Conservation Codes. DOE has some code modeling programs, but the annual budget is less than $10 million, and the department has not taken a leading role in supporting major improvements in efficiency.
Codes are enforced at the local level, not by the organizations that develop and adopt the codes, and this split responsibility is a cause of inadequate enforcement. The effectiveness of code enforcement has not been measured very often or very rigorously, but the available evidence suggests that states that put a priority on effective enforcement through adequate staffing and training programs get results within 10 percent of the expected energy consumption. States without such programs do considerably worse.
The California Energy Commission has estimated that a good nationwide program to enhance energy code enforcement would cost about $50 million annually. If it improved energy performance in new construction by only 10 percent, it would save about $300 million a year.
Utility Demand-Side Management Directed at Customer Energy EfficiencyDemand-side management (DSM) programs, as noted in the body of the report, assist customers
in becoming more energy efficient through education programs, efficient appliance purchase rebates, weatherization programs and other methods typically financed by utilities. DSM programs involving customer energy efficiency improvements have played two important roles. First, they have provided subsidies for energy efficiency purchases by consumers, reducing growth of kWh in the short term. Second, utility DSM programs have transformed markets by bringing energy-efficient products into widespread use.
Analysis of specific DSM programs has shown benefits greater than costs. Such analysis would
ideally consider the amount spent on energy-efficiency programs in a given year along with the total energy savings (in that and all future years) resulting from the investment. Such data are not readily available. Instead, the Energy Information Administration asks utilities to annually report the amount spent on energy efficiency programs and load management programs,39 along with the estimated energy savings achieved in that same year due to these and all previous such investments.
Table 3 shows these data for 1995 through 2006. The direct expenditure (in millions of dollars) on energy efficiency programs is shown in column 2, the direct expenditure on load management programs in column 3 and the indirect expenses for administering both programs in column 4. To obtain the total spent on just energy efficiency, we distribute the indirect costs to energy efficiency and load management in the same proportion as their direct costs and arrive at the total spent on energy efficiency in column 5. The last column gives the total electric energy saved in that year due to these and all previous investments. For the 12 consecutive years, $13.8 billion was spent on DSM energy efficiency programs resulting in roughly 650 TWh of saved electric energy.
Endnote 5. Integrated DesignBecause designing, constructing and operating very-low-energy commercial buildings is so difficult,
39.DiscussionswithEnergyInformationAdministrationstaff
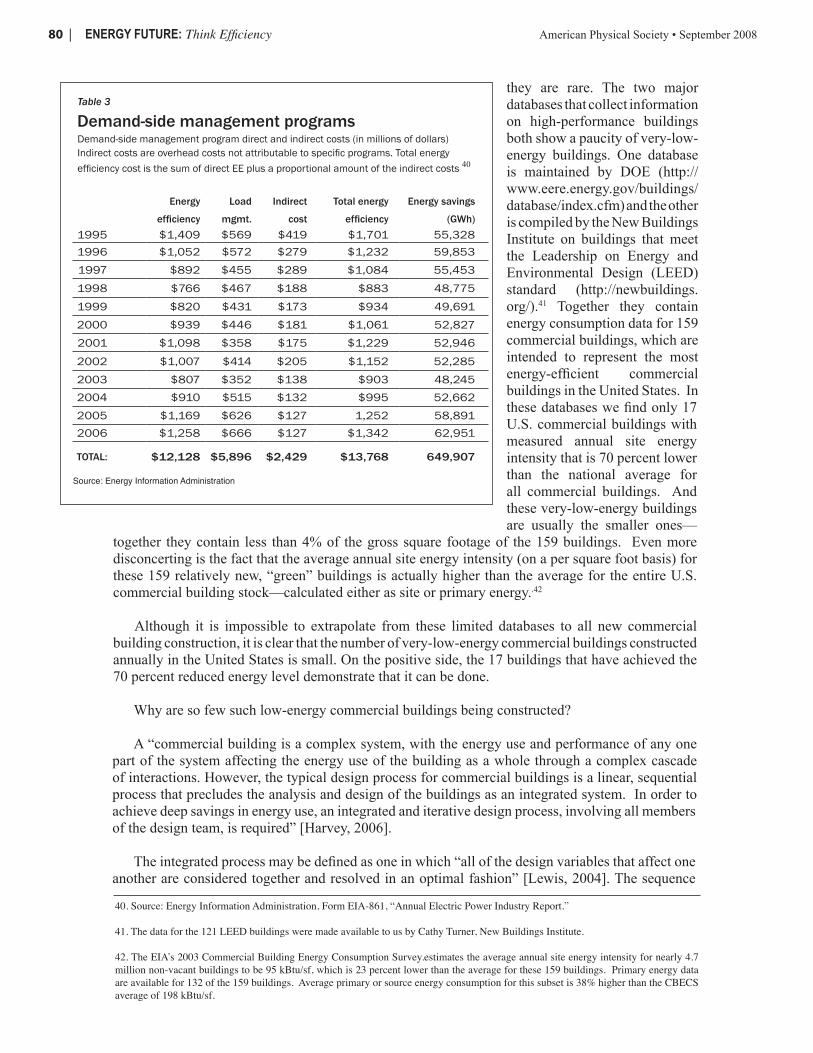
80 | ENERGY FUTURE: Think Efficiency American Physical Society • September 2008
they are rare. The two major databases that collect information on high-performance buildings both show a paucity of very-low-energy buildings. One database is maintained by DOE (http://www.eere.energy.gov/buildings/database/index.cfm) and the other is compiled by the New Buildings Institute on buildings that meet the Leadership on Energy and Environmental Design (LEED) standard (http://newbuildings.org/).41 Together they contain energy consumption data for 159 commercial buildings, which are intended to represent the most energy-efficient commercial buildings in the United States. In these databases we find only 17 U.S. commercial buildings with measured annual site energy intensity that is 70 percent lower than the national average for all commercial buildings. And these very-low-energy buildings are usually the smaller ones—
together they contain less than 4% of the gross square footage of the 159 buildings. Even more disconcerting is the fact that the average annual site energy intensity (on a per square foot basis) for these 159 relatively new, “green” buildings is actually higher than the average for the entire U.S. commercial building stock—calculated either as site or primary energy..42
Although it is impossible to extrapolate from these limited databases to all new commercial building construction, it is clear that the number of very-low-energy commercial buildings constructed annually in the United States is small. On the positive side, the 17 buildings that have achieved the 70 percent reduced energy level demonstrate that it can be done.
Why are so few such low-energy commercial buildings being constructed?
A “commercial building is a complex system, with the energy use and performance of any one part of the system affecting the energy use of the building as a whole through a complex cascade of interactions. However, the typical design process for commercial buildings is a linear, sequential process that precludes the analysis and design of the buildings as an integrated system. In order to achieve deep savings in energy use, an integrated and iterative design process, involving all members of the design team, is required” [Harvey, 2006].
The integrated process may be defined as one in which “all of the design variables that affect one another are considered together and resolved in an optimal fashion” [Lewis, 2004]. The sequence
Table 3
Demand-side management programs Demand-side management program direct and indirect costs (in millions of dollars)Indirect costs are overhead costs not attributable to specific programs. Total energyefficiency cost is the sum of direct EE plus a proportional amount of the indirect costs 40
Energy Load Indirect Total energy Energy savings
efficiency mgmt. cost efficiency (GWh) 1995 $1,409 $569 $419 $1,701 55,328 1996 $1,052 $572 $279 $1,232 59,853 1997 $892 $455 $289 $1,084 55,453
1998 $766 $467 $188 $883 48,775
1999 $820 $431 $173 $934 49,691 2000 $939 $446 $181 $1,061 52,827 2001 $1,098 $358 $175 $1,229 52,946
2002 $1,007 $414 $205 $1,152 52,285 2003 $807 $352 $138 $903 48,245 2004 $910 $515 $132 $995 52,662 2005 $1,169 $626 $127 1,252 58,891 2006 $1,258 $666 $127 $1,342 62,951
TOTAL: $12,128 $5,896 $2,429 $13,768 649,907
Source: Energy Information Administration
40.Source:EnergyInformationAdministration,FormEIA-861,“AnnualElectricPowerIndustryReport.”
41.Thedataforthe121LEEDbuildingsweremadeavailabletousbyCathyTurner,NewBuildingsInstitute.
42.TheEIA’s2003CommercialBuildingEnergyConsumptionSurvey.estimatestheaverageannualsiteenergyintensityfornearly4.7millionnon-vacantbuildingstobe95kBtu/sf,whichis23percentlowerthantheaverageforthese159buildings.Primaryenergydataareavailablefor132ofthe159buildings.Averageprimaryorsourceenergyconsumptionforthissubsetis38%higherthantheCBECSaverageof198kBtu/sf.

American Physical Society • September 2008 ENERGY FUTURE: Think Efficiency | 81
of steps that is typically followed today often leads to solutions that are far from optimal. For example, HVAC capacity and equipment are often decided before the major contributors to the internal loads of a building are known.
Significant interactions among all design elements of a building affect heating and cooling loads (e.g., window size, placement, and thermal characteristics; window shading types and placement; lighting locations, efficacy and local controls; building orientation; number and wattage of plug loads; and the volume of outside air that is circulated into a building).
All of these elements need to be considered in light of advanced technology options (e.g., on-site generation, passive ventilation, thermal mass with night ventilation, chilled ceiling displacement ventilation, dehumidification and daylighting). Control strategies and operating conditions for all of the equipment in the building strongly affect the effectiveness of the design and technology choices for the building.
Finally, all of these complex design and engineering issues must themselves be integrated with decisions on structural issues, space planning, site context, materials selection and other issues, all within the context of tight budgets and schedules.
To address these interactions among the different components of a building, integrated design and operation requires cooperation among the major decision makers in a building project—architects, engineers, and builders—to evaluate the projected energy consumption for a variety of designs. Building professionals must also enjoy a comfort level in using results of computer tools to underpin important design decisions. Software that is understandable to everyone involved is needed, so that the group’s collective knowledge is codified and used as different problems and solutions are addressed in the design, construction, and eventually the operation of the building.
The need goes beyond the design process. Even the best-designed buildings, with well-thought-out integrated systems, can suffer in their construction by contractors who lack the skills and experience to implement the details faithfully. And facility managers may not know how to operate a new system properly. A $100 home appliance comes with a setup and operating manual; many buildings do not.
Just as any complex machine gets out of tune with use, commercial buildings decline in performance if problems are not corrected. A recent study of U.S. commercial buildings found that HVAC equipment that is either faulty or not operated properly accounts for between 2 and 11 percent of energy consumption [TIAX, 2005]. Performance would be improved by an advanced diagnostic and control system, running alongside a real-time building energy simulator, with sensors to collect operating data, identify problems as they occur and recommend adjustments.

82 | ENERGY FUTURE: Think Efficiency American Physical Society • September 2008
Figure 26
A commercial building with integrated systems design and operationsThis diagram of a large commercial building shows various aspects and systems whose interactions are important for optimum building operation and minimum energy consumption.
Source: Lawrence Berkeley National Lab
RoofFuel cell PV panels
Detailed area
Weather station for loadprediction and control
Dimming ballasts withefficient fixtures
Occupancy controlsair quality sensors
Intergrated controls with real time modeling, fault diagnostics and optimization
Efficient boiler with heat recovery
Efficient chiller with heat recovery
Light shelves
Awnings
Automated blinds
Automated blinds
Electrochromatic glazingintegrated with thermal
and daylighting systems
VAV boxes with duct pressure reset
Electric load optimization with real time pricing among multiple buildings
Oversized coolingtower
Figure 26 is a schematic diagram of the technologies that could enable integrated operation of a commercial building of the future.

American Physical Society • September 2008 ENERGY FUTURE: Think Efficiency | 83
2007 Buildings Energy Data Book,• prepared for the Buildings Technologies Program and Office of Planning, Budget, and Analysis, Energy Efficiency and Renewable Energy, U.S. Department of Energy by D&R International, Ltd., September 2007.
American Council for an Energy Efficient Economy (ACEEE), • http://www.aceee.org/energy/applstnd.htm (2008).
G. J. Brohard • et al., Advanced Customer Technology Test for Maximum Energy Efficiency (ACT2) Project: The Final Report, Pacific Gas & Electric, 1997.
M. A. Brown, M. D. Levine, W. Short and J. G. Koomey, “Scenarios for a Clean Energy • Future,” Energy Policy 29, 1179-1196 (2001).
R. Brown, S. Borgeson and J. Koomey, • Building-Sector Energy Efficiency Potential Based on the Clean Energy Futures Study, 2008, to be published.
C40 Cities Climate Leadership Group, • http://www.c40cities.org/bestpractices/buildings/berlin_efficiency.jsp, 2008.
W. Carnahan, K. W. Ford, A. Prosperetti, G. I. Rochlin, A. Rosenfeld, M. Ross, J. Rothberg, G. • Seidel and R. H. Socolow, eds., Technical Aspects of the More Efficient Utilization of Energy, Conference Series, vol. 25, American Institute of Physics, New York (1975).
R. Cavanagh, • Energy Efficiency in Buildings and Equipment: Remedies for Pervasive Market Failures, National Commission on Energy Policy, 2004.
J. Christian, • Affordable and Demand Responsive Net Zero House, draft report, private communication (2008).
Committee on Benefits of DOE R&D on Energy Efficiency and Fossil Energy, Energy Research • at DOE: Was It Worth It? Energy Efficiency and Fossil Energy Research 1978 to 2000 National Academy Press, Washington, DC (2001).
L. R. Glicksman, “Energy Efficiency in the Built Environment,” • Physics Today, July 2008, p. 35.
D. B. Goldstein, • Saving Energy, Growing Jobs, Bay Tree Publishing, Berkeley, CA (2007).
D. B. Goldstein and M. G. Hoffman, “Forecasting an Increasing Role for Energy Efficiency in • Meeting Global Climate Goals,” Proceedings of the 2004 Summer Study on Energy Efficiency in Buildings, American Council for an Energy Efficient Economy, Washington, DC, August 2004.
L. D. Danny Harvey, ed., • A Handbook on Low-Energy Buildings and District-Energy Systems: Fundamentals, Techniques and Examples, Earthscan Publications Ltd., London, 2006.
International Energy Agency, • Mind the Gap: Quantifying Principal-Agent Problems in Energy Efficiency, IEA, Paris, 2007.
I. Johnstone, • “Energy and Mass Flows of Housing: Estimating Mortality,” Building and Environment, v.36, pp.43-51 (2001).
C h a p t e r 3 R e f e r e n c e s

84 | ENERGY FUTURE: Think Efficiency American Physical Society • September 2008
M. Lewis, • “Integrated Design for Sustainable Buildings, Building for the Future, ASHRAE Journal, Supplement, p. S22 (September 2004).
V. Loftness, “Improving Building Energy Efficiency in the U.S: Technologies and Policies • for 2010 to 2050,” in proceedings of the workshop, The 10-50 Solution: Technologies and Policies for a Low-Carbon Future, sponsored by the Pew Center on Global Climate Change and the National Commission on Energy Policy (2004).
C. Marnay, G. Venkataramanan, M. Stadler, A. S. Siddiqui, R. Firestone and B. Chandran, • “Optimal Technology Selection and Operation of Commercial-Building Microgrids,” IEEE Transactions on Power Systems (2007), and references therein.
J. McMahon, “Buildings: Energy Efficiency Options,” presentation at the Haas School, • University of California, Berkeley, Nov. 27, 2007.
A. Meier, Lawrence Berkeley National Laboratory, private communication (2008).•
S. Nadel, A. M. Shipley and R. N. Elliott • The Technical, Economic, and Achievable Potential for Energy Efficiency in the United States: A Meta-Analysis of Recent Studies, American Council for an Energy Efficient Economy, (Washington, DC, 2004).
S. Nadel • et al., Leading the Way: Continued Opportunities for New State Appliance and Equipment Standards, ACEEE, Washington DC (2006); also see Energy Bill Savings Estimates as Passed by the Senate, ACEEE, Washington DC (December 14, 2007), posted at http://www.aceee.org/energy/index.htm.
P. Norton • et al., Affordable High-Performance Homes: A Cold-Climate Case Study, NREL/TP-550-31650, National Renewable Energy Laboratory, Golden, CO, April 2005.
Panel on Policy Implications of Greenhouse Warming, • Policy Implications of Greenhouse Warming: Mitigation, Adaptation, and the Science Base, National Academy Press, Washington, DC (1992).
A. Rosenfeld, California Energy Commission, private communication (2008).•
J. L. Barrientos Sacari, U. Bhattacharjee, T. Martinez and J. J. Duffy,• “Green Buildings in Massachusetts: Comparison Between Actual and Predicted Energy Performance,” Proceedings of the American Solar Energy Society, Cleveland, OH, July 9-13, 2007.
J. Schnieders, “CEPHEUS—Measurement Results from More than 100 Dwelling Units in • Passive Houses,” posted at http://www.cepheus.de/eng/index.html.
A. Sudarshan and J. Sweeney, “Deconstructing the ‘Rosenfeld Curve’,” submitted to • Energy Journal (2008).
TIAX LLC,• Energy Impact of Commercial Building Controls and Performance Diagnostics: Market Characterization, Energy Impact of Building Faults and Energy Savings Potential, final report prepared for the U.S. Department of Energy Building Technologies Program, Washington, DC (November 2005).
C. Turner and M. Frankel, • Energy Performance of LEEP for New Construction Buildings, Final Report, New Buildings Institute, White Salmon, WA, 2008

American Physical Society • September 2008 ENERGY FUTURE: Think Efficiency | 85
U.S. Environmental Protection Agency, Energy Star Program, • Frequently Asked Questions: Information on Compact Fluorescent Light Bulbs (CFLs) and Mercury, http://www.energystar.gov/ia/partners/promotions/change_light/downloads/Fact_Sheet_Mercury.pdf, June 2008.
C. Zimmerman, Wal-Mart, “The Continuing Evolution of Sustainable Facilities at Wal-Mart,” • private communication, (2008).

86 | ENERGY FUTURE: Think Efficiency American Physical Society • September 2008
Reaching the goals of increased energy security and reduced carbon emissions poses significant challenges for science and technology, but it also creates substantial opportunities for innovative research and development (R&D). In this chapter we highlight some of the key opportunities and identify public policies that are needed to enable the endeavors, maximize the probability of their success and facilitate their introduction into the marketplace.
Introduction
It has become common practice to divide innovation activities into two principal categories: upstream basic and applied research and downstream product development, design and testing. Such a simplistic division belies the complexity of the enterprise,
which is far from linear in nature. Nonetheless, the demarcation provides a reasonable way of distinguishing between public and private activities as they are often practiced. Most frequently, the private sector finances and conducts the downstream activities, although in a few cases the federal government funds and actively supports them. Weapons systems and space and aeronautics are two such examples. In both of those cases, however, the federal government is the prime customer for the product.
Five decades ago, private industry also shouldered much of the burden of basic and applied research. It funded the activities privately and, most frequently, carried them out in large central laboratories, such as AT&T’s Bell Laboratories, IBM’s Thomas J. Watson Laboratories and General Electric’s Mohawk Valley Research Center. But today, U.S. technology companies have largely abandoned basic research, and where they perform research at all, they commonly restrict it to applied projects that have very short time horizons, typically no more than three to five years. The reasons for the industrial research transformation are quite well known and we will not dwell on them.
Today, the federal government serves as the principal source of financing for basic research, terminology we assume the reader is quite familiar with and “long-term applied research,” a phrase that may require some clarification. In general, applied research does not lead to a change in the understanding of fundamental science. Nonetheless, in some cases the applied research objective may take many years to achieve. Two illustrations, one past and one current, should suffice to illuminate the point.
The first is the development of optical fibers for communication, which began several decades ago with fibers that had “attenuation lengths” of less than one meter, woefully inadequate for their envisioned application. Many years and many research dollars later, scientists figured out how to keep the light from losing intensity over distances of many kilometers, and the fiber communication revolution began.
Today, the challenge of developing a dramatically improved battery represents a prime technological focus for the vehicle of the future, as we emphasized in the chapter on transportation. Many experts believe that applying nanotechnology to lithium-ion batteries—which rely on single electron transfer—holds some of the greatest promise for success. But the scientific problems are difficult and complex and will likely take
R e s e a r c h & P o l i c yC
HA
PT
ER
4C
HA
PT
ER
4

American Physical Society • September 2008 ENERGY FUTURE: Think Efficiency | 87
years of work to resolve. The task provides a signature example of long-term applied research in the current context.
For completeness, we note by contrast that the development of a multi-electron battery system would fall in the realm of targeted basic research, since it will probably require substantial improvement in our understanding of some fundamental questions in physical chemistry and materials science.
Beyond supporting basic and long-term applied research, the federal government also supports significant shorter-term applied research, but with the exception of defense and space, the work it supports almost always takes place at the pre-competitive stage. Universities and national laboratories act as the primary venues for most federally funded research, although government-industry partnerships, such as FreedomCAR, play a role as well.
Although no one deliberately set out to design the current structure of the U.S. innovation system, the last two decades have shown it to be generally robust, effective and, for the most part, quite efficient. It has been emulated by a number of other nations around the world.
––––––––––––––––––––––––––––––––––––––––––––––––
In the case of energy efficiency, the Department of Energy (DOE) serves as the primary source of federal funding for basic research through its Office of Science and for applied research through its Office of Energy Efficiency and Renewable Energy (EERE). In this chapter, we consider the financial and programmatic strengths of these DOE programs and comment briefly on opportunities that the department might have to strengthen its energy efficiency research portfolio. We note that the National Science Foundation, the National Institute of Standards and Technology and several other federal agencies play a secondary role in energy efficiency research, but we do not address them in this report.
Finding 1:
The DOE Office of Science has a broad energy-related mission. Through enacted authorization legislation in 2005 and again in 2007, Congress and the administration have asserted that the DOE Office of Science requires significant funding increases to carry out its basic research mission. However, Congress and the administration failed to agree on appropriating the necessary funds.
Discussion:The Office of Science generally has received very high performance marks for its research
programs. Yet in fiscal year 2008, the total congressional appropriation (including emergency supplemental funding) of $4.03 billion fell almost 18 percent below the level authorized by the 2005 Energy Policy Act (Public Law 109-58) and the 2007 America COMPETES Act (Public Law 110-69) and 11 percent below the presidential request. In the previous two fiscal years, the congressional appropriations similarly fell far short of the authorized levels. The continued funding deficits make it impossible for the Office of Science to achieve the policy goals established in Public Laws 109-58 and 110-69.
The Office of Science organizes basic research funding related to the energy needs of the nation through five major program areas: Advanced Scientific Computing Research (ASCR), Basic Energy Sciences (BES), Biological and Environmental Research (BER), Fusion Energy Sciences and Nuclear Physics. Although ASCR and BER have responsibility for some activities that can affect future energy-efficiency technologies, BES unquestionably has the largest share. In addition to supporting individual-investigator and team research programs at universities and government laboratories, BES is responsible for operating national user facilities, such as neutron and X-ray light sources, which provide the platforms needed for many facets of the long-term energy-efficiency research

88 | ENERGY FUTURE: Think Efficiency American Physical Society • September 2008
opportunities. For FY 2008, Congress appropriated $1.27 billion for BES, 18 percent below the presidential request; the shortfall resulted in the cancellation of 200 planned energy research projects at universities and reductions in the operation of many of the user facilities at national laboratories.
In its FY 2009 budget request, the White House proposed establishing a new program of Energy Frontier Research Centers funded through the Office of Science at $100 million per year. The centers, which would be located at universities, national laboratories and other eligible institutions, would promote “innovative basic research [in targeted areas relevant to energy] to accelerate scientific breakthroughs needed to create energy technologies for the 21st century” and would address a number of areas critical to energy-efficiency technologies. Those areas would include catalysis; electrical energy storage; solid-state lighting; hydrogen production, storage and use; and materials under extreme environments. Although the Frontier Centers program is clearly strategic in its selection of research areas, DOE officials say it would not be excessively prescriptive, but instead would seek “to engage the Nation’s intellectual and creative talent to tackle the scientific grand challenges associated with determining how nature works.”
Recommendation 1:Congress should appropriate and the White House should approve funds for the DOE Office of
Science consistent with the spending profiles specified in the 2005 Energy Policy Act and the 2007 America COMPETES Act. Congress should exercise its oversight responsibility to ensure that basic research related to energy efficiency receives adequate attention in the selection of Energy Frontiers Research Centers.
Finding 2:Within DOE, indeed within the federal government as a whole, long-term applied research, whether
it is general or strategic in nature, often is the orphan child of science and technology programming.
Discussion:During the 1990s, much of EERE’s programming focused on either short-term applied research or
demonstration projects. Although many of these activities were meritorious, the program’s focus on short time horizons prevented it from addressing compelling long-term applied research opportunities of the kind we describe in this report. Today, long-term applied research has begun to enter EERE’s portfolio, a promising sign for further development. However, the support for long-term applied research is still too small compared to the need, and increasing that support under constrained budget conditions carries the danger that other important research may be squeezed out. The hydrogen program provides an example in which accommodating a long-term presidential initiative prevented EERE from adequately supporting other long- and short-term applied research.
Recommendation 2:To meet the out-year technology goals we have proposed for energy efficiency, DOE must take
steps to fold long-term applied research into its scientific programming in a more serious way than it currently does. The department has several options. It can charge the Office of Science with the responsibility and provide the necessary budget, but if it does so, it must protect the culture and budgets of its current basic research programs. It can designate EERE with the responsibility and augment its budget for that purpose, but if it does so, it must be careful not to allow the short-term activities to continue to diminish long-term opportunities. The department can also create a new structure to support long-term applied research or adapt ARPA-E (Advanced Research Projects Agency–Energy) that was established by the America COMPETES Act.
Finding 3:Historically, coordination between basic and applied research programs within DOE has been far
from ideal.

American Physical Society • September 2008 ENERGY FUTURE: Think Efficiency | 89
Discussion:The Office of Science, which has the responsibility within DOE for supporting basic research, has
generally done an excellent job, given its budgetary constraints. It designs, constructs and operates at its national laboratories user facilities that provide the technological resources for research conducted by university and industrial scientists and engineers. It also directly supports university and national laboratory research groups across a variety of fields. The Office of Science generally has received high ratings from the Executive Branch’s Office of Management and Budget, congressional oversight committees and external review panels.
In recent years, the Office of Management and Budget has also given EERE excellent ratings, and congressional criticism of EERE has focused principally on the reluctance of the White House to request more robust funding for the office and on the relative emphasis of the programs within its purview.
But in the 2005 Energy Policy Act, Congress expressed its concern about poor coordination between the science and technology programs. First, in Sec. 1006 (Improved Coordination and Management of Civilian Science and Technology Programs), the act created a new Under Secretary for Science, who would also serve as the Science and Technology Advisor to the Secretary of Energy. Second, in Sec. 994 (Strategic Research Portfolio Analysis and Coordination Plan) the act required the Secretary to develop a “plan to improve coordination and collaboration in research, development, demonstration, and commercial application activities across Department organizational boundaries.” It is too soon to evaluate whether DOE has fully dealt with coordination problems EPACT 2005 identified.
Recommendation 3:DOE should fully comply with the 2005 Energy Policy Act mandate to improve the coordination
between its basic and applied research activities. Congressional oversight committees should ensure that DOE fulfills its obligation.
Finding 4:The ARPA-E program mission is to bring to market the fruits of high-risk, high-payoff research in
the energy sector. ARPA-E is modeled after the Department of Defense’s highly successful DARPA program, but its customers are not in the agency that created it, and its mandate is unclear.
Discussion:ARPA-E is regarded by some as a cross between a venture capital firm and a program to transfer
energy technology to industry from DOE’s laboratories and universities. Others regard it as a way to re-create the Bell Laboratories of old. It has not yet received funding, although the America COMPETES Act of 2007 authorized it at an annual level of $300 million. ARPA-E’s goals and methodology have to be quite different because ARPA-E’s and DARPA’s customers differ in kind.
DARPA’s customer is DOD, and the relationship between the two is such that DARPA knows what the defense agency needs and wants. Therefore, DARPA can select projects that DOD will likely adopt. For example, ARPANET (the predecessor of the internet), large-scale integration (placing thousands of transistors on a chip) and missile submarines, all DARPA projects, were not outcomes of undirected R&D. They filled a DOD need.
Other venture funds have been created by government agencies. The CIA and U.S. Army created, respectively, the In-Q-Tel and OnPoint funds. NASA started down the same road with its Red Planet Capital fund, but decided not to proceed. As in the case of DARPA, these funds have as their customer the agency that created them.

90 | ENERGY FUTURE: Think Efficiency American Physical Society • September 2008
For ARPA-E the ultimate customer is the private sector, and anything that is developed has to fill a need in a competitive way. It is not just the “thing,” but the cost of the thing compared to other things that is important.
The key question for DOE to determine about ARPA-E is its purpose. Its modus operandi and the nature of its portfolio depend on clarification of its rationale. If ARPA-E is to function as a venture capital firm, it needs the perspective of one. If its investments are in partnership with the private sector, as some DOE R&D programs have been, it needs to have that perspective. If it invests on its own, it needs a particularly hard-nosed group of outside advisors. If ARPA-E functions as a bridge to bringing technologies out of its labs to the private sector, it needs outside advisors who can bring the competitive private sector’s perspective to bear.
Recommendation 4:ARPA-E, if funded, needs to have its purposes better defined. Its time horizon must be clarified,
and the coupling to its ultimate customer, the private sector, needs better focus. This report takes no position on whether ARPA-E should be funded.
Finding 5:Many long-term basic and applied research challenges and opportunities exist in the area of energy
efficiency, and many of them are of a crosscutting nature.
Discussion:In the previous chapters we described some of the long-term research challenges facing the
transportation and buildings sectors, but we placed great emphasis on many of the “on-the-shelf” efficiency gains that can be implemented in the near and intermediate terms using existing knowledge and technology. Here we highlight longer-term prospects, especially those that have crosscutting energy-efficiency applicability. The opportunities we highlight often illustrate the close connections between the basic and applied nature of the research and underscore the need for close coordination of basic and applied research programs.
Recommendation 5:Many areas of long-term basic and applied research in energy efficiency offer unusual opportunities.
A sample list follows, and a more complete description of each appears in the endnotes of this chapter. In the case of transportation, we note that the opportunities we highlight often illustrate the close connections between basic and applied research and underscore the need for close coordination of the two activities. In the case of buildings, we note a serious lack of long-range applied R&D due to the fragmented nature of the industry and EERE’s focus on near-term research and demonstration programs. Therefore, the buildings opportunities we highlight focus on critical longer-term applied research.
Sample List Fuel Cells: Dramatic improvements in these areas are well within reach, if materials science
breakthroughs that have occurred through basic research within the last five years serve as any guide [Crabtree and Dresselhaus, 2008].
Batteries and Electrical Energy Storage: Novel materials can greatly improve battery performance. For example, silicon nanowires can store ten times the energy density of the conventional graphite anode, while still maintaining a delicate surface structure as lithium ions are inserted and extracted [Chan et al. 2008]. In the longer term, developing batteries that transfer two or more charges at a time would dramatically improve energy storage but represents the greatest challenge and the greatest research opportunity.

American Physical Society • September 2008 ENERGY FUTURE: Think Efficiency | 91
Solid-State Lighting: Producing white light requires combining colors, and the available phosphors and the available bandgaps currently provided by semiconducting materials limit the nature and quality of the resulting white spectrum. Materials research in doping and defect control of semiconductors and in the development of new efficient phosphors offers fertile ground for science and technology investment [Humphreys, 2008].
Catalysts: The natural biological world provides the most dramatic example of their impact on the efficiency of energy conversion [Kraut, Carroll and Herschlag, 2003]. Catalysts, which have taken millions or billions of years to evolve, control virtually every biological energy process. Human-engineered catalysts, by comparison, are astonishingly simple, typically providing only a fraction of the speed and selectivity of their biological counterparts. Catalysts can play a central role in raising energy efficiency [Gates et al., 2008]. At a relatively primitive stage of development for now, they offer an extraordinary opportunity for research to drive them toward the capabilities already demonstrated by biological catalysts.
Thermoelectric Devices: On the way to its end use, more than 55 percent of the primary energy we generate is lost to waste heat [PCAST, 2006]. Thermoelectric devices offer a simple route to capturing waste heat, converting it directly to electricity at its source [DiSalvo, 1999; Dresselhaus et al. 2007]. Thermoelectric devices that either use electricity to produce cooling directly or use waste heat to generate electricity directly have obvious applications in the auto industry. The conversion efficiency has been low, but advances in nanocomposite materials research have demonstrated a thermoelectric conversion efficiency of more than 20 percent in the laboratory, not very different from the internal combustion engine.
Lightweight Materials: Replacing steel with aluminum can reduce a vehicle’s weight by 40 to 60 percent. Magnesium as a replacement has a 60 to 75 percent benefit, and graphite fiber reinforced polymer composites, a 50 to 60 percent benefit [Carpenter et al. 2008]. The barrier to such replacements is simply the price tag. New opportunities lie in composites and nanostructured materials with tailored properties [Tjong and Ma, 2000; Wang et al. 2002], and development of new, affordable materials can have huge benefits.
Advanced Windows: Future window systems have the potential to reduce the amount of energy used for heating in the winter and cooling in the summer. Active façades could modulate daylighting and ventilation in response to detailed monitoring of interior conditions, and advanced daylight distribution systems that project daylight deeper into the interior could displace more than half of electric lighting used in commercial buildings.
Advanced Ventilation: Increased air conditioning demand has been the major driver of the growth in building energy usage. Natural ventilation has the potential to reduce the seasonal cooling energy requirements by 50 percent or more in many U.S. climates. A better understanding of the fundamental fluid mechanical behavior could improve design and control of ventilation and enhance indoor air quality.
Ultrathin Insulators: Very thin insulators can provide a practical means of retrofitting existing buildings for improved energy efficiency. Nanoscience and nanotechnology research offer opportunities for achieving such a goal.
Thermodynamic Cycles: Major efficiency losses in heat pumps are caused by inefficiencies in the heat transfer process. Nanomaterials and nanofluids offer the possibility of decreasing thermal losses in conductivity and convection.

92 | ENERGY FUTURE: Think Efficiency American Physical Society • September 2008
Behavioral Research: A wide array of factors clearly influence how people reach their decisions involving energy usage. Behavioral research into the way energy decisions are made, implemented and accepted, including economic, cultural and psychological factors that affect priority setting, would contribute significantly to designing incentives for increased energy efficiency, facilitating the performance of markets and arriving at regulatory practices where they are needed.

American Physical Society • September 2008 ENERGY FUTURE: Think Efficiency | 93
There are enormous opportunities for achieving greater energy efficiency by replacing inefficient conversion processes with efficient ones. For example, in the transportation sector, gasoline engines that are only 20 percent efficient might be replaced with fuel cells that are up to 60 percent efficient coupled to electric motors that are more than 90 percent efficient. In the case of lighting, incandescent bulbs that are only 5 percent efficient can be replaced with fluorescent bulbs having an efficiency of 20 percent today, and, when we learn to control the bandgap and color of semiconductor lighting, with light-emitting diodes having efficiencies of 50 percent or more.
Replacing an inefficient conversion process with an efficient one may pose long-term challenges if major barriers stand in the way. Often, the barriers remain resistant to incremental technological advances. In some cases they can only be surmounted through transformational basic research discoveries that reveal new phenomena or new behavior. In other cases, even if the basic phenomena are understood, long-term applied research may be needed to overcome the barriers.
Two examples of the latter that have relevance for transportation are nanostructured membranes, which can separate small molecules such as carbon dioxide and water based on their molecular conformation, and battery electrodes, which can maintain their optimized nanoscale “morphology” through millions of ionic charge–discharge cycles. In both cases we have a good understanding of the basic phenomena, but in neither case is our knowledge sufficient to allow us to apply the scientific principles to specific purposes, such as intelligent tuning of engine operation matched to changing driving conditions.
We highlight key examples of long-term research that is needed to advance the critical technologies for the transportation and building sectors.
1. Fuel CellsFuel cells offer the promise of efficient energy use in applications from electricity production for
distribution on the grid to transportation in cars and light trucks. The viability of fuel cells is shown by a recent test of fuel cell vehicles that achieved 52 to 58 percent efficiency running at 25 percent power [Wipke et al., 2007]. While such efficiencies demonstrate viability, they must be extended to higher power levels to make fuel cells for transportation competitive with internal combustion engines in the commercial market.
The basic fuel cell design is well established by now, much as the basic design of the internal combustion engine was established a century ago. Decreasing the cost of fuel cell production and increasing fuel cell performance and durability represent today’s major technological challenges. Electrode materials, catalysts, and electrolytic membranes offer the most promising research opportunities for meeting those challenges. We believe that dramatic improvements in these areas are well within reach, if materials science breakthroughs that have occurred through basic research within the last five years serve as any guide [Crabtree and Dresselhaus, 2008].
One example of a pertinent advancement pertains to the use of platinum as a catalyst in motor vehicle applications. The catalytic converter in the exhaust system of cars and trucks is well known to motorists. But platinum catalysts are also essential components in fuel cells used by hydrogen vehicles. Until now, platinum’s natural scarcity, high demand and consequential high price have posed major barriers to its widespread application as a facilitator of oxygen reduction in fuel cell cathodes. But a recent basic research discovery has shown that adding nickel to the second and third layers beneath the exposed pure platinum surface enhances the catalytic activity ten times over, thereby significantly reducing the amount of platinum needed in a fuel cell cathode and the consequential cost of the fuel cell [Stamenkovic, 2007].
C h a p t e r 4 E n d n o t e s

94 | ENERGY FUTURE: Think Efficiency American Physical Society • September 2008
2. Batteries and Electrical Energy StorageElectrical energy storage in batteries, supercapacitors and other media is central to achieving
energy efficiency in electricity production and transportation. The diurnal cycle of electricity demand requires that utility companies vary the production of electricity by as much as 100 per cent within any single 24 hour period.
For base load operation, utility companies employ sophisticated combined-cycle plants designed for continuous operation. But to meet peak demand, the companies typically use simple single-cycle gas turbines that minimize capital costs and operate well below the efficiency of the more sophisticated plants. Because they operate only a few hours a week, some utility companies still use old, coal-fired “peaker” plants that, by and large, emit significantly greater quantities of carbon dioxide than the base load plants. However, if effective electricity storage existed at the utility scale level, it could bridge the diurnal demand cycle and eliminate or significantly reduce the need for inefficient peaker plants.
Large-scale electrical storage is also required if solar and wind power are to become major contributors to our nation’s electricity production. These renewable resources operate on intermittent production cycles, and if they are in widespread use, they will have to be matched to demand with a response time of several minutes or at most a few hours. Unless a large-scale energy storage medium accompanies a large-scale solar or wind generating plant, it will be extremely difficult for the power grid to accommodate the intermittent nature of those plants.
As we noted in the chapter on transportation, inefficient fossil-fueled cars can be replaced with efficient all-electric vehicles only when high energy-density batteries become widely available at a reasonable cost. Such batteries do not exist today, and their absence constitutes the primary obstacle to extensive penetration of electric vehicles in the transportation sector. If electric vehicles become prevalent, in principle they could help level the diurnal cycle, since they would mostly be recharged at night. In a sense they would serve as a natural, large-scale, distributed storage medium for electricity.
The technological challenges for electrical energy storage, like those for fuel cells, lie in electrochemical materials and processes. For example, in the case of the current generation of lithium-ion batteries, the lithium-ion density at the cathode and anode serve as limitations on the energy density of the battery. And as lithium ions are inserted and extracted at the electrode surfaces during charging and discharging, the electrodes degrade and the cycle lifetime of the battery suffers.
Novel materials provide a wide horizon and rich promise for improving batteries. Consider the case of the lithium-ion battery anode, for example. There silicon nanowires can store ten times the energy density of the conventional graphite anode, while still maintaining a delicate surface structure as lithium ions are inserted and extracted [Chan et al., 2008]. But achieving similarly dramatic improvements in the performance of the lithium-ion battery system as a whole will require equivalent materials advances in the other components. It will also require integration of new technologies that will allow the components to work effectively in partnership. If there is one overwhelming bottleneck for optimizing the energy density of lithium-ion batteries today, it lies in the cathode material. Silicon nanowires might be able to provide a tenfold improvement over the theoretical limit for materials presently being used [Tarascon and Armand, 2001].
In the longer term, developing batteries that transfer two or more charges in the electrochemical reactions at the electrode surfaces represents the greatest challenge and the greatest research opportunity. Success depends on finding a new class of electrode materials with valence greater than one, such as the alkali earths or transition metals. The potential increase in energy density grows with the number of electrons transferred in the basic electrochemical reaction, so that fourfold or greater improvements beyond the best lithium-ion battery technology are conceivable.

American Physical Society • September 2008 ENERGY FUTURE: Think Efficiency | 95
Supercapacitors offer an alternative and a complement to batteries for storing electrical energy. In contrast to batteries, which are most efficient when charging or discharging occurs at a slow, constant rate, supercapacitors can store and release electricity very rapidly. In electric cars, batteries are well suited to steady highway driving, but supercapacitors are more compatible to starting, stopping and high-speed acceleration.
Despite rapid progress in the development of supercapacitors in recent years, their stored energy density remains smaller than that provided by batteries. The challenge for supercapacitor research currently lies in the development of high-density charge storage at metal-electrolyte interfaces. Nanostructured interfaces that can store multiple charges at a single site are needed. Recent results indicate that the capacitance of porous interfaces increases 200-300 hundred percent as the pore size decreases below 1 nm. Further research in understanding and controlling this remarkable nanoscale phenomenon is clearly needed, and it is likely to be very fruitful.
3. Solid-State LightingLighting consumes 22 percent of the electricity we use, and it provides a basic human need that is
common to many human activities. The incandescent bulb, the staple of the lighting industry since the time of Thomas Edison, remains a major source of light in industrialized countries, particularly in the residential sector. But as we have already noted, incandescent lamps typically convert only 5 percent of their energy into visible light.
The Federal Energy Independence and Security Act of 2007 requires that by 2012–2014 common light bulbs use 70 to 80 percent of the energy used by present-day incandescent lamps. And by 2020, the act requires that new bulbs use no more than 65 percent of the energy of present-day incandescent lamps. Meeting the new standards will require using different technologies.
Today’s high-efficiency fluorescent lamps, for example, convert 20 percent of their energy into light and offer a reasonable approach to meeting the 2012–2014 standard. But it seems virtually impossible that fluorescent lamps will improve sufficiently for them to play a dominant role in 2020. Solid-state lighting offers a far more promising approach.
Commercially available solid-state light-emitting semiconductors already rival high-efficiency fluorescent bulbs in reducing energy consumption, and in the future they promise to offer conversion efficiencies of 50 percent or more [Phillips et al., 2007]. Solid-state lighting not only provides a path to reduced energy utilization, as required by the 2007 federal law, but the dramatically higher efficiency of light-emitting semiconductors makes them natural partners with solar cells and batteries that can free lighting from the electricity grid in many applications.
Solid-state lighting has already penetrated the commercial market for specialty uses, such as traffic lights, road signs and architectural lighting. But most of these applications involve colored light. Where white light is needed, semiconductors face significant challenges, both in cost and technology. Producing white light requires combining colors, and the available phosphors and the available bandgaps currently provided by semiconducting materials limit the nature and quality of the resulting white spectrum. Materials research in doping and defect control of semiconductors and in the development of new efficient phosphors offers fertile ground for science and technology investment [Humphreys, 2008].
4. CatalystsCatalysts exert enormous influence over the speed and selected outcomes of chemical reactions.
The biological world provides the most dramatic example of their impact on the efficiency of energy conversion [Kraut, Carroll and Herschlag, 2003]. Catalysts that have taken millions or billions of years to evolve control virtually every biological energy process. They regulate the metabolic pathways of reproduction and growth with minimal energy input, using energy ultimately derived from the Sun.

96 | ENERGY FUTURE: Think Efficiency American Physical Society • September 2008
Biological catalysts are enzymes of elaborate structure and functionality, orchestrating every step of the reaction process, from the placement and orientation of reactants to the seamless hand-off of products from one catalytic environment to the next. Human-engineered catalysts, by comparison, are astonishingly simple, typically providing only a fraction of the speed and selectivity of their biological counterparts. At a relatively primitive stage of development for now, they offer an extraordinary opportunity for research to drive them toward the capabilities already demonstrated by biological catalysts.
Catalysts can play a central role in raising energy efficiency [Gates et al., 2008]. In the transportation sector, for example, hybrid and plug-in hybrid cars would benefit from more selective, faster and more stable electro-catalysts that significantly increase the chemical-to-electrical conversion efficiency in batteries. In the case of hydrogen vehicles, fuel cells currently depend on platinum catalysts to convert chemical energy into electricity. Replacing platinum—which is scarce and expensive—with another material remains a critical technology barrier and a major research challenge.
Although this report treats end-use efficiency, we pause to note that catalysis technology can have significant import for energy production and distribution. For example, as easy-to-reach resources of conventional oil continue to dwindle, the nearly untapped supply of heavy carbon-rich shale-oil or tar sands are likely to assume increasing importance. But extracting and refining these heavy liquid fuels efficiently remains a technological challenge. Developing new catalysts to promote the refining of shale oil and tar sands ultimately will determine whether they can provide petroleum products at reasonable financial and energy costs.
One of the major inefficiencies in our present use of energy is its once-through character. We extract the energy contained in fossil fuels by first converting the fuels into carbon dioxide and water and then exhausting the products into the environment. If we could use the Sun’s energy and any excess heat from inefficient energy processes to replace the chemical energy removed by combustion, we could convert the waste products into hydrocarbons and hydrogen for re-use. Developing catalysts that could promote the specific reconstituting reactions poses a major research challenge and opportunity.
Rapid advances in nanoscience and nanotechnology during the past 5 years have created the potential for converting catalysis from an empirical art into a fundamental science capable of targeting specific reactions and producing materials that promote them. Such a transformational objective is clearly within sight, and it warrants significant increases in the support of fundamental research on nanoscale materials and mechanisms of catalysis.
5. Thermoelectric DevicesOur present patterns of energy use are remarkably inefficient. On the way to its end use, more than
55 percent of the primary energy we generate is lost to waste heat [PCAST 2006]. Harnessing that heat for productive energy use provides a major opportunity for improving energy efficiency. Thermoelectric devices offer a simple route to capturing waste heat and converting it directly to electricity at its source [DiSalvo, 1999; Dresselhaus, et al., 2007].
The thermoelectric conversion process is fairly easy to understand. Electrons moving from hot to cold regions of a semiconductor create an electric current proportional to the thermal gradient—the temperature difference between the two regions divided by the distance between them. Neither moving parts nor chemical reactions are required to generate the electric current, and the thermoelectric conversion takes place within a homogeneous material. The efficiency of a thermoelectric device is characterized by a figure of merit that depends on the temperature at which the device is operating, its electrical conductivity, its thermal conductivity and a parameter known as the Seebeck coefficient, or thermoelectric power.
Only a decade ago, the figure of merit of the best thermoelectric devices was about unity, relegating

American Physical Society • September 2008 ENERGY FUTURE: Think Efficiency | 97
them to niche markets and the research laboratory. But in recent years, rapid advances in nanocomposite materials research have raised the figure of merit to 2.5, corresponding to a thermoelectric conversion efficiency of more than 20 percent, not very different from the internal combustion engine.
Thermoelectric devices that either use electricity to produce cooling directly or use waste heat to generate electricity directly have obvious applications in the auto industry. Some of the devices are already penetrating the auto air-conditioning market with electrically driven, seat-mounted coolers producing passenger comfort on hot days and using much less energy than full compartment air conditioning. Their use for this purpose is expected to increase dramatically during the next five years.
Thermoelectric converters that exploit the waste heat produced by an internal combustion engine can power the increasing number of auxiliary electrical devices used in cars and trucks, such as windows, locks, windshield wipers, lights, GPS navigation systems, video displays and audio for cell phones and digital music sources. If a thermoelectric device could completely replace a vehicle’s alternator, it would save 2 to 10 percent of the primary chemical energy of the vehicle’s fuel.
In hybrid vehicles, thermoelectric devices could have an added advantage. Whenever the internal combustion engine is running, thermoelectric devices could capture a sizeable fraction of the engine’s waste heat, convert it into electricity and store the resulting energy in the vehicle’s battery. Regenerative braking, which hybrid vehicles currently employ, functions in a similar fashion, capturing up to half of the vehicle’s kinetic energy, converting it into electricity and storing the resulting energy in the battery, rather than turning it into heat as is done with conventional breaking.
To achieve a high figure of merit, the current generation of thermoelectric materials uses multilayer geometries that scatter “phonons” and thereby lower the thermal conductivity of the device, but they do not scatter the electrons that carry the converted thermal energy as a current [Harman et al., 2002]. High-performance multilayer materials are presently made only from deposited films that are not sufficiently robust or available in sufficiently large quantities for the necessary applications.
For thermoelectric devices to be deployed broadly, either bulk materials must be found that possess the same properties as the multilayer materials and can be produced in larger quantities and at lower cost, or other approaches must be found to raise the figure of merit. Nanoscale compositional doping as a means of introducing peaks in the “density of states” of the material is one possible approach [Dresselhaus et al., 2007].
We believe that investing in research to advance the application of nanoscale phenomena in bulk materials for thermoelectric devices has high potential to recover much of the energy we now lose to waste heat.
6. Lightweight MaterialsLightweight materials present a major opportunity for reducing the amount of energy used in
transportation, as we have already pointed out. By most estimates, lowering the weight of a vehicle by 40 percent will increase its energy efficiency by 25 percent. Such weight reductions are well within the technical reach of materials now known in the laboratory or used in specialty applications. For example, replacing steel with aluminum can reduce a vehicle’s weight by 40 to 60 percent. Magnesium is even better, offering a 60 to 75 percent reduction, and graphite fiber reinforced polymer composites offer a 50 to 60 percent reduction [Carpenter et al., 2008].
The barrier to such replacements is simply the price tag. Using present technology to manufacture components with such lightweight materials, in fact, can increase the costs of the parts by 50 to 200 percent compared to today’s standard materials. Reducing the costs must be a major objective of any science and technology program, and it will be difficult to achieve with “single-phase” materials, such

98 | ENERGY FUTURE: Think Efficiency American Physical Society • September 2008
as aluminum, magnesium and titanium, whose properties and production routes are well known and capped by the limited variability of their compositions and structures. Therefore, we believe the greatest long-term basic research and long-term applied research opportunities for lightweight materials lie in composites and nanostructured materials with tailored properties [Tjong and Ma 2000; Wang et al., 2002].
Composites are still in their infancy and comprise a wide range of potential material constituents, morphologies, compositions, and internal structures. Additionally, composites can exhibit properties that are normally contradictory, such as high strength and flexibility; optical transparency and electrical conductivity; or high ductility and stiffness. With so many variables in play, there are many possibilities for low-cost manufacturing and new, desirable properties.
The carbon nanotube provides one example of the wide array of opportunities for lightweight new materials. This simple material has a tensile strength of 65 gigapashcals (GPa), approximately 100 times greater than steel, combined with a density one-fifth to one-sixth lower than that of steel.
The carbon nanotube demonstrates but one instance of the combination of properties that can be accessed with new materials. We believe that the innovation opportunities are immense, and that applied research into new lightweight composite and nanostructured materials with tailored properties has a very high potential to improve energy efficiency in transportation.
7. Advanced WindowsDeveloping more efficient windows with higher insulation values and selective control of the
solar spectrum has been the goal of considerable research in recent years. It is now possible to construct windows that exhibit a net energy gain during the winter if they are properly oriented. Such windows allow the solar energy entering a room to exceed the heat energy that leaves it.
But additional research is needed to make the high-performance windows affordable for retrofit applications, especially in the case of residential buildings. Using nanotechnology to produce transparent high-R-value panels offers one possible path forward.
Future window systems and active façades have the potential to achieve net energy gains during the winter and substantially reduce air conditioning loads in the summer. They would adjust daylighting, solar gains and ventilation in response to detailed monitoring of interior conditions. In the case of commercial structures, innovative materials and mirrored systems offer the possibility of distributing daylight much deeper into the building interiors, with projected reductions of 50 percent in average lighting energy usage.
8. Advanced VentilationNatural ventilation systems can reduce the seasonal cooling energy requirements by 50 percent
or more in many U.S. climates, while improving human comfort and satisfaction, according to research findings. But natural ventilation requires a façade that has controllable apertures and an interior design that ensures adequate airflow throughout the structure. For a mixed-mode building, that is not an easy undertaking.
To ensure sufficient airflow for all interior spaces while meeting indoor air quality and fire code standards requires a detailed understanding of fluid dynamics, turbulent flow and thermal behavior in a large multiconnected space under a variety of heat loads and wind conditions. But finding a complete solution to the equations governing turbulent flow in a large, complex building is a daunting task, and simple computational models may introduce unacceptable errors.
There is a serious need to develop straightforward, mixed-mode, natural-ventilation design

American Physical Society • September 2008 ENERGY FUTURE: Think Efficiency | 99
tools for building architects and engineers. There is also a need to develop effective ways to control natural-ventilation systems under a wide range of conditions.
The influence of indoor air quality on health and productivity is an important issue that is now receiving significant public scrutiny. Further research is needed to identify pollutants, the sources of the pollutants, the limits on acceptable concentration levels and whole-building control measures for volatile organic compounds, mold and other asthma triggers.
9. Ultrathin InsulatorsInsulating materials in common use today are limited in their effectiveness due to the heat transfer
characteristics of the gases contained in their interiors. As a result, the exterior walls of buildings and the walls of refrigerators must be relatively thick to achieve high levels of insulation. Aerogels represent the first advance in developing materials that utilize submicron-sized pores to limit the heat transfer through gas molecules in their interiors.
Nanopore materials hold the promise of reducing both thermal radiation and conduction energy transfer. They offer the possibility of developing thin, rigid, high-R-value insulation panels suitable for retrofitting the interior surfaces of exterior walls in existing homes without requiring a major renovation of the interior geometry. They could also find applications in appliances such as refrigerators and ovens.
Current windows have far lower insulation levels than the adjacent walls. Oriented nanostructures hold the possibility for developing transparent panels that substantially increase insulation levels while maintaining sufficient clarity for window applications.
In the high-performance thermal insulation materials currently in use, heat transfer by means of radiation plays an important role. For example, at room temperature, infrared radiation accounts for one-third to one-half of the total heat transfer in foam and fiberglass insulation. Tailored nanoparticles added to such insulation could act as reflectors of infrared radiation, substantially reducing the radiative heat loss and increasing the R-value of the material by as much as 100 percent.
10. Thermodynamic CyclesHeating represents the largest single energy use in residential buildings, and burning fossil fuels
for low-temperature applications is a very inefficient use of the commodity from the standpoint of thermodynamics. Combining heat and power systems at the single building or community level can provide substantial energy savings. Heat pumps can also provide greater efficiency.
But today, heat pumps have a coefficient of performance—the ratio of thermal energy delivered to electrical energy consumed—of only 2.5 to 3. By contrast, the ideal reversible heat pump, a “Carnot cycle,” has a coefficient performance of 14 for the same limits between ambient and interior temperature. The large efficiency losses in existing heat pumps are caused, in part, by the sizeable temperature differences that occur across the heat-transfer surfaces in the evaporators and condensers. Improving the heat exchangers is a major research challenge.
Techniques currently being explored for cooling integrated circuits in computers offer a possible approach to the problem. In the case of integrated circuits, surfaces with microgrooves have displayed a tenfold improvement over conventional heat transfer devices. Other techniques include boundary layer enhancement, such as that used in improved cooling of interiors of gas turbine blades; nanotechnology applications, such as those considered for improving thermal conductivity of thermal fins; and nanofluids, such as those envisioned for enhancing overall convective heat transfer.
Considerable work, especially in Europe, has identified ways to reduce building energy used in

100 | ENERGY FUTURE: Think Efficiency American Physical Society • September 2008
cold climates. But finding ways to accomplish that in warm and humid climates is a more challenging problem. As the population continues to increase in such regions, the need for a solution grows.
Finally, the amount of energy consumed in cooling large computer server facilities—now equal to the energy used by the computers themselves—is a mounting problem. The development of a novel system integration of heat pumps and air conditioners within the computer facility could generate considerable energy savings. For example, systems using liquid-cooled radiant panels along with intelligent controls and variable speed compressors could reduce overall energy requirements for air conditioning by one-third or more. The development of dehumidification technologies would also be extremely beneficial.
11. Behavioral ResearchConsumers, companies and governments frequently use criteria other than energy efficiency in
arriving at decisions and formulating policies involving energy. Often cost or convenience is the driving factor, with energy efficiency relegated to a lower priority. A survey conducted in 2007, at a time when gas prices already exceeded $3 per gallon, showed that new car buyers still ranked energy efficiency sixteenth in priority, well below leading factors such as reliability, safety and purchase price [German, 2007]. With gasoline costing more than $4 per gallon today, consumer sentiment has changed.
The efficiency of energy usage ultimately depends on the judgments millions of corporate, government and citizen decision-makers reach in their daily activities, in their homes and on their jobs. Improving end-use energy efficiency requires an understanding of how people arrive at their judgments. Therefore, we believe that social research into human behavior and decision-making must be a high priority.
Although a wide array of factors clearly influence how people reach their decisions involving energy usage, the availability of information is surely one of them. But understanding how the information is best presented, how the consequences of personal and public decisions are best explained and how people are likely to process the knowledge they acquire are essential to the success of any attempt to improve end-use energy efficiency.
Behavioral research into the way energy decisions are made, implemented and accepted, including economic, cultural and psychological factors that affect priority setting, would contribute significantly to designing incentives for increased energy efficiency, facilitating the performance of markets and arriving at regulatory practices where they are needed.
Many of the challenges presented in these endnotes are described more comprehensively in the 2002-2007 U.S. Department of Energy’s Basic Energy Needs Workshop Series (www.sc.doe.gov/bes/reports/list.html) and in the 2008 Materials Research Society report, Harnessing Materials for Energy [Arunachalam and Fleischer, 2008].

American Physical Society • September 2008 ENERGY FUTURE: Think Efficiency | 101
V. S. Arunachalam and E. L. Fleischer, eds., • MRS Bulletin 33 (4), (2008).
J. A. Carpenter, Jr., J. Gibbs, A. A. Pesaran, L. D. Marlino and K. Kelly, “Road Transportation •Vehicles,” MRS Bulletin 33 (4), 439 (2008).
G. W. Crabtree and M. S. Dresselhaus, “The Hydrogen Fuel Alternative,” • MRS Bulletin 33 (4), 421 (2008).
C. K. Chan, H. Peng, G. Liu, K. McIlwrath, X. F. Zhang, R.A. Huggins and Y. Cui, “High-•Performance Lithium Battery Anodes Asing Silicon Nanowires,” Nature Nanotechnology 3, 31 (2008).
F. J. DiSalvo, “Thermoelectric Cooling and Power Generation,” • Science 285, 703 (1999).
M. S. Dresselhaus, G. Chen, M. Y. Tang, R. G. Yang, H. Lee, D. Z. Wang, Z. F. Ren and J. P. •Fleurial, P. Gogna, “New Directions for Low-Dimensional Thermoelectric Materials,” Advanced Materials 19, 1043 (2007).
B. C. Gates, G. W. Huber, C. L. Marshall, P. N. Ross, J. Siirola and Y. Wang, “Catalysts for •Emerging Energy Applications,” MRS Bulletin 33 (4), 429 (2008).
J. German, quoting Strategic Vision, 2007 New Vehicle Experience Study, American Honda •Motor Co. (2007).
T. C. Harman, P. J. Taylor, M. P. Walsh and B. E. LaForge, “Quantum Dot Superlattice •Thermoelectric Materials and Devices,” Science 297, 2229 (2002).
C. Humphreys, “Solid State Lighting,” • MRS Bulletin 33 (4), 459 (2008).
D. A. Kraut, K. S. Carroll and D. Herschlag, “Challenges in Enzyme Mechanism and Energetics,” •Annu. Rev. Biochem. 72, 517 (2003).
PCAST (President’s Council of Advisors on Science and Technology), The Energy Imperative. •Technology and the Role of Emerging Companies (2006), www.ostp.gov/PCAST/pcast.html.
V. R. Stamenkovic, B. Fowler, B. S. Mun, G. Wang, P. N. Ross, C. A. Lucas and N. M. Markovic, •“Improved Oxygen Reduction Activity on Pt3Ni (111) via Increased Surface Site Availability,” Science 315, 493 (2007).
J.M. Tarascon and M. Armand, “Issues and Challenges Facing Rechargeable Lithium Batteries,” •Nature 414, 359 (2001).
S. C. Tjong and Z.Y. Ma, “Microstructural and Mechanical Characteristics of • In Situ Metal Matrix Composites,” Materials Science and Engineering 29, 49 (2000).
Y. Wang, M. Chen, F. Zhou and E. Ma, “High Tensile Ductility in a Nanostructured Metal,” •Nature 419, 912 (2002).
K. Wipke, S. Sprik, H. Thomas and J. Kurtz, Learning Demonstration Interim Progress Report—•Summer 2007, National Renewable Energy Laboratory tech. rep no. 560–41848, 2007; www.nrel.gov/docs/fy070sti/41848.pdf (accessed January 2008).
C h a p t e r 4 R e f e r e n c e s

102 | ENERGY FUTURE: Think Efficiency American Physical Society • September 2008
Energy Efficiency: Meeting 1 Thursday August 30, 2007Location: Washington, DC
Panel Discussion One: Overview of Federal Energy Efficiency Programs
Office of Management & Budget – Kevin CarrollDepartment of Energy, Office of Science – Harriet KungDepartment of Energy, Office of Energy Efficiency & Renewable Energy - David RodgersNational Institute of Standards & Technology – Hunter Fanney
Panel Discussion Two: Industry Perspectives on Energy Efficiency
Electric Power Research Institute – Revis JamesSun Microsystems – Mark Monroe
Panel Discussion Three: NGO Activities to Advance Energy Efficiency
American Council for an Energy Efficient Economy – Bill PrindleSierra Club – Dave HamiltonEnergy Futures Coalition – Reid Detchon
________________________________________________________
Friday August 31, 2007Location: Washington, DC
Panel Discussion Four:Overview of Policy Context: Federal & State Levels
Congressional Research Service – Fred SissineAlliance to Save Energy – Joe Loper
Panel Discussion Five:Basic Research Areas in Energy Efficiency
Lawrence Berkeley National Laboratory – Mark Levine
California Energy Commission – Art Rosenfeld

American Physical Society • September 2008 ENERGY FUTURE: Think Efficiency | 103
Energy Efficiency: Meeting 2 Monday, October 30, 2007Location: Washington, DC
Transportation: American Honda Motor Company – John GermanAdvanced Automotive Batteries – Menahem Anderman
Advanced Materials: ThermoelectricsLawrence Berkeley National Laboratory - Arun Majumdar
CombustionSandia National Laboratories - Terry Michalske
Solid State LightingSandia National Laboratories - Julia Philips
Buildings & Equipment California Public Utilities Commission - Dian GrueneichLawrence Berkeley National Laboratory - Stephen Selkowitz
The Electric Grid Electric Power Research Institute - Omar Siddiqui Lawrence Livermore National Laboratory - Alan Lamont Electric Power Research Institute - Don Von Dollen
_______________________________________________________
Tuesday, October 30, 2007Location: Stanford, CA
Lunch Guest SpeakerUniversity of California’s Office of Federal Government Relations – Michael Telson

104 | ENERGY FUTURE: Think Efficiency American Physical Society • September 2008
Study Group Biographies
ChairBurton Richter is a Nobel Laureate (Physics 1976), member of the National Academy of Sciences, and a past president of both the American Physical Society and the International Union of Pure and Applied Physics. He is the Paul Pigott Professor Emeritus at Stanford University and the former Director of the Stanford Linear Accelerator Center, one of the DOE’s science laboratories. His scientific career has been mostly in High Energy Physics. For the past decade he has spent most of his time on energy issues and currently chairs a DOE advisory committee on nuclear waste treatment. He has been or is a member of many advisory committees to both industry and government.
Vice-Chair David Goldston served as Chief of Staff of the House Committee on Science from 2001-2006. The Committee’s jurisdiction includes the civilian research and development programs of the Department of Energy. He has been a Visiting Lecturer at the John F. Kennedy School of Government at Harvard University and a Visiting Lecturer and Practitioner-in-Residence in the Science, Technology and Environmental Policy Program at Princeton University’s Woodrow Wilson School of Public and International Affairs. He also writes the monthly column “Party of One” on Congress and science policy for the journal Nature.
George Crabtree is a Senior Scientist a and Distinguished Fellow at Argonne National Laboratory and Director of its Materials Science Division. He has won several research awards, including the Kamerlingh Onnes Prize in 2003 for his work on high-temperature superconductivity. He has served as Chairman of the Division of Condensed Matter Physics of the American Physical Society, as a Founding Editor of the scientific journal Physica C, and as a Divisional Associate Editor of Physical Review Letters. Recently, he served as an organizer and spokesperson for the Department of Energy’s Workshops on Basic Research Needs for the Hydrogen Economy and for Solar Energy. The DOE awarded Dr. Crabtree for Outstanding Scientific Accomplishment in Solid State Physics in 1982, 1985, 1995, and 1997.
Leon Glicksman, Professor of Building Technology and Mechanical Engineering, has been the head of MIT’s Building Technology Program in the Department of Architecture for the past nineteen years. He has worked on research and consulting related to energy-efficient building components and design, indoor airflow and indoor air quality. He developed the simulation program for heat pumps, which forms the basis for one of the most popular heat pump programs available today. He did basic studies to improve thermal insulation for buildings during the period when CFCs were removed from insulation. He worked on energy efficient urban housing for China. He led a study of the application of natural ventilation to buildings to improve indoor air quality and reduce energy use for air conditioning. He is the author of over 200 papers in the area of energy and heat transfer. Among his awards are the Melville Medal of the American Society of Mechanical Engineers and the Robert T. Knapp Award of the Fluids Engineering Division of ASME. He is also the Associate Editor for the International Journal of Heating, Ventilating, Air-Conditioning and Refrigerating Research. He is a Fellow of the ASME.

American Physical Society • September 2008 ENERGY FUTURE: Think Efficiency | 105
Study Group Biographies
David Goldstein is Co-director of the Natural Resources Defense Council and has worked on energy efficiency and energy policy since the early 1970s. He is a Fellow of the American Physical Society and the recipient of its Leo Szilard Award for Physics in the Public Interest. He received a MacArthur Fellowship in 2002 and is the recipient of the California Alumni Association’s 2003 Award for Excellence in Achievement. David was a Founding Director of the Consortium for Energy Efficiency and the New Buildings Institute, and negotiated the agreement that led to the National Appliance Energy Conservation Act of 1987. He has been instrumental in the development of energy efficiency standards for new buildings and appliances that are currently in effect at the regional and national level in the United States, Russia, Kazakhstan, and China.
David Greene is a Corporate Fellow of Oak Ridge National Laboratory in the Center for Transportation Analysis and has spent 30 years researching transportation and energy policy issues for the U.S. government. His research interests include energy and transportation demand modeling, economic analysis of petroleum dependence, modeling market responses to advanced transportation technologies and alternative fuels, and economic analysis of policies to mitigate greenhouse gas emissions from transportation. Dr. Greene has published more than 200 articles on these subjects in professional journals, books and technical reports. His research has been recognized by awards from the Transportation Research Board, the International Association for Energy Economics, the Society of Automotive Engineers, and the U.S. Department of Energy. He has served on numerous National Research Council Committees dealing with transportation and energy issues, and is a lifetime National Associate of the National Academies.
Daniel Kammen is the founding Director of the Renewable and Appropriate Energy Laboratory at the University of California, Berkeley where he is the Class of 1935 Distinguished Professor of Energy, with appointments in the Energy and Resources Group and the Goldman School of Public Policy. He is the Co-Director of the Berkeley Institute of the Environment. Kammen was the recipient of the 1993 21st Century Earth Award, which recognizes contributions to rural development and environmental conservation, and in 2007 was named a Distinguished Citizen by the Commonwealth Club of California for his work on sustainable energy. Dr. Kammen helped develop the interdisciplinary Science, Technology, and Environmental Policy (STEP) Program at Princeton, which he chaired from 1997-1999. He has served on Intergovernmental Panel on Climate Change working groups and special reports, and is a Fellow of the American Physical Society, and a Permanent Fellow of the African Academy of Sciences. He has authored over two hundred journal publications and reports, and a book titled “Should We Risk It?”

106 | ENERGY FUTURE: Think Efficiency American Physical Society • September 2008
Mark D. Levine was director of the Environmental Energy Technologies Division, a leader in research on buildings energy efficiency, indoor air quality, and clean energy technologies, at Lawrence Berkeley National Laboratory from 1996-2006. Dr. Levine’s passion in the past two decades has involved analyzing and promoting energy efficiency in China. He is a board member of four leading non-profits in the United States and one in Asia. He has founded two successful non-profits, including the acclaimed Beijing Energy Efficiency Center. He is a member of the Energy Advisory Board of Dow Chemical Company and the Advisory Board of the Asian Pacific Energy Research Centre in Tokyo. In 1999, he was elected a fellow of the California Council on Science and Technology. In addition to authoring numerous technical publications, Dr. Levine has led a series of high-profile studies: he had overall responsibility for the IPCC chapters on mitigating carbon emissions in buildings; he was co-leader of the report “Scenarios for a Clean Energy Future” and of a major study of energy and carbon futures of China. He led a major study for the World Energy Council assessing global prospects for energy efficiency.
Michael Lubell is the Director of Public Affairs of The American Physical Society (APS) and Professor of Physics at the City College of the City University of New York (CCNY), where he was Department Chair from 1999 to 2006. He has held fellowships from the U.S. Atomic Energy Commission, the National Science Foundation and the Alfred P. Sloan Foundation. He has carried out research in atomic, molecular, optical, nuclear and high-energy physics and has taught many courses on science and public policies at CCNY at Yale University. He is credited as being one of the pioneers of science lobbying in Washington and has served on many scientific advisory committees inside and outside government. He has been active in local, state and national politics for more than forty years and has been a consultant for several members of Congress. He is a Fellow of the APS and of the American Association for the Advancement of Science (AAAS).
Maxine Savitz served in the capacity of Deputy Assistant Secretary for Conservation for the DOE from 1979 – 1983. She was President of the Lighting Research Institute from 1983-1985, and a member of the California Council on Science and Technology, from 1997-2000, where she is currently a Fellow. Dr. Savitz recently retired as the General Manager for Technology Partnerships at Honeywell, Inc. During her career at Honeywell, she oversaw the development and manufacturing of innovative materials for the aerospace, transportation, and industrial sectors. She is currently a member of Advisory Boards at Sandia, Pacific Northwest, and Oak Ridge National Laboratories. Dr. Savitz was elected to serve a four-year term as the National Academy of Engineering’s Vice-President in 2006. She is Director of The Advisory Group, a management-consulting firm located in Washington, DC, where she advises on research and development management, energy and environmental policy, materials development, production and utilization, and technology transfer.
Study Group Biographies

American Physical Society • September 2008 ENERGY FUTURE: Think Efficiency | 107
Daniel Sperling is a Professor of Civil Engineering and Environmental Science and Policy, and founding Director of the Institute of Transportation Studies at the University of California, Davis. He is also Associate Director of the UC Davis Energy Efficiency Center and UC Davis Road Ecology Center. Dr. Sperling is an expert on transportation technology assessment, and environmental aspects of transportation policy. In the last 20 years, he has authored or co-authored over 200 technical papers and ten books. He was selected a National Associate of the National Academies in 2004, and awarded the 2002 Carl Moyer Memorial Award for Scientific Leadership and Technical Excellence by the Coalition for Clean Air. Most recently, Governor Arnold Schwarzenegger appointed Dr. Sperling to the California Air Resources Board (ARB).
Study Group Research Staff
Fred Schlachter is a Staff Scientist at the Lawrence Berkeley National Laboratory, on leave from the Advanced Light Source. His research interests span a wide range in atomic and molecular physics using a variety of large particle accelerators. He has lived in France and Germany, has been a Visiting Professor at the University of Paris, and is presently Visiting Professor at Chiang Mai University in Thailand. Fred has organized many international schools and conferences in the United States and abroad. He is co-author of an article in Scientific American titled “Making Ultrabright X-rays”; he is on the Board of Consulting Editors for the McGraw-Hill Encyclopedia of Science and Technology; and he is a Fellow of the American Physical Society.
John H. Scofield is a Professor of Physics & Astronomy at Oberlin College, where he has served for the past twenty years. He chaired his department from 2001-2005 and currently teaches a large, general-audience course on Energy Technology. Before joining the Oberlin faculty, Dr. Scofield was a Member of Technical Staff at AT&T Bell Laboratories in Holmdel, NJ. He has received multiple fellowships from NASA and the Associated Western Universities and has been awarded grants and contracts from the NSF, NASA, and Sandia National Laboratories. A condensed matter experimentalist by training, John’s research interests have shifted to energy-related topics including photovoltaic devices, photovoltaic arrays, green buildings, and wind energy (Scofield is Founder of the Oberlin Wind Power Initiative). His papers on these topics have appeared in IEEE, ASHRAE, and ASES (American Solar Energy Society) publications.
Study Group Biographies

h t t p : / / w w w . a p s . o r g / e n e r g y e f f i c i e n c y r e p o r t /
Notes108 | ENERGY FUTURE: Think Efficiency American Physical Society • September 2008
w w w . a p s . o r g

h t t p : / / w w w . a p s . o r g / e n e r g y e f f i c i e n c y r e p o r t /
NotesAmerican Physical Society • September 2008 ENERGY FUTURE: Think Efficiency | 109
w w w . a p s . o r g

AMERICAN PHYSICAL SOCIETYwww.aps.org
TM
h t t p : / / w w w . a p s . o r g / e n e r g y e f f i c i e n c y r e p o r t /