2010-2015 capital improvement program - mymonroe. opening
TRANSCRIPT
2010-2015 Capital Improvement Program July, 2009 Adopted by the Monroe County Legislature
Submitted By Maggie Brooks County Executive and The Monroe County Planning Board Linda A. Faubel, Acting Chairperson


8100 CityPlace • 50 West Main Street • Rochester, New York 14614 (585) 753-2000 • fax: (585) 753-2028 • www.monroecounty.gov
March 26, 2009
Hon. Maggie Brooks, County Executive 110 County Office Building 39 West Main Street Rochester, New York 14614 SUBJECT: PROPOSED 2010-2015 CAPITAL IMPROVEMENT PROGRAM Dear Ms. Brooks: I am pleased to report that the Monroe County Planning Board on March 26, 2009 completed its review, public meetings and ranking process for their recommended 2010-2015 Capital Improvement Program (CIP). This proposed Capital Improvement Program is submitted to you in accordance with Section C4-10 of Article IV and Section C5-7 of Article V of the Monroe County Charter. The process used to review this capital program included direct discussion with County operating departments, citizens, and local government officials. The County Planning Board held three public information meetings and four Board meetings during the preparation of this proposed CIP. County departments and their staff are to be congratulated on what the Board considers a reasoned, well-planned six-year CIP. Public comments were given full consideration in evaluating project need and priorities. The Board supports the goal of establishing a fiscally responsible capital program that maintains the community’s infrastructure. The Board strongly urges the support of this CIP and its implementation. Sincerely, Linda A. Faubel, Acting Chairperson Monroe County Planning Board LAF/pj xc: James P. Smith, Deputy County Executive Judith Seil, Director, Department of Planning and Development


CONTENTS Summary 2010-2015 Capital Improvement Program 1
ADMINISTRATIVE SECTOR Board of Elections 11 Information Services 12 Planning and Feasibility Studies 13
HEALTH AND SOCIAL SERVICES SECTOR Community College 17 Community Hospital 21 County Library System 24
PHYSICAL SERVICES SECTOR Aviation 27 Environmental Services - Division of Pure Waters 35 Environmental Services - Fleet 41 Environmental Services - Geographic Information Services 42 Environmental Services – Solid Waste 43 Facilities Management 44 Parks 47 Transportation - Highways and Bridges 53 Transportation - Traffic Engineering 65 Water Authority 68
PUBLIC SAFETY SECTOR Office of the Sheriff 73 Public Safety 77
1
SUMMARY 2010-2015 CAPITAL IMPROVEMENT PROGRAM
Monroe County's Capital Improvement Program for 2010-2015 totals $490,487,000. Of this amount, $300,117,000 or 61% is for non-self-supporting programs - those administered by departments such as Public Safety, Parks, Highways, Bridges and Traffic Engineering and the Office of the County Sheriff. Federal aid, state aid and local county revenues fund these. Also, $190,370,000 or 39% is for self-supporting programs - those administered by departments such as Environmental Services, the Airport, and the Community Hospital. Operating and capital costs associated with these functions are generally covered by district and user service charges. A summary of the six-year program is provided in Table 1 - Summary Table. Year one of the 2010-2015 Capital Improvement Program totals $70,359,000. Of this amount, $41,579,000 or 59% is for non-self-supporting programs (of which the County contributes $26,189,000 or 63%), and $28,780,000 or 41%, is for self-supporting programs. County funding is 37% of the Grand Total for 2010. Major objectives of Monroe County's 2010-2015 Capital Improvement Program are to provide public facilities necessary to stimulate private investment and enhance economic development in Monroe County. We continue to improve transportation facilities, our Public Safety operations, the County's Pure Waters program, and the County's park system. The approximately $491 million in the total 2010-2015 Capital Improvement Program consists of: $ 121 million for Highways, Bridges and Traffic Engineering $ 104 million for the Greater Rochester International Airport $ 68 million for the Community College and Library System $ 43 million for Pure Waters construction projects $ 19 million for parks $ 29 million for Water Authority projects $ 10 million for projects at Monroe Community Hospital $ 38 million for Facilities, Information Services, Recycling and
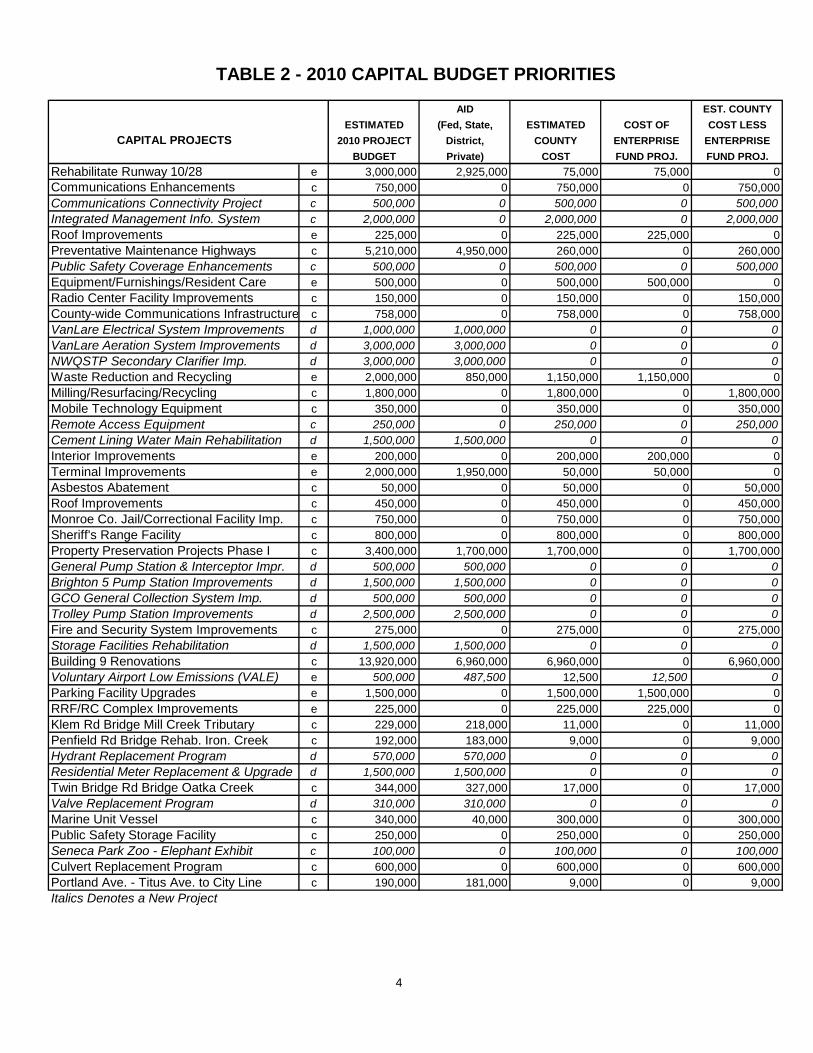
other programs $ 59 million for County Sheriff and Public Safety Services $ 491 million total program The 2010 Capital Budget The first year of the six-year Capital Improvement Program is adopted annually by the County Legislature in December as the capital budget for the ensuing fiscal year. The capital budget is the annual spending plan for capital improvements. In accordance with the County Charter, projects that are to be built in the first year of the six-year program are to be ranked on the basis of need in order of their relative priority. The County Planning Board, following their action on the recommended six-year program did this. Table 2 shows the projects listed in priority order. It should be emphasized that all projects are considered needed in 2010, even though their relative priorities are different.
Financing the County's Projects There are three sources of funds for financing the County's capital projects. These are general County revenues, project revenues and aid (state and federal). General County revenues primarily consist of property and sales taxes. Project revenues are made up of: 1) special district charges such as Pure Waters assessments; and 2) direct user fees such as fees for airport users, water consumption, or health care at the community hospital. The citizens who use or directly benefit from a project or activity pay some or all of its cost when user fees are charged. The state and federal governments also provide grants-in-aid for specific projects. Project Financing Project costs are paid from current operating cash or borrowing. The federal and state governments distribute grants-in-aid for specific projects and in a few instances, private parties, special districts or local governments contribute towards a portion of the project costs. Issuing bonds, a form of borrowing, frequently raises money for capital projects, which are then repaid with interest over a period of years. When using bonds, the County pledges its faith and credit and the repayment of the bonds legally has the first claim on all the County's general revenues such as property and sales taxes. Bond anticipation notes are issued by the County to borrow funds for the immediate costs of projects for which bonds have been authorized. They permit the County to delay the issuance of long-term bonds until state and federal aid is received and the actual cost of a project to the County is known. The notes then are generally converted to bonds. This helps the County keep its bonded debt at a minimum. The notes are generally issued for one year and may be renewed up to four times for a total of five years. Debt financing of capital projects permits beneficiaries of the facilities to share in their cost during the useful life of the facility and allows the County to undertake several projects immediately rather than delay construction until funds are available from the current operating budget. Debt Capacity In order to control the amount of debt which a county may incur, the New York State Constitution has established a debt limit equal to 7% of the five-year average full valuation of real property in the county. Debt related to water facilities improvements and certain other self-supporting items may be excluded from the limit. The economic realities of the ability to repay borrowed money are, however, more stringent and are independently judged by rating agencies such as Moody's Investor’s Service, Inc., Standard & Poor’s Rating Services and Fitch Ratings. If these agencies judge that the County’s ultimate ability to repay borrowed money has decreased, they lower the credit rating and the interest rate paid on funds borrowed in the future increases. Thus, it is important to manage the County's finances so as to maintain a good credit rating. Currently, Monroe County holds a “Baa2” rating from Moody's Investors Services, Inc., a “BBB+” rating from Standard and Poor’s Ratings Services and a “BBB” rating from Fitch Ratings.

2
TABLE 1 - SUMMARY TABLE
Budget ANNUAL PROJECT COST Total CostPROGRAM AREA 2010 2011 2012 2013 2014 2015 6 YearsADMINISTRATIVE SECTORBOARD OF ELECTIONS - 2010-2015TOTAL c 0 0 1,000,000 0 0 0 1,000,000
DEPARTMENT OF INFORMATION SERVICES - 2010-2015TOTAL c 758,000 713,000 195,000 461,000 72,000 752,000 2,951,000
PLANNING AND FEASIBILITY - 2010-2015TOTAL c 260,000 280,000 300,000 325,000 350,000 400,000 1,915,000
c=county funds 1,018,000 993,000 1,495,000 786,000 422,000 1,152,000 5,866,000TOTAL ADMINISTRATIVE SECTOR 1,018,000 993,000 1,495,000 786,000 422,000 1,152,000 5,866,000
HEALTH AND HUMAN SERVICES SECTORMONROE COMMUNITY COLLEGE - 2010-2015c = county funds c 8,660,000 3,696,000 3,610,000 4,910,000 7,970,000 4,500,000 33,346,000s = state SUNY s 8,660,000 3,696,000 3,610,000 4,910,000 7,970,000 4,500,000 33,346,000TOTAL 17,320,000 7,392,000 7,220,000 9,820,000 15,940,000 9,000,000 66,692,000
MONROE COMMUNITY HOSPITAL - 2010-2015 TOTAL e 2,175,000 2,300,000 1,700,000 1,450,000 1,450,000 1,450,000 10,525,000
MONROE COUNTY LIBRARY SYSTEM - 2010-2015c = county funds c 64,000 100,000 400,000 200,000 100,000 100,000 964,000TOTAL 64,000 100,000 400,000 200,000 100,000 100,000 964,000
c=county funds 8,724,000 3,796,000 4,010,000 5,110,000 8,070,000 4,600,000 34,310,000s = state funds 8,660,000 3,696,000 3,610,000 4,910,000 7,970,000 4,500,000 33,346,000e = enterprise fund 2,175,000 2,300,000 1,700,000 1,450,000 1,450,000 1,450,000 10,525,000TOTAL HEALTH/HUMAN SERVICES SECTOR 19,559,000 9,792,000 9,320,000 11,470,000 17,490,000 10,550,000 78,181,000
PHYSICAL SERVICES SECTORDEPARTMENT OF AVIATION - 2010-2015e = enterprise fund 1,637,500 320,000 3,198,750 542,500 787,500 3,312,500 9,798,750s = state funds 137,500 320,000 198,750 542,500 787,500 312,500 2,298,750f = federal funds 5,225,000 12,160,000 7,552,500 20,615,000 31,925,000 13,875,000 91,352,500TOTAL 7,000,000 12,800,000 10,950,000 21,700,000 33,500,000 17,500,000 103,450,000
PURE WATERS - 2010-2015TOTAL d 12,000,000 9,000,000 11,500,000 3,500,000 4,500,000 2,500,000 43,000,000
ENVIRONMENTAL SERVICES/FLEET - 2010-2015TOTAL c 252,000 256,000 241,000 335,000 575,000 479,000 2,138,000
GEOGRAPHIC INFORMATION SERVICES - 2010-2015TOTAL c 0 0 0 0 0 300,000 300,000
SOLID WASTE - 2010-2015e = enterprise fund 1,375,000 210,000 210,000 500,000 900,000 0 3,195,000s = state funds 800,000 0 0 0 0 0 800,000u = user fees 50,000 0 0 0 0 0 50,000TOTAL 2,225,000 210,000 210,000 500,000 900,000 0 4,045,000
ENGINEERING AND FACILITIES MANAGEMENT - 2010-2015TOTAL c 2,375,000 5,950,000 4,275,000 6,525,000 2,375,000 4,525,000 26,025,000
PARKS - 2010-2015TOTAL c 2,360,000 2,900,000 3,100,000 3,285,000 3,400,000 3,500,000 18,545,000

3
TABLE 1 - SUMMARY TABLE
Budget ANNUAL PROJECT COST Total CostPROGRAM AREA 2010 2011 2012 2013 2014 2015 6 YearsHIGHWAYS AND BRIDGES - 2010-2015c = county funds 3,710,000 4,670,000 6,147,000 7,275,000 19,148,000 18,751,000 59,701,000f = federal funds 5,632,000 9,422,000 6,556,000 1,937,000 3,140,000 11,684,000 38,371,000s = state funds 1,058,000 1,769,000 1,174,000 364,000 589,000 2,191,000 7,145,000TOTAL 10,400,000 15,861,000 13,877,000 9,576,000 22,877,000 32,626,000 105,217,000
TRAFFIC ENGINEERING - 2010-2015c = county funds 1,150,000 2,100,000 2,400,000 2,700,000 2,900,000 3,700,000 14,950,000f = federal funds 0 800,000 0 0 0 0 800,000TOTAL 1,150,000 2,900,000 2,400,000 2,700,000 2,900,000 3,700,000 15,750,000
WATER AUTHORITY - 2010-2015TOTAL d 5,380,000 4,735,000 6,190,000 6,345,000 6,700,000 0 29,350,000
c = county funds 9,847,000 15,876,000 16,163,000 20,120,000 28,398,000 31,255,000 121,659,000f = federal funds 10,857,000 22,382,000 14,108,500 22,552,000 35,065,000 25,559,000 130,523,500s = state funds 1,995,500 2,089,000 1,372,750 906,500 1,376,500 2,503,500 10,243,750d=district 17,380,000 13,735,000 17,690,000 9,845,000 11,200,000 2,500,000 72,350,000e = enterprise fund 3,012,500 530,000 3,408,750 1,042,500 1,687,500 3,312,500 12,993,750u = user fee 50,000 0 0 0 0 0 50,000TOTAL PHYSICAL SERVICES SECTOR 43,142,000 54,612,000 52,743,000 54,466,000 77,727,000 65,130,000 347,820,000
PUBLIC SAFETY SECTOROFFICE OF THE SHERIFF - 2010-2015c = county funds 1,850,000 1,500,000 3,000,000 1,100,000 2,330,000 950,000 10,730,000s = state funds 40,000 0 0 0 0 0 40,000TOTAL 1,890,000 1,500,000 3,000,000 1,100,000 2,330,000 950,000 10,770,000
PUBLIC SAFETY SERVICES - 2010-2015TOTAL c 4,750,000 8,250,000 7,250,000 5,300,000 10,400,000 11,900,000 47,850,000
c = county funds 6,600,000 9,750,000 10,250,000 6,400,000 12,730,000 12,850,000 58,580,000s = state funds 40,000 0 0 0 0 0 40,000TOTAL PUBLIC SAFETY SECTOR 6,640,000 9,750,000 10,250,000 6,400,000 12,730,000 12,850,000 58,620,000
ALL SECTORSc = county funds 26,189,000 30,415,000 31,918,000 32,416,000 49,620,000 49,857,000 220,415,000f = federal funds 10,857,000 22,382,000 14,108,500 22,552,000 35,065,000 25,559,000 130,523,500s = state funds 10,695,500 5,785,000 4,982,750 5,816,500 9,346,500 7,003,500 43,629,750d=district 17,380,000 13,735,000 17,690,000 9,845,000 11,200,000 2,500,000 72,350,000e = enterprise fund 5,187,500 2,830,000 5,108,750 2,492,500 3,137,500 4,762,500 23,518,750u = user fee 50,000 0 0 0 0 0 50,000TOTAL ALL SECTORS 70,359,000 75,147,000 73,808,000 73,122,000 108,369,000 89,682,000 490,487,000
4
AID EST. COUNTYESTIMATED (Fed, State, ESTIMATED COST OF COST LESS
CAPITAL PROJECTS 2010 PROJECT District, COUNTY ENTERPRISE ENTERPRISEBUDGET Private) COST FUND PROJ. FUND PROJ.
Rehabilitate Runway 10/28 e 3,000,000 2,925,000 75,000 75,000 0Communications Enhancements c 750,000 0 750,000 0 750,000Communications Connectivity Project c 500,000 0 500,000 0 500,000Integrated Management Info. System c 2,000,000 0 2,000,000 0 2,000,000Roof Improvements e 225,000 0 225,000 225,000 0Preventative Maintenance Highways c 5,210,000 4,950,000 260,000 0 260,000Public Safety Coverage Enhancements c 500,000 0 500,000 0 500,000Equipment/Furnishings/Resident Care e 500,000 0 500,000 500,000 0Radio Center Facility Improvements c 150,000 0 150,000 0 150,000County-wide Communications Infrastructure c 758,000 0 758,000 0 758,000VanLare Electrical System Improvements d 1,000,000 1,000,000 0 0 0VanLare Aeration System Improvements d 3,000,000 3,000,000 0 0 0NWQSTP Secondary Clarifier Imp. d 3,000,000 3,000,000 0 0 0Waste Reduction and Recycling e 2,000,000 850,000 1,150,000 1,150,000 0Milling/Resurfacing/Recycling c 1,800,000 0 1,800,000 0 1,800,000Mobile Technology Equipment c 350,000 0 350,000 0 350,000Remote Access Equipment c 250,000 0 250,000 0 250,000Cement Lining Water Main Rehabilitation d 1,500,000 1,500,000 0 0 0Interior Improvements e 200,000 0 200,000 200,000 0Terminal Improvements e 2,000,000 1,950,000 50,000 50,000 0Asbestos Abatement c 50,000 0 50,000 0 50,000Roof Improvements c 450,000 0 450,000 0 450,000Monroe Co. Jail/Correctional Facility Imp. c 750,000 0 750,000 0 750,000Sheriff's Range Facility c 800,000 0 800,000 0 800,000Property Preservation Projects Phase I c 3,400,000 1,700,000 1,700,000 0 1,700,000General Pump Station & Interceptor Impr. d 500,000 500,000 0 0 0Brighton 5 Pump Station Improvements d 1,500,000 1,500,000 0 0 0GCO General Collection System Imp. d 500,000 500,000 0 0 0Trolley Pump Station Improvements d 2,500,000 2,500,000 0 0 0Fire and Security System Improvements c 275,000 0 275,000 0 275,000Storage Facilities Rehabilitation d 1,500,000 1,500,000 0 0 0Building 9 Renovations c 13,920,000 6,960,000 6,960,000 0 6,960,000Voluntary Airport Low Emissions (VALE) e 500,000 487,500 12,500 12,500 0Parking Facility Upgrades e 1,500,000 0 1,500,000 1,500,000 0RRF/RC Complex Improvements e 225,000 0 225,000 225,000 0Klem Rd Bridge Mill Creek Tributary c 229,000 218,000 11,000 0 11,000Penfield Rd Bridge Rehab. Iron. Creek c 192,000 183,000 9,000 0 9,000Hydrant Replacement Program d 570,000 570,000 0 0 0Residential Meter Replacement & Upgrade d 1,500,000 1,500,000 0 0 0Twin Bridge Rd Bridge Oatka Creek c 344,000 327,000 17,000 0 17,000Valve Replacement Program d 310,000 310,000 0 0 0Marine Unit Vessel c 340,000 40,000 300,000 0 300,000Public Safety Storage Facility c 250,000 0 250,000 0 250,000Seneca Park Zoo - Elephant Exhibit c 100,000 0 100,000 0 100,000Culvert Replacement Program c 600,000 0 600,000 0 600,000Portland Ave. - Titus Ave. to City Line c 190,000 181,000 9,000 0 9,000Italics Denotes a New Project
TABLE 2 - 2010 CAPITAL BUDGET PRIORITIES

5
AID EST. COUNTYESTIMATED (Fed, State, ESTIMATED COST OF COST LESS
CAPITAL PROJECTS 2010 PROJECT District, COUNTY ENTERPRISE ENTERPRISEBUDGET Private) COST FUND PROJ. FUND PROJ.
Exterior, Site and Utility Improvements e 600,000 0 600,000 600,000 0Infrastructure Improvements e 650,000 0 650,000 650,000 0Ellison Park Area Master Plan Imp. c 1,000,000 0 1,000,000 0 1,000,000North Greece Rd. Bridge Northrup Creek c 875,000 831,000 44,000 0 44,000Traffic Engineering c 400,000 0 400,000 0 400,000Spot Improvement Projects c 550,000 0 550,000 0 550,000Planning and Feasibility c 260,000 0 260,000 0 260,000General Improvements c 500,000 0 500,000 0 500,000Hall of Justice Court Requested Imp. c 300,000 0 300,000 0 300,000Hall of Justice Reconstruction c 800,000 0 800,000 0 800,000Powder Mills Park Master Plan and Imp. c 100,000 0 100,000 0 100,000Culver Rd - Atlantic/Clifford (City) c 960,000 0 960,000 0 960,000Buildings and Structures c 500,000 0 500,000 0 500,000Utilities, Access and Site Improvements c 500,000 0 500,000 0 500,000Seneca Park - Master Plan Improvements c 160,000 0 160,000 0 160,000Equipment/Vehicles Parks c 121,000 0 121,000 0 121,000Equipment/Vehicles Highways and Bridges c 131,000 0 131,000 0 131,000City of Rochester Traffic Features c 200,000 0 200,000 0 200,000Library System Automation c 64,000 0 64,000 0 64,000
GRAND TOTALS 70,359,000 38,982,500 31,376,500 5,187,500 26,189,000Italics Denotes a New Project
TABLE 2 - 2010 CAPITAL BUDGET PRIORITIES

6
User Charges Projects, activities and services for which the specific users or beneficiaries can be identified and to whom the benefits of the service can be confined, lend themselves to charging user fees. The products and services of the private sector of our economy are of this nature and are called 'private goods'. To the extent that a capital project has the characteristics of private goods, it becomes feasible to support an appropriate portion of its debt service and operating costs through direct charges to those who benefit from it. This permits the County to offer this service with little or no dependence on general tax support for the project, allowing more public monies to be allocated to other public services. Projects for the following are financed primarily by user charges without taxpayer support in Monroe County: the Airport; Water Authority; Monroe Community Hospital; the Pure Waters Division of the Department of Environmental Services; and the Solid Waste Division of the Department of Environmental Services.
Special Assessments Projects, which benefit a specific group of properties, can have the financing and construction of these public improvements financed through special assessment arrangements. The costs of extending a water or sewer line can be assessed against the abutting properties rather than charged against the taxpayers as a whole. Special assessments are often paid in installments over a number of years and cover both the expenditure and the financing. This form of financing is rarely used in Monroe County. Sources of Funding The various sources of funding for the Capital Improvement Program can be found indicated in the Table 1 - Summary Table and in the graphic below titled 2010-2015 CIP Source of Funds.
2010-2015 CIP Source of Funds
Federal Funds26.6%
State Funds8.9%
District Funds14.8% County Funds
44.9%
Enterprise Funds4.8%
Private/UserFees/Trust Funds
0.0%
Fiscal Policy and Debt Service In preparing Monroe County's 2010-2015 Capital Improvement Program, great care was taken to insure sound fiscal management. This is necessary to assure: 1) That the County is able to finance approved projects as
they reach implementation stage; 2) That the State constitutional debt limit is not exceeded; 3) That the County maintains a good credit rating so as to
minimize the cost of borrowing funds for capital projects;
4) That the annual repayment cost for the debt incurred is kept within reasonable limits so as not to overburden County taxpayers.
Monroe County uses only a small portion of its State constitutional debt limit. The objective is to maintain an annual debt service burden that is clearly within the County’s ability to pay. In evaluating projects for inclusion in the CIP, two sets of criteria are used: 1) For projects to be funded by State, Federal and other
aid or whose local costs will be financed by user charges, the criteria are: • the project is needed and appropriate; and • it can be financed with the aid or user charges and
thus not entail a general County budget charge. 2) For projects to be funded in whole or in part with
general County budget funds, the criteria are: • out of all the projects that need to be done, this
project's priority is high enough to be funded; and • the aggregate annual cost of all approved projects
should be kept within reasonable limits so as not to overburden County taxpayers.
All debt obligations shall be issued with extreme care including debt of those enterprises for which the County is contingently liable. The County Administration’s debt policy provides that debt shall be issued to finance capital projects where other funding sources are not immediately available. The debt will be structured in the most efficient manner to limit the impact on the taxpayer and will take payment of existing debt obligations into consideration as well as the total projected operating cost of the County. The use of cash capital through the operating budget will be utilized to finance projects with a short useful life or with costs estimated at $100,000 or less or for portions of the cost of other projects as financial and budgetary conditions permit without placing undue pressures on the taxpayers. The Monroe County Legislature included $100,000 in the 2009 County Budget for cash capital purposes. Debt may be issued for cash flow purposes if needed. Any and all debt issues will be structured and sold in accordance with sound debt management practices.

7
Capital Project Operating Cost Impacts Article VII, Section A7-1, of the Monroe County Code requires that the Capital Improvement Program include "... the estimated effect of each capital project in the first two (2) years of the program upon operating costs of the county within each of the three (3) fiscal years following completion of the project." The Operating Budget impact (including debt service) is detailed under the heading "Estimated Annual Impact on the Operating Budget" included in the descriptions for each project. Net County Debt Service Projections The overall debt service impacts of the projects to be funded in whole or in part with general County budget funds is displayed in Table 2 - Net Debt Service Projection. Typically, these projects are related to County operations contained within the General, Road, Library, and Internal Service Funds.
Table 3 - NET DEBT SERVICE PROJECTION (000'S)
DEBT SERVICE PROJECTION
2010
ESTIMATE
2011
ESTIMATE
2012
ESTIMATE
2013
ESTIMATE
2014
ESTIMATE
2015
ESTIMATE
2010-2015 CIP DEBT:
$ 0
$ 2,800 $ 5,900 $ 9,100 $12,400 $17,500
AUTHORIZED BUT UNISSUED DEBT:
$ 5,600
$ 7,200
$ 7,300
$ 7,400
$ 7,500
$ 7,600 EXISTING DEBT:
$34,700
$27,000
$25,100
$23,700
$22,300
$17,300
TOTAL DEBT SERVICE PROJECTION:
$40,300
$37,000
$38,300
$40,200
$42,200
$42,400 Notes: 1) Debt that is offset by revenues from self-supporting areas such as the Airport, Pure Waters, Solid Waste (other than
the Resource Recovery Facility), Community Hospital is not included.
(2) The above projections are based on numerous assumptions including future interest rates and actual timing of construction of projects. Deviations in any of the actual data from the assumptions used may materially alter actual results. Thus, actual results will vary over time from these projections. The principal assumptions are:
• Bonds will bear 6% interest.
• Projected expenditures may not occur in the year programmed in the Capital Improvement Program.

8
THIS PAGE INTENTIONALLY LEFT BLANK