floo protetion capital improvement
TRANSCRIPT

Flood Protection Capital Improvements
2022–2026 Five-Year Capital Improvement Program :: III-1
FLOOD PROTECTION OVERVIEWOf the approximately 800 miles of creeks in Santa Clara County, Valley Water has jurisdiction over and manages approximately 275 miles to meet the Board’s Ends Policy E–3, “There is a healthy and safe environment for residents, businesses and visitors, as well as for future generations.” Valley Water’s goals are further defined in E-3.1, “Provide natural flood protection for residents, businesses, and visitors” and E-3.2, “Reduce potential for flood damages.” The 275 miles of creeks are located in five watersheds: Lower Peninsula, West Valley, Guadalupe, Coyote, and Uvas/Llagas. Valley Water administers an asset management program for its flood protection infrastructure. The program includes a schedule for maintenance and rehabilitation to ensure that each facility functions as intended throughout its useful life.
Fifty years of flood protection management has significantly reduced the intensity and frequency of flooding in Santa Clara County. By 2005, Valley Water had provided flood protection to 93,253 of the 166,526 parcels in the floodplain and another approximately 10,445 have been protected since then.
The voters in Santa Clara County have supported Valley Water’s flood protection efforts by approving benefit assessment funding in 1982, 1986, and 1990. Voters also approved three special parcel taxes. In 2000, voters approved the Clean, Safe Creeks and Natural Flood Protection Plan (Clean, Safe Creeks). The Clean, Safe Creeks Plan was replaced by the Safe, Clean Water and Natural Flood Protection Program, which voters approved in 2012 (2012 Safe, Clean Water). In 2020, voters approved the renewal of the Safe, Clean Water Program, which replaced the 2012 Safe, Clean Water Program in entirety. Unlike the first two special parcel taxes, which were set to sunset in 15-years from the date of implementation, the renewed Safe, Clean Water Program will continue until repealed by voters or until the Board determines the funding is no longer needed.
The renewed Safe, Clean Water Program - Fund 26, along with the Watershed and Stream Stewardship (1% ad valorem property tax) - Fund 12, are the two primary funding sources for flood protection projects.
Listed by watershed are the completed and current flood protection capital improvements, moving upstream from the completed downstream work or starting new work on creeks that have not had flood protection work.
Lower Peninsula Watershed Major Capital Improvements Completed
• San Francisquito Creek from the S.F. Bay to Highway 101 (Safe, Clean Water)
• Adobe Creek from El Camino to West Edith Ave.
• Matadero Creek from Palo Alto Flood Basin to Barron Creek
Major Capital Improvements Identified in the CIP
• Palo Alto Flood Basin Structure Improvements
• Permanente Creek from S.F. Bay to Foothill Expressway (2012 Safe, Clean Water)
• San Francisquito Creek from Highway 101 to Searsville Dam (Safe, Clean Water)
West Valley Watershed Major Capital Improvements Completed
• Calabazas Creek from Guadalupe Slough to Wardell Road
• San Tomas Creek from Southern Pacific Railroad to Cabrillo Avenue
• Saratoga Creek from San Tomas Creek to Lawrence Expressway
Major Capital Improvements Identified in the CIP
• Sunnyvale East and West Channels (Safe, Clean Water)
Guadalupe Watershed Major Capital Improvements Completed
• Guadalupe River–Lower from Alviso Marina to Interstate 880
• Guadalupe River–Downtown from Interstate 880 to Interstate 280

Flood Protection Capital Improvements
III-2 :: 2022–2026 Five-Year Capital Improvement Program
Major Capital Improvements Identified in the CIP
• Guadalupe River–Upper, Interstate 280 to Blossom Hill Road (Safe, Clean Water)
• Guadalupe River, Tasman Drive to I-880
Coyote Watershed Major Capital Improvements Completed
• Coyote Creek from S.F. Bay to Montague Expressway
• Lower Penitencia Creek from Coyote Creek to Tasman Drive
• Lower Silver Creek from Coyote Creek to Cunningham Ave. (Reaches 1-6)
• Cunningham Flood Detention Certtification
Major Capital Improvements Identified in the CIP
• Berryessa Creek from Calaveras Boulevard to Interstate 680 (2012 Safe, Clean Water)
• Berryessa Creek from Lower Penitencia Creek to Calaveras Boulevard (Safe, Clean Water)
• Coyote Creek Montague Expressway to Tully Road (Safe, Clean Water)
• Lower Penitencia Creek Improvements, Berryessa to Coyote Creeks
• Upper Penitencia Creek from Coyote Creek to Dorel Drive (Safe, Clean Water)
Uvas/Llagas Watershed Major Capital Improvements Completed
• Llagas Creek–Lower from Pajaro River to Buena Vista Avenue
• Uvas Creek
Major Capital Improvements Identified in the CIP
• Llagas Creek-Lower, Capacity Restoration from Buena Vista Avenue to Pajaro River
• Llagas Creek–Upper, Buena Vista Avenue to Llagas Road (Safe, Clean Water)
Multiple Watersheds Major Capital Improvements Identified in the CIP
• San Francisco Bay Shoreline (Safe, Clean Water)
• Watershed Asset Rehabilitation Program
CIP PLANNING PROCESS AND FINANCIAL ANALYSIS The annual CIP Planning Process starts with collecting information on proposed new capital projects in July, followed by the validation of proposed new projects, preliminary scoping, review and financial analyses to produce a Draft CIP in February.
The Board then authorizes release of the Draft CIP to the public and local municipalities for review, conducts a public hearing, and approves the resolution to adopt the Final CIP in May.
A financial analysis of the Watershed and Stream Stewardship Fund and Safe, Clean Water Fund, the funding sources for flood protection capitalimprovements, was conducted to determine if there are limitations to funding all of the projects proposed for the FY 2022-26 CIP.
Funding required for portions of several CIP projects is contingent on grants and partnership agreements that are under development and not currently secured. As Valley Water works through the process to secure funding, theproject schedules may be adjusted. Projects with unsecured funding include:
• San Francisquito Creek, upstream of Hwy 101• Upper Llagas, Phase 2 (Reaches 5, 6, 7B, 8, and 14)
Further, many of the flood protection projects under the renewed Safe, Clean Water Program include iey performance indicators (KPIs) for a preferred project, which requires federal funding, and for a local-funding only version of the project, which can be constructed if federal funding is not received.
Operations and Maintenance CostsIt is understood that new capital projects have an impact on future operations and maintenance, and this is included in the financial analysis. Periodically throughout the project, projections of this impact are updated to reflect changes in the project elements.
Significant Project Updates from the Prior Year Listed here are the changes to projects from the FY 2021-25 Adopted CIP:

Flood Protection Capital Improvements
2022–2026 Five-Year Capital Improvement Program :: III-3
• The Palo Alto Flood Basin Tide Gate Structure Improvements Project increased in cost by $6.3 million due to the extension of the project schedule by two years as a result of geotechnical recommendations to construct over 2.5 miles of levee trail surface improvements prior to constructing the tide gate structure in order to prevent structural damage to the exsisting levees.
• The San Francisco Bay Shoreline Project EIA 11 increased in cost by $36.3 million due to an increase USACE project construction costs for Reaches 1-3. Also, San Francisco Bay Shoreline, Other EIAs Project increased in cost by $40.8 million. The passing of Measure S for the SCW renewal means that funds for Phase II design and construction are now included in this Project.
• The Lower Berryessa, Lower Penitencia Creek to Calaveras Blvd. Project increased in cost by $22.7 million due to a three year extension in the overall project schedule and increase in construction phase costs.
• The Permanente Creek Flood Protection Project, Bay to Foothill Expwy. increased in cost by $6.1 million due to the discovery of cultural resources and ensuing project delays at the Rancho San Antonio Flood Detention Basin Project.
• The San Francisquito Flood Protection Project has been updated to include costs for the Newell Road Bridge Project element, which is being managed by the City of Palo Alto. The total project cost has increased in cost by $17.7 million due to the increase in right of way and construction phase costs based on assessments by San Francisquito Creek Joint Powers Authority (SFCJPA), of which Valley Water is a member agency.
• The Upper Llagas Flood Protection Projects increased in cost by approximately $48 million due to an increase in the construction cost estimates.
• The Upper Guadalupe River Project (SPRR to Blossom Hill Road R 7-12) increased by $8.7 million due to planned expenditures moved to future years to facilitate an agreement signed between the U.S. Army Corps of Engineers (USACE) and Valley Water on December 30, 2020 to conduct a Flood Risk Management general re-evaluation study.
• The Coyote Creek Flood Protection Project, Montague Expressway to Tully Road, has been updated to reflect that a portion of this project will be funded and constructed as part of the Anderson Dam Seismic Retrofit Project due to expedited flood management measures to coincide with the completion and start of operations of the Anderson Dam Tunnel Project.
The Safe, Clean Water Program The Renewed Safe, Clean Water Program, approved by voters in 2020, is set to begin in FY 2021-22 and includes the following flood protection projects:
• San Francisquito Creek, SF Bay to Middlefield Road
• Sunnyvale East & West Channels
• Upper Guadalupe River, I-280 to Blossom Hill Road
• Berryessa Creek from Lower Penitencia Creek to Calaveras Boulevard - Phase 3
• Coyote Creek, Montague Expy. to I-280
• Upper Penitencia Creek, Coyote to Dorel Drive
• Llagas Creek-Upper, Buena Vista Avenue to Llagas Road
• San Francisco Bay Shoreline - Design and Partial Construction of EIA 11 and Planning for other EIAs
With the exception of the Berryessa Creek from Lower Penitencia Creek to Calaveras Boulevard - Phase 3, each of these projects were also included in the 2012 Safe, Clean Water Program. Additionally, the following projects were considered complete under the 2012 Safe, Clean Water Program, as the KPIs had been delivered, but are still included in the CIP as they are in the close-out phase:
• Berryessa Creek from Calaveras Boulevard to Interstate 680 (2012 Safe, Clean Water)
• Permanente Creek, San Francisco Bay to Foothill Expy. (2012 Safe, Clean Water)
For more information about the Safe, Clean Water Program visit valleywater.org. Please see Appendix C for the implementation schedule for the Renewed Program.

III-4 :: 2022–2026 Five-Year Capital Improvement Program
Flood Protection Capital Improvements
III-4 :: 2022–2026 Five-Year Capital Improvement Program
FY 2020-21 Funds to be reappropriated
Project Number PROJECT NAME Through
FY20 FY21 FY21 Unspent FY22 FY23 FY24 FY25 FY26 FY27-36 TOTAL
LOWER PENINSULA WATERSHED
10394001 Palo Alto Flood Basin Tide Gate Structure Improvements 4,392 83 552 3,062 8,683 8,627 8,663 4,784 - 38,294
10244001s Permanente Creek, SF Bay to Foothill Expressway 108,572 7,645 178 - - - - - - 116,217
10284007s San Francisquito Creek, SF Bay thru Searsville Dam (E5) 62,751 370 1 12,720 24,300 6,885 - - - 107,026
WEST VALEY WATERSHED
26074002 Sunnyvale East and West Channels (E2) 35,438 2,033 17,302 - 1,003 14,014 11,970 6,772 260 71,490
GUADALUPE WATERSHED
30154019 Guadalupe River Tasman Dr - I-880 1,080 1,838 (1) 2,670 2,365 28,293 29,753 29,912 - 95,911
26154001s Guadalupe River–Upper, I-280 to Blossom Hill Road (E8) 134,642 - 23,964 562 33 34 36 37 41,873 177,217
26154001 Guadalupe Rv–Upper, Fish Passage Mods 2,651 - - - - - - - - 2,651
COYOTE WATERSHED
26174041 Berryessa Ck, Calaveras-I-680 - Corps 35,566 29 - - - - - - - 35,595
40174004 Berryessa Ck, Lower Penitencia Ck to Calaveras Blvd Phs 1 50,191 - 3,339 - - - - - - 50,191
26174043 Coyote Creek, Montague Expressway to Tully Road (E1) 15,036 2,199 2,528 1,598 6,661 11,166 22,382 3,895 - 62,937
40264011 Cunningham Flood Detention Certification 11,806 4 3 28 - - - - - 11,838
40334005 Lower Penitencia Ck Improvements, Berryessa to Coyote Cks. 11,287 7,745 7,503 230 8,021 628 322 - - 28,233
40264007s Lower Silver Creek, I-680 to Cunningham (Reach 4-6) 102,288 167 784 28 55 - - - - 102,538
40324003s Upper Penitencia Creek, Coyote Creek to Dorel Drive 19,016 3,898 5,038 113 218 2,067 1,599 4,449 8,573 39,933
UVAS LLAGAS WATERSHED
50284010 Llagas Creek–Lower, Capacity Restoration, Buena Vista Road to Pajaro River 6,947 - 2,763 - - - 3,240 3,462 391 14,040
26174051s Llagas Creek–Upper, Buena Vista Avenue to Llagas Road (E6) 125,315 47,476 4,555 58,292 58,521 32,386 9,435 1,496 - 332,921
MULTIPLE WATERSHEDS
00044026s San Francisco Bay Shoreline (E7) 71,469 48,316 1 24,036 4,666 37,581 4,919 10,344 17,755 219,086
62084001 Watersheds Asset Rehabilitation Program 35,831 3,531 7,809 10,910 2,566 2,646 2,730 2,829 121,531 182,574
TOTAL 912,689 136,052 76,319 126,537 117,977 144,704 95,323 70,086 263,632 1,867,000
Fund Number FUND NAME Through
FY20 FY21 FY21 Unspent FY22 FY23 FY24 FY25 FY26 FY27-36 TOTAL
12 Watershed Stream Stewardship Fund 373,615 72,394 25,452 50,848 24,310 74,054 45,101 43,218 186,977 870,517
26 Safe, Clean Water and Natural Flood Protection Fund 539,074 63,658 50,867 75,689 93,667 70,650 50,222 26,868 76,655 996,483
TOTAL 912,689 136,052 76,319 126,537 117,977 144,704 95,323 70,086 263,632 1,867,000
Flood Protection - Funding Sources ($K)
Flood Protection Capital Improvements ($K)
The following table is a project funding schedule for flood protection capital improvements resulting from this year's financial analysis. Detailed information for each project can be found in this document on the following pages in the order presented in this table. The chart also identifies partially funded projects and estimated unspent appropriation from FY 2020-21.
The following table shows funding requirements from each funding source for flood protection capital improvements.
The following table is a project funding schedule for flood protection capital improvements resulting from this year’s financial analysis. Detailed information for each project can be found in this document on the following pages in the order presented in this table. The chart also identifies partially funded projects and estimated unspent appropriation from FY 2020-21.

III-4 :: 2022–2026 Five-Year Capital Improvement Program 2022–2026 Five-Year Capital Improvement Program :: III-5
PPrroojjeecctt
PPrrooggrraamm
PPrroojjeecctt NNoo.. 10394001
CCoonnttaacctt Rechelle [email protected]
PPRROOJJEECCTT DDEESSCCRRIIPPTTIIOONN
e
e
e
ee
e
PPRROOJJEECCTT LLOOCCAATTIIOONN
Prepare an Emergency Action Plan and coordinate with the City of Palo Alto.
Reduce the possibility of flooding in lower reaches of Matadero, Adobe, and Barron Creeks.Adapt to future sea level rise scenarios.Coordinate with the Strategy to Advance Flood protection, Ecosystems and Recreation along San Francisco Bay project, the South Bay Shoreline project, and the Mountain View Ponds project.Protect habitat in the Palo Alto Flood Basin and around the work area.
This project plans, designs, and constructs a replacement tide gate structure for the Palo Alto Flood Basin to accomplish the following objectives:
Mitigate potential failure of the existing tide gates structure.
PPaalloo AAllttoo FFlloooodd BBaassiinn TTiiddee GGaattee SSttrruuccttuurree RReeppllaacceemmeennttFlood Protection - Lower Peninsula Watershed
View from the west side of the Palo Alto tide gates facing east

III-6 :: 2022–2026 Five-Year Capital Improvement Program
SSCCHHEEDDUULLEE && SSTTAATTUUSS Phase
EEXXPPEENNDDIITTUURREE SSCCHHEEDDUULLEE(in thousands $)
FFUUNNDDIINNGG SSCCHHEEDDUULLEE(in thousands $)
FFUUNNDDIINNGG SSOOUURRCCEESS(in thousands $)
OOPPEERRAATTIINNGG CCOOSSTT IIMMPPAACCTTSS
UUSSEEFFUULL LLIIFFEE: 50 Years
Operating cost impacts are expected to be around $25,000 per year starting in FY27. Closer analysis will be determined at the completion of the construction phase.
PPrroojjeecctt
10394001-Palo Alto Flood Basin Tide Gate Structure Replacement
PPrroojjeecctt
10394001-Palo Alto Flood Basin Tide Gate Structure Replacement
with inflation
03388,,229933
552
4,784 0
Actuals include project expenditures, and encumbrances.
8,300
8,627
3,062
FFYY2244
8,663
2,329
4,7848,627
FFYY2233
Other Funding Sources
3,6142,329
4,513
FY 29
FFYY2200
FFuuttuurree
0
8,6831,594
Adjusted Budget includes adopted budget plus approved budget adjustments.
AAddjj.. BBuuddggeett
EEsstt.. UUnnssppeenntt
38,2938,683
FFYY2255
SCVWD Watershed&Stream Stewardship Fund
83
FFYY2211FFYY2200
4,392
38,293
FFYY2266
8,663
TToottaall
FFYY2222
FY 31
Plan
Design
BBuuddggeett TThhrruu
November 2018 to March 2027
FY 23
TToottaall
2,557
32,380
90
36,970
FY 27FY 25FY 21 FY 22 FY 24 FY 26
38,293
PPllaannnneedd FFuunnddiinngg RReeqquueessttss
FFYY2266 FFuuttuurree
0
FFYY2244
Cost
1,068
36,970
PPllaannnneedd EExxppeennddiittuurreess
Construct
Closeout
FFYY2233
8,300
FFYY2222 FFYY2255FFYY2211
1,594 3,614
FY 28
8,320
Permits 798
FY 30
AAccttuuaallss TThhrruu TToottaall
III-6 :: 2022–2026 Five-Year Capital Improvement Program 2022–2026 Five-Year Capital Improvement Program :: III-7
PPrroojjeecctt
PPrrooggrraamm
PPrroojjeecctt NNoo.. 10244001s
CCoonnttaacctt Rechelle [email protected]
PPRROOJJEECCTT DDEESSCCRRIIPPTTIIOONN
e
e
e
e
e
PPRROOJJEECCTT LLOOCCAATTIIOONN
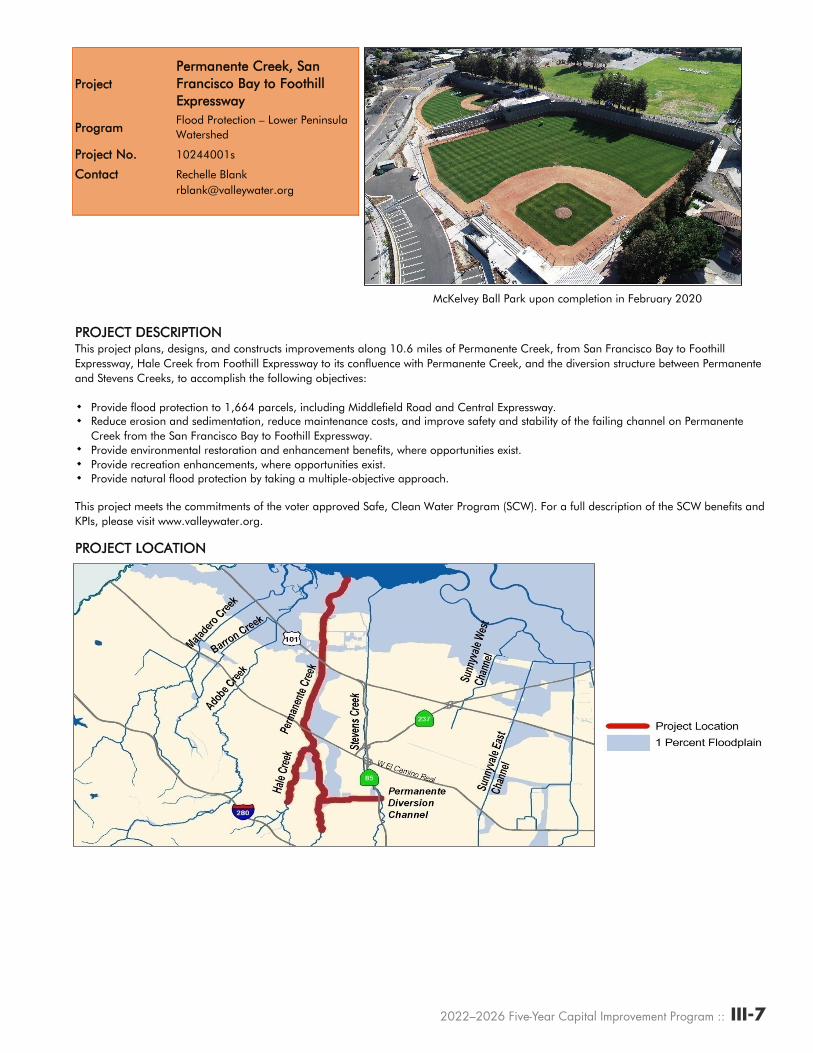
This project meets the commitments of the voter approved Safe, Clean Water Program (SCW). For a full description of the SCW benefits and KPIs, please visit www.valleywater.org.
Flood Protection – Lower Peninsula Watershed
Provide flood protection to 1,664 parcels, including Middlefield Road and Central Expressway.Reduce erosion and sedimentation, reduce maintenance costs, and improve safety and stability of the failing channel on Permanente Creek from the San Francisco Bay to Foothill Expressway. Provide environmental restoration and enhancement benefits, where opportunities exist.Provide recreation enhancements, where opportunities exist.Provide natural flood protection by taking a multiple-objective approach.
PPeerrmmaanneennttee CCrreeeekk,, SSaann FFrraanncciissccoo BBaayy ttoo FFooootthhiillll EExxpprreesssswwaayy
McKelvey Ball Park upon completion in February 2020
This project plans, designs, and constructs improvements along 10.6 miles of Permanente Creek, from San Francisco Bay to Foothill Expressway, Hale Creek from Foothill Expressway to its confluence with Permanente Creek, and the diversion structure between Permanente and Stevens Creeks, to accomplish the following objectives:
III-8 :: 2022–2026 Five-Year Capital Improvement Program
SSCCHHEEDDUULLEE && SSTTAATTUUSS Phase
EEXXPPEENNDDIITTUURREE SSCCHHEEDDUULLEE(in thousands $)
FFUUNNDDIINNGG SSCCHHEEDDUULLEE(in thousands $)
FFUUNNDDIINNGG SSOOUURRCCEESS(in thousands $)
OOPPEERRAATTIINNGG CCOOSSTT IIMMPPAACCTTSS
UUSSEEFFUULL LLIIFFEE: 30+ Years
Cost
PPrroojjeecctt FFYY2255 FFYY2266 FFuuttuurree
FY 31FY 21 FY 22 FY 23 FY 24 FY 25 FY 26
FFYY2233 FFYY2244
Permits 3,863 Construction includes multiple contract phases and three years of plant establishment monitoring.
The completion of this project is anticipated to increase operating costs by approximately $360,000 per year, beginning in FY21. Increases in operations and maintenance costs include sediment removal at three flood detention sites, and bypass channel inlet and outlet operations and maintenance.
SCVWD Watershed Stream Stewardship FundSCVWD Clean, Safe Creeks and Natural Flood Protection Fund
TToottaall
84,436
50
116,039
AAccttuuaallss TThhrruu PPllaannnneedd EExxppeennddiittuurreess TToottaall
FFYY2200 FFYY2211 FFYY2222
111166,,221177
AAddjj.. BBuuddggeettEEsstt..
UUnnssppeenntt
97,65317,541
Actuals include project expenditures, and encumbrances.
PPrroojjeecctt FFYY2200 FFYY2211
0
0
0
0
10,037
10,037
10,037
10,037
0
0
0
0
0
0
17,363
98,676
98,676
Plan
Design
26244001-Permanente Ck, Bay to Foothill Expwy – Clean, Safe Creeks Fund
FFuuttuurree
17,363
88,639
88,639
106,002
106,002
0
0
0
0
BBuuddggeett TThhrruu
116,039
116,039
0
0
0
0
PPllaannnneedd FFuunnddiinngg RReeqquueessttss TToottaall
17,363
FY 30
10,049
17,641
FY 27 FY 28 FY 29
10244001-Permanente Ck, Bay to Foothill Expwy – Lower Peninsula Fund
with inflation 17,363
TTOOTTAALL
with inflation
0
0
0
0
0
0
0
0
0
0
0
0
0
0
0
0
0
0
0
00
0
0
00
0
0
00
17,541
91,031
110088,,557722
0
7,645
77,,664455
178
0
117788
17,5410
FFYY2222 FFYY2233 FFYY2244 FFYY2255 FFYY2266
July 2001 to June 2021
0
0
Construct
Closeout
10244001-Permanente Ck, Bay to Foothill Expwy – Lower Peninsula Fund
0 00
with inflation
City of Mountain View 1,023
Adjusted Budget includes adopted budget plus approved budget adjustments. Allocated funding exceeds total planned expenditures by approximately $178,000. Excess funds will be returned to Fund Reserves at the close of the project.
98,676
111166,,221177
0
00
26244001-Permanente Ck, Bay to Foothill Expwy – Clean, Safe Creeks Fund
TTOOTTAALL
0
00
0
00

III-8 :: 2022–2026 Five-Year Capital Improvement Program 2022–2026 Five-Year Capital Improvement Program :: III-9
PPrroojjeecctt
PPrrooggrraamm
PPrroojjeecctt NNoo.. 10284007s
CCoonnttaacctt Rechelle [email protected]
PPRROOJJEECCTT DDEESSCCRRIIPPTTIIOONN
e
e
e
e
This project is accounted for in the following: (10284007 & 10284008 are Completed)e 26284001 – SF Bay through Searsville Dame 26284002 – Construction - San Francisco Bay to Middlefield Rd.
PPRROOJJEECCTT LLOOCCAATTIIOONN
Upstream face of Pope/Chaucer Street with water surface approximately two feet below the soffit
Flood Protection – Lower Peninsula Watershed
SSaann FFrraanncciissqquuiittoo CCrreeeekk,, SSaann FFrraanncciissccoo BBaayy tthhrroouugghh SSeeaarrssvviillllee DDaamm ((EE55))
This project provides coordination and support to the San Francisquito Joint Powers Authority, in partnership with the U.S. Army Corps of Engineers, to complete planning and design documents for an approved project alternative on San Francisquito Creek, from San Francisco Bay through Searsville Dam. This project will accomplish the following objectives:
Provide flood protection. Reduce bank erosion and sedimentation-related impacts along San Francisquito Creek. Avoid potential adverse impacts on fish and wildlife habitats.Minimize impacts to the creek's environmental resources and restore the riparian corridor where feasible.
The San Francisquito Flood Protection project will provide 100-year flood protection from San Francisco Bay to Highway 101 and replace two bridges between Highway 101 and Middlefield Road.
This project meets the commitments of the voter approved Safe, Clean Water Program (SCW), Project E5. For a full description of the SCW benefits and KPIs, please visit www.valleywater.org.

III-10 :: 2022–2026 Five-Year Capital Improvement Program
SSCCHHEEDDUULLEE && SSTTAATTUUSS Phase
EEXXPPEENNDDIITTUURREE SSCCHHEEDDUULLEE(in thousands $)
FFUUNNDDIINNGG SSCCHHEEDDUULLEE(in thousands $)
FFUUNNDDIINNGG SSOOUURRCCEESS(in thousands $)
OOPPEERRAATTIINNGG CCOOSSTT IIMMPPAACCTTSS
UUSSEEFFUULL LLIIFFEE: 30+ Years
Adjusted Budget includes adopted budget plus approved budget adjustments.
26284002-San Francisquito Ck - Construction - SF Bay to Middlefield Rd.
50,291 370 1 94,566
Actuals include project expenditures, and encumbrances.
92,391
with inflation 47,991 2,669 12,721 24,300 6,885 0 0
26284002-San Francisquito Ck - Construction - SF Bay to Middlefield Rd.
47,991
94,566
110044,,885511
110077,,002266
00
6622,,775511
10284007-San Francisquito Ck, Bay-Searsville Dam
26284001-San Francisquito Ck, Bay-Searsville Dam
TTOOTTAALL
4,064
6,782
110077,,0022661122,,772200
0
0
337700
0
0
66,,888855
0
00
0
00
0
12,720
002244,,330000
0
1,614
6,782 0 0 0
FFYY2211
0
0
00 0 0 0 0
24,300
11
06,885 0
00
000
0
02,669 12,721 22,775 6,235 0
00
0
0
0
22,,778800
4,0644,064
6,6716,671
1,614
1,6140
1122,,772211
0
0
0
00
00
0
0
FFYY2244
00
0
0
10284007-San Francisquito Ck, Bay-Searsville Damwith inflation
26284001-San Francisquito Ck, Bay-Searsville Damwith inflation
10284008-San Francisquito Ck, Early Implementation
with inflation
00
111111
0
0
00
0
00
0
PPrroojjeecctt
0
10284008-San Francisquito Ck, Early Implementation
00 0
0
FFYY2200
0
1,614
0
BBuuddggeett TThhrruu AAddjj.. BBuuddggeett EEsstt.. UUnnssppeenntt PPllaannnneedd FFuunnddiinngg RReeqquueessttss
00
These projects will have an estimated annual operating cost impact of approximately $250,000 beginning in FY24.
County and Corps participation are for Feasibility Study activities only. Additional funding will be negotiated during subsequent phases.
SCVWD Watershed Stream Stewardship Fund
SCVWD Safe, Clean Water and Natural Flood Protection Fund
TToottaall 110077,,002266
5,678
75,840
1,500County of San Mateo - In-kind Services
JPA and Member Agencies (D/S Funding) 5,508
San Francisquito Joint Powers Authority 11,040
Unsecured Grants and Partnerships (U/S Funding) 20,000
City of Palo Alto/Caltrans Grant (Newell Road Bridge) 8,941
TToottaall
4,064
FFYY2222 FFYY2233 FFYY2244 FFYY2255 FFYY2266 FFuuttuurree
0
FFuuttuurree
TToottaall
0
4,0644,064
6,7826,782
1,614
1,614
0
FFYY2255 FFYY2266
22,,778800
0
00
00002244,,330000
1122,,772211
AAccttuuaallss TThhrruu PPllaannnneedd EExxppeennddiittuurreess
104,851
TTOOTTAALL 66,,223355
66,,888855
00
with inflation
6600,,334400
6600,,334400
2222,,777755
00
PPrroojjeecctt FFYY2200 FFYY2211 FFYY2222 FFYY2233
Plan
Design
Construct
Closeout
74,324
100
21,371
CostJune 2003 to June 2024
4,637
Permits 1,665
FY 21 FY 22 FY 23 FY 24 FY 25 FY 26 FY 27 FY 28 FY 29 FY 30 FY 31

III-10 :: 2022–2026 Five-Year Capital Improvement Program 2022–2026 Five-Year Capital Improvement Program :: III-11
PPrroojjeecctt
PPrrooggrraamm
PPrroojjeecctt NNoo.. 26074002
CCoonnttaacctt Rechelle [email protected]
PPRROOJJEECCTT DDEESSCCRRIIPPTTIIOONN
e
e
e
PPRROOJJEECCTT LLOOCCAATTIIOONN
This project meets the commitments of the voter approved Safe, Clean Water Program (SCW) Project E2. For a full description of the SCW benefits and KPIs, please visit www.valleywater.org.
The Sunnyvale East and Sunnyvale West Channels were originally identified as separate projects. In order to improve efficiency by combining efforts, the planning, design and construction phases for both projects will be performed as a single effort.
In the early stages of the project design process, Valley Water project team decided to join both improvement projects into a single flood protection project with a single Environmental Impact Report to reduce construction costs and minimize construction coordination issues between the two channels.
The West Channel extends approximately three miles and upgrades existing channel capacity to provide 1% (or 100-year) riverine flood protection for 47 acres of highly valuable industrial lands. The East Channel extends approximately 6.4 miles and upgrades existing channel capacity to provide 1% riverine flood protection for 1,618 parcels. Both projects decrease channel turbidity and sediment by repairing erosion sites, thereby improving water quality.
SSuunnnnyyvvaallee EEaasstt aanndd WWeesstt CChhaannnneellss FFlloooodd PPrrootteeccttiioonn PPrroojjeecctt ((EE22))Flood Protection – West Valley Watershed
Sunnyvale West Channel looking south at Carl Road
Provides 1% flood capacity for approximately 6.5 miles of channel along Sunnyvale East and approximately three miles of channel along Sunnyvale West within the City of Sunnyvale, protecting 1,618 properties (Sunnyvale East) and 47 acres (11 properties) of industrial land (Sunnyvale West). Improves stream water quality by providing erosion control measures to decrease sediment and turbidity. Identifies opportunities to integrate recreation improvements with the City of Sunnyvale and others as appropriate.

III-12 :: 2022–2026 Five-Year Capital Improvement Program
SSCCHHEEDDUULLEE && SSTTAATTUUSS Phase
EEXXPPEENNDDIITTUURREE SSCCHHEEDDUULLEE(in thousands $)
FFUUNNDDIINNGG SSCCHHEEDDUULLEE(in thousands $)
OOPPEERRAATTIINNGG CCOOSSTT IIMMPPAACCTTSS
UUSSEEFFUULL LLIIFFEE: 30+ Years
The completion of this project is anticipated to increase operating costs by approximately $210,000 per year based on Operations & Maintenance forecasting, beginning in FY27. Increases in operations and maintenance costs include graffiti removal, vegetation management, rodent abatement, good neighbor maintenance, and encampment cleanup in areas where the City of Sunnyvale's joint use agreements are not applicable.
Other Funding SourceTToottaall
07711,,449900
26014,014
FFYY2233
817
AAddjj.. BBuuddggeett
FFUUNNDDIINNGG SSOOUURRCCEESS(in thousands $)
2,033 17,302 11,970
PPllaannnneedd FFuunnddiinngg RReeqquueessttss
FY 29
Plan
Design
Construct
FY 26
FFYY2211
TToottaall
69,242
71,49019,352
FFYY2233FFYY2222 FFYY2255FFYY2200
13,450
14,014
11,400
69,242
FY 28 FY 30FY 21 FY 22 FY 23 FY 27FY 25
Actuals include project expenditures, and encumbrances.
FFYY2244
PPrroojjeecctt
26074002-Sunnyvale East and West Channels Flood Protection Project (E2)
with inflation
PPrroojjeecctt
AAccttuuaallss TThhrruu
6,772
EEsstt.. UUnnssppeenntt
6,301
FFYY2244
26074002-Sunnyvale East and West Channels Flood Protection Project (E2)
Adjusted Budget includes adopted budget plus approved budget adjustments.
Permits 1,354
FY 31
FFYY2266 FFuuttuurree
12,660
49,174
200
3,272
26011,970
19,352
Cost
5,770
BBuuddggeett TThhrruu
FFYY2200
Closeout
SCVWD Clean, Safe Creeks and Natural Flood Protection Fund
200
TToottaall
71,4901,003
March 2006 to June 2027
FY 24
14,450
3,272 15,033
FFYY2211
817
PPllaannnneedd EExxppeennddiittuurreess
71,490
FFYY2266
6,772
FFuuttuurreeFFYY2255FFYY2222
035,438

III-12 :: 2022–2026 Five-Year Capital Improvement Program 2022–2026 Five-Year Capital Improvement Program :: III-13
PPrroojjeecctt
PPrrooggrraamm
PPrroojjeecctt NNoo.. 30154019
CCoonnttaacctt John [email protected]
PPRROOJJEECCTT DDEESSCCRRIIPPTTIIOONN
e
PPRROOJJEECCTT LLOOCCAATTIIOONN
This project plans, designs, and constructs improvements along the Guadalupe River from Tasman Drive to Interstate 880 to restore the 100-year flood conveyance capacity. The project will accomplish the following objective:
Restore designed level of service along a portion of the Guadalupe River to provide 1% flood protection.
GGuuaaddaalluuppee RRiivveerr TTaassmmaann DDrr -- II--888800Flood Protection - Guadalupe Watershed
East bank of the Guadalupe River, looking upstream toward Trimble Road

III-14 :: 2022–2026 Five-Year Capital Improvement Program
SSCCHHEEDDUULLEE && SSTTAATTUUSS Phase
EEXXPPEENNDDIITTUURREE SSCCHHEEDDUULLEE(in thousands $)
FFUUNNDDIINNGG SSCCHHEEDDUULLEE(in thousands $)
FFUUNNDDIINNGG SSOOUURRCCEESS(in thousands $)
OOPPEERRAATTIINNGG CCOOSSTT IIMMPPAACCTTSS
UUSSEEFFUULL LLIIFFEE: 30 Years
Operating cost impacts will be determined during the design phase.
PPrroojjeecctt
30154019-Guadalupe River Tasman Dr - I-880
PPrroojjeecctt
30154019-Guadalupe River Tasman Dr - I-880
with inflation
0
29,912 0
Actuals include project expenditures, and encumbrances.
25,811
28,293
27,061
29,753
872
29,912
FFuuttuurree
0
FY 22
Plan
Design
BBuuddggeett TThhrruu
March 2019 to June 2026
FY 23Cost
2,468
2,365
FY 27FY 25FY 21 FY 24 FY 26
95,911
FY 28 FY 29 FY 30
TToottaall
FY 31
FFYY2266 FFuuttuurree
27,111 0
FFYY2244FFYY2233FFYY2222
TToottaall
5,077
79,933
50
87,737
AAccttuuaallss TThhrruu
FFYY2211FFYY2200
1,080
FFYY2266
29,753
FFYY2222
2,669
FFYY2244
28,293
FFYY2233
87,737
PPllaannnneedd EExxppeennddiittuurreess
Construct
Closeout
SCVWD Watershed Stream Stewardship FundOther Funding Sources
TToottaall
95,9110
9955,,991111
PPllaannnneedd FFuunnddiinngg RReeqquueessttss
872
FFYY2200
2,669
FFYY2255FFYY2211
2,047 2,669 2,166
2,047
Adjusted Budget includes adopted budget plus approved budget adjustments.
AAddjj.. BBuuddggeettEEsstt..
UUnnssppeenntt
95,9112,365
FFYY2255
1,839

III-14 :: 2022–2026 Five-Year Capital Improvement Program 2022–2026 Five-Year Capital Improvement Program :: III-15
PPrroojjeecctt
PPrrooggrraamm
PPrroojjeecctt NNoo.. 26154001s
CCoonnttaacctt Rechelle [email protected]
PPRROOJJEECCTT DDEESSCCRRIIPPTTIIOONN
e
e
e
e
ee
e
e
e
PPRROOJJEECCTT LLOOCCAATTIIOONN
GGuuaaddaalluuppee RRiivveerr––UUppppeerr,, IInntteerrssttaattee 228800 ttoo BBlloossssoomm HHiillll RRooaadd ((EE88))Flood Protection – Guadalupe Watershed
26154001 Fish Passage Modification (Completed)
26154002 I-280 to Southern Pacific Railroad Bridge (Reach 6)26154003 Southern Pacific Railroad Bridge to Blossom Hill Road (Reaches 7-12)
Flooding from Guadalupe River on Willow Street near the Southern Pacific Railroad Bridge
This project partners with the U.S. Army Corps of Engineers (USACE) to plan, design, and construct improvements along approximately 6 miles of the Guadalupe River, from Interstate 280 to Blossom Hill Road, to accomplish the following objectives:
Provide 1% flood protection to nearly 7,000 parcels along the Guadalupe River, from I-280 to Blossom Hill Road, including portions of Ross Creek and Canoas Creek.
Provide access to an additional 19 miles of suitable upstream spawning and rearing habitat, which would result in significant long-term beneficial impacts on fisheries resources.
Provide long-term net gains of 15 acres in riparian forest acreage, quality, and continuity of wildlife habitat, and conditions favoring Chinook salmon and steelhead trout.
Coordinate with the City of San Jose and the community to establish a continuous maintenance road suitable for trail development between Interstate 280 and Los Alamitos Creek.
This project meets the commitments of the voter approved Safe, Clean Water Program (SCW), Project E8. For a full description of the SCW benefits and KPIs, please visit www.valleywater.org.
This project is accounted for in the following:
Improve water quality by reducing bank erosion and sedimentation-related impacts along the river and tributaries.Address and resolve permit coordination activities and watershed integration issues through the Guadalupe Watershed Integration Working Group.

III-16 :: 2022–2026 Five-Year Capital Improvement Program
SSCCHHEEDDUULLEE && SSTTAATTUUSS Phase
EEXXPPEENNDDIITTUURREE SSCCHHEEDDUULLEE(in thousands $)
FFUUNNDDIINNGG SSCCHHEEDDUULLEE(in thousands $)
OOPPEERRAATTIINNGG CCOOSSTT IIMMPPAACCTTSS
UUSSEEFFUULL LLIIFFEE: 30+ Years
The completion of this project is anticipated to increase operating costs by approximately $360,000 per year, beginning in FY21, for mitigation and monitoring labor and equipment, implementation of adaptive management measures, and operations and maintenance in accordance with the USACE Operations and Maintenance Manual.
117777,,221188
FY 22 FY 23 FY 24 FY 25 FY 26
TToottaall
September 1985 to June 2031
4,59130,108
FFUUNNDDIINNGG SSOOUURRCCEESS(in thousands $)
City of San Jose
0
1,657
1,657
117,833
73,503
166,003
76,664 Design
Permits 2,537
Cost
9,122
FY 31
Plan
FY 29
Planning phase is complete. Design and construction of eight individual reaches are being done sequentially.
Construct
Closeout
FY 21
206
FY 27 FY 28
State of California
0
0
469
0
0
667788
667788
888
0
0
0
Actuals include project expenditures, and encumbrances.
2,651
37,632
38,404
FY 30
2,651
128,276
7,887
7,887
0
30
33
850
928
0
0
116666,,000033
117777,,221188
AAccttuuaallss TThhrruu PPllaannnneedd EExxppeennddiittuurreess TToottaall
PPrroojjeecctt FFYY2200 FFYY2211 FFYY2222 FFYY2233 FFYY2244 FFYY2255 FFYY2266 FFuuttuurree
0
0
209
209
469
22,,554455
22,,554455
0
TToottaall
PPrroojjeecctt FFYY2200 FFYY2211 FFYY2222 FFYY2233 FFYY2244 FFYY2255 FFYY2266 FFuuttuurree
BBuuddggeett TThhrruuAAddjj..
BBuuddggeettEEsstt..
UUnnssppeenntt PPllaannnneedd FFuunnddiinngg RReeqquueessttss
888800
996611
888
337777
0
0
30
36
100
119
0
0
113300
115555
0
0
30
34
300
342
0
0
333300
0
1100,,667711
0
0
2,245
2,997
40,440
48,834
0
0
4422,,668855
5511,,883311
0
0
30
37
8,725
10,634
0
0
88,,775555
111100,,000000with inflation
2,651
2,651
33,401
33,401
66,061
66,061
7,887
7,887
111100,,000000
26154001-Guadalupe Rv—Upr, Fish Passage Mods
with inflation
26154002-Guadalupe Rv—Upr, I-280 to SPRR (R6)
with inflation26154003-Guadalupe Rv—Upper, SPRR to Blossom Hill Rd. (R7-12)
with inflation
Actuals in closed project numbers
with inflation
TTOOTTAALL
556622
0
33
0
0
3333
0
34
0
0
0
562
26154001-Guadalupe Rv—Upr, Fish Passage Mods
26154002-Guadalupe Rv—Upr, I-280 to SPRR (R6)
26154003-Guadalupe Rv—Upper, SPRR to Blossom Hill Rd. (R7-12)
Actuals in closed project numbers
TTOOTTAALL
2,651
38,404
128,276
7,887
117777,,221188
0
36
0
0
3366
0
37
0
0
3377
0
2,997
38,877
0
SCVWD Watershed Stream Stewardship Fund 12,000SCVWD Safe, Clean Water and Natural Flood Protection 130,519
2,651
34,705
89,399
7,887
113344,,664422 4411,,887744
0
0
3344
0
00
0
1,095
22,869
0
2233,,996644

III-16 :: 2022–2026 Five-Year Capital Improvement Program 2022–2026 Five-Year Capital Improvement Program :: III-17
PPrroojjeecctt
PPrrooggrraamm
PPrroojjeecctt NNoo.. 26174041s
CCoonnttaacctt Rechelle [email protected]
PPRROOJJEECCTT DDEESSCCRRIIPPTTIIOONN
e
e
e
e
e
e
e
e 26174041 – Coordination with USACEe 26174042 – Reimbursable work – Lands, Easements, Rights of Way, Relocations and Disposal
PPRROOJJEECCTT LLOOCCAATTIIOONN
Incorporate Valley Water's Clean, Safe Creeks and Natural Flood Protection Program Objectives.
BBeerrrryyeessssaa CCrreeeekk,, CCaallaavveerraass BBoouulleevvaarrdd ttoo IInntteerrssttaattee 668800
Berryessa Creek near flood stage at PiedmontRoad in San Jose
Flood Protection – Coyote Watershed
This project partners with the U.S. Army Corps of Engineers (USACE) to plan, design, and construct improvements along approximately two miles of Berryessa Creek, from Calaveras Boulevard to Interstate 680, to accomplish the following objectives:
Provide 1% flood protection to more than 1,100 homes, businesses, and public buildings.Reduce sedimentation and maintenance requirements.Mitigate for project impacts.Improve stream habitat values.
Obtain a Letter of Map Revision from the Federal Emergency Management Agency.
Coordinate with the cities of San Jose and Milpitas, and the community to establish a continuous maintenance road suitable for trail development along the Berryessa Creek project.
This project is accounted for in the following:
This project meets the commitments of the voter approved Safe, Clean Water Program (SCW). For a full description of the SCW benefits and KPIs, please visit www.valleywater.org.

III-18 :: 2022–2026 Five-Year Capital Improvement Program
SSCCHHEEDDUULLEE && SSTTAATTUUSS Phase
EEXXPPEENNDDIITTUURREE SSCCHHEEDDUULLEE(in thousands $)
FFUUNNDDIINNGG SSCCHHEEDDUULLEE(in thousands $)
OOPPEERRAATTIINNGG CCOOSSTT IIMMPPAACCTTSS
UUSSEEFFUULL LLIIFFEE: 30+ Years
Permits 1,561
Department of Water Resources (Prop 1E) 10,000
26174041-Berryessa Creek, USACE Coordination
26174042-Berryessa Creek, LERRDs
TTOOTTAALL
Actuals include project expenditures, and encumbrances.
Adjusted Budget includes adopted budget plus approved budget adjustments.
00
0
0
00
35,595
18,990
5544,,558855
35,566
18,987
5544,,555533
0
0
00
0
0
00
0
0
00
29
3
3322
0
0
00
0
0
00
PPllaannnneedd FFuunnddiinngg RReeqquueessttss TToottaall
PPrroojjeecctt FFYY2200 FFYY2211 FFYY2222 FFYY2233 FFYY2244 FFYY2255 FFYY2266 FFuuttuurree
with inflation
26174042-Berryessa Creek, LERRDs
with inflation
TTOOTTAALL
with inflation
BBuuddggeett TThhrruu
AAddjj.. BBuuddggeett
EEsstt.. UUnnssppeenntt
1144,,116688
22,860
22,860
17,557
17,557
4400,,441177
4400,,441177
0
0
0
00
00
0
0
0
00
00
35,595
18,990
18,990
5544,,558855
5544,,558855
0
0
0
0
00
00
12,735
12,735
1,433
1,433
1144,,116688
FY 28 FY 29
AAccttuuaallss TThhrruu
PPrroojjeecctt FFYY2200
0 026174041-Berryessa Creek, USACE Coordination 0
0
0
0
00
0
0
0
0
PPllaannnneedd EExxppeennddiittuurreess TToottaall
FFYY2211 FFYY2222 FFYY2233 FFYY2244 FFYY2255 FFYY2266 FFuuttuurree
FY 30
8,323
11,554
FY 21Cost FY 22 FY 23 FY 24 FY 25 FY 26 FY 27
25,60018,985
Plan
Design
Construct
Closeout
SCVWD Clean, Safe Creeks and Natural Flood Protection FundState of California
28,697
248
TToottaallUSACE - In-kind Services
The completion of this project is anticipated to increase operating costs by approximately $100,000 per year, beginning in FY20, to maintain approximately two miles of new levees and flood walls, and for activities such as vegetation control and graffiti removal.
FFUUNNDDIINNGG SSOOUURRCCEESS(in thousands $)
5544,,55885513,600
January 2000 to June 2021
54,585
0
0
FY 31
00
00
00
0
0
00
00
0
0
35,595
III-18 :: 2022–2026 Five-Year Capital Improvement Program 2022–2026 Five-Year Capital Improvement Program :: III-19
PPrroojjeecctt
PPrrooggrraamm
PPrroojjeecctt NNoo.. 40174004s
CCoonnttaacctt Rechelle [email protected]
PPRROOJJEECCTT DDEESSCCRRIIPPTTIIOONN
e
eeee
PPRROOJJEECCTT LLOOCCAATTIIOONN
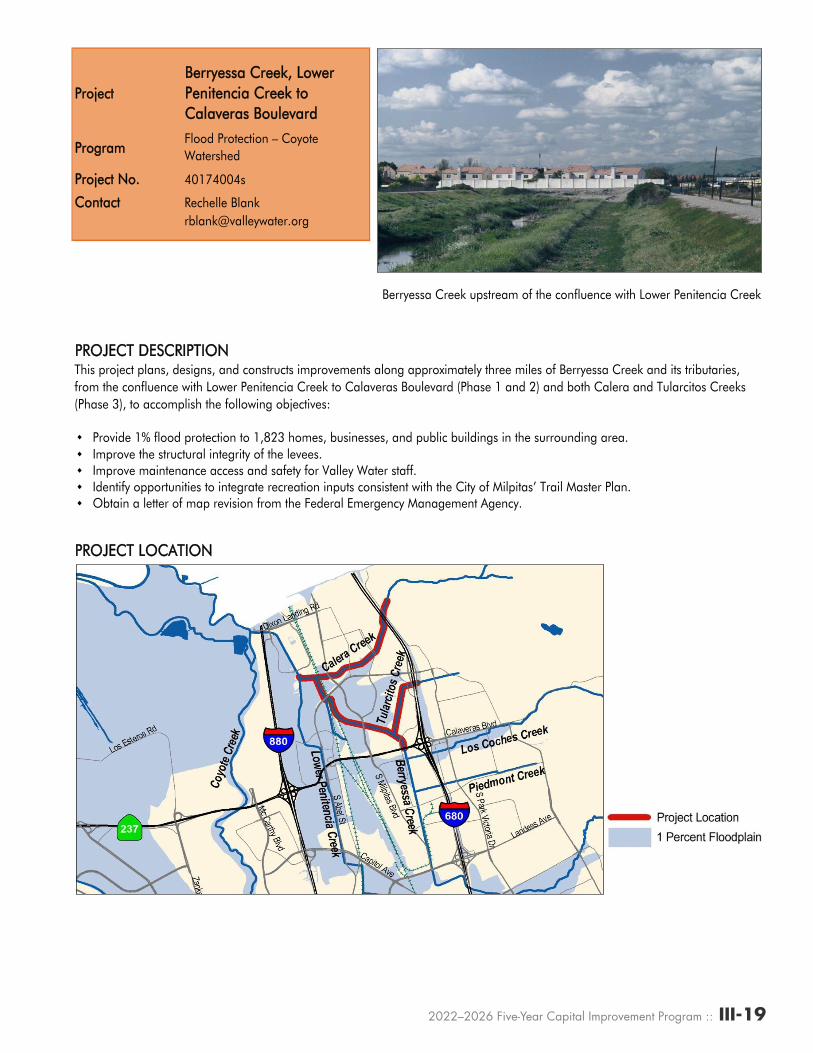
BBeerrrryyeessssaa CCrreeeekk,, LLoowweerr PPeenniitteenncciiaa CCrreeeekk ttoo CCaallaavveerraass BBoouulleevvaarrdd
Flood Protection – Coyote Watershed
Berryessa Creek upstream of the confluence with Lower Penitencia Creek
This project plans, designs, and constructs improvements along approximately three miles of Berryessa Creek and its tributaries, from the confluence with Lower Penitencia Creek to Calaveras Boulevard (Phase 1 and 2) and both Calera and Tularcitos Creeks (Phase 3), to accomplish the following objectives:
Provide 1% flood protection to 1,823 homes, businesses, and public buildings in the surrounding area.Improve the structural integrity of the levees.Improve maintenance access and safety for Valley Water staff.Identify opportunities to integrate recreation inputs consistent with the City of Milpitas’ Trail Master Plan.Obtain a letter of map revision from the Federal Emergency Management Agency.

III-20 :: 2022–2026 Five-Year Capital Improvement Program
SSCCHHEEDDUULLEE && SSTTAATTUUSS Phase
EEXXPPEENNDDIITTUURREE SSCCHHEEDDUULLEE(in thousands $)
FFUUNNDDIINNGG SSCCHHEEDDUULLEE(in thousands $)
FFUUNNDDIINNGG SSOOUURRCCEESS
(in thousands $)
OOPPEERRAATTIINNGG CCOOSSTT IIMMPPAACCTTSS
UUSSEEFFUULL LLIIFFEE: 30+ Years
0 86,613
TTOOTTAALL 111122,,226666 1100,,771155 33,,333399 1122,,228888 888855 337777 227744 22,,110066 7733,,225500 221122,,116600
40174005-Berryessa Creek, Lower Penitencia Creek to Calaveras Boulevard Phase 2
62,075 10,715 0 12,288 885 377 274 0
Permits 2,265 Planning phase is complete. Construction includes three phases and three years of plant establishment monitoring.
119922,,009966
with inflation 110066,,883311 1122,,881111 1122,,339933 888855 337777 227744 22,,110066 7733,,225500 220088,,992266
TTOOTTAALL 110066,,883311 1122,,881111 1122,,339933 881100 333300 223300 11,,669900 5577,,000011
86,448
FY 28 FY 29 FY 30FY 21 FY 22 FY 23 FY 27FY 25FY 24
PPrroojjeecctt
40174004-Berryessa Creek, Lower Penitencia Creek to Calaveras Boulevard Phase 1
The operating cost impacts of these projects are anticipated to average approximately $210,000 annually starting in FY20. Phase II completion is expected to cost $929,000 in FY21; in FY22, $956,000.
TToottaall
46,957
46,95746,747
FFYY2233FFYY2222 FFYY2255FFYY2200
0
0
0
192,096
FY 26
46,747
Actuals include project expenditures, and encumbrances.
PPrroojjeecctt
40174004-Berryessa Creek, Lower Penitencia Creek to Calaveras Boulevard Phase 1
with inflation 0 0
with inflation 60,084 12,706 12,288 885 377 274 0 0 86,613
40174005-Berryessa Creek, Lower Penitencia Creek to Calaveras Boulevard Phase 2
60,084 12,706 12,288 810 330
105 0
105 0
FFYY2211
105
PPllaannnneedd EExxppeennddiittuurreess
197,160
0
230 0 0
0 0 0 0 0 4,600
8,194
TToottaall
50,1910
FFYY2222
0
FFYY2244
0
FFYY2233 FFYY2255 FFYY2266
0
FFuuttuurree
0
BBuuddggeett TThhrruu
FFYY2200
50,191
AAddjj.. BBuuddggeett
Adjusted Budget includes adopted budget plus approved budget adjustments. Allocated funding exceeds planned expenditures by approximately $3,234,000. Excess funds will be returned to Fund Reserves at the close of the project.
FFYY2211
Plan
Design
Construct
Closeout
105
AAccttuuaallss TThhrruu
0
EEsstt.. UUnnssppeenntt
3,339 0
PPllaannnneedd FFuunnddiinngg RReeqquueessttss
Department of Water Resources (Prop 1E)TToottaall
15,000221122,,116600
40C40397-Berryessa Creek, Lower Penitencia Creek to Calaveras Boulevard Phase 3
0 0 0 0 0 0 1,690 52,401 54,091
FY 31
FFYY2266 FFuuttuurree
0 0
FFYY2244
Cost
8,199
21,408
158,735
109
March 2001 to June 2030
67,161
40C40397-Berryessa Creek, Lower Penitencia Creek to Calaveras Boulevard Phase 3
0 0 0 0 0 0 0 2,106 65,055 67,161
with inflation 0 0 0 0 0 0 2,106 65,055
26C40420-Phase 3 Planning/Design (only) 0 0 4,600
with inflation 0 0 0 0 0 0 0 8,194 8,194
8,194
Safe, Clean Water Fund Measure S 8,194
26C40420-Phase 3 Planning/Design (only) 0 0 0 0 0 0 0 0
SCVWD Watershed Stream Stewardship Fund

III-20 :: 2022–2026 Five-Year Capital Improvement Program 2022–2026 Five-Year Capital Improvement Program :: III-21
PPrroojjeecctt
PPrrooggrraamm
PPrroojjeecctt NNoo.. 26174043
CCoonnttaacctt Rechelle [email protected]
PPRROOJJEECCTT DDEESSCCRRIIPPTTIIOONN
e
e
e
e
PPRROOJJEECCTT LLOOCCAATTIIOONN
February 2017 flood event, on Rock Springs Drive looking northeast towards Rocksprings Park
Incorporate aesthetic elements of the Coyote Creek park chain.Minimize long-term maintenance needs.
This project meets the commitments of the voter approved Safe, Clean Water Program (SCW), Project E1. For a full description of the SCW benefits and KPIs, please visit www.valleywater.org.
CCooyyoottee CCrreeeekk,, MMoonnttaagguuee EExxpprreesssswwaayy ttoo TTuullllyy RRooaadd ((EE11))
Flood Protection – Coyote Watershed
To reduce the risk of flooding to homes, schools, businesses, and highways from approximately a 20 year flood event (February 2017 event), from Montague Expressway to Tully Road.Improve water quality, enhance stream habitat, and provide recreational opportunities.
This project plans, designs, and constructs improvements along approximately nine miles of Coyote Creek, from Montague Expressway to Tully Road, to accomplish the following objectives:

III-22 :: 2022–2026 Five-Year Capital Improvement Program
SSCCHHEEDDUULLEE && SSTTAATTUUSS Phase
EEXXPPEENNDDIITTUURREE SSCCHHEEDDUULLEE(in thousands $)
FFUUNNDDIINNGG SSCCHHEEDDUULLEE(in thousands $)
OOPPEERRAATTIINNGG CCOOSSTT IIMMPPAACCTTSS
UUSSEEFFUULL LLIIFFEE: 30+ Years
Other Funding Sources
Closeout
with inflation
PPrroojjeecctt
26174043-Coyote Creek, Montague Expressway to Tully Road (E1)
0
TToottaall
58,030
62,93614,234
22,38211,166
10,018
11,166
19,780
22,382
FFYY2233
Design
Construct
TToottaall
62,936
Permits 1,516
FY 25
FFYY2233FFYY2222
PPllaannnneedd FFuunnddiinngg RReeqquueessttss
FFYY2255
2,199
EEsstt.. UUnnssppeenntt
2,528
3,895 0
FFYY2266
3,895
FFuuttuurree
0
FFYY2222
1,598
FFYY2244
FFYY2200
Actuals include project expenditures, and encumbrances.
FFUUNNDDIINNGG SSOOUURRCCEESS(in thousands $)
PPrroojjeecctt
26174043-Coyote Creek, Montague Expressway to Tully Road (E1)
FY 31
FFYY2266 FFuuttuurree
3,300 0
FFYY2244
SCVWD Clean, Safe Creeks and Natural Flood Protection Fund
4,126 6,100
4,126 6,661
FFYY2211
472
PPllaannnneedd EExxppeennddiittuurreess
62,936
Cost
9,723
15,873
30,320
106
58,030
AAccttuuaallss TThhrruu
Adjusted Budget includes adopted budget plus approved budget adjustments.
Currently Valley Water has limited and sporadic property rights within the project limits along the creek, and ongoing maintenance costs are relatively small. Project implementation may include acquisition of continuous right of way for construction and future operations and maintenance. This project is expected to increase operating costs by approximately $1,000,000 per year starting in FY27.
FY 28 FY 29 FY 30FY 21 FY 22 FY 23
November 2017 to June 2026
FY 24 FY 26
Plan
FY 27
6,661
FFYY2255
AAddjj.. BBuuddggeett
6622,,993366
14,234
BBuuddggeett TThhrruu
FFYY2200
15,035
472
FFYY2211
TToottaall

III-22 :: 2022–2026 Five-Year Capital Improvement Program 2022–2026 Five-Year Capital Improvement Program :: III-23
PPrroojjeecctt
PPrrooggrraamm
PPrroojjeecctt NNoo.. 40264011
CCoonnttaacctt Rechelle [email protected]
PPRROOJJEECCTT DDEESSCCRRIIPPTTIIOONN
e
e
e
PPRROOJJEECCTT LLOOCCAATTIIOONN
CCuunnnniinngghhaamm FFlloooodd DDeetteennttiioonn CCeerrttiiffiiccaattiioonn
Flood Protection – Coyote Watershed
Update the 1978 Joint Use Agreement between the City and Valley Water to meet the flood detention facility's
Obtain Federal Emergency Management Agency certification of the flood detention facility and LowerSilver Creek improvements north of the Park to revise the applicable flood insurance rate maps in the Lower
Flooding from Lower Silver Creek in February 1969 at the future site of Lake Cunningham Regional Park
This project plans, designs, and constructs final improvements at Lake Cunningham Regional Park (Park) to ensure the site operates as a flood detention facility in accordance with the 1978 agreement with the City of San Jose (City) and to ensure the Lower Silver Creek Project improvements downstream of Cunningham Avenue function as designed. This project will accomplish the following objectives:
Validate that the flood detention facility can attenuate the volume of water associated with 2,249 cfs below the Park land elevation as stipulated in the 1978 Joint Use Agreement between the City and Valley Water.
Silver Creek 1% floodplain near the north of the Park.
validated condition.
III-24 :: 2022–2026 Five-Year Capital Improvement Program
SSCCHHEEDDUULLEE && SSTTAATTUUSS Phase
EEXXPPEENNDDIITTUURREE SSCCHHEEDDUULLEE(in thousands $)
FFUUNNDDIINNGG SSCCHHEEDDUULLEE(in thousands $)
FFUUNNDDIINNGG SSOOUURRCCEESS
(in thousands $)
OOPPEERRAATTIINNGG CCOOSSTT IIMMPPAACCTTSS
UUSSEEFFUULL LLIIFFEE: 30+ Years
11,838
Closeout
Cost
00
FY 28 FY 29 FY 30FY 21 FY 22 FY 23 FY 24
FFYY2244
31 0
FFYY2211
44
PPllaannnneedd EExxppeennddiittuurreess
FFYY2222PPrroojjeecctt
2,323
2,288
6,722
FY 26
Plan
Design
Construct
Permits 369
August 1999 to June 2022
12
40264011-Cunningham Flood Detention Certification
FFYY2255
AAccttuuaallss TThhrruu
00
PPllaannnneedd FFuunnddiinngg RReeqquueessttss
31 0 0
FFuuttuurree
11,763with inflation
FY 31
FFYY2266 FFuuttuurree
0 0
FY 25 FY 27
TToottaall
11,8380
FFYY2233
11,838
0
FFYY2255
AAddjj.. BBuuddggeett
FFYY2233
2,7181111,,883388
SCVWD Watershed Stream Stewardship Fund
Natural Resource Conservation ServiceTToottaall
8,120
FFYY2211PPrroojjeecctt
40264011-Cunningham Flood Detention Certification
Adjusted Budget includes adopted budget plus approved budget adjustments.
FFYY2266
0
California Department of Water Resources 1,000
The project is within Valley Water jurisdiction and it is designed to minimize maintenance activities such as sediment removal. Operating costs are expected to be approximately $60,000 per year starting in FY20.
FFYY2200
FFYY2222
284
EEsstt.. UUnnssppeenntt
3
FFYY2200
11,806
44
FFYY2244
0
Actuals include project expenditures, and encumbrances.
TToottaall
11,838
11,763
BBuuddggeett TThhrruu
0
0

III-24 :: 2022–2026 Five-Year Capital Improvement Program 2022–2026 Five-Year Capital Improvement Program :: III-25
PPrroojjeecctt
PPrrooggrraamm
PPrroojjeecctt NNoo.. 40334005
CCoonnttaacctt Rechelle [email protected]
PPRROOJJEECCTT DDEESSCCRRIIPPTTIIOONN
e
e
ee
e
PPRROOJJEECCTT LLOOCCAATTIIOONN
Lower Penitencia Creek, looking downstreamfrom Milmont Drive
This project plans, designs, and constructs improvements along approximately one mile of Lower Penitencia Creek from the downstream confluence with Coyote Creek to the upstream face of San Andreas Drive, to accomplish the following objectives:
Enable FEMA certification of the improvements.
Maintain existing Federal Emergency Management Agency (FEMA) accreditation along the east levee located betweenCalifornia Circle and Berryessa Creek.
LLoowweerr PPeenniitteenncciiaa CCrreeeekk IImmpprroovveemmeennttss,, BBeerrrryyeessssaa ttoo CCooyyoottee CCrreeeekkss
Flood Protection – Coyote Watershed
Meet required water surface elevations at Coyote Creek and Berryessa Creek confluences.Convey the Lower Berryessa Creek 1% design flow.
Minimize the need for seasonal removal of sediment and non-woody vegetation.

III-26 :: 2022–2026 Five-Year Capital Improvement Program
SSCCHHEEDDUULLEE && SSTTAATTUUSS Phase
EEXXPPEENNDDIITTUURREE SSCCHHEEDDUULLEE(in thousands $)
FFUUNNDDIINNGG SSCCHHEEDDUULLEE(in thousands $)
(in thousands $)
OOPPEERRAATTIINNGG CCOOSSTT IIMMPPAACCTTSS
UUSSEEFFUULL LLIIFFEE: 50 Years
8,021
FFYY2255
AAddjj.. BBuuddggeett
PPrroojjeecctt
40334005-Lower Penitencia Creek Improvements, Berryessa to Coyote Creeks
with inflation
PPrroojjeecctt
40334005-Lower Penitencia Creek Improvements, Berryessa to Coyote Creeks
9,651
BBuuddggeett TThhrruu
FFYY2200
11,287
1,878
FFYY2211
PPllaannnneedd FFuunnddiinngg RReeqquueessttssEEsstt..
UUnnssppeenntt
FFYY2255
This project is expected to have an operating cost of approximately $215,000 per year, beginning in FY23.
FY 28 FY 29 FY 30FY 21 FY 22 FY 23
October 2010 to January 2024
FY 24 FY 26
Plan
FY 27
Actuals include project expenditures, and encumbrances.
FY 31
FFYY2266 FFuuttuurree
0 0
FFYY2244
SCVWD Watershed Stream Stewardship Fund
7,733 7,550
7,733 8,021
FFYY2211
1,878
PPllaannnneedd EExxppeennddiittuurreess
23,233
Cost
3,574
5,010
17,709
20
27,632
AAccttuuaallss TThhrruu
TToottaall
Permits 1,131
28,233
5,0002288,,223333
FFUUNNDDIINNGG SSOOUURRCCEESSDepartment of Water Resources (Prop 1E)
TToottaall
FFYY2266
0
FFuuttuurree
0
FFYY2222
230
FFYY2244
7,745 7,503
Adjusted Budget includes adopted budget plus approved budget adjustments.
322628
FFYY2233
TToottaall
27,632
28,2339,651
FY 25
0 0
550
628
270
322
Design
Construct
FFYY2200
Closeout
FFYY2233FFYY2222

III-26 :: 2022–2026 Five-Year Capital Improvement Program 2022–2026 Five-Year Capital Improvement Program :: III-27
PPrroojjeecctt
PPrrooggrraamm
PPrroojjeecctt NNoo.. 40264008s
CCoonnttaacctt Rechelle [email protected]
PPRROOJJEECCTT DDEESSCCRRIIPPTTIIOONN
ee
ee
e 40264007 Lower Silver Creek, I-680 to N. Babb Creek (Reach 4 Planning) - Completedee
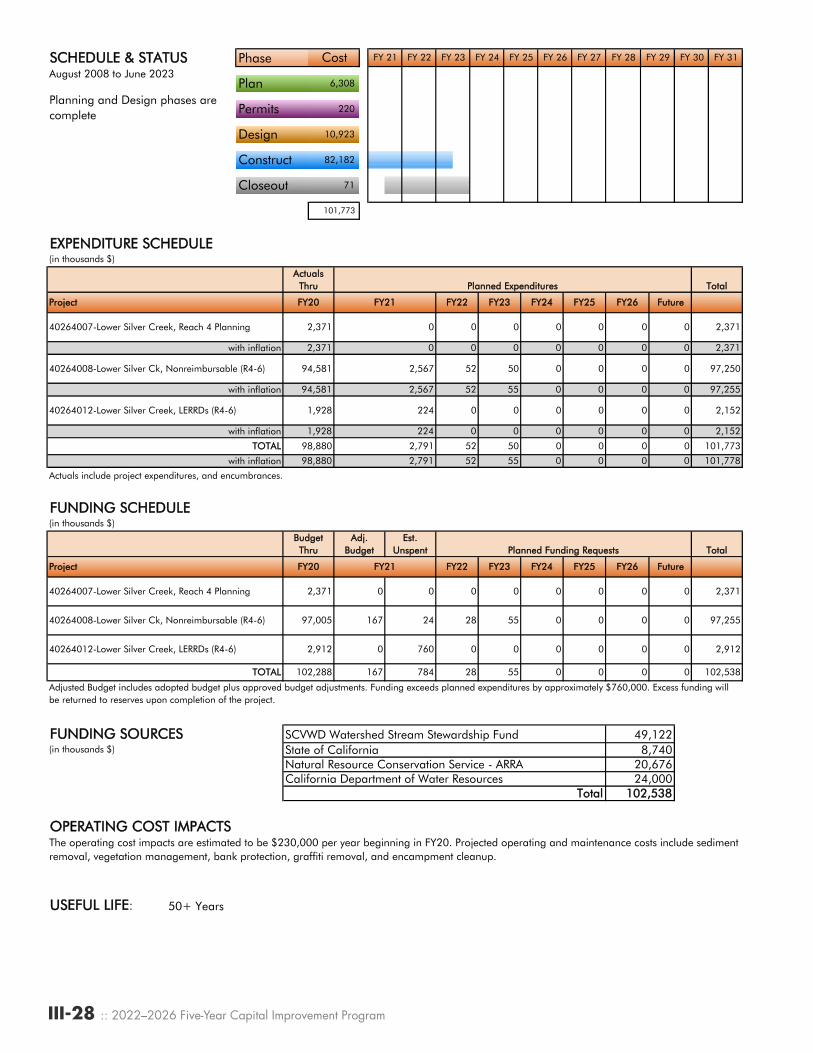
PPRROOJJEECCTT LLOOCCAATTIIOONN
67/1/2025
Lower Silver Creek looking upstream from Capital Expressway
This project is part of a flood control project that partners with the Natural Resource Conservation Service to plan, design and construct improvements along approximately 2.3 miles of Lower Silver Creek, from Interstate 680 to Lake Cunningham. This project includes elements that are eligible for reimbursement from the state and federal governments to accomplish the following objectives:
LLoowweerr SSiillvveerr CCrreeeekk,, II--668800 ttoo CCuunnnniinngghhaamm AAvveennuuee ((RReeaacchheess 44--66))Flood Protection – Coyote Watershed
Increase flood protection to 3,800 parcels in the surrounding area.
Improve vehicle and pedestrian bridges crossing Lower Silver Creek.
Allow for on-site mitigation of project impacts, and in some cases enhancement of existing habitat values by increased wetlands and riparian habitat.
Develop with the City of San Jose the footprint for a future trail project between Capitol Avenue-Frontage Road and Jackson Avenue that ensures pedestrians and bicyclists may travel beneath the Dobern Pedestrian Bridge.
This project is accounted for in the following:
40264008 Lower Silver Creek, I-680 to Cunningham Rd. (Reaches 4-6)40264012 Lower Silver Creek (Reaches 4-6) Reimbursable
III-28 :: 2022–2026 Five-Year Capital Improvement Program
SSCCHHEEDDUULLEE && SSTTAATTUUSS Phase
EEXXPPEENNDDIITTUURREE SSCCHHEEDDUULLEE(in thousands $)
FFUUNNDDIINNGG SSCCHHEEDDUULLEE(in thousands $)
FFUUNNDDIINNGG SSOOUURRCCEESS(in thousands $)
OOPPEERRAATTIINNGG CCOOSSTT IIMMPPAACCTTSS
UUSSEEFFUULL LLIIFFEE: 50+ Years
0
50
FFYY2244
with inflation 2,371 0 0 0
40264012-Lower Silver Creek, LERRDs (R4-6)
0
0
0 0
TTOOTTAALL
with inflation 1,928
98,880 055with inflation
224 0 0
5298,880
0
AAddjj.. BBuuddggeett
EEsstt.. UUnnssppeenntt
BBuuddggeett TThhrruu PPllaannnneedd FFuunnddiinngg RReeqquueessttss
40264007-Lower Silver Creek, Reach 4 Planning
0 00
PPrroojjeecctt
Actuals include project expenditures, and encumbrances.
101,778
TToottaall
FFYY2255FFYY2200 FFYY2244FFYY2222 FFYY2266 FFuuttuurree
0
2,371 0 0 0 0 0
0 0
FFYY2233FFYY2211
0
2,3710 0 0
2,912
101,7730 00
FY 31
FFYY2266 FFuuttuurree
0
FY 29 FY 30
2,152
0 0 97,250
0
0 0 2,3710
0 0
00 2,152
2,371
0
Plan
10,923 Design
Construct
Closeout
101,773
FFYY2200
AAccttuuaallss TThhrruu PPllaannnneedd EExxppeennddiittuurreess
FFYY2211 FFYY2255
FY 23 FY 24FY 21 FY 22
FFYY2233
FY 26Cost
6,308
FY 25
82,182
71
Planning and Design phases are complete
784102,288 0
Permits 220
52
with inflation 94,581 2,567 52 97,255
FY 27 FY 28
August 2008 to June 2023
2,791 52
0
FFYY2222
502,791
55
PPrroojjeecctt
40264008-Lower Silver Ck, Nonreimbursable (R4-6) 94,581 2,567
40264007-Lower Silver Creek, Reach 4 Planning 2,371
0
0 0 0
1,928 224 0
760 0 00
40264008-Lower Silver Ck, Nonreimbursable (R4-6) 97,255
40264012-Lower Silver Creek, LERRDs (R4-6) 2,912
TToottaall
97,005 0 0
0 00
0
0 00 0
167 24 28 55
20,676
49,122
The operating cost impacts are estimated to be $230,000 per year beginning in FY20. Projected operating and maintenance costs include sediment removal, vegetation management, bank protection, graffiti removal, and encampment cleanup.
110022,,553388
167 102,5380 0
TToottaall
Natural Resource Conservation Service - ARRA
TTOOTTAALL
Adjusted Budget includes adopted budget plus approved budget adjustments. Funding exceeds planned expenditures by approximately $760,000. Excess funding will be returned to reserves upon completion of the project.
California Department of Water Resources 24,000
SCVWD Watershed Stream Stewardship FundState of California 8,740
28 055

III-28 :: 2022–2026 Five-Year Capital Improvement Program 2022–2026 Five-Year Capital Improvement Program :: III-29
PPrroojjeecctt
PPrrooggrraamm
PPrroojjeecctt NNoo.. 40324003s
CCoonnttaacctt Rechelle [email protected]
PPRROOJJEECCTT DDEESSCCRRIIPPTTIIOONN
eeee
e
e 40324003 Initial stages of Planning Phase through FY18e 26324001 Safe, Clean Water Program
PPRROOJJEECCTT LLOOCCAATTIIOONN
Objectives:
Improve stream habitat values and fisheries potential.Reduce sedimentation and maintenance requirements.Identify opportunities to integrate recreation improvements consistent with the City of San Jose’s Master Plans,the County's Penitencia Creek Master Plan, and Santa Clara Countywide Trails Master Plan.
UUppppeerr PPeenniitteenncciiaa CCrreeeekk,, CCooyyoottee CCrreeeekk ttoo DDoorreell DDrriivvee ((EE44))Flood Protection – Coyote Watershed
Flooding at King Road on Upper Penitencia Creek
Initially, this project partnered with the U.S. Army Corps of Engineers (USACE) to plan, design, and construct improvements along approximately 4.2 miles of Upper Penitencia Creek, from the confluence with Coyote Creek to Dorel Drive, to accomplish the objectives listed below. In 2016, the USACE's decided that the multi-objective project which is appropriate for this creek could not be funded under the existing single-purpose authorization. The Project was not included in the USACE's 2017 workplan.
Provide 1% flood protection to more than 5,000 homes, businesses, and public buildings.
Incorporate Valley Water’s Safe, Clean Water and Natural Flood Protection Program objectives.
This project is accounted for in the following:
This project meets the commitments of the voter approved Safe, Clean Water Program (SCW), Project E4. For a full description of the SCW benefits and KPIs, please visit www.valleywater.org.

III-30 :: 2022–2026 Five-Year Capital Improvement Program
SSCCHHEEDDUULLEE && SSTTAATTUUSS Phase
EEXXPPEENNDDIITTUURREE SSCCHHEEDDUULLEE(in thousands $)
FFUUNNDDIINNGG SSCCHHEEDDUULLEE(in thousands $)
FFUUNNDDIINNGG SSOOUURRCCEESS(in thousands $)
OOPPEERRAATTIINNGG CCOOSSTT IIMMPPAACCTTSS
UUSSEEFFUULL LLIIFFEE: Not Available
with inflation
40324003-Upper Penitencia Ck, Coyote Ck to Dorel Dr, USACE
PPrroojjeecctt
26324001-Upper Penitencia Ck, Coyote Ck to Dorel Dr
with inflation
26324001-Upper Penitencia Ck, Coyote Ck to Dorel Dr
with inflation
40324005-Upper Penitencia Ck, Coyote Ck to Dorel Dr, LERRDs
FFYY2200 FFYY2211 FFYY2222 FFYY2233 FFYY2244 FFYY2255 FFuuttuurree
Cost FY 21 FY 22 FY 23 FY 24 FY 25 FY 26 FY 27 FY 28 FY 29 FY 30 FY 31
Closeout 154
34,861
AAccttuuaallss TThhrruu PPllaannnneedd EExxppeennddiittuurreess
July 2000 to June 2028Plan 7,230
Permits 610
Design 12,513
Construct 14,028
TToottaall
9,467
9,467 0 0 0 0 0 0 0 9,467
9,467 0 0 0 0 0 0 0
FFYY2266
2,309
2,309 0 0 0 0 0 0 0 2,309
2,309 0 0 0 0 0 0 0
23,085
1,172 4,929 2,629 218 2,067 1,599 4,449 8,573 25,636
1,172 4,929 2,629 200 1,811 1,341 3,779 7,224
33,,777799 77,,222244
3377,,441122
Actuals include project expenditures, and encumbrances.
BBuuddggeett TThhrruu AAddjj.. BBuuddggeettEEsstt..
UUnnssppeenntt PPllaannnneedd FFuunnddiinngg RReeqquueessttss TToottaall
3344,,886611
with inflation 1122,,994488 44,,992299 22,,662299 221188 22,,006677 11,,559999 44,,444499 88,,557733
TTOOTTAALL 1122,,994488 44,,992299 22,,662299 220000 11,,881111 11,,334411
40324005-Upper Penitencia Ck, Coyote Ck to Dorel Dr, LERRDs
4,831 0 2,522 0
FFYY2255 FFYY2266 FFuuttuurree
40324003-Upper Penitencia Ck, Coyote Ck to Dorel Dr, USACE
9,466 0 -1 1 0
PPrroojjeecctt FFYY2200 FFYY2211 FFYY2222 FFYY2233 FFYY2244
0 0 0 0 0 4,831
0 0 0 0 9,467
4,719 3,898 2,516 113 2,067 1,599 4,449 8,573 25,636218
22,,006677 11,,559999 44,,444499 88,,557733 3399,,993344
Operating costs are expected to average $790,000 per year beginning in FY25.
SCVWD Watershed Stream Stewardship Fund 14,298SCVWD Safe, Clean Water Fund 25,636
TToottaall 3399,,993344
Adjusted Budget includes adopted budget plus approved budget adjustments. Allocated funding exceeds total planned expenditures by approximately $2,522,000. Excess funds will be returned to Fund Reserves at the close of the project.
TTOOTTAALL 1199,,001166 33,,889988 55,,003377 111144 221188

III-30 :: 2022–2026 Five-Year Capital Improvement Program 2022–2026 Five-Year Capital Improvement Program :: III-31
PPrroojjeecctt
PPrrooggrraamm
PPrroojjeecctt NNoo.. 50284010
CCoonnttaacctt Rechelle [email protected]
PPRROOJJEECCTT DDEESSCCRRIIPPTTIIOONN
e
e
e
e
PPRROOJJEECCTT LLOOCCAATTIIOONN
LLllaaggaass CCrreeeekk––LLoowweerr,, CCaappaacciittyy RReessttoorraattiioonn,, BBuueennaa VViissttaa AAvveennuuee ttoo PPaajjaarroo RRiivveerrFlood Protection – Uvas/Llagas Watershed
Lower Llagas Creek near Pajaro River
Evaluate the current flood risk in the area surrounding the project versus the design level flood risk.
Coordinate planning, design, and construction efforts with the South County Regional Wastewater Authority.
This project plans, designs, and constructs improvements on 7.15 miles of Lower Llagas Creek, from Buena Vista Avenue to Pajaro River, to accomplish the following objectives:
Identify feasible opportunities for environmental restoration and corridor preservation.
Develop options to provide flood protection for Lower Llagas Creek Reaches 2 and 3 in accordance with Federal Emergency Management Agency criteria where applicable.

III-32 :: 2022–2026 Five-Year Capital Improvement Program
SSCCHHEEDDUULLEE && SSTTAATTUUSS Phase
EEXXPPEENNDDIITTUURREE SSCCHHEEDDUULLEE(in thousands $)
FFUUNNDDIINNGG SSCCHHEEDDUULLEE(in thousands $)
FFUUNNDDIINNGG SSOOUURRCCEESS(in thousands $)
OOPPEERRAATTIINNGG CCOOSSTT IIMMPPAACCTTSS
UUSSEEFFUULL LLIIFFEE: 30+ Years
130 1,250
Operating cost impacts will determined at the completion of the design phase.
1144,,003399
391
State of CaliforniaTToottaall
1,12012,919
14,039
SCVWD Watershed Stream Stewardship Fund
2,763 3,2406,947
861
0
Cost
2,993
2,869
FY 24 FY 26
September 2008 to July 2027
FY 28 FY 29FY 22 FY 23
Plan
Design
652
BBuuddggeett TThhrruu
AAddjj.. BBuuddggeett
0 0
Actuals include project expenditures, and encumbrances.
3,4620
FFYY2211PPrroojjeecctt FFYY2200
50284010-Llagas Creek–Lower, Capacity Restoration, Buena Vista Avenue to Pajaro River
FFYY2266
TToottaallEEsstt..
UUnnssppeenntt PPllaannnneedd FFuunnddiinngg RReeqquueessttss
FFYY2222 FFYY2233 FFYY2244
12,814
14,0393,323 3,462 391
FFYY2255
FY 31
300
6,200 Construct
Closeout 100
Permits
FFuuttuurree
AAccttuuaallss TThhrruu PPllaannnneedd EExxppeennddiittuurreess TToottaall
FFYY2233 FFYY2244
130 1,365
12,814
FY 21
FFYY2211 FFYY2222 FFYY2255
with inflation
950
1,084
3,000
3,423
3,323 3,000861
FY 27FY 25 FY 30
50284010-Llagas Creek–Lower, Capacity Restoration, Buena Vista Avenue to Pajaro River
FFYY2266 FFuuttuurreePPrroojjeecctt FFYY2200

III-32 :: 2022–2026 Five-Year Capital Improvement Program 2022–2026 Five-Year Capital Improvement Program :: III-33
PPrroojjeecctt
PPrrooggrraamm
PPrroojjeecctt NNoo.. 26174051s
CCoonnttaacctt Rechelle [email protected]
PPRROOJJEECCTT DDEESSCCRRIIPPTTIIOONN
e
e
e
e 26174054 - Designe 50C40335 - Construction, Reach 5, 6, & 7b
PPRROOJJEECCTT LLOOCCAATTIIOONN
LLllaaggaass CCrreeeekk––UUppppeerr,, BBuueennaa VViissttaa AAvveennuuee ttoo LLllaaggaass RRooaadd ((EE66))Flood Protection – Uvas/Llagas Watershed
This project meets the commitments of the voter approved Safe, Clean Water Program (SCW), Project E6. For a full description of the SCW benefits and KPIs, please visit www.valleywater.org.
This project continues a Clean, Safe Creeks project in partnership with the U.S. Army Corps of Engineers (USACE) and the state to plan, design, and construct improvements along 13.9 miles of channel. The project extends from Buena Vista Avenue to Llagas Road, including West Little Llagas Creek in downtown Morgan Hill. The federally authorized preferred project protects the urban area of Morgan Hill from a 1% (or 100-year) flood, and reduces the frequency of flooding in surrounding areas. Construction includes channel modifications and replacement of road crossings. Valley Water continues to work with Congress to aggressively pursue federal funds to bring this project to full fruition. In 2012, project limits were extended 2,700 feet upstream to Llagas Road to address public concerns.
This project is accounted for in the following: 26174051 - Reaches 4-8 & 14 - Reimbursable - Lands, Easements, Rights of Way, Relocation, & Disposal26174052 - Reaches 4-8 & 14 - Construction/Coordination with USACE26174053 - Technical Studies (completed)
Llagas Creek floods at Watsonville Road andthe surrounding area

III-34 :: 2022–2026 Five-Year Capital Improvement Program
SSCCHHEEDDUULLEE && SSTTAATTUUSS Phase
EEXXPPEENNDDIITTUURREE SSCCHHEEDDUULLEE(in thousands $)
FFUUNNDDIINNGG SSCCHHEEDDUULLEE(in thousands $)
OOPPEERRAATTIINNGG CCOOSSTT IIMMPPAACCTTSS
UUSSEEFFUULL LLIIFFEE: 50+ Years
249,388
with inflation
58,521
0
0with inflation 21,864 1,856 941
0 0 0
1,446
168,595
0 050C40335-Llagas Ck—Upper, Construction Rch 5, 6, & 7b
0 0 0 0 23,690
50C40335-Llagas Ck—Upper, Construction Rch 5, 6, & 7b
17,510 6,180 0 0 0 0 0 0 23,690
FFYY2266
0
PPllaannnneedd EExxppeennddiittuurreess TToottaall
24 0
64,457
238,387
42,335
324,735
FFuuttuurree
45,040
45,049
FY 27 FY 28 FY 29 FY 30FY 24 FY 25 FY 26
0
0
0
FFYY2266
32,386 9,242
0 0
FFYY2233
0
312
FFuuttuurree
State of California
333322,,992200
29,561
1,446
45,049
256,864
0 9
0 0 0 0
0 0 0 184 1,184 0
SCVWD Clean, Safe Creeks and Natural Flood Protection Fund
Watershed Stream Stewardship Fund 23,690
0
58,292 58,521
Operation costs are currently anticipated to be approximately $1,500,000 per year, beginning in FY26.
39,394
17,900FFUUNNDDIINNGG SSOOUURRCCEESS(in thousands $)
44,,555555
USACE - In-kind Services 65,000
5588,,229922 5588,,552211 3322,,338866 99,,443355 11,,449955
TToottaall 333322,,992200
City of Morgan Hill
5533,,665566
3,341
00
Adjusted Budget includes adopted budget plus approved budget adjustments.
SCVWD Safe Clean Water Program Fund
1,446
0 256,864
0 0 0 0
0 0
28,861
29,5611,371 1,184
23,6900
25058,292 53,648 31,400 8,886 0
0
0
32,386 9,242 312
0
1,150 950
0 0
113322,,884411
5599,,225555
17,510 6,180
5599,,008855
5599,,225555with inflation 5599,,668899
0
TTOOTTAALL 11,,220000113322,,884411
3333,,660077
FFYY2200 FFYY2211 FFYY2222 FFYY2233 FFYY2244
AAccttuuaallss TThhrruu
PPrroojjeecctt
FY 23Cost FY 31FY 21 FY 22
620
3,729
Permits 6,536 Project schedule may vary considerably and is dependent upon the USACE and Congress.
20 0 02,623 20
FFYY2255
22 2342,335with inflation 22
22 2026174051-Llagas Ck—Upper, LERRDs
July 2000 to June 2026 Plan
Design
Closeout
2,623
Construct
26174052-Llagas Ck—Upper, USACE Coordination
with inflation
026174053-Llagas Ck—Upper, Technical Studies 0
49,686
58,292
0
with inflation
1,050 1,050
48,42649,686
48,426
FFYY2200
1100,,663377
TToottaall
332244,,7733555544,,771188 3322,,447700 1100,,005566
FFYY2222
00
00 333322,,992200
BBuuddggeett TThhrruu
AAddjj.. BBuuddggeett
EEsstt.. UUnnssppeenntt PPllaannnneedd FFuunnddiinngg RReeqquueessttss
1,147 1,198
1,446
1,446 0
FFYY2211
26174054-Llagas Ck—Upper, Design 21,864 1,856 941
5599,,008855
Actuals include project expenditures, and encumbrances.
FFYY2244 FFYY2255PPrroojjeecctt
11,,449955
NRCS Grants (Unsecured) 80,000
45,040
50,636
1,446
114422,,882255
0
26174051-Llagas Ck—Upper, LERRDs
26174052-Llagas Ck—Upper, USACE Coordination
26174053-Llagas Ck—Upper, Technical Studies
TTOOTTAALL
47,476
0
0
0
82
26174054-Llagas Ck—Upper, Design 28,193 0 4,473
17,510 6,180 0

III-34 :: 2022–2026 Five-Year Capital Improvement Program 2022–2026 Five-Year Capital Improvement Program :: III-35
PPrroojjeecctt
PPrrooggrraamm
PPrroojjeecctt NNoo.. 00044026s
CCoonnttaacctt Rechelle [email protected]
PPRROOJJEECCTT DDEESSCCRRIIPPTTIIOONN
eeeeeee
PPRROOJJEECCTT LLOOCCAATTIIOONN
Flood Protection – Multiple Watersheds
SSaann FFrraanncciissccoo BBaayy SShhoorreelliinnee ((EE77))
This project partners with the California Coastal Conservancy, U.S. Army Corps of Engineers (USACE) and key stakeholders to conduct an integrated, multi-objective project along the San Francisco Bay Shoreline. Project number 00044026 funded the USACE Feasibility Study effort for the North San Jose area, known as Economic Impact Area 11 (EIA 11) which was completed in FY17. This project number will continue to fund other Shoreline efforts outside of the Safe, Clean Water (SCW) project numbers. For EIA 11, the Shoreline Project received $177M under the USACE FY 2018 Disaster Supplemental Appropriations Bill. Valley Water's share of EIA 11 design and construction is $46.8M. Valley Water has been awarded a total of $61 million from a Measure AA grant to partially fund the design and construction of EIA 11. SCW funds will provide $15 million toward Valley Water's cost share of the design and partial construction efforts for EIA 11. SCW funds will provide $5 million toward Valley Water's cost share of the planning, design and construction phase efforts for project number 26444002 for of the Palo Alto-Mountain View area, known as EIA 1-4, along with the remaining EIAs and planning and design phases of project number 26444004 for the area from Mountain View-Sunnyvale-San Jose area, known as EIA 5-10. The Shoreline Project will accomplish the following objectives:
Provide integrated fluvial and 1% coastal flood protection.Provide protection for future sea level rise.Restore and/or enhance tidal marsh and related habitats.Provide recreational and public access opportunities.
Obtain a letter of map revision from the Federal Emergency Management Agency at completion of the Construction Phase.Pursue continued federal funding.
Coordinate closely with the South Bay Salt Pond Restoration Project, local jurisdictions/cities, U.S. Fish and Wildlife Service, the community and key stakeholders.
This project meets the commitments of the voter approved Safe, Clean Water Program (SCW), Project E7. For a full description of the SCW benefits and KPIs, please visit www.valleywater.org.
This project will restore tidal marshland in the San Francisco Bay. (Photo by Cris Benton)

III-36 :: 2022–2026 Five-Year Capital Improvement Program
SSCCHHEEDDUULLEE && SSTTAATTUUSS Phase
EEXXPPEENNDDIITTUURREE SSCCHHEEDDUULLEE(in thousands $)
FFUUNNDDIINNGG SSCCHHEEDDUULLEE(in thousands $)
FFUUNNDDIINNGG SSOOUURRCCEESS(in thousands $)
OOPPEERRAATTIINNGG CCOOSSTT IIMMPPAACCTTSS
UUSSEEFFUULL LLIIFFEE: 50+ Years
17,515
44,,112255
11,,334422
155,248
359
359
220088,,008822
0
0
26,016
0
88,,330000
66,,660055
10,400
17,515
12,045
14,501
20,379
359
TToottaall
PPrroojjeecctt FFYY2200 FFYY2211 FFYY2222 FFYY2233 FFYY2244 FFYY2255 FFYY2266 FFuuttuurree
077,775
0
119
PPllaannnneedd EExxppeennddiittuurreess
21,632
125with inflation
62044042-Shoreline Early Implementation 0
FY 21 FY 22 FY 23 FY 24 FY 25 FY 26 FY 27 FY 28 FY 29 FY 30 FY 31
77,775
22,236
49,186
152,147000044026-San Francisco Bay Shoreline
134,972
200
208,082
Cost
100
Operating costs will be determined upon completion of the construction phase.
July 2005 to June 2028Plan
Design
Construct
Closeout
0
2244,,003366
2222,,999911
1,589
1,735
0
0
44,,227733
33,,557744 221199,,008866
30,572
33,483
0
0
AAccttuuaallss TThhrruu
20,379 100
with inflation
1,025 5,200
17,492 23 0 0 0 0 0
0
26444001-EIA 11 Design & Part Construction
00
2,591
359
4411,,223333
21,632
0
754 1,359 1,684
4411,,223333
31,462with inflation 3,003 754 1,359
7788,,555522
7788,,555522
1133,,440000
1177,,775555
1,839 2,957 1,222 6,480
3366,,444400
3344,,116633
26444002 - EIAs 1-4 3,003
221199,,008866
0
0
1100,,334433 1177,,775555
1,735
0
44,,666666
33,483
0
3377,,558811
119
0
44,,991199
13,848 31,462
FFuuttuurree
0 17,510
FFYY2233 FFYY2244 FFYY2255 FFYY2266FFYY2222
Actuals include project expenditures, and encumbrances.
359
TToottaall
26444001-EIA 11 Design & Part Construction 17,510 5 0 0 0 0 0 0
0
0
0
21,632
0
2244,,003366
Adjusted Budget includes adopted budget plus approved budget adjustments.
49,843
7711,,446699TTOOTTAALL
125
0
0
with inflation 17,492 23
4488,,331166 00
TTOOTTAALL
with inflation
BBuuddggeett TThhrruu
AAddjj.. BBuuddggeett
EEsstt.. UUnnssppeenntt PPllaannnneedd FFuunnddiinngg RReeqquueessttss
0 0 0 0
Permits 1,195
13,848
PPrroojjeecctt
26444002 - EIAs 1-4 3,757 0 0 1,359 1,839 2,957 1,222 6,480
0 0
48,311 155,24800044026-San Francisco Bay Shoreline
62044042-Shoreline Early Implementation 359
FFYY2200 FFYY2211
2,011
63,479420
60,844831
SCVWD Clean, Safe Creeks and Natural Flood Protection Fund (Environmental Enhancement Grant)SCVWD Safe, Clean Water and Natural Flood Protection FundCalifornia Department of Water ResourcesSFBRA Measure AA (Grant)SFBRA Measure AA (Ballot Reimbursement)
1,045 1,000 1,000 3,000 3,000 3,000
9911,,225500TToottaall PPaarrttnneerrsshhiipp FFuunnddiinngg ffoorr IInn--kkiinndd SSeerrvviicceess
219,086TToottaallState of California
Federal Partners, South Bay Salt Ponds (SBSP)State, SBSPFoundations, Packard-Hewlett-Goldman-Moore, SBSPCoastal Conservancy, ShorelineFederal, USACE, Shoreline
48,47014,72017,060
2,0108,990
58,118
33,383SCVWD Watershed Stream Stewardship Fund
3,907 14,50126444004 - EIAs 5-10 0 0 0 1,045 1,092 1,141 3,578 3,739
with inflation 0 0 1,045 1,092 1,141 3,578 3,739 3,907
26444004 - EIAs 5-10 0 0
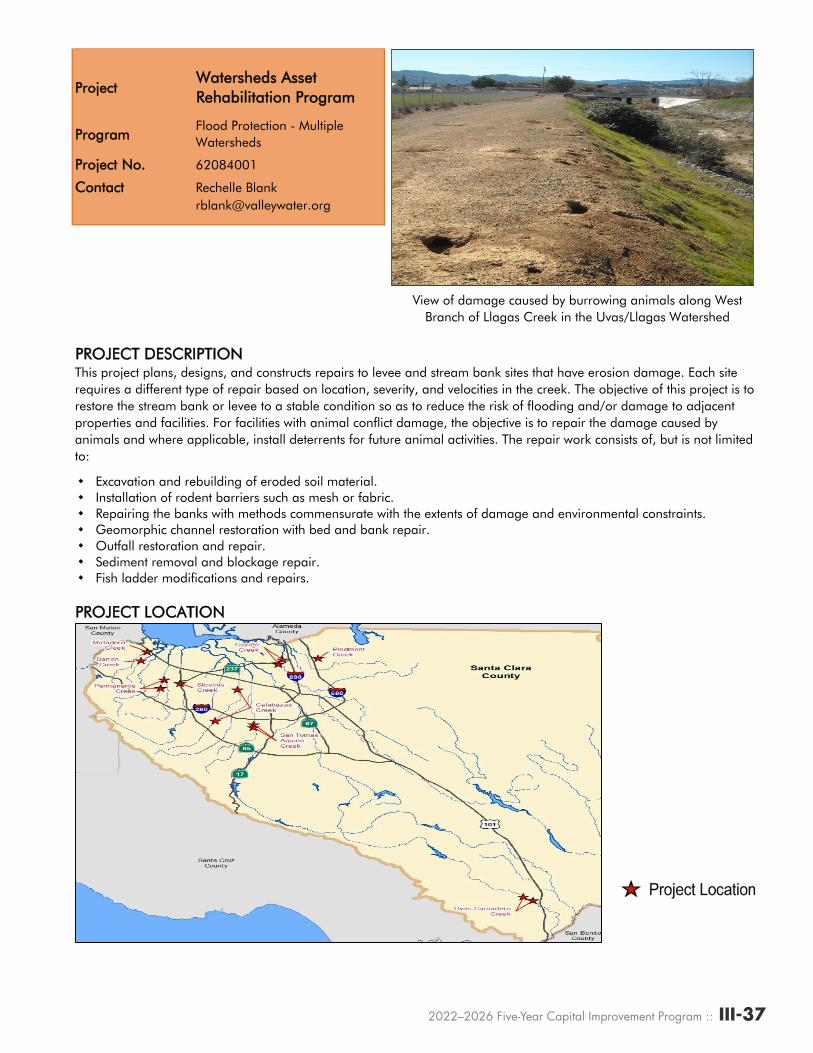
III-36 :: 2022–2026 Five-Year Capital Improvement Program 2022–2026 Five-Year Capital Improvement Program :: III-37
PPrroojjeecctt
PPrrooggrraamm
PPrroojjeecctt NNoo.. 62084001
CCoonnttaacctt Rechelle [email protected]
PPRROOJJEECCTT DDEESSCCRRIIPPTTIIOONN
e
e
e
e
e Outfall restoration and repair.e Sediment removal and blockage repair.e Fish ladder modifications and repairs.
PPRROOJJEECCTT LLOOCCAATTIIOONN
Repairing the banks with methods commensurate with the extents of damage and environmental constraints.Installation of rodent barriers such as mesh or fabric.
This project plans, designs, and constructs repairs to levee and stream bank sites that have erosion damage. Each site requires a different type of repair based on location, severity, and velocities in the creek. The objective of this project is to restore the stream bank or levee to a stable condition so as to reduce the risk of flooding and/or damage to adjacent properties and facilities. For facilities with animal conflict damage, the objective is to repair the damage caused by animals and where applicable, install deterrents for future animal activities. The repair work consists of, but is not limited to:
Excavation and rebuilding of eroded soil material.
WWaatteerrsshheeddss AAsssseett RReehhaabbiilliittaattiioonn PPrrooggrraamm
Flood Protection - Multiple Watersheds
Geomorphic channel restoration with bed and bank repair.
View of damage caused by burrowing animals along West Branch of Llagas Creek in the Uvas/Llagas Watershed

III-38 :: 2022–2026 Five-Year Capital Improvement Program
SSCCHHEEDDUULLEE && SSTTAATTUUSS Phase
EEXXPPEENNDDIITTUURREE SSCCHHEEDDUULLEE(in thousands $)
FFUUNNDDIINNGG SSCCHHEEDDUULLEE(in thousands $)
FFUUNNDDIINNGG SSOOUURRCCEESS(in thousands $)
OOPPEERRAATTIINNGG CCOOSSTT IIMMPPAACCTTSS
UUSSEEFFUULL LLIIFFEE: Not Available
Permits 4,985
35,831
FFYY2266PPrroojjeecctt
62084001-Watersheds Asset Rehabilitation Program 2,730
FFYY2222 FFuuttuurree
FY 24 FY 26
182,574
FY 31
FFYY2266
Construct
Closeout
FY 23
FFYY2211 FFuuttuurree
2,646
The completion of this project is not anticipated to increase or decrease annual operating costs, as the project does not significantly alter existing facilities or modes of operation.
10,910
FFYY2244
2,646
FFYY2233
2,829 182,5742,566
FFYY2255
3,531
SCVWD Watershed Stream Stewardship FundCity of Palo Alto (Matadero Creek)
TToottaall
182,574227
118822,,557744
Adjusted Budget includes adopted budget plus approved budget adjustments.
121,5307,809
FFYY2244
Several small projects go through the design and construction phases each year under the Stream Maintenance Program 2 permit.
2,566
BBuuddggeett TThhrruu
with inflation
670
FFYY2211FFYY2200
5,800 18,719 2,372
5,800 18,719
FFYY2255
TToottaallPPllaannnneedd FFuunnddiinngg RReeqquueessttss
FY 25FY 21 FY 22
TToottaall
2,351
AAccttuuaallss TThhrruu
25,753
FFYY2200
2,829 121,530
FY 29 FY 30
AAddjj.. BBuuddggeett
EEsstt.. UUnnssppeenntt
2,321 87,457
Plan
Design
Actuals include project expenditures, and encumbrances.
2,331
2,730
PPrroojjeecctt
62084001-Watersheds Asset Rehabilitation Program 25,753
19,595
94,785
Cost
3,512
147,104
PPllaannnneedd EExxppeennddiittuurreess
FFYY2233FFYY2222
147,104
FY 27 FY 28