2009 quarterly state of the market report for pjm: january...
TRANSCRIPT
© 2009 Monitoring Analytics, LLC www.monitoringanalytics.com 3
Color: PMS7483 | Logo Font: Futura Medium | Tint: 40% | 9/13/08
ENERgy MARkET, PART 1 31 2 486 7 AEC D FJH I K
5B
APP
ENDIX
GL
M N O
APP
ENDIX
SECTION
SECTION
APP
ENDIX
SECTION
SECTION
APP
ENDIX
SECTION
APP
ENDIX
SECTION
SECTION
APP
ENDIX
APP
ENDIX
APP
ENDIX
APP
ENDIX
APP
ENDIX
APP
ENDIX
APP
ENDIX
APP
ENDIX
APP
ENDIX
PREF
ACE
APP
ENDIX
VOLU
ME
1SECTION
2009 Quarterly State of the Market Report for PJM: January through June
SecTION 2 – eNerGY MarkeT, ParT 1
The PJM Energy Market comprises all types of energy transactions, including the sale or purchase of energy in PJM’s Day-Ahead and Real-Time Energy Markets, bilateral and forward markets and self-supply. Energy transactions analyzed in this report include those in the PJM Day-Ahead and Real-Time Energy Markets. These markets provide key benchmarks against which market participants may measure results of transactions in other markets.
The Market Monitoring Unit (MMU) analyzed measures of market structure, participant conduct and market performance for the first six months of 2009, including market size, concentration, residual supply index, price-cost markup, net revenue and price.1 The MMU concludes that the PJM Energy Market results were competitive in the first six months of 2009.
PJM markets are designed to promote competitive outcomes derived from the interaction of supply and demand in each of the PJM markets. Market design itself is the primary means of achieving and promoting competitive outcomes in PJM markets. One of the MMU’s primary goals is to identify actual or potential market design flaws.2 PJM’s market power mitigation goals have focused on market designs that promote competition (a structural basis for competitive outcomes) and on limiting market power mitigation to instances where the market structure is not competitive and thus where market design alone cannot mitigate market power. In the PJM Energy Market, this occurs only in the case of local market power. When a transmission constraint creates the potential for local market power, PJM applies a structural test to determine if the local market is competitive, applies a behavioral test to determine if generator offers exceed competitive levels and applies a market performance test to determine if such generator offers would affect the market price.
1 Analysis of the first six months of 2009 market results requires comparison to prior years. During calendar years 2004 and 2005, PJM conducted the phased integration of five control zones: ComEd, American Electric Power (AEP), The Dayton Power & Light Company (DAY), Duquesne Light Company (DLCO) and Dominion. By convention, control zones bear the name of a large utility service provider working within their boundaries. The nomenclature applies to the geographic area, not to any single company. For additional information on the control zones, the integrations, their timing and their impact on the footprint of the PJM service territory, see the 2008 State of the Market Report for PJM, Volume II, Appendix A, “PJM Geography.”
2 See PJM. “Open Access Transmission Tariff (OATT),” “Attachment M: Market Monitoring Plan,” First Revised Sheet No. 448.05 (Effective August 1, 2008).
Overview
Market Structure
Supply. • During the April through June 2009 quarter, the PJM Energy Market received an hourly average of 153,310 MW in supply offers including hydroelectric generation.3 The second quarter 2009 average supply offers were 2,149 MW lower than the second quarter 2008 average supply of 155,459 MW.
Demand. • The PJM system peak load in the second quarter 2009 was 116,732 MW in the hour ended 1700 EPT on June 25, 2009, while the PJM peak load in the second quarter 2008 was 130,100 in the hour ended 1700 on June 9, 2008.4 The 2009 second quarter peak load was 13,368 MW, or 11.5 percent, lower than the second quarter 2008 peak load.
Market Concentration. • Concentration ratios are a summary measure of market share, a key element of market structure. High concentration ratios indicate comparatively smaller numbers of sellers dominating a market, while low concentration ratios mean larger numbers of sellers splitting market sales more equally. High concentration ratios indicate an increased potential for participants to exercise market power, although low concentration ratios do not necessarily mean that a market is competitive or that participants cannot exercise market power. Analysis of the PJM Energy Market indicates moderate market concentration overall. Analyses of supply curve segments indicate moderate concentration in the base load segment, but high concentration in the intermediate and peaking segments.
3 Calculated values shown in Section 2, “Energy Market, Part 1,” are based on unrounded, underlying data and may differ from calculations based on the rounded values shown in tables.
4 For the purpose of 2009 Quarterly State of the Market Report for PJM: January through June, all hours are presented and all hourly data are analyzed using Eastern Prevailing Time (EPT). See 2008 State of the Market Report for PJM, Appendix M, “Glossary,” for a definition of EPT and its relationship to Eastern Standard Time (EST) and Eastern Daylight Time (EDT).

© 2009 Monitoring Analytics, LLC www.monitoringanalytics.com4
ENERgy MARkET, PART 131 2 486 7 AEC D FJH I K
5B
APP
ENDIX
GL
M N O
APP
ENDIX
SECTION
SECTION
APP
ENDIX
SECTION
SECTION
APP
ENDIX
SECTION
APP
ENDIX
SECTION
SECTION
APP
ENDIX
APP
ENDIX
APP
ENDIX
APP
ENDIX
APP
ENDIX
APP
ENDIX
APP
ENDIX
APP
ENDIX
APP
ENDIX
PREF
ACE
APP
ENDIX
VOLU
ME
1SECTION
2009 Quarterly State of the Market Report for PJM: January through June
Local Market Structure and Offer Capping. • Noncompetitive local market structure is the trigger for offer capping. PJM applied a flexible, targeted, real-time approach to offer capping (the three pivotal supplier test) as the trigger for offer capping in January through June 2009. PJM offer caps units only when the local market structure is noncompetitive. Offer capping is an effective means of addressing local market power. Offer-capping levels have historically been low in PJM. In the Day-Ahead Energy Market offer-capped unit hours were 0.2 percent of all hours in the first six months of 2009, the same level as 2008. In the Real-Time Energy Market offer-capped unit hours fell from 1.0 percent in 2008 to 0.5 percent of all hours in the first six months of 2009 .
Local Market Structure. • A summary of the results of PJM’s application of the three pivotal supplier test is presented for all constraints which occurred for 50 or more hours during the first two quarters of calendar year 2009. During the first two quarters of 2009 (January 1, 2009 through June 30, 2009), the PSEG, AP, AEP, PENELEC, Dominion, AECO, DLCO, ComEd, PECO and BGE Control Zones experienced congestion resulting from one or more constraints binding for 50 or more hours. The analysis of the application of the three pivotal supplier test to local markets demonstrates that it is working successfully to ensure that owners are not subject to offer capping when the market structure is competitive and to offer cap only pivotal owners when the market structure is noncompetitive .
Market conduct
Price-Cost Markup. • The price-cost markup index is a measure of conduct or behavior by the owners of generating units and not a measure of market impact. For marginal units, the markup index is a measure of market power. A positive markup by marginal units will result in a difference between the observed market price and the competitive market price. The markup index for each marginal unit is calculated as (Price – Cost)/Price.5 The markup index is normalized and can vary from -1.00 when the offer price is less than marginal cost, to 1.00 when the offer price is higher than marginal cost.6 In the real time market, the average markup index from January to June 2009 was -0.07 with a monthly average maximum of -0.04 in January and a monthly average minimum of -0.1 in April. In the day ahead market, the average markup index from January to June 2009 was 0.0036 with a monthly average maximum of 0.02 in February and a minimum of -0.02 in April. The overall results support the conclusion that prices in PJM are set, on average, by marginal units operating at or close to their marginal costs. This is strong evidence of competitive behavior.
Market Performance: Markup, Load and Locational Marginal Price
Markup. • The markup conduct of individual owners and units has an impact on market prices. The MMU calculates explicit measures of the impact of marginal unit markups on LMP. The LMP impact is a measure of market power. The price impact of markup must be interpreted carefully. The price impact is not based on a full redispatch of the system, as such a full redispatch is practically impossible because it would require reconsideration of all dispatch decisions and unit commitments. The markup impact includes the maximum impact of the identified markup conduct on a unit by unit basis, but the inclusion of negative markup impacts has an offsetting effect. The markup analysis does not distinguish between intervals in which a unit has local market power or has a price impact in an unconstrained interval. The markup analysis is a more general measure of the competitiveness of the Energy Market.
The markup component of the overall PJM real-time, load-weighted, average LMP was $-3.10 per MWh, or -7.3 percent. The markup was
5 A marginal unit’s offer price does not always correspond to the LMP at the unit’s bus. As a general matter the LMP at a bus is equal to the unit’s offer. However in practice, actual, security-constrained dispatch can create conditions where the LMP at a marginal unit bus does not correspond to the unit’s offer. The marginal unit’s offer price and associated cost are used when calculating measures of participant behavior or conduct, like markup.
6 In order to normalize the index results (i.e., bound the results between +1.00 and -1.00), the index is calculated as (Price – Cost)/Price when price is greater than cost, and (Price – Cost)/Cost when price is less than cost.
© 2009 Monitoring Analytics, LLC www.monitoringanalytics.com 5
ENERgy MARkET , PART 1 31 2 486 7 AEC D FJH I K
5B
APP
ENDIX
GL
M N O
APP
ENDIX
SECTION
SECTION
APP
ENDIX
SECTION
SECTION
APP
ENDIX
SECTION
APP
ENDIX
SECTION
SECTION
APP
ENDIX
APP
ENDIX
APP
ENDIX
APP
ENDIX
APP
ENDIX
APP
ENDIX
APP
ENDIX
APP
ENDIX
APP
ENDIX
PREF
ACE
APP
ENDIX
VOLU
ME
1SECTION
2009 Quarterly State of the Market Report for PJM: January through June
$-2.49 per MWh during peak hours and $-3.74 per MWh during off-peak hours.
The markup component of the overall PJM day-ahead, load-weighted, average LMP was -$0.05 per MWh, or -0.1 percent. The markup was $0.84 per MWh during peak hours and -$1.01 per MWh during off-peak hours.
The overall results support the conclusion that prices in PJM are set, on average, by marginal units operating at or close to their marginal costs. This is strong evidence of competitive behavior and competitive market performance.
Load.• On average, PJM real-time load decreased in the first six months of 2009 by 3.4 percent from the first six months of 2008, falling from 78,684 MW to 75,993 MW. PJM day-ahead load decreased in the first six months of 2009 by 7.1 percent from the first six months of 2008, falling from 95,485 MW to 88,688 MW.
Prices. • PJM LMPs are a direct measure of market performance. Price level is a good, general indicator of market performance, although the number of factors influencing the overall level of prices means it must be analyzed carefully. For example, overall average prices subsume congestion (price differences at a point in time) and price differences over time.
PJM Real-Time Energy Market prices decreased in the first six months of 2009 compared to the first six months of 2008. The system simple average LMP was 42.9 percent lower in the first six months of 2009 than in the first six months of 2008, $40.12 per MWh versus $70.19 per MWh. The load-weighted LMP was 43.2 percent lower in the first six months of 2009 than in the first six months of 2008, $42.48 per MWh versus $74.77 per MWh. The fuel-cost-adjusted, load-weighted, average LMP was 6.4 percent lower in the first six months of 2009 than the load-weighted, average LMP in the first six months of 2008, $70.00 per MWh compared to $74.77 per MWh. Fuel costs and lower loads in the first half of 2009 contributed to downward pressure on LMP.
PJM Day-Ahead Energy Market prices decreased in the first six months of 2009 compared to the first six months of 2008. The system simple average LMP was 42.9 percent lower in the first six months of 2009 than in the first six months of 2008, $40.01 per MWh versus $70.12 per
MWh. The load-weighted LMP was 42.7 percent lower in the first six months of 2009 than in the first six months of 2008, $42.21 per MWh versus $73.71 per MWh.
Load and Spot Market. • Real-time load is served by a combination of self-supply, bilateral market purchases and spot market purchases. From the perspective of a single PJM parent company that serves load, its load can be supplied by any combination of its own generation, net bilateral market purchases and net spot market purchases. In the first six months of 2009, 13.4 percent of real-time load was supplied by bilateral contracts, 16.4 percent by spot market purchases and 70.2 percent by self-supply. Compared with 2008, reliance on bilateral contracts decreased by 1.3 percentage points; reliance on spot supply decreased by 3.7 percentage points; and reliance on self-supply increased by 5.0 percentage points in January through June 2009.
Demand-Side response
Demand-Side Response (DSR). • Markets require both a supply side and a demand side to function effectively . PJM wholesale market, demand-side programs should be understood as one relatively small part of a transition to a fully functional demand side for its Energy Market. A fully developed demand side will include retail programs and an active, well-articulated interaction between wholesale and retail markets. There are significant issues with the current approach to measuring demand-side response MW, which is the basis on which program participants are paid. The current approach can and has resulted in payments when the customer has taken no action to respond to market prices. A substantial improvement in measurement and verification methods must be implemented in order to ensure the credibility of PJM demand-side programs. Recent changes to the settlement review process represent clear improvements, but do not go far enough.
Total demand-side response resources available in PJM on January 16, 2009 (the peak day in January through June 2009), were 4,498.2 MW eligible for capacity credits and 1,957.8 MW eligible for energy payments from the Emergency Load-Response Program and 3,311.0 MW from the Economic Load-Response Program.
© 2009 Monitoring Analytics, LLC www.monitoringanalytics.com6
ENERgy MARkET, PART 131 2 486 7 AEC D FJH I K
5B
APP
ENDIX
GL
M N O
APP
ENDIX
SECTION
SECTION
APP
ENDIX
SECTION
SECTION
APP
ENDIX
SECTION
APP
ENDIX
SECTION
SECTION
APP
ENDIX
APP
ENDIX
APP
ENDIX
APP
ENDIX
APP
ENDIX
APP
ENDIX
APP
ENDIX
APP
ENDIX
APP
ENDIX
PREF
ACE
APP
ENDIX
VOLU
ME
1SECTION
2009 Quarterly State of the Market Report for PJM: January through June
Participation in the Economic Load-Response Program, in terms of settlement days submitted and active customers, has decreased significantly in the first six months of 2009 compared to the same period in 2008, resulting from a combination of program verification improvements implemented in 2008, and lower price levels across PJM in 2009. Participation in the Load Management (LM) Program has increased significantly, both in Demand Response offering into RPM Auctions and ILR available in delivery year 2009/2010.
conclusion
The MMU analyzed key elements of PJM Energy Market structure, participant conduct and market performance for the first six months of 2009, including aggregate supply and demand, concentration ratios, local market concentration ratios, price-cost markup, offer capping, participation in demand-side response programs, loads and prices in this section of the report. The next section continues the analysis of the PJM Energy Market including additional measures of market performance.
Aggregate supply decreased by about 2,149 MW when comparing the second quarter of 2009 to the second quarter of 2008 while aggregate peak load decreased by 13,368 MW, modifying the general supply demand balance from 2008 with a corresponding impact on peak Energy Market prices. Overall load was also lower than in second quarter 2008. Market concentration levels remained moderate and average markup was negative. This relationship between supply and demand, regardless of the specific market, balanced by market concentration, is referred to as supply-demand fundamentals or economic fundamentals. While the market structure does not guarantee competitive outcomes, overall the market structure of the PJM aggregate Energy Market remains reasonably competitive for most hours.
Prices are a key outcome of markets. Prices vary across hours, days and years for multiple reasons. Price is an indicator of the level of competition in a market although individual prices are not always easy to interpret. In a competitive market, prices are directly related to the marginal cost of the most expensive unit required to serve load. LMP is a broader indicator of the level of competition. While PJM has experienced price spikes, these have been limited in duration and, in general, prices in PJM have been well below the marginal cost of the highest cost unit installed on the system. The significant price spikes in PJM have been directly related to scarcity
conditions. In PJM, prices tend to increase as the market approaches scarcity conditions as a result of generator offers and the associated shape of the aggregate supply curve. The pattern of prices within days and across months and years illustrates how prices are directly related to demand conditions and thus also illustrates the potential significance of price elasticity of demand in affecting price.
The three pivotal supplier test is applied by PJM on an ongoing basis for local energy markets in order to determine whether offer capping is required for transmission constraints. This is a flexible, targeted real-time measure of market structure which replaced the offer capping of all units required to relieve a constraint. A generation owner or group of generation owners is pivotal for a local market if the output of the owners’ generation facilities is required in order to relieve a transmission constraint. When a generation owner or group of owners is pivotal, it has the ability to increase the market price above the competitive level. The three pivotal supplier test, as implemented, is consistent with the United States Federal Energy Regulatory Commission’s (FERC’s) market power tests, encompassed under the delivered price test. The three pivotal supplier test is an application of the delivered price test to both the Real-Time Market and hourly Day-Ahead Market. The three pivotal supplier test explicitly incorporates the impact of excess supply and implicitly accounts for the impact of the price elasticity of demand in the market power tests.
The result of the introduction of the three pivotal supplier test was to limit offer capping to times when the local market structure was noncompetitive and specific owners had structural market power. The analysis of the application of the three pivotal supplier test demonstrates that it is working successfully to exempt owners when the local market structure is competitive and to offer cap owners when the local market structure is noncompetitive.
Energy Market results for the first six months of 2009 generally reflected supply-demand fundamentals. Lower prices in the Energy Market were the result of lower fuel costs and of lower demand. PJM Real-Time, load-weighted, average LMP for the first six months of 2009 was 43.2 percent lower than the load-weighted, average LMP for the first six months of 2008. The real-time, fuel-cost-adjusted, load-weighted, average LMP in the first six months of 2009 was only 6.4 percent lower than the load-weighted LMP in the first six months of 2008. In other words, if fuel costs for the first six months of 2009 had been the same as for the first six months of 2008, the 2009 load-weighted LMP would have been higher, $70.00 per MWh and 6.4 percent lower than the first half of 2008, instead of the observed $42.48 per

© 2009 Monitoring Analytics, LLC www.monitoringanalytics.com 7
ENERgy MARkET , PART 1 31 2 486 7 AEC D FJH I K
5B
APP
ENDIX
GL
M N O
APP
ENDIX
SECTION
SECTION
APP
ENDIX
SECTION
SECTION
APP
ENDIX
SECTION
APP
ENDIX
SECTION
SECTION
APP
ENDIX
APP
ENDIX
APP
ENDIX
APP
ENDIX
APP
ENDIX
APP
ENDIX
APP
ENDIX
APP
ENDIX
APP
ENDIX
PREF
ACE
APP
ENDIX
VOLU
ME
1SECTION
2009 Quarterly State of the Market Report for PJM: January through June
MWh. Lower fuel prices in 2009 resulted in lower prices in 2009 than would have occurred if fuel prices had remained at 2008 levels.
The overall market results support the conclusion that prices in PJM are set, on average, by marginal units operating at, or close to, their marginal costs. This is evidence of competitive behavior and competitive market outcomes. Given the structure of the Energy Market, tighter markets or a change in participant behavior remain potential sources of concern in the Energy Market. The MMU concludes that the PJM Energy Market results were competitive in the first six months of 2009.
Market Structure
Supply
Average PJM aggregate supply curves: April through June 2008 and 2009 (See 2008 Figure 2-1 SOM, Figure 2-1)
Demand
Actual PJM footprint quarter 2 peak loads: 2005 to 2009 (See 2008 SOM, Table 2-2)Table 2-1
Year Date Hour Ending (EPT) PJM Load (MW) Difference (MW)2005 28-Jun-05 1600 124,052 NA
2006 30-May-06 1700 121,165 (2,887)
2007 27-Jun-07 1600 130,971 9,806
2008 9-Jun-08 1700 130,100 (871)
2009 25-Jun-09 1700 116,732 (13,368)
PJM quarter 2 peak-load comparison: Thursday, June 25, 2009, and Monday, Figure 2-2 June 9, 2008 (See 2008 SOM, Figure 2-2)
© 2009 Monitoring Analytics, LLC www.monitoringanalytics.com8
ENERgy MARkET, PART 131 2 486 7 AEC D FJH I K
5B
APP
ENDIX
GL
M N O
APP
ENDIX
SECTION
SECTION
APP
ENDIX
SECTION
SECTION
APP
ENDIX
SECTION
APP
ENDIX
SECTION
SECTION
APP
ENDIX
APP
ENDIX
APP
ENDIX
APP
ENDIX
APP
ENDIX
APP
ENDIX
APP
ENDIX
APP
ENDIX
APP
ENDIX
PREF
ACE
APP
ENDIX
VOLU
ME
1SECTION
2009 Quarterly State of the Market Report for PJM: January through June
Market concentration
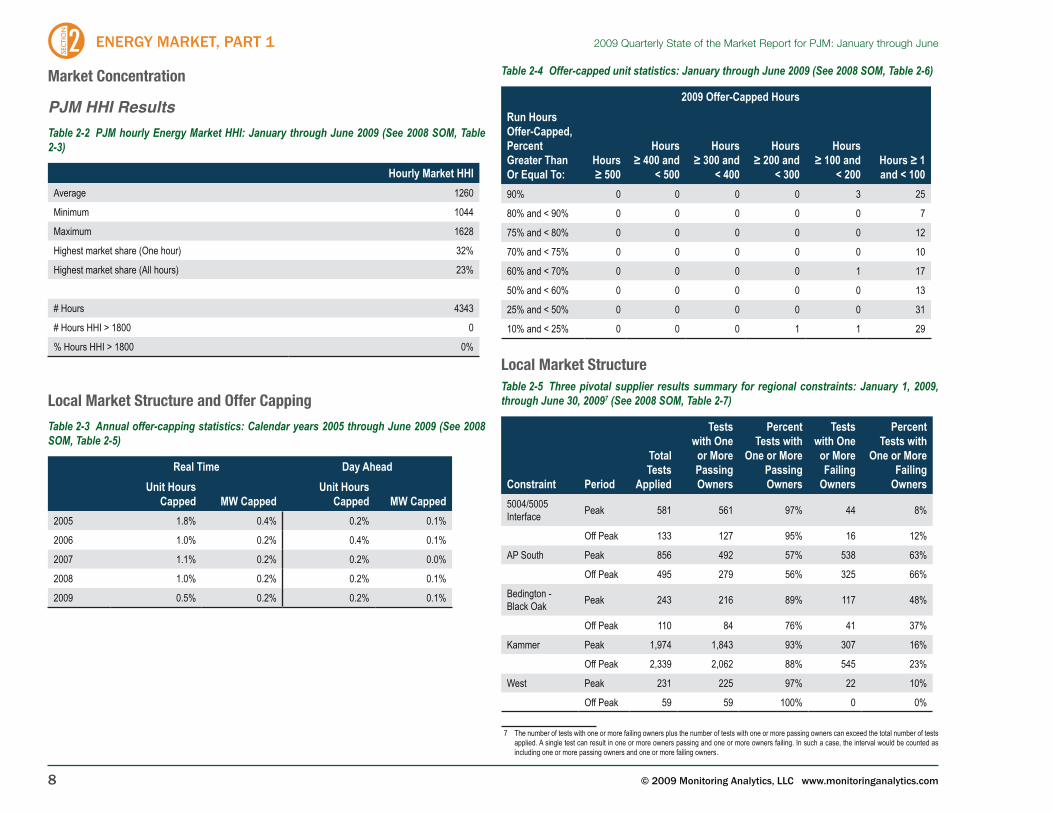
PJM HHI ResultsPJM hourly Energy Market HHI: January through June 2009 (See 2008 SOM, Table Table 2-2
2-3)
Hourly Market HHIAverage 1260
Minimum 1044
Maximum 1628
Highest market share (One hour) 32%
Highest market share (All hours) 23%
# Hours 4343
# Hours HHI > 1800 0
% Hours HHI > 1800 0%
Local Market Structure and Offer capping
Annual offer-capping statistics: Calendar years 2005 through June 2009 (See 2008 Table 2-3 SOM, Table 2-5)
Real Time Day AheadUnit Hours
Capped MW CappedUnit Hours
Capped MW Capped2005 1.8% 0.4% 0.2% 0.1%
2006 1.0% 0.2% 0.4% 0.1%
2007 1.1% 0.2% 0.2% 0.0%
2008 1.0% 0.2% 0.2% 0.1%
2009 0.5% 0.2% 0.2% 0.1%
Offer-capped unit statistics: January through June 2009 (See 2008 SOM, Table 2-6)Table 2-4
2009 Offer-Capped HoursRun Hours Offer-Capped, Percent Greater Than Or Equal To:
Hours ≥ 500
Hours ≥ 400 and
< 500
Hours ≥ 300 and
< 400
Hours ≥ 200 and
< 300
Hours ≥ 100 and
< 200Hours ≥ 1 and < 100
90% 0 0 0 0 3 25
80% and < 90% 0 0 0 0 0 7
75% and < 80% 0 0 0 0 0 12
70% and < 75% 0 0 0 0 0 10
60% and < 70% 0 0 0 0 1 17
50% and < 60% 0 0 0 0 0 13
25% and < 50% 0 0 0 0 0 31
10% and < 25% 0 0 0 1 1 29
Local Market StructureThree pivotal supplier results summary for regional constraints: January 1, 2009, Table 2-5
through June 30, 20097 (See 2008 SOM, Table 2-7)
Total Tests
Applied
Tests with One
or More Passing Owners
Percent Tests with
One or More Passing Owners
Tests with One
or More Failing
Owners
Percent Tests with
One or More Failing
OwnersConstraint Period5004/5005 Interface Peak 581 561 97% 44 8%
Off Peak 133 127 95% 16 12%
AP South Peak 856 492 57% 538 63%
Off Peak 495 279 56% 325 66%
Bedington - Black Oak Peak 243 216 89% 117 48%
Off Peak 110 84 76% 41 37%
Kammer Peak 1,974 1,843 93% 307 16%
Off Peak 2,339 2,062 88% 545 23%
West Peak 231 225 97% 22 10%
Off Peak 59 59 100% 0 0%
7 The number of tests with one or more failing owners plus the number of tests with one or more passing owners can exceed the total number of tests applied. A single test can result in one or more owners passing and one or more owners failing. In such a case, the interval would be counted as including one or more passing owners and one or more failing owners.

© 2009 Monitoring Analytics, LLC www.monitoringanalytics.com 9
ENERgy MARkET, PART 1 31 2 486 7 AEC D FJH I K
5B
APP
ENDIX
GL
M N O
APP
ENDIX
SECTION
SECTION
APP
ENDIX
SECTION
SECTION
APP
ENDIX
SECTION
APP
ENDIX
SECTION
SECTION
APP
ENDIX
APP
ENDIX
APP
ENDIX
APP
ENDIX
APP
ENDIX
APP
ENDIX
APP
ENDIX
APP
ENDIX
APP
ENDIX
PREF
ACE
APP
ENDIX
VOLU
ME
1SECTION
2009 Quarterly State of the Market Report for PJM: January through June
Three pivotal supplier test details for regional constraints: January 1, 2009, through Table 2-6 June 30, 20098 (See 2008 SOM, Table 2-8)
Constraint Period
Average Constraint
Relief (MW)
Average Effective
Supply (MW)
Average Number Owners
Average Number Owners Passing
Average Number Owners Failing
5004/5005 Interface Peak 61 346 19 18 1
Off Peak 57 307 17 16 1
AP South Peak 94 286 12 6 6
Off Peak 103 309 11 5 6
Bedington - Black Oak Peak 67 193 12 9 3
Off Peak 57 214 13 9 4
Kammer Peak 49 247 20 18 2
Off Peak 51 234 16 14 2
West Peak 132 592 20 20 1
Off Peak 121 738 18 18 0
Three pivotal supplier results summary for the East and Central interfaces: January Table 2-7 1, 2009, through June 30, 20099 (See 2008 SOM, Table 2-13)
Total Tests
Applied
Tests with One
or More Passing Owners
Percent Tests
with One or More Passing Owners
Tests with One or
More Failing
Owners
Percent Tests
with One or More Failing
OwnersConstraint PeriodCentral Peak 17 17 100% 0 0%
Off Peak 9 9 100% 0 0%
East Peak 0 NA NA NA NA
Off Peak 0 NA NA NA NA
8 The average number of owners passing and the average number of owners failing are rounded to the nearest whole number and may not sum to the average number of owners, also rounded to the nearest whole number.
9 The East Interface constraint did not occur from January 1, 2009 through June 30, 2009. The Central Interface constraint occurred for eight hours from January 1, 2009 through June 30, 2009.
Three pivotal supplier test details for the East and Central interfaces: January 1, Table 2-8 2009, through June 30, 2009 (See 2008 SOM, Table 2-15)
Constraint Period
Average Constraint
Relief (MW)
Average Effective
Supply (MW)
Average Number Owners
Average Number Owners Passing
Average Number Owners Failing
Central Peak 61 565 19 19 0
Off Peak 84 884 19 19 0
East Peak NA NA NA NA NA
Off Peak NA NA NA NA NA
Three pivotal supplier results summary for constraints located in the PSEG Control Table 2-9 Zone: January 1, 2009, through June 30, 2009 (See 2008 SOM, Table 2-17)
Total Tests
Applied
Tests with One
or More Passing Owners
Percent Tests
with One or More Passing Owners
Tests with One
or More Failing
Owners
Percent Tests
with One or More Failing
OwnersConstraint PeriodAthenia - Saddlebrook Peak 292 8 3% 288 99%
Off Peak 122 5 4% 121 99%
Brunswick - Edison Peak 226 6 3% 226 100%
Off Peak 84 0 0% 84 100%
Cedar Grove - Roseland Peak 216 33 15% 199 92%
Off Peak 12 0 0% 12 100%
Plainsboro - Trenton Peak 592 0 0% 592 100%
Off Peak 13 0 0% 13 100%

© 2009 Monitoring Analytics, LLC www.monitoringanalytics.com10
ENERgy MARkET, PART 131 2 486 7 AEC D FJH I K
5B
APP
ENDIX
GL
M N O
APP
ENDIX
SECTION
SECTION
APP
ENDIX
SECTION
SECTION
APP
ENDIX
SECTION
APP
ENDIX
SECTION
SECTION
APP
ENDIX
APP
ENDIX
APP
ENDIX
APP
ENDIX
APP
ENDIX
APP
ENDIX
APP
ENDIX
APP
ENDIX
APP
ENDIX
PREF
ACE
APP
ENDIX
VOLU
ME
1SECTION
2009 Quarterly State of the Market Report for PJM: January through June
Three pivotal supplier test details for constraints located in the PSEG Control Zone: Table 2-10 January 1, 2009, through June 30, 2009 (See 2008 SOM, Table 2-18)
Constraint Period
Average Constraint
Relief (MW)
Average Effective
Supply (MW)
Average Number Owners
Average Number Owners Passing
Average Number Owners Failing
Athenia - Saddle-brook Peak 13 36 3 0 3
Off Peak 10 40 3 0 3
Brunswick - Edison Peak 8 89 1 0 1
Off Peak 6 65 1 0 1
Cedar Grove - Roseland Peak 40 156 8 1 7
Off Peak 27 182 8 0 8
Plainsboro - Trenton Peak 9 122 1 0 1
Off Peak 7 141 1 0 1
Three pivotal supplier results summary for constraints located in the AP Control Table 2-11 Zone: January 1, 2009, through June 30, 2009 (See 2008 SOM, Table 2-19)
Total Tests
Applied
Tests with One
or More Passing Owners
Percent Tests
with One or More Passing Owners
Tests with One
or More Failing
Owners
Percent Tests
with One or More Failing
OwnersConstraint PeriodBedington Peak 569 125 22% 569 100%
Off Peak 333 11 3% 333 100%
Sammis - Wylie Ridge Peak 128 86 67% 53 41%
Off Peak 441 324 73% 204 46%
Tiltonsville - Windsor Peak 918 1 0% 917 100%
Off Peak 217 0 0% 217 100%
Wylie Ridge Peak 695 577 83% 182 26%
Off Peak 945 653 69% 378 40%
Three pivotal supplier test details for constraints located in the AP Control Zone: Table 2-12 January 1, 2009, through June 30, 2009 (See 2008 SOM, Table 2-20)
Constraint Period
Average Constraint
Relief (MW)
Average Effective
Supply (MW)
Average Number Owners
Average Number Owners Passing
Average Number Owners Failing
Bedington Peak 40 4 3 0 2
Off Peak 38 4 3 0 3
Sammis - Wylie Ridge Peak 48 116 17 11 6
Off Peak 54 130 17 11 6
Tiltonsville - Windsor Peak 12 6 2 0 2
Off Peak 7 7 2 0 2
Wylie Ridge Peak 36 147 17 15 2
Off Peak 37 141 14 12 2
Three pivotal supplier results summary for constraints located in the AEP Control Table 2-13 Zone: January 1, 2009, through June 30, 2009 (See 2008 SOM, Table 2-21)
Total Tests
Applied
Tests with One or
More Passing Owners
Percent Tests
with One or More Passing Owners
Tests with One
or More Failing
Owners
Percent Tests with
One or More
Failing OwnersConstraint Period
Cloverdale - Lexington Peak 264 146 55% 178 67%
Off Peak 930 528 57% 602 65%
Kammer - Ormet Peak 1,439 28 2% 1,411 98%
Off Peak 1,965 0 0% 1,965 100%
Kanawha River - Kincaid Peak 318 0 0% 318 100%
Off Peak 240 0 0% 240 100%
Poston - Postel Tap Peak 211 0 0% 211 100%
Off Peak 0 NA NA NA NA
Ruth - Turner Peak 1,263 0 0% 1,263 100%
Off Peak 1,470 0 0% 1,470 100%

© 2009 Monitoring Analytics, LLC www.monitoringanalytics.com 11
ENERgy MARkET, PART 1 31 2 486 7 AEC D FJH I K
5B
APP
ENDIX
GL
M N O
APP
ENDIX
SECTION
SECTION
APP
ENDIX
SECTION
SECTION
APP
ENDIX
SECTION
APP
ENDIX
SECTION
SECTION
APP
ENDIX
APP
ENDIX
APP
ENDIX
APP
ENDIX
APP
ENDIX
APP
ENDIX
APP
ENDIX
APP
ENDIX
APP
ENDIX
PREF
ACE
APP
ENDIX
VOLU
ME
1SECTION
2009 Quarterly State of the Market Report for PJM: January through June
Three pivotal supplier test details for constraints located in the AEP Control Zone: Table 2-14 January 1, 2009, through June 30, 2009 (See 2008 SOM, Table 2-22)
Constraint Period
Average Constraint
Relief (MW)
Average Effective
Supply (MW)
Average Number Owners
Average Number Owners Passing
Average Number Owners Failing
Cloverdale - Lexington Peak 75 223 16 8 8
Off Peak 69 201 14 7 7
Kammer - Ormet Peak 18 21 1 0 1
Off Peak 22 31 1 0 1
Kanawha River - Kincaid Peak 12 4 1 0 1
Off Peak 9 5 1 0 1
Poston - Postel Tap Peak 6 14 1 0 1
Off Peak NA NA NA NA NA
Ruth - Turner Peak 19 3 1 0 1
Off Peak 20 3 1 0 1
Three pivotal supplier results summary for constraints located in the PENELEC Table 2-15 Control Zone: January 1, 2009, through June 30, 2009 (See 2008 SOM, Table 2-25)
Total Tests
Applied
Tests with One
or More Passing Owners
Percent Tests
with One or More Passing Owners
Tests with One
or More Failing
Owners
Percent Tests
with One or More Failing
OwnersConstraint PeriodHomer City - Shelocta Peak 302 20 7% 293 97%
Off Peak 82 0 0% 82 100%
Three pivotal supplier test details for constraints located in the PENELEC Control Table 2-16 Zone: January 1, 2009, through June 30, 2009 (See 2008 SOM, Table 2-26)
Constraint Period
Average Constraint
Relief (MW)
Average Effective
Supply (MW)
Average Number Owners
Average Number Owners Passing
Average Number Owners Failing
Homer City - Shelocta Peak 29 67 5 0 5
Off Peak 47 57 6 0 6
Three pivotal supplier results summary for constraints located in the Dominion Table 2-17 Control Zone: January 1, 2009, through June 30, 2009 (See 2008 SOM, Table 2-27)
Total Tests
Applied
Tests with One
or More Passing Owners
Percent Tests
with One or More Passing Owners
Tests with One
or More Failing
Owners
Percent Tests with
One or More Failing
OwnersConstraint PeriodBeechwood - Kerr Dam Peak 540 0 0% 540 100%
Off Peak 117 0 0% 117 100%
Three pivotal supplier test details for constraints located in the Dominion Control Table 2-18 Zone: January 1, 2009, through June 30, 2009 (See 2008 SOM, Table 2-28)
Constraint Period
Average Constraint
Relief (MW)
Average Effective
Supply (MW)
Average Number Owners
Average Number Owners Passing
Average Number Owners Failing
Beechwood - Kerr Dam Peak 4 4 1 0 1
Off Peak 4 2 1 0 1
Three pivotal supplier results summary for constraints located in the AECO Control Table 2-19 Zone: January 1, 2009, through June 30, 2009 (See 2008 SOM, Table 2-31)
Total Tests
Applied
Tests with One
or More Passing Owners
Percent Tests with
One or More
Passing Owners
Tests with One
or More Failing
Owners
Percent Tests with
One or More
Failing OwnersConstraint Period
Absecon - Lewis Peak 61 0 0% 61 100%
Off Peak 16 0 0% 16 100%
© 2009 Monitoring Analytics, LLC www.monitoringanalytics.com12
ENERgy MARkET, PART 131 2 486 7 AEC D FJH I K
5B
APP
ENDIX
GL
M N O
APP
ENDIX
SECTION
SECTION
APP
ENDIX
SECTION
SECTION
APP
ENDIX
SECTION
APP
ENDIX
SECTION
SECTION
APP
ENDIX
APP
ENDIX
APP
ENDIX
APP
ENDIX
APP
ENDIX
APP
ENDIX
APP
ENDIX
APP
ENDIX
APP
ENDIX
PREF
ACE
APP
ENDIX
VOLU
ME
1SECTION
2009 Quarterly State of the Market Report for PJM: January through June
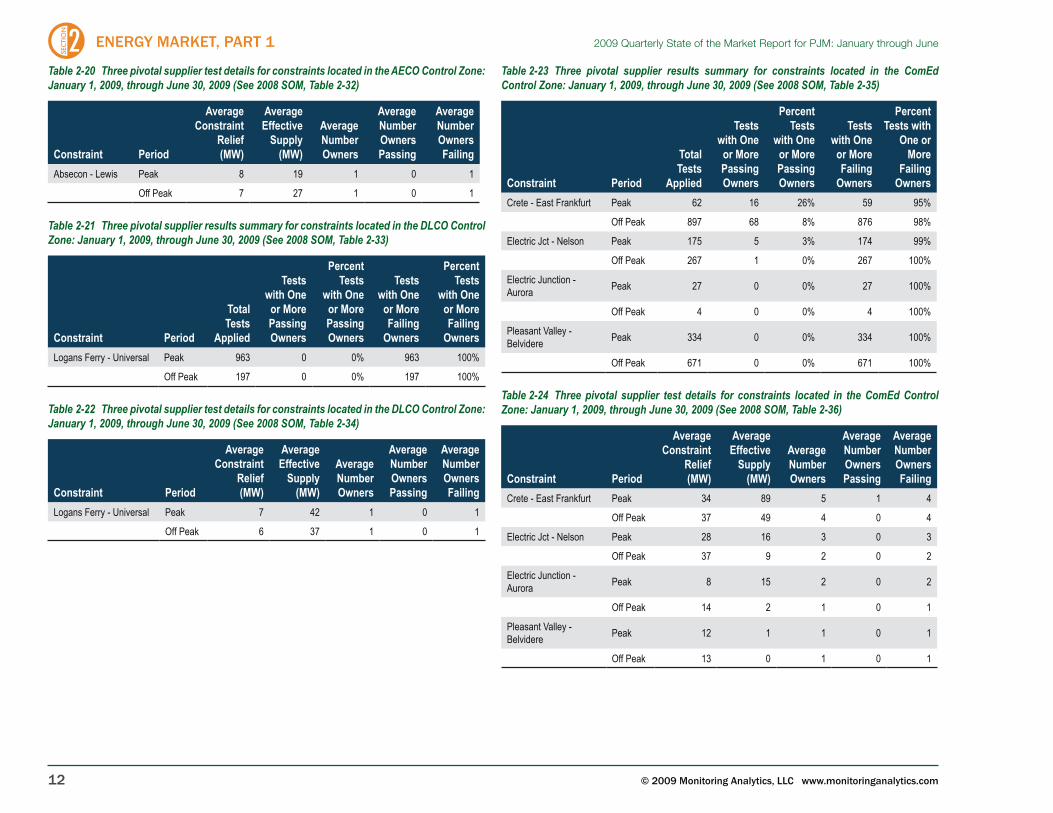
Three pivotal supplier test details for constraints located in the AECO Control Zone: Table 2-20 January 1, 2009, through June 30, 2009 (See 2008 SOM, Table 2-32)
Constraint Period
Average Constraint
Relief (MW)
Average Effective
Supply (MW)
Average Number Owners
Average Number Owners Passing
Average Number Owners Failing
Absecon - Lewis Peak 8 19 1 0 1
Off Peak 7 27 1 0 1
Three pivotal supplier results summary for constraints located in the DLCO Control Table 2-21 Zone: January 1, 2009, through June 30, 2009 (See 2008 SOM, Table 2-33)
Total Tests
Applied
Tests with One
or More Passing Owners
Percent Tests
with One or More Passing Owners
Tests with One
or More Failing
Owners
Percent Tests
with One or More Failing
OwnersConstraint PeriodLogans Ferry - Universal Peak 963 0 0% 963 100%
Off Peak 197 0 0% 197 100%
Three pivotal supplier test details for constraints located in the DLCO Control Zone: Table 2-22 January 1, 2009, through June 30, 2009 (See 2008 SOM, Table 2-34)
Constraint Period
Average Constraint
Relief (MW)
Average Effective
Supply (MW)
Average Number Owners
Average Number Owners Passing
Average Number Owners Failing
Logans Ferry - Universal Peak 7 42 1 0 1
Off Peak 6 37 1 0 1
Three pivotal supplier results summary for constraints located in the ComEd Table 2-23 Control Zone: January 1, 2009, through June 30, 2009 (See 2008 SOM, Table 2-35)
Total Tests
Applied
Tests with One
or More Passing Owners
Percent Tests
with One or More Passing Owners
Tests with One
or More Failing
Owners
Percent Tests with
One or More
Failing OwnersConstraint Period
Crete - East Frankfurt Peak 62 16 26% 59 95%
Off Peak 897 68 8% 876 98%
Electric Jct - Nelson Peak 175 5 3% 174 99%
Off Peak 267 1 0% 267 100%
Electric Junction - Aurora Peak 27 0 0% 27 100%
Off Peak 4 0 0% 4 100%
Pleasant Valley - Belvidere Peak 334 0 0% 334 100%
Off Peak 671 0 0% 671 100%
Three pivotal supplier test details for constraints located in the ComEd Control Table 2-24 Zone: January 1, 2009, through June 30, 2009 (See 2008 SOM, Table 2-36)
Constraint Period
Average Constraint
Relief (MW)
Average Effective
Supply (MW)
Average Number Owners
Average Number Owners Passing
Average Number Owners Failing
Crete - East Frankfurt Peak 34 89 5 1 4
Off Peak 37 49 4 0 4
Electric Jct - Nelson Peak 28 16 3 0 3
Off Peak 37 9 2 0 2
Electric Junction - Aurora Peak 8 15 2 0 2
Off Peak 14 2 1 0 1
Pleasant Valley - Belvidere Peak 12 1 1 0 1
Off Peak 13 0 1 0 1
© 2009 Monitoring Analytics, LLC www.monitoringanalytics.com 13
ENERgy MARkET, PART 1 31 2 486 7 AEC D FJH I K
5B
APP
ENDIX
GL
M N O
APP
ENDIX
SECTION
SECTION
APP
ENDIX
SECTION
SECTION
APP
ENDIX
SECTION
APP
ENDIX
SECTION
SECTION
APP
ENDIX
APP
ENDIX
APP
ENDIX
APP
ENDIX
APP
ENDIX
APP
ENDIX
APP
ENDIX
APP
ENDIX
APP
ENDIX
PREF
ACE
APP
ENDIX
VOLU
ME
1SECTION
2009 Quarterly State of the Market Report for PJM: January through June
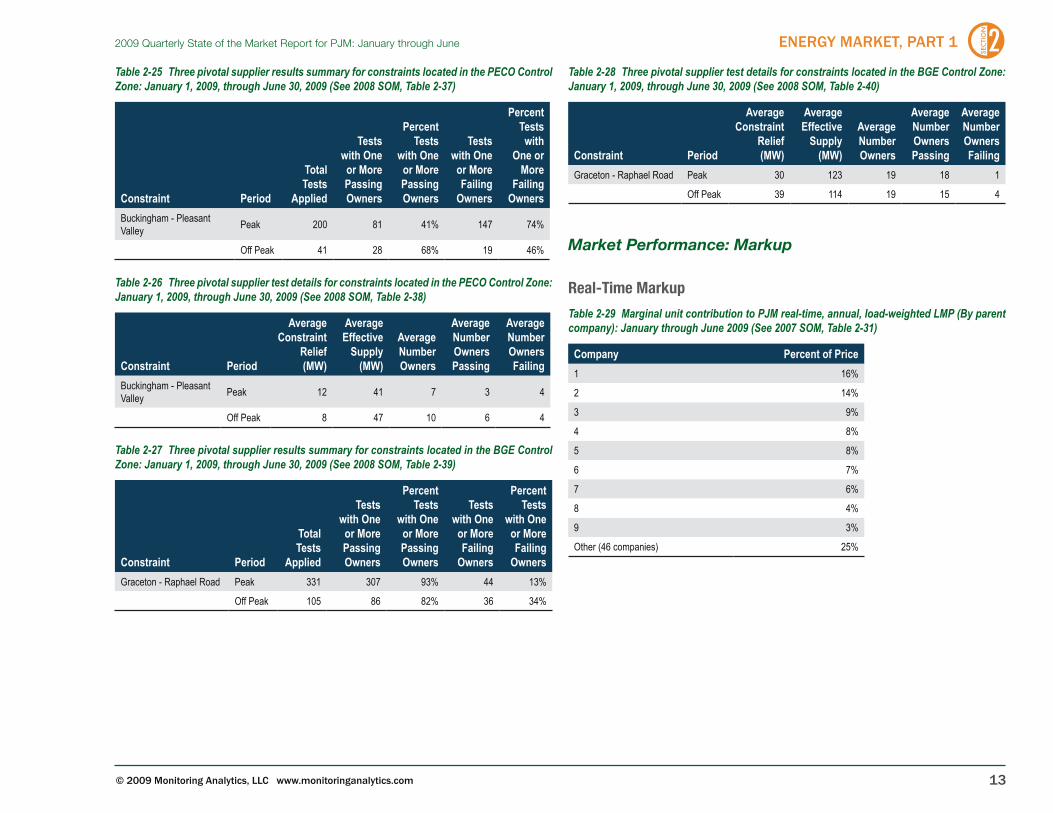
Three pivotal supplier results summary for constraints located in the PECO Control Table 2-25 Zone: January 1, 2009, through June 30, 2009 (See 2008 SOM, Table 2-37)
Total Tests
Applied
Tests with One
or More Passing Owners
Percent Tests
with One or More Passing Owners
Tests with One
or More Failing
Owners
Percent Tests with
One or More
Failing OwnersConstraint Period
Buckingham - Pleasant Valley Peak 200 81 41% 147 74%
Off Peak 41 28 68% 19 46%
Three pivotal supplier test details for constraints located in the PECO Control Zone: Table 2-26 January 1, 2009, through June 30, 2009 (See 2008 SOM, Table 2-38)
Constraint Period
Average Constraint
Relief (MW)
Average Effective
Supply (MW)
Average Number Owners
Average Number Owners Passing
Average Number Owners Failing
Buckingham - Pleasant Valley Peak 12 41 7 3 4
Off Peak 8 47 10 6 4
Three pivotal supplier results summary for constraints located in the BGE Control Table 2-27 Zone: January 1, 2009, through June 30, 2009 (See 2008 SOM, Table 2-39)
Total Tests
Applied
Tests with One
or More Passing Owners
Percent Tests
with One or More Passing Owners
Tests with One
or More Failing
Owners
Percent Tests
with One or More Failing
OwnersConstraint PeriodGraceton - Raphael Road Peak 331 307 93% 44 13%
Off Peak 105 86 82% 36 34%
Three pivotal supplier test details for constraints located in the BGE Control Zone: Table 2-28 January 1, 2009, through June 30, 2009 (See 2008 SOM, Table 2-40)
Constraint Period
Average Constraint
Relief (MW)
Average Effective
Supply (MW)
Average Number Owners
Average Number Owners Passing
Average Number Owners Failing
Graceton - Raphael Road Peak 30 123 19 18 1
Off Peak 39 114 19 15 4
Market Performance: Markup
real-Time Markup
Marginal unit contribution to PJM real-time, annual, load-weighted LMP (By parent Table 2-29 company): January through June 2009 (See 2007 SOM, Table 2-31)
Company Percent of Price1 16%
2 14%
3 9%
4 8%
5 8%
6 7%
7 6%
8 4%
9 3%
Other (46 companies) 25%
© 2009 Monitoring Analytics, LLC www.monitoringanalytics.com14
ENERgy MARkET, PART 131 2 486 7 AEC D FJH I K
5B
APP
ENDIX
GL
M N O
APP
ENDIX
SECTION
SECTION
APP
ENDIX
SECTION
SECTION
APP
ENDIX
SECTION
APP
ENDIX
SECTION
SECTION
APP
ENDIX
APP
ENDIX
APP
ENDIX
APP
ENDIX
APP
ENDIX
APP
ENDIX
APP
ENDIX
APP
ENDIX
APP
ENDIX
PREF
ACE
APP
ENDIX
VOLU
ME
1SECTION
2009 Quarterly State of the Market Report for PJM: January through June
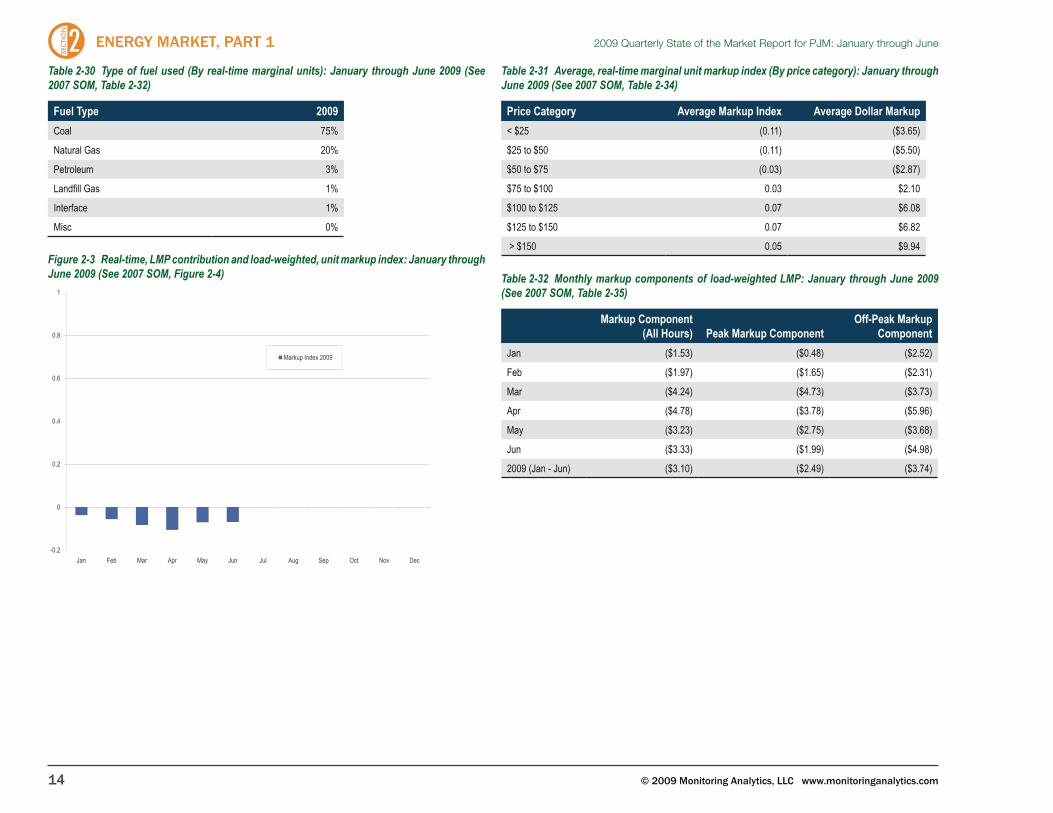
Type of fuel used (By real-time marginal units): January through June 2009 (See Table 2-30 2007 SOM, Table 2-32)
Fuel Type 2009Coal 75%
Natural Gas 20%
Petroleum 3%
Landfill Gas 1%
Interface 1%
Misc 0%
Real-time, LMP contribution and load-weighted, unit markup index: January through Figure 2-3 June 2009 (See 2007 SOM, Figure 2-4)
Average, real-time marginal unit markup index (By price category): January through Table 2-31 June 2009 (See 2007 SOM, Table 2-34)
Price Category Average Markup Index Average Dollar Markup< $25 (0.11) ($3.65)
$25 to $50 (0.11) ($5.50)
$50 to $75 (0.03) ($2.87)
$75 to $100 0.03 $2.10
$100 to $125 0.07 $6.08
$125 to $150 0.07 $6.82
> $150 0.05 $9.94
Monthly markup components of load-weighted LMP: January through June 2009 Table 2-32 (See 2007 SOM, Table 2-35)
Markup Component (All Hours) Peak Markup Component
Off-Peak Markup Component
Jan ($1.53) ($0.48) ($2.52)
Feb ($1.97) ($1.65) ($2.31)
Mar ($4.24) ($4.73) ($3.73)
Apr ($4.78) ($3.78) ($5.96)
May ($3.23) ($2.75) ($3.68)
Jun ($3.33) ($1.99) ($4.98)
2009 (Jan - Jun) ($3.10) ($2.49) ($3.74)
© 2009 Monitoring Analytics, LLC www.monitoringanalytics.com 15
ENERgy MARkET, PART 1 31 2 486 7 AEC D FJH I K
5B
APP
ENDIX
GL
M N O
APP
ENDIX
SECTION
SECTION
APP
ENDIX
SECTION
SECTION
APP
ENDIX
SECTION
APP
ENDIX
SECTION
SECTION
APP
ENDIX
APP
ENDIX
APP
ENDIX
APP
ENDIX
APP
ENDIX
APP
ENDIX
APP
ENDIX
APP
ENDIX
APP
ENDIX
PREF
ACE
APP
ENDIX
VOLU
ME
1SECTION
2009 Quarterly State of the Market Report for PJM: January through June
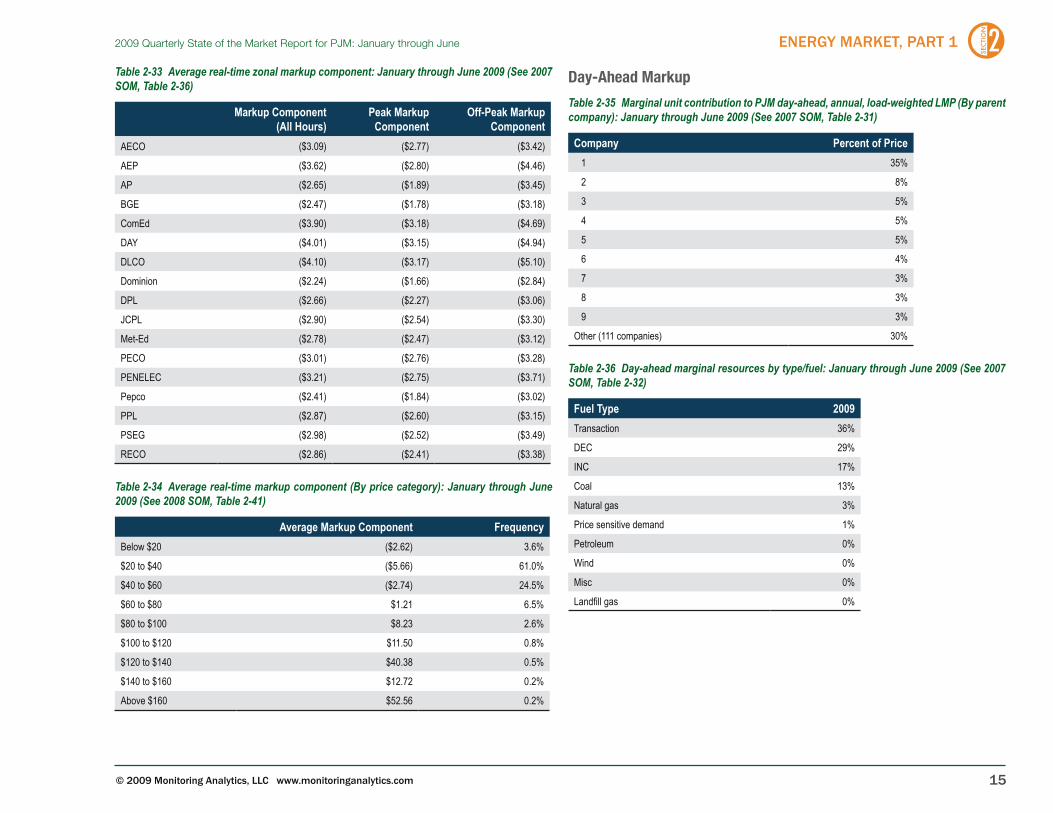
Average real-time zonal markup component: January through June 2009 (See 2007 Table 2-33 SOM, Table 2-36)
Markup Component (All Hours)
Peak Markup Component
Off-Peak Markup Component
AECO ($3.09) ($2.77) ($3.42)
AEP ($3.62) ($2.80) ($4.46)
AP ($2.65) ($1.89) ($3.45)
BGE ($2.47) ($1.78) ($3.18)
ComEd ($3.90) ($3.18) ($4.69)
DAY ($4.01) ($3.15) ($4.94)
DLCO ($4.10) ($3.17) ($5.10)
Dominion ($2.24) ($1.66) ($2.84)
DPL ($2.66) ($2.27) ($3.06)
JCPL ($2.90) ($2.54) ($3.30)
Met-Ed ($2.78) ($2.47) ($3.12)
PECO ($3.01) ($2.76) ($3.28)
PENELEC ($3.21) ($2.75) ($3.71)
Pepco ($2.41) ($1.84) ($3.02)
PPL ($2.87) ($2.60) ($3.15)
PSEG ($2.98) ($2.52) ($3.49)
RECO ($2.86) ($2.41) ($3.38)
Average real-time markup component (By price category): January through June Table 2-34 2009 (See 2008 SOM, Table 2-41)
Average Markup Component FrequencyBelow $20 ($2.62) 3.6%
$20 to $40 ($5.66) 61.0%
$40 to $60 ($2.74) 24.5%
$60 to $80 $1.21 6.5%
$80 to $100 $8.23 2.6%
$100 to $120 $11.50 0.8%
$120 to $140 $40.38 0.5%
$140 to $160 $12.72 0.2%
Above $160 $52.56 0.2%
Day-ahead Markup
Marginal unit contribution to PJM day-ahead, annual, load-weighted LMP (By parent Table 2-35 company): January through June 2009 (See 2007 SOM, Table 2-31)
Company Percent of Price 1 35%
2 8%
3 5%
4 5%
5 5%
6 4%
7 3%
8 3%
9 3%
Other (111 companies) 30%
Day-ahead marginal resources by type/fuel: January through June 2009 (See 2007 Table 2-36 SOM, Table 2-32)
Fuel Type 2009Transaction 36%
DEC 29%
INC 17%
Coal 13%
Natural gas 3%
Price sensitive demand 1%
Petroleum 0%
Wind 0%
Misc 0%
Landfill gas 0%

© 2009 Monitoring Analytics, LLC www.monitoringanalytics.com16
ENERgy MARkET, PART 131 2 486 7 AEC D FJH I K
5B
APP
ENDIX
GL
M N O
APP
ENDIX
SECTION
SECTION
APP
ENDIX
SECTION
SECTION
APP
ENDIX
SECTION
APP
ENDIX
SECTION
SECTION
APP
ENDIX
APP
ENDIX
APP
ENDIX
APP
ENDIX
APP
ENDIX
APP
ENDIX
APP
ENDIX
APP
ENDIX
APP
ENDIX
PREF
ACE
APP
ENDIX
VOLU
ME
1SECTION
2009 Quarterly State of the Market Report for PJM: January through June
Day-ahead, LMP contribution and load-weighted unit markup index: January Figure 2-4 through June 2009 (See 2007 SOM, Figure 2-4)
0.2
0.4
0.6
0.8
1
Markup index 2009
-0.2
0
0.2
Jan Feb Mar Apr May Jun Jul Aug Sep Oct Nov Dec
Average, day-ahead marginal unit markup index (By price category): January Table 2-37 through June 2009 (See 2007 SOM, Table 2-34)
Price CategoryAverage
Markup IndexAverage Dol-
lar Markup< $25 (0.05) ($2.25)
$25 to $50 0.05 $1.12
$50 to $75 0.08 $4.79
$75 to $100 0.09 $7.98
$100 to $125 0.28 $31.16
$125 to $150 (0.04) ($8.16)
> $150 0.00 $0.00
Monthly markup components of day-ahead, load-weighted LMP: January through Table 2-38 June 2009 (See 2007 SOM, Table 2-35)
Markup Component (All Hours)
Peak Markup Component
Off-Peak Markup Component
Jan $0.89 $1.62 $0.20
Feb $0.76 $2.18 ($0.75)
Mar $0.16 $0.91 ($0.65)
Apr ($0.97) ($0.33) ($1.72)
May ($0.62) $0.07 ($1.28)
Jun ($0.83) $0.39 ($2.37)
2009 (Jan - Jun) ($0.05) $0.84 ($1.01)
Day-ahead, average, zonal markup component: January through June 2009 (See Table 2-39 2007 SOM, Table 2-36)
Markup Component (All Hours)
Peak Markup Component
Off-Peak Markup Component
AECO $0.20 $0.98 ($0.66)
AEP ($0.50) $0.67 ($1.72)
AP $0.79 $1.68 ($0.13)
BGE $0.13 $1.12 ($0.93)
ComEd ($0.08) $0.75 ($0.94)
DAY ($0.60) $0.59 ($1.92)
DLCO ($0.56) $0.62 ($1.83)
Dominion ($0.45) $0.38 ($1.29)
DPL $0.24 $0.99 ($0.53)
JCPL $0.34 $1.13 ($0.58)
Met-Ed $0.30 $1.07 ($0.54)
PECO $0.21 $1.02 ($0.65)
PENELEC $0.41 $1.18 ($0.49)
Pepco ($0.19) $0.69 ($1.18)
PPL $0.26 $0.93 ($0.47)
PSEG $0.12 $0.82 ($0.68)
RECO $0.20 $0.89 ($0.64)

© 2009 Monitoring Analytics, LLC www.monitoringanalytics.com 17
ENERgy MARkET, PART 1 31 2 486 7 AEC D FJH I K
5B
APP
ENDIX
GL
M N O
APP
ENDIX
SECTION
SECTION
APP
ENDIX
SECTION
SECTION
APP
ENDIX
SECTION
APP
ENDIX
SECTION
SECTION
APP
ENDIX
APP
ENDIX
APP
ENDIX
APP
ENDIX
APP
ENDIX
APP
ENDIX
APP
ENDIX
APP
ENDIX
APP
ENDIX
PREF
ACE
APP
ENDIX
VOLU
ME
1SECTION
2009 Quarterly State of the Market Report for PJM: January through June
Average, day-ahead markup (By price category): January through June 2009 (See Table 2-40 2007 SOM, Table 2-37)
Average Markup Component FrequencyBelow $20 ($0.51) 4%
$20 to $40 ($1.41) 56%
$40 to $60 $1.16 30%
$60 to $80 $1.50 7%
$80 to $100 $2.75 2%
$100 to $120 $4.26 1%
$120 to $140 $1.43 0%
Above $160 $0.00 0%
frequently Mitigated Unit and associated Unit adders – component of Price
Frequently mitigated units and associated units (By month): January through June Table 2-41 2009 (See 2008 SOM, Table 2-42)
FMUs and AUs Total Eligiblefor Any AdderTier 1 Tier 2 Tier 3
January 26 56 55 137
February 46 46 36 128
March 31 48 54 133
April 33 41 63 137
May 32 43 61 136
June 40 42 62 144
Market Performance: Load and LMP
Load
Real-Time LoadPJM Real-Time Load Duration
PJM real-time load duration curves: Calendar years 2005 through June 2009 (See Figure 2-5 2008 SOM, Figure 2-4)

© 2009 Monitoring Analytics, LLC www.monitoringanalytics.com18
ENERgy MARkET, PART 131 2 486 7 AEC D FJH I K
5B
APP
ENDIX
GL
M N O
APP
ENDIX
SECTION
SECTION
APP
ENDIX
SECTION
SECTION
APP
ENDIX
SECTION
APP
ENDIX
SECTION
SECTION
APP
ENDIX
APP
ENDIX
APP
ENDIX
APP
ENDIX
APP
ENDIX
APP
ENDIX
APP
ENDIX
APP
ENDIX
APP
ENDIX
PREF
ACE
APP
ENDIX
VOLU
ME
1SECTION
2009 Quarterly State of the Market Report for PJM: January through June
PJM Real-Time, Annual Average Load
PJM real-time average load: Calendar years 2000 through June 2009 (See 2008 SOM, Table 2-44)Table 2-42
PJM Real-Time Load (MWh) Year-to-Year ChangeAverage Median Standard Deviation Average Median Standard Deviation
2000 30,113 30,170 5,529 NA NA NA
2001 30,297 30,219 5,873 0.6% 0.2% 6.2%
2002 35,731 34,746 8,013 17.9% 15.0% 36.5%
2003 37,398 37,031 6,832 4.7% 6.6% (14.7%)
2004 49,963 48,103 13,004 33.6% 29.9% 90.3%
2005 78,150 76,247 16,296 56.4% 58.5% 25.3%
2006 79,471 78,473 14,534 1.7% 2.9% (10.8%)
2007 81,681 80,914 14,618 2.8% 3.1% 0.6%
2008 79,515 78,481 13,758 (2.7%) (3.0%) (5.9%)
2009 75,993 75,847 12,898 (4.4%) (3.4%) (6.2%)
PJM Real-Time, Monthly Average Load
PJM real-time average load: Calendar years 2008 through June 2009 (See 2008 Figure 2-6 SOM, Figure 2-5)
Monthly minimum, average and maximum of PJM hourly THI: Cooling periods of Table 2-43 2008 and 2009 (See 2008 SOM, Table 2-45)
2008 2009 DifferenceMin Avg Max Min Avg Max Min Avg Max
Jun 54.94 70.16 81.30 52.53 67.86 77.88 (4.4%) (3.3%) (4.2%)
Jul 62.00 72.25 80.34
Aug 59.89 69.70 78.62

© 2009 Monitoring Analytics, LLC www.monitoringanalytics.com 19
ENERgy MARkET, PART 1 31 2 486 7 AEC D FJH I K
5B
APP
ENDIX
GL
M N O
APP
ENDIX
SECTION
SECTION
APP
ENDIX
SECTION
SECTION
APP
ENDIX
SECTION
APP
ENDIX
SECTION
SECTION
APP
ENDIX
APP
ENDIX
APP
ENDIX
APP
ENDIX
APP
ENDIX
APP
ENDIX
APP
ENDIX
APP
ENDIX
APP
ENDIX
PREF
ACE
APP
ENDIX
VOLU
ME
1SECTION
2009 Quarterly State of the Market Report for PJM: January through June
Day-Ahead LoadPJM Day-Ahead Load Duration
PJM day-ahead load duration curves: Calendar years 2005 through June 2009 (See Figure 2-7 2008 SOM, Figure 2-6)
PJM Day-Ahead, Annual Average Load
PJM day-ahead average load: Calendar years 2005 through June 2009 (See 2008 Table 2-44 SOM, Table 2-46)
PJM Day-Ahead Load (MWh) Year-to-Year Change
Average MedianStandard Deviation Average Median
Standard Deviation
2005 92,002 90,424 17,381 NA NA NA
2006 94,793 93,331 16,048 3.0% 3.2% (7.7%)
2007 100,912 99,799 16,190 6.5% 6.9% 0.9%
2008 95,522 94,886 15,439 (5.3%) (4.9%) (4.6%)
2009 88,688 89,066 14,650 (7.2%) (6.1%) (5.1%)
PJM Day-Ahead, Monthly Average Load
PJM day-ahead average load: Calendar years 2008 through June 2009 (See 2008 Figure 2-8 SOM, Figure 2-7)
Real-Time and Day-Ahead LoadCleared day-ahead and real-time load (MWh): January through June 2009 (See 2008 Table 2-45
SOM, Table 2-47)
Day AheadReal Time Average Difference
Cleared Fixed
Demand
Cleared Price
SensitiveCleared
DEC BidTotal Load
Total Load
Total Load
Total Load Minus DEC
BidAverage 71,903 1,742 15,043 88,688 75,993 12,695 (2,348)
Median 71,635 1,739 15,310 89,066 75,847 13,219 (2,091)
Standard deviation 12,110 435 2,554 14,650 12,898 1,752 (802)

© 2009 Monitoring Analytics, LLC www.monitoringanalytics.com20
ENERgy MARkET, PART 131 2 486 7 AEC D FJH I K
5B
APP
ENDIX
GL
M N O
APP
ENDIX
SECTION
SECTION
APP
ENDIX
SECTION
SECTION
APP
ENDIX
SECTION
APP
ENDIX
SECTION
SECTION
APP
ENDIX
APP
ENDIX
APP
ENDIX
APP
ENDIX
APP
ENDIX
APP
ENDIX
APP
ENDIX
APP
ENDIX
APP
ENDIX
PREF
ACE
APP
ENDIX
VOLU
ME
1SECTION
2009 Quarterly State of the Market Report for PJM: January through June
Day-ahead and real-time loads (Average hourly volumes): January through June Figure 2-9 2009 (See 2008 SOM, Figure 2-8)
Real-Time and Day-Ahead GenerationDay-ahead and real-time generation (MWh): January through June 2009 (See 2008 Table 2-46
SOM, Table 2-48)
Day Ahead Real Time Average Difference
Cleared Generation
Cleared INC
Offer
Cleared Generation
Plus INC Offer Generation
Cleared Generation
Cleared Generation
Plus INC OfferAverage 78,259 12,907 91,166 77,508 751 13,658
Median 78,909 12,781 91,595 77,626 1,283 13,970
Standard deviation 14,195 1,673 15,055 12,961 1,233 2,093
Day-ahead and real-time generation (Average hourly volumes): January through Figure 2-10 June 2009 (See 2008 SOM, Figure 2-9)
Locational Marginal Price (LMP)
Real-Time LMPReal-Time Average LMP
PJM Real-Time LMP Duration
Price duration curves for the PJM Real-Time Energy Market during hours above Figure 2-11 the 95th percentile: Calendar years 2005 through June 2009 (See 2008 SOM, Figure 2-10)

© 2009 Monitoring Analytics, LLC www.monitoringanalytics.com 21
ENERgy MARkET, PART 1 31 2 486 7 AEC D FJH I K
5B
APP
ENDIX
GL
M N O
APP
ENDIX
SECTION
SECTION
APP
ENDIX
SECTION
SECTION
APP
ENDIX
SECTION
APP
ENDIX
SECTION
SECTION
APP
ENDIX
APP
ENDIX
APP
ENDIX
APP
ENDIX
APP
ENDIX
APP
ENDIX
APP
ENDIX
APP
ENDIX
APP
ENDIX
PREF
ACE
APP
ENDIX
VOLU
ME
1SECTION
2009 Quarterly State of the Market Report for PJM: January through June
PJM Real-Time, Annual Average LMP
PJM real-time, simple average LMP (Dollars per MWh): Calendar years 2000 through Table 2-47 June 2009 (See 2008 SOM, Table 2-49)
Real-Time LMP Year-to-Year Change
Average MedianStandard Deviation Average Median
Standard Deviation
2000 $28.14 $19.11 $25.69 NA NA NA
2001 $32.38 $22.98 $45.03 15.1% 20.3% 75.3%
2002 $28.30 $21.08 $22.41 (12.6%) (8.3%) (50.2%)
2003 $38.28 $30.79 $24.71 35.2% 46.1% 10.3%
2004 $42.40 $38.30 $21.12 10.8% 24.4% (14.5%)
2005 $58.08 $47.18 $35.91 37.0% 23.2% 70.0%
2006 $49.27 $41.45 $32.71 (15.2%) (12.1%) (8.9%)
2007 $57.58 $49.92 $34.60 16.9% 20.4% 5.8%
2008 $66.40 $55.53 $38.62 15.3% 11.2% 11.6%
2009 $40.12 $35.42 $19.30 (39.6%) (36.2%) (50.0%)
Zonal Real-Time, Annual Average LMP
Zonal real-time, simple average LMP (Dollars per MWh): January through June 2008 Table 2-48 and 2009 (See 2008 SOM, Table 2-50)
2008 (Jan - Jun) 2009 (Jan - Jun) Difference Difference as Percent of 2008AECO $84.92 $44.59 ($40.33) (47.5%)
AEP $56.20 $36.37 ($19.83) (35.3%)
AP $69.61 $41.77 ($27.84) (40.0%)
BGE $84.14 $45.22 ($38.92) (46.3%)
ComEd $52.81 $30.28 ($22.53) (42.7%)
DAY $56.66 $35.90 ($20.76) (36.6%)
DLCO $52.57 $34.49 ($18.08) (34.4%)
Dominion $78.58 $43.53 ($35.05) (44.6%)
DPL $81.59 $45.20 ($36.39) (44.6%)
JCPL $86.58 $44.92 ($41.66) (48.1%)
Met-Ed $79.58 $43.73 ($35.85) (45.0%)
PECO $78.86 $43.63 ($35.23) (44.7%)
PENELEC $67.94 $40.06 ($27.88) (41.0%)
Pepco $84.33 $44.77 ($39.56) (46.9%)
PPL $78.47 $43.14 ($35.34) (45.0%)
PSEG $85.48 $45.44 ($40.04) (46.8%)
RECO $84.33 $44.22 ($40.11) (47.6%)
Real-Time, Annual Average LMP by Jurisdiction
Jurisdiction real-time, simple average LMP (Dollars per MWh): January through Table 2-49 June 2008 and 2009 (See 2008 SOM, Table 2-51)
2008 (Jan - Jun)
2009 (Jan - Jun) Difference Difference as Percent of 2008
Delaware $80.69 $44.87 ($35.83) (44.4%)
Illinois $52.81 $30.28 ($22.53) (42.7%)
Indiana $56.03 $35.71 ($20.33) (36.3%)
Kentucky $56.50 $36.25 ($20.25) (35.8%)
Maryland $83.80 $45.20 ($38.61) (46.1%)
Michigan $56.95 $37.07 ($19.88) (34.9%)
New Jersey $85.75 $45.16 ($40.59) (47.3%)
North Carolina $73.52 $42.45 ($31.08) (42.3%)
Ohio $55.67 $35.69 ($19.98) (35.9%)
Pennsylvania $73.14 $41.88 ($31.27) (42.7%)
Tennessee $56.75 $36.34 ($20.41) (36.0%)
Virginia $76.00 $42.77 ($33.23) (43.7%)
West Virginia $57.92 $37.62 ($20.30) (35.0%)
District of Columbia $84.32 $44.92 ($39.40) (46.7%)
Hub Real-Time, Annual Average LMP
Hub real-time, simple average LMP (Dollars per MWh): January through June 2008 Table 2-50 and 2009 (See 2008 SOM, Table 2-52)
2008 (Jan - Jun)
2009 (Jan - Jun) Difference Difference as Percent of 2008
AEP Gen Hub $53.04 $34.21 ($18.83) (35.5%)
AEP-DAY Hub $55.92 $35.87 ($20.04) (35.8%)
Chicago Gen Hub $52.10 $29.44 ($22.66) (43.5%)
Chicago Hub $52.86 $30.49 ($22.37) (42.3%)
Dominion Hub $76.02 $42.82 ($33.19) (43.7%)
Eastern Hub $81.31 $45.06 ($36.24) (44.6%)
N Illinois Hub $52.37 $30.07 ($22.30) (42.6%)
New Jersey Hub $85.45 $45.11 ($40.34) (47.2%)
Ohio Hub $56.03 $35.84 ($20.19) (36.0%)
West Interface Hub $61.55 $37.20 ($24.35) (39.6%)
Western Hub $72.09 $41.40 ($30.69) (42.6%)

© 2009 Monitoring Analytics, LLC www.monitoringanalytics.com22
ENERgy MARkET, PART 131 2 486 7 AEC D FJH I K
5B
APP
ENDIX
GL
M N O
APP
ENDIX
SECTION
SECTION
APP
ENDIX
SECTION
SECTION
APP
ENDIX
SECTION
APP
ENDIX
SECTION
SECTION
APP
ENDIX
APP
ENDIX
APP
ENDIX
APP
ENDIX
APP
ENDIX
APP
ENDIX
APP
ENDIX
APP
ENDIX
APP
ENDIX
PREF
ACE
APP
ENDIX
VOLU
ME
1SECTION
2009 Quarterly State of the Market Report for PJM: January through June
Real-Time, Load-Weighted, Average LMP
PJM Real-Time, Annual, Load-Weighted, Average LMP
PJM real-time, annual, load-weighted, average LMP (Dollars per MWh): Calendar Table 2-51 years 2000 through June 2009 (See 2008 SOM, Table 2-53)
Real-Time, Load-Weighted, Average LMP Year-to-Year Change
Average MedianStandard Deviation Average Median
Standard Deviation
2000 $30.72 $20.51 $28.38 NA NA NA
2001 $36.65 $25.08 $57.26 19.3% 22.3% 101.8%
2002 $31.60 $23.40 $26.75 (13.8%) (6.7%) (53.3%)
2003 $41.23 $34.96 $25.40 30.5% 49.4% (5.0%)
2004 $44.34 $40.16 $21.25 7.5% 14.9% (16.3%)
2005 $63.46 $52.93 $38.10 43.1% 31.8% 79.3%
2006 $53.35 $44.40 $37.81 (15.9%) (16.1%) (0.7%)
2007 $61.66 $54.66 $36.94 15.6% 23.1% (2.3%)
2008 $71.13 $59.54 $40.97 15.4% 8.9% 10.9%
2009 $42.48 $36.95 $20.61 (40.3%) (37.9%) (49.7%)
PJM Real-Time, Monthly, Load-Weighted, Average LMP
PJM real-time, monthly, load-weighted, average LMP: Calendar years 2005 through Figure 2-12 June 2009 (See 2008 SOM, Figure 2-11)
Zonal Real-Time, Annual, Load-Weighted, Average LMP
Zonal real-time, annual, load-weighted, average LMP (Dollars per MWh): January Table 2-52 through June 2008 and 2009 (See 2008 SOM, Table 2-54)
2008 (Jan - Jun)
2009 (Jan - Jun) Difference Difference as Percent of 2008
AECO $93.41 $46.77 ($46.64) (49.9%)
AEP $59.26 $38.30 ($20.96) (35.4%)
AP $73.85 $44.59 ($29.26) (39.6%)
BGE $91.31 $48.39 ($42.92) (47.0%)
ComEd $56.35 $32.25 ($24.10) (42.8%)
DAY $60.47 $37.77 ($22.70) (37.5%)
DLCO $55.68 $35.62 ($20.06) (36.0%)
Dominion $85.94 $46.89 ($39.04) (45.4%)
DPL $87.98 $48.77 ($39.21) (44.6%)
JCPL $94.12 $47.50 ($46.62) (49.5%)
Met-Ed $84.70 $46.64 ($38.06) (44.9%)
PECO $84.40 $46.05 ($38.35) (45.4%)
PENELEC $71.14 $42.08 ($29.06) (40.8%)
Pepco $92.13 $47.69 ($44.43) (48.2%)
PPL $83.20 $46.39 ($36.81) (44.2%)
PSEG $91.71 $47.42 ($44.29) (48.3%)
RECO $92.02 $46.29 ($45.73) (49.7%)

© 2009 Monitoring Analytics, LLC www.monitoringanalytics.com 23
ENERgy MARkET, PART 1 31 2 486 7 AEC D FJH I K
5B
APP
ENDIX
GL
M N O
APP
ENDIX
SECTION
SECTION
APP
ENDIX
SECTION
SECTION
APP
ENDIX
SECTION
APP
ENDIX
SECTION
SECTION
APP
ENDIX
APP
ENDIX
APP
ENDIX
APP
ENDIX
APP
ENDIX
APP
ENDIX
APP
ENDIX
APP
ENDIX
APP
ENDIX
PREF
ACE
APP
ENDIX
VOLU
ME
1SECTION
2009 Quarterly State of the Market Report for PJM: January through June
Real-Time, Annual, Load-Weighted, Average LMP by Jurisdiction
Jurisdiction real-time, annual, load-weighted, average LMP (Dollars per MWh): Table 2-53 January through June 2008 and 2009 (See 2008 SOM, Table 2-55)
2008 (Jan - Jun)
2009 (Jan - Jun) Difference Difference as Percent of 2008
Delaware $86.35 $47.92 ($38.43) (44.5%)
Illinois $56.35 $32.25 ($24.10) (42.8%)
Indiana $58.65 $37.00 ($21.65) (36.9%)
Kentucky $60.42 $39.03 ($21.39) (35.4%)
Maryland $91.33 $48.71 ($42.62) (46.7%)
Michigan $60.58 $38.50 ($22.08) (36.4%)
New Jersey $92.65 $47.34 ($45.31) (48.9%)
North Carolina $82.09 $45.76 ($36.33) (44.3%)
Ohio $58.74 $37.35 ($21.39) (36.4%)
Pennsylvania $77.42 $44.33 ($33.10) (42.7%)
Tennessee $58.81 $38.96 ($19.85) (33.7%)
Virginia $82.83 $46.18 ($36.65) (44.2%)
West Virginia $60.97 $40.12 ($20.85) (34.2%)
District of Columbia $90.78 $46.88 ($43.90) (48.4%)
Real-Time, Fuel-Cost-Adjusted, Load-Weighted LMP
Fuel Cost
Spot average fuel price comparison: Calendar years 2008 through June 2009 (See Figure 2-13 2008 SOM, Figure 2-12)
Spot average emission price comparison: Calendar years 2008 through June 2009 Figure 2-14 (See 2008 SOM, Figure 2-13)
PJM real-time, fuel-cost-adjusted, load-weighted LMP (Dollars per MWh): January Table 2-54 through June 2009, year-over-year method (See 2008 SOM, Table 2-56)
2008 (Jan - Jun) Load-Weighted LMP
2009 (Jan - Jun) Fuel-Cost-Adjusted, Load-Weighted LMP Change
Average $74.77 $70.00 (6.4%)
© 2009 Monitoring Analytics, LLC www.monitoringanalytics.com24
ENERgy MARkET, PART 131 2 486 7 AEC D FJH I K
5B
APP
ENDIX
GL
M N O
APP
ENDIX
SECTION
SECTION
APP
ENDIX
SECTION
SECTION
APP
ENDIX
SECTION
APP
ENDIX
SECTION
SECTION
APP
ENDIX
APP
ENDIX
APP
ENDIX
APP
ENDIX
APP
ENDIX
APP
ENDIX
APP
ENDIX
APP
ENDIX
APP
ENDIX
PREF
ACE
APP
ENDIX
VOLU
ME
1SECTION
2009 Quarterly State of the Market Report for PJM: January through June
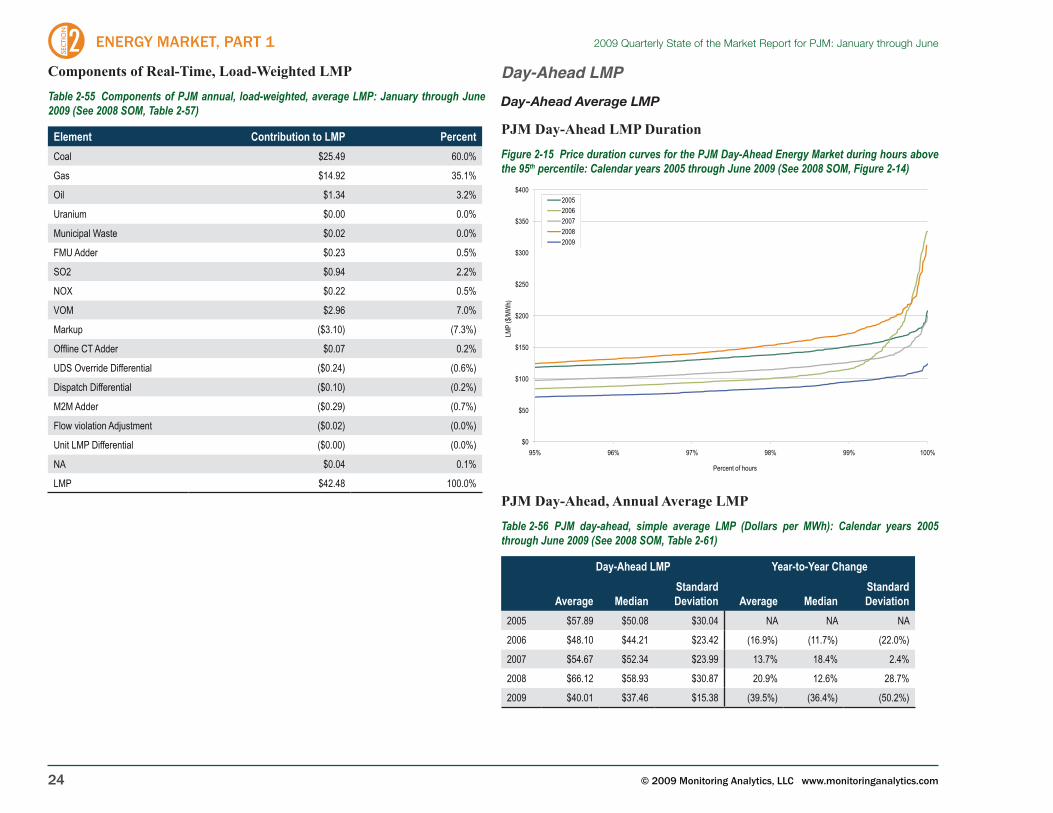
Components of Real-Time, Load-Weighted LMP
Components of PJM annual, load-weighted, average LMP: January through June Table 2-55 2009 (See 2008 SOM, Table 2-57)
Element Contribution to LMP PercentCoal $25.49 60.0%
Gas $14.92 35.1%
Oil $1.34 3.2%
Uranium $0.00 0.0%
Municipal Waste $0.02 0.0%
FMU Adder $0.23 0.5%
SO2 $0.94 2.2%
NOX $0.22 0.5%
VOM $2.96 7.0%
Markup ($3.10) (7.3%)
Offline CT Adder $0.07 0.2%
UDS Override Differential ($0.24) (0.6%)
Dispatch Differential ($0.10) (0.2%)
M2M Adder ($0.29) (0.7%)
Flow violation Adjustment ($0.02) (0.0%)
Unit LMP Differential ($0.00) (0.0%)
NA $0.04 0.1%
LMP $42.48 100.0%
Day-Ahead LMPDay-Ahead Average LMP
PJM Day-Ahead LMP Duration
Price duration curves for the PJM Day-Ahead Energy Market during hours above Figure 2-15 the 95th percentile: Calendar years 2005 through June 2009 (See 2008 SOM, Figure 2-14)
PJM Day-Ahead, Annual Average LMP
PJM day-ahead, simple average LMP (Dollars per MWh): Calendar years 2005 Table 2-56 through June 2009 (See 2008 SOM, Table 2-61)
Day-Ahead LMP Year-to-Year Change
Average MedianStandard Deviation Average Median
Standard Deviation
2005 $57.89 $50.08 $30.04 NA NA NA
2006 $48.10 $44.21 $23.42 (16.9%) (11.7%) (22.0%)
2007 $54.67 $52.34 $23.99 13.7% 18.4% 2.4%
2008 $66.12 $58.93 $30.87 20.9% 12.6% 28.7%
2009 $40.01 $37.46 $15.38 (39.5%) (36.4%) (50.2%)
© 2009 Monitoring Analytics, LLC www.monitoringanalytics.com 25
ENERgy MARkET, PART 1 31 2 486 7 AEC D FJH I K
5B
APP
ENDIX
GL
M N O
APP
ENDIX
SECTION
SECTION
APP
ENDIX
SECTION
SECTION
APP
ENDIX
SECTION
APP
ENDIX
SECTION
SECTION
APP
ENDIX
APP
ENDIX
APP
ENDIX
APP
ENDIX
APP
ENDIX
APP
ENDIX
APP
ENDIX
APP
ENDIX
APP
ENDIX
PREF
ACE
APP
ENDIX
VOLU
ME
1SECTION
2009 Quarterly State of the Market Report for PJM: January through June
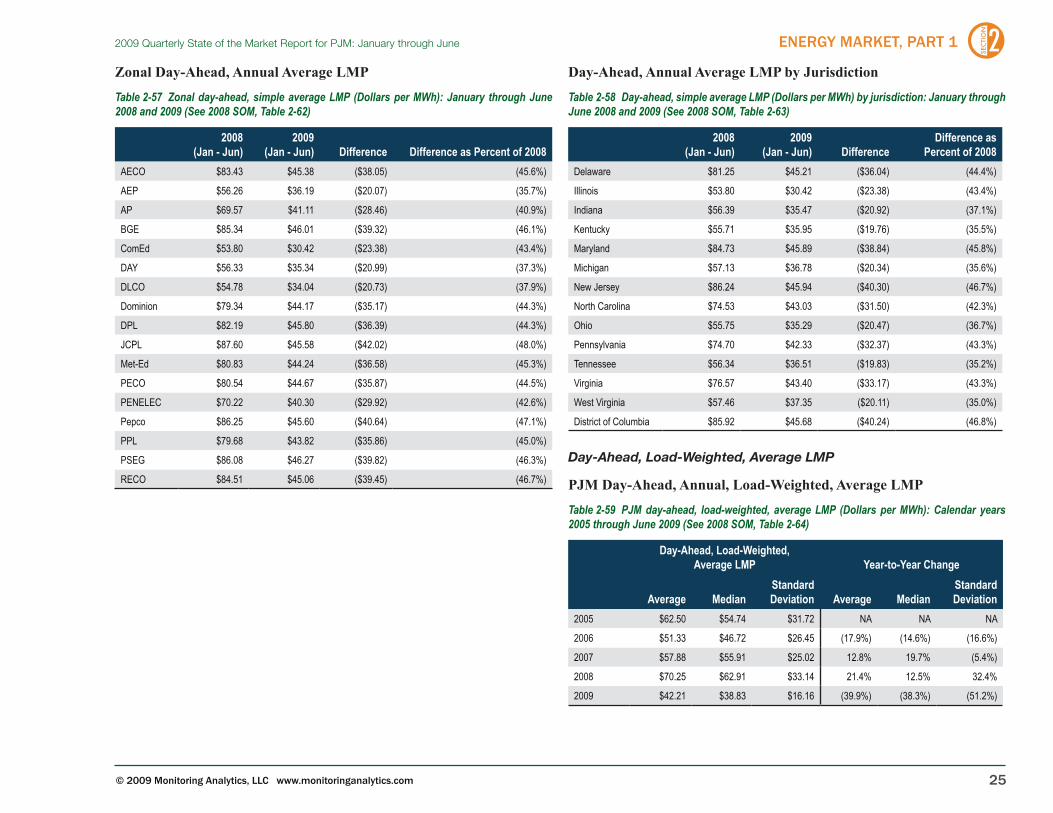
Zonal Day-Ahead, Annual Average LMP
Zonal day-ahead, simple average LMP (Dollars per MWh): January through June Table 2-57 2008 and 2009 (See 2008 SOM, Table 2-62)
2008 (Jan - Jun)
2009 (Jan - Jun) Difference Difference as Percent of 2008
AECO $83.43 $45.38 ($38.05) (45.6%)
AEP $56.26 $36.19 ($20.07) (35.7%)
AP $69.57 $41.11 ($28.46) (40.9%)
BGE $85.34 $46.01 ($39.32) (46.1%)
ComEd $53.80 $30.42 ($23.38) (43.4%)
DAY $56.33 $35.34 ($20.99) (37.3%)
DLCO $54.78 $34.04 ($20.73) (37.9%)
Dominion $79.34 $44.17 ($35.17) (44.3%)
DPL $82.19 $45.80 ($36.39) (44.3%)
JCPL $87.60 $45.58 ($42.02) (48.0%)
Met-Ed $80.83 $44.24 ($36.58) (45.3%)
PECO $80.54 $44.67 ($35.87) (44.5%)
PENELEC $70.22 $40.30 ($29.92) (42.6%)
Pepco $86.25 $45.60 ($40.64) (47.1%)
PPL $79.68 $43.82 ($35.86) (45.0%)
PSEG $86.08 $46.27 ($39.82) (46.3%)
RECO $84.51 $45.06 ($39.45) (46.7%)
Day-Ahead, Annual Average LMP by Jurisdiction
Day-ahead, simple average LMP (Dollars per MWh) by jurisdiction: January through Table 2-58 June 2008 and 2009 (See 2008 SOM, Table 2-63)
2008 (Jan - Jun)
2009 (Jan - Jun) Difference
Difference as Percent of 2008
Delaware $81.25 $45.21 ($36.04) (44.4%)
Illinois $53.80 $30.42 ($23.38) (43.4%)
Indiana $56.39 $35.47 ($20.92) (37.1%)
Kentucky $55.71 $35.95 ($19.76) (35.5%)
Maryland $84.73 $45.89 ($38.84) (45.8%)
Michigan $57.13 $36.78 ($20.34) (35.6%)
New Jersey $86.24 $45.94 ($40.30) (46.7%)
North Carolina $74.53 $43.03 ($31.50) (42.3%)
Ohio $55.75 $35.29 ($20.47) (36.7%)
Pennsylvania $74.70 $42.33 ($32.37) (43.3%)
Tennessee $56.34 $36.51 ($19.83) (35.2%)
Virginia $76.57 $43.40 ($33.17) (43.3%)
West Virginia $57.46 $37.35 ($20.11) (35.0%)
District of Columbia $85.92 $45.68 ($40.24) (46.8%)
Day-Ahead, Load-Weighted, Average LMP
PJM Day-Ahead, Annual, Load-Weighted, Average LMP
PJM day-ahead, load-weighted, average LMP (Dollars per MWh): Calendar years Table 2-59 2005 through June 2009 (See 2008 SOM, Table 2-64)
Day-Ahead, Load-Weighted, Average LMP Year-to-Year Change
Average MedianStandard Deviation Average Median
Standard Deviation
2005 $62.50 $54.74 $31.72 NA NA NA
2006 $51.33 $46.72 $26.45 (17.9%) (14.6%) (16.6%)
2007 $57.88 $55.91 $25.02 12.8% 19.7% (5.4%)
2008 $70.25 $62.91 $33.14 21.4% 12.5% 32.4%
2009 $42.21 $38.83 $16.16 (39.9%) (38.3%) (51.2%)

© 2009 Monitoring Analytics, LLC www.monitoringanalytics.com26
ENERgy MARkET, PART 131 2 486 7 AEC D FJH I K
5B
APP
ENDIX
GL
M N O
APP
ENDIX
SECTION
SECTION
APP
ENDIX
SECTION
SECTION
APP
ENDIX
SECTION
APP
ENDIX
SECTION
SECTION
APP
ENDIX
APP
ENDIX
APP
ENDIX
APP
ENDIX
APP
ENDIX
APP
ENDIX
APP
ENDIX
APP
ENDIX
APP
ENDIX
PREF
ACE
APP
ENDIX
VOLU
ME
1SECTION
2009 Quarterly State of the Market Report for PJM: January through June
PJM Day-Ahead, Monthly, Load-Weighted, Average LMP
Day-ahead, monthly, load-weighted, average LMP: Calendar years 2005 through Figure 2-16 June 2009 (See 2008 SOM, Figure 2-15)
Zonal Day-Ahead, Annual, Load-Weighted LMP
Zonal day-ahead, load-weighted, average LMP (Dollars per MWh): January through Table 2-60 June 2008 and 2009 (See 2008 SOM, Table 2-65)
2008 (Jan - Jun) 2009 (Jan - Jun) Difference Difference as Percent of 2008
AECO $90.78 $48.09 ($42.69) (47.0%)
AEP $58.75 $37.95 ($20.79) (35.4%)
AP $71.72 $43.83 ($27.89) (38.9%)
BGE $91.96 $49.12 ($42.84) (46.6%)
ComEd $56.09 $31.72 ($24.37) (43.4%)
DAY $59.19 $36.99 ($22.20) (37.5%)
DLCO $57.72 $35.10 ($22.63) (39.2%)
Dominion $85.99 $47.39 ($38.60) (44.9%)
DPL $88.22 $48.86 ($39.36) (44.6%)
JCPL $94.29 $47.94 ($46.35) (49.2%)
Met-Ed $84.63 $47.29 ($37.34) (44.1%)
PECO $85.89 $47.08 ($38.81) (45.2%)
PENELEC $72.09 $42.35 ($29.75) (41.3%)
Pepco $90.58 $48.20 ($42.38) (46.8%)
PPL $83.57 $46.72 ($36.85) (44.1%)
PSEG $91.65 $48.45 ($43.20) (47.1%)
RECO $91.10 $47.59 ($43.52) (47.8%)
Day-Ahead, Annual, Load-Weighted, Average LMP by Jurisdiction
Jurisdiction day-ahead, load weighted LMP (Dollars per MWh): January through Table 2-61 June 2008 and 2009 (See 2008 SOM, Table 2-66)
2008 (Jan - Jun)
2009 (Jan - Jun) Difference
Difference as Percent of 2008
Delaware $87.13 $48.05 ($39.08) (44.9%)
Illinois $56.09 $31.72 ($24.37) (43.4%)
Indiana $58.86 $36.72 ($22.14) (37.6%)
Kentucky $58.04 $38.34 ($19.71) (34.0%)
Maryland $90.14 $49.12 ($41.01) (45.5%)
Michigan $59.41 $37.93 ($21.48) (36.2%)
New Jersey $92.31 $48.22 ($44.09) (47.8%)
North Carolina $81.31 $46.44 ($34.86) (42.9%)
Ohio $58.27 $36.89 ($21.38) (36.7%)
Pennsylvania $77.92 $44.69 ($33.23) (42.6%)
Tennessee $58.49 $38.72 ($19.76) (33.8%)
Virginia $82.34 $46.52 ($35.82) (43.5%)
West Virginia $59.94 $39.60 ($20.34) (33.9%)
District of Columbia $89.84 $47.70 ($42.14) (46.9%)
Components of Day-Ahead, Load-Weighted LMP
Components of PJM day-ahead, annual, load-weighted, average LMP: January Table 2-62 through June 2009 (See 2008 SOM, Table 2-57)
Element Contribution to LMP PercentDEC $13.69 32.4%
INC $11.76 27.9%
Coal $9.54 22.6%
Gas $3.13 7.4%
Price sensitive demand $1.62 3.8%
Transaction $1.06 2.5%
VOM $0.89 2.1%
SO2 $0.30 0.7%
Oil $0.27 0.6%
NOx $0.07 0.2%
Misc $0.00 0.0%
FMU adder $0.00 0.0%
Constrained off ($0.00) (0.0%)
Markup ($0.05) (0.1%)
NA ($0.07) (0.2%)
LMP $42.21 100.0%
© 2009 Monitoring Analytics, LLC www.monitoringanalytics.com 27
ENERgy MARkET, PART 1 31 2 486 7 AEC D FJH I K
5B
APP
ENDIX
GL
M N O
APP
ENDIX
SECTION
SECTION
APP
ENDIX
SECTION
SECTION
APP
ENDIX
SECTION
APP
ENDIX
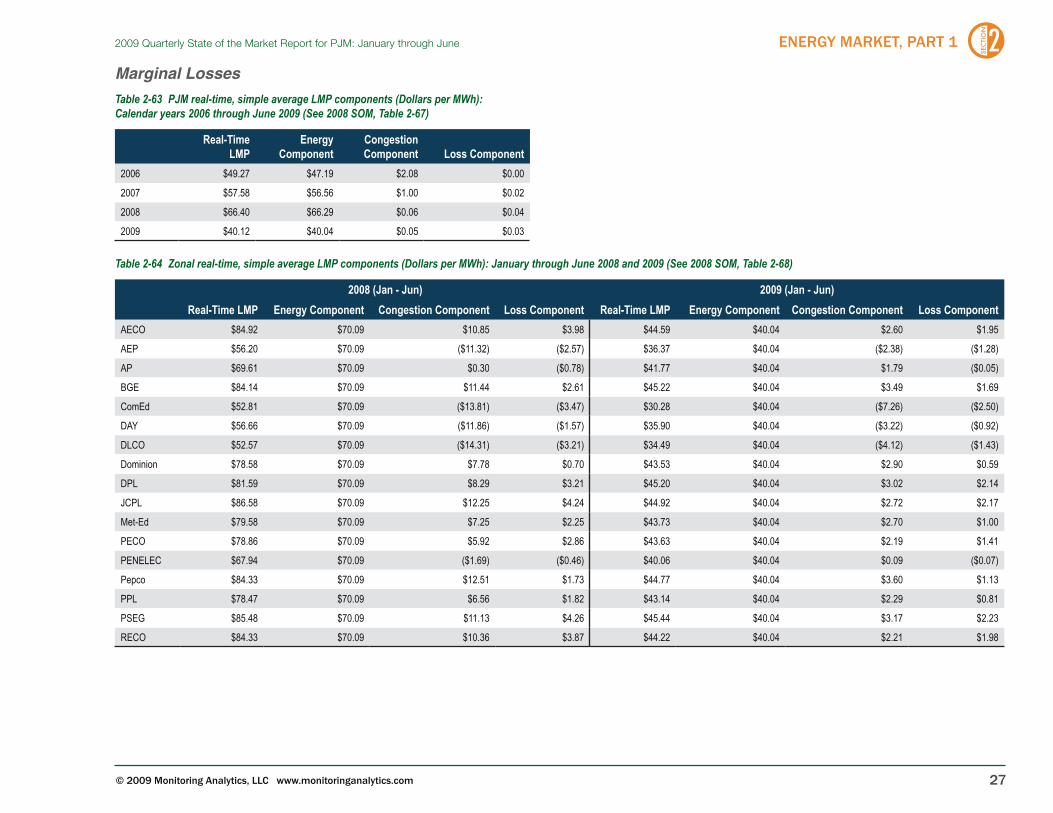
SECTION
SECTION
APP
ENDIX
APP
ENDIX
APP
ENDIX
APP
ENDIX
APP
ENDIX
APP
ENDIX
APP
ENDIX
APP
ENDIX
APP
ENDIX
PREF
ACE
APP
ENDIX
VOLU
ME
1SECTION
2009 Quarterly State of the Market Report for PJM: January through June
Marginal LossesPJM real-time, simple average LMP components (Dollars per MWh): Table 2-63
Calendar years 2006 through June 2009 (See 2008 SOM, Table 2-67)
Real-Time LMP
Energy Component
Congestion Component Loss Component
2006 $49.27 $47.19 $2.08 $0.00
2007 $57.58 $56.56 $1.00 $0.02
2008 $66.40 $66.29 $0.06 $0.04
2009 $40.12 $40.04 $0.05 $0.03
Zonal real-time, simple average LMP components (Dollars per MWh): January through June 2008 and 2009 (See 2008 SOM, Table 2-68)Table 2-64
2008 (Jan - Jun) 2009 (Jan - Jun)Real-Time LMP Energy Component Congestion Component Loss Component Real-Time LMP Energy Component Congestion Component Loss Component
AECO $84.92 $70.09 $10.85 $3.98 $44.59 $40.04 $2.60 $1.95
AEP $56.20 $70.09 ($11.32) ($2.57) $36.37 $40.04 ($2.38) ($1.28)
AP $69.61 $70.09 $0.30 ($0.78) $41.77 $40.04 $1.79 ($0.05)
BGE $84.14 $70.09 $11.44 $2.61 $45.22 $40.04 $3.49 $1.69
ComEd $52.81 $70.09 ($13.81) ($3.47) $30.28 $40.04 ($7.26) ($2.50)
DAY $56.66 $70.09 ($11.86) ($1.57) $35.90 $40.04 ($3.22) ($0.92)
DLCO $52.57 $70.09 ($14.31) ($3.21) $34.49 $40.04 ($4.12) ($1.43)
Dominion $78.58 $70.09 $7.78 $0.70 $43.53 $40.04 $2.90 $0.59
DPL $81.59 $70.09 $8.29 $3.21 $45.20 $40.04 $3.02 $2.14
JCPL $86.58 $70.09 $12.25 $4.24 $44.92 $40.04 $2.72 $2.17
Met-Ed $79.58 $70.09 $7.25 $2.25 $43.73 $40.04 $2.70 $1.00
PECO $78.86 $70.09 $5.92 $2.86 $43.63 $40.04 $2.19 $1.41
PENELEC $67.94 $70.09 ($1.69) ($0.46) $40.06 $40.04 $0.09 ($0.07)
Pepco $84.33 $70.09 $12.51 $1.73 $44.77 $40.04 $3.60 $1.13
PPL $78.47 $70.09 $6.56 $1.82 $43.14 $40.04 $2.29 $0.81
PSEG $85.48 $70.09 $11.13 $4.26 $45.44 $40.04 $3.17 $2.23
RECO $84.33 $70.09 $10.36 $3.87 $44.22 $40.04 $2.21 $1.98

© 2009 Monitoring Analytics, LLC www.monitoringanalytics.com28
ENERgy MARkET, PART 131 2 486 7 AEC D FJH I K
5B
APP
ENDIX
GL
M N O
APP
ENDIX
SECTION
SECTION
APP
ENDIX
SECTION
SECTION
APP
ENDIX
SECTION
APP
ENDIX
SECTION
SECTION
APP
ENDIX
APP
ENDIX
APP
ENDIX
APP
ENDIX
APP
ENDIX
APP
ENDIX
APP
ENDIX
APP
ENDIX
APP
ENDIX
PREF
ACE
APP
ENDIX
VOLU
ME
1SECTION
2009 Quarterly State of the Market Report for PJM: January through June
Hub real-time, simple average LMP components (Dollars per MWh): January Table 2-65 through June 2009 (See 2008 SOM, Table 2-69)
Real-Time LMPEnergy
ComponentCongestion Component Loss Component
AEP Gen Hub $34.21 $40.04 ($3.29) ($2.54)
AEP-DAY Hub $35.87 $40.04 ($2.70) ($1.46)
Chicago Gen Hub $29.44 $40.04 ($7.56) ($3.03)
Chicago Hub $30.49 $40.04 ($7.07) ($2.48)
Dominion Hub $42.82 $40.04 $2.58 $0.20
Eastern Hub $45.06 $40.04 $2.71 $2.32
N Illinois Hub $30.07 $40.04 ($7.27) ($2.70)
New Jersey Hub $45.11 $40.04 $2.94 $2.14
Ohio Hub $35.84 $40.04 ($2.76) ($1.43)
West Interface Hub $37.20 $40.04 ($1.54) ($1.30)
Western Hub $41.40 $40.04 $1.50 ($0.14)
Zonal and PJM Real-Time, Annual, Load-Weighted, Average LMP Components
Zonal and PJM real-time, annual, load-weighted, average LMP components (Dollars Table 2-66 per MWh): January through June 2009 (See 2008 SOM, Table 2-70)
Real-Time LMP Energy Component Congestion Component Loss ComponentAECO $46.77 $41.88 $2.83 $2.06
AEP $38.30 $42.58 ($2.90) ($1.37)
AP $44.59 $42.73 $1.94 ($0.08)
BGE $48.39 $42.56 $4.01 $1.83
ComEd $32.25 $41.84 ($7.04) ($2.55)
DAY $37.77 $42.42 ($3.74) ($0.92)
DLCO $35.62 $41.82 ($4.68) ($1.52)
Dominion $46.89 $42.83 $3.43 $0.64
DPL $48.77 $42.88 $3.54 $2.35
JCPL $47.50 $42.25 $2.94 $2.31
Met-Ed $46.64 $42.51 $3.04 $1.09
PECO $46.05 $42.15 $2.40 $1.50
PENELEC $42.08 $42.23 ($0.06) ($0.09)
Pepco $47.69 $42.40 $4.10 $1.20
PPL $46.39 $42.78 $2.69 $0.92
PSEG $47.42 $41.74 $3.35 $2.33
RECO $46.29 $41.89 $2.34 $2.07
PJM $42.48 $42.40 $0.05 $0.03
PJM day-ahead, simple average LMP components (Dollars per MWh): 2006 through Table 2-67 June 2009 (See 2008 SOM, Table 2-71)
Day-Ahead LMP
Energy Component
Congestion Component
Loss Component
2006 $48.10 $46.45 $1.65 $0.00
2007 $54.67 $54.60 $0.25 ($0.18)
2008 $66.12 $66.43 ($0.10) ($0.21)
2009 $40.01 $40.27 ($0.14) ($0.12)
Zonal day-ahead, simple average LMP components (Dollars per MWh): January Table 2-68 through June 2008 and 2009. (See 2008 SOM, Table 2-72)
2008 (Jan - Jun) 2009 (Jan - Jun)
Day-Ahead LMP
Energy Component
Congestion Component
Loss Component
Day-Ahead LMP
Energy Component
Congestion Component
Loss Component
AECO $83.43 $70.51 $8.01 $4.90 $45.38 $40.27 $2.61 $2.49
AEP $56.26 $70.51 ($10.69) ($3.56) $36.19 $40.27 ($2.41) ($1.67)
AP $69.57 $70.51 ($0.02) ($0.92) $41.11 $40.27 $0.75 $0.08
BGE $85.34 $70.51 $11.68 $3.15 $46.01 $40.27 $3.72 $2.02
ComEd $53.80 $70.51 ($12.30) ($4.41) $30.42 $40.27 ($6.40) ($3.45)
DAY $56.33 $70.51 ($11.10) ($3.09) $35.34 $40.27 ($3.37) ($1.57)
DLCO $54.78 $70.51 ($11.83) ($3.91) $34.04 $40.27 ($4.56) ($1.68)
Dominion $79.34 $70.51 $7.96 $0.87 $44.17 $40.27 $2.93 $0.96
DPL $82.19 $70.51 $7.83 $3.85 $45.80 $40.27 $2.92 $2.61
JCPL $87.60 $70.51 $11.02 $6.07 $45.58 $40.27 $2.51 $2.80
Met-Ed $80.83 $70.51 $7.46 $2.86 $44.24 $40.27 $2.69 $1.28
PECO $80.54 $70.51 $5.95 $4.08 $44.67 $40.27 $2.43 $1.97
PENELEC $70.22 $70.51 ($0.21) ($0.09) $40.30 $40.27 ($0.01) $0.04
Pepco $86.25 $70.51 $13.25 $2.49 $45.60 $40.27 $3.67 $1.66
PPL $79.68 $70.51 $6.61 $2.56 $43.82 $40.27 $2.46 $1.09
PSEG $86.08 $70.51 $9.45 $6.12 $46.27 $40.27 $2.99 $3.00
RECO $84.51 $70.51 $8.50 $5.50 $45.06 $40.27 $2.06 $2.72

© 2009 Monitoring Analytics, LLC www.monitoringanalytics.com 29
ENERgy MARkET, PART 1 31 2 486 7 AEC D FJH I K
5B
APP
ENDIX
GL
M N O
APP
ENDIX
SECTION
SECTION
APP
ENDIX
SECTION
SECTION
APP
ENDIX
SECTION
APP
ENDIX
SECTION
SECTION
APP
ENDIX
APP
ENDIX
APP
ENDIX
APP
ENDIX
APP
ENDIX
APP
ENDIX
APP
ENDIX
APP
ENDIX
APP
ENDIX
PREF
ACE
APP
ENDIX
VOLU
ME
1SECTION
2009 Quarterly State of the Market Report for PJM: January through June
Zonal and PJM Day-Ahead, Annual, Load-Weighted, Average LMP Components
Zonal and PJM day-ahead, load-weighted, average LMP components (Dollars per Table 2-69 MWh): January through June 2009 (See 2008 SOM, Table 2-73)
Day-Ahead LMP
Energy Component
Congestion Component
Loss Component
AECO $48.09 $42.51 $2.90 $2.68
AEP $37.95 $42.75 ($2.99) ($1.81)
AP $43.83 $43.12 $0.62 $0.08
BGE $49.12 $42.68 $4.27 $2.17
ComEd $31.72 $41.65 ($6.39) ($3.54)
DAY $36.99 $42.59 ($3.95) ($1.64)
DLCO $35.10 $41.95 ($5.07) ($1.79)
Dominion $47.39 $42.88 $3.47 $1.04
DPL $48.86 $42.70 $3.35 $2.81
JCPL $47.94 $42.27 $2.71 $2.96
Met-Ed $47.29 $42.79 $3.10 $1.40
PECO $47.08 $42.32 $2.66 $2.10
PENELEC $42.35 $42.42 ($0.14) $0.06
Pepco $48.20 $42.35 $4.07 $1.78
PPL $46.72 $42.68 $2.83 $1.21
PSEG $48.45 $42.11 $3.19 $3.16
RECO $47.59 $42.47 $2.21 $2.91
PJM $42.21 $42.47 ($0.14) ($0.12)
Marginal Loss Accounting
Monthly Marginal Loss Costs
Marginal loss costs by type (Dollars (Millions)): 2009 (See 2008 SOM, Table 2-74)Table 2-70
Marginal Loss Costs (Millions)
Day Ahead Balancing
Load Payments
Generation Credits Explicit Total
Load Payments
Generation Credits Explicit Total
Grand Total
Jan $52.4 ($143.8) $14.2 $210.5 $1.0 ($2.6) ($6.8) ($3.2) $207.3
Feb $35.9 ($88.8) $8.2 $132.9 ($0.3) ($1.2) ($4.2) ($3.2) $129.7
Mar $34.9 ($78.6) $8.5 $122.0 ($0.8) ($1.3) ($5.3) ($4.8) $117.2
Apr $22.2 ($59.5) $5.9 $87.6 ($1.3) ($0.1) ($3.7) ($4.9) $82.6
May $20.3 ($53.6) $4.6 $78.5 ($0.5) ($0.4) ($2.5) ($2.5) $76.0
Jun $18.6 ($71.2) $3.1 $92.9 ($0.5) ($1.5) ($1.5) ($0.6) $92.3
Jul $0.0 $0.0 $0.0 $0.0 $0.0 $0.0 $0.0 $0.0 $0.0
Aug $0.0 $0.0 $0.0 $0.0 $0.0 $0.0 $0.0 $0.0 $0.0
Sep $0.0 $0.0 $0.0 $0.0 $0.0 $0.0 $0.0 $0.0 $0.0
Oct $0.0 $0.0 $0.0 $0.0 $0.0 $0.0 $0.0 $0.0 $0.0
Nov $0.0 $0.0 $0.0 $0.0 $0.0 $0.0 $0.0 $0.0 $0.0
Dec $0.0 $0.0 $0.0 $0.0 $0.0 $0.0 $0.0 $0.0 $0.0
Total $184.2 ($495.5) $44.6 $724.4 ($2.4) ($7.1) ($23.9) ($19.2) $705.2

© 2009 Monitoring Analytics, LLC www.monitoringanalytics.com30
ENERgy MARkET, PART 131 2 486 7 AEC D FJH I K
5B
APP
ENDIX
GL
M N O
APP
ENDIX
SECTION
SECTION
APP
ENDIX
SECTION
SECTION
APP
ENDIX
SECTION
APP
ENDIX
SECTION
SECTION
APP
ENDIX
APP
ENDIX
APP
ENDIX
APP
ENDIX
APP
ENDIX
APP
ENDIX
APP
ENDIX
APP
ENDIX
APP
ENDIX
PREF
ACE
APP
ENDIX
VOLU
ME
1SECTION
2009 Quarterly State of the Market Report for PJM: January through June
Zonal Marginal Loss Costs
Marginal loss costs by control zone and type (Dollars (Millions)): January through June 2009 (See 2008 SOM, Table 2-75)Table 2-71
Marginal Loss Costs by Control Zone (Millions)Day Ahead Balancing
Load Payments Generation Credits Explicit Total Load Payments Generation Credits Explicit Total Grand TotalAECO $13.4 $2.7 $0.2 $10.8 $0.3 ($0.1) $0.1 $0.4 $11.3 AEP ($26.4) ($133.1) $10.0 $116.8 $0.2 ($0.3) ($0.9) ($0.3) $116.5 AP $2.9 ($47.3) $5.9 $56.1 $1.1 $2.0 ($3.1) ($4.0) $52.1 BGE $26.9 $5.3 $0.5 $22.1 $1.8 ($1.0) ($0.4) $2.4 $24.5 ComEd ($78.0) ($221.6) $0.3 $143.9 ($0.3) ($1.7) ($0.2) $1.2 $145.1 DAY ($2.3) ($29.3) $0.7 $27.6 ($0.2) $1.5 $0.1 ($1.5) $26.1 DLCO ($11.7) ($24.0) $0.1 $12.5 ($1.3) $0.1 ($0.0) ($1.5) $11.0 Dominion $42.3 ($24.7) $2.6 $69.6 $1.1 ($0.7) ($1.4) $0.4 $70.0 DPL $28.2 $4.4 $0.3 $24.1 ($1.7) ($0.4) ($0.2) ($1.5) $22.6 JCPL $35.2 $12.6 $0.2 $22.9 ($0.1) ($1.3) ($0.1) $1.0 $23.9 Met-Ed $10.7 $2.8 $0.2 $8.0 ($0.1) ($0.3) ($0.1) $0.1 $8.1 PECO $31.9 $6.9 $0.0 $25.0 ($0.2) ($0.5) $0.0 $0.3 $25.4 PENELEC ($6.3) ($44.6) $0.4 $38.8 ($0.9) $1.0 ($0.2) ($2.1) $36.7 Pepco $40.8 $18.3 $1.4 $23.8 ($0.8) ($1.4) ($1.0) ($0.4) $23.5 PJM ($2.7) ($23.8) $17.3 $38.4 ($0.2) ($6.8) ($13.6) ($7.1) $31.3 PPL $23.7 ($9.4) $0.9 $34.0 ($0.3) $0.4 $0.1 ($0.6) $33.3 PSEG $53.7 $9.4 $3.5 $47.8 ($0.6) $2.4 ($2.8) ($5.9) $41.9 RECO $2.0 $0.0 $0.1 $2.1 ($0.1) ($0.0) ($0.1) ($0.1) $2.0 Total $184.2 ($495.5) $44.6 $724.4 ($2.4) ($7.1) ($23.9) ($19.2) $705.2
Monthly marginal loss costs by control zone (Dollars (Millions)): 2009 (See 2008 SOM, Table 2-76)Table 2-72
Marginal Loss Costs by Control Zone (Millions)Jan Feb Mar Apr May Jun Jul Aug Sep Oct Nov Dec Grand Total
AECO $3.4 $2.0 $1.7 $1.7 $1.2 $1.3 $0.0 $0.0 $0.0 $0.0 $0.0 $0.0 $11.3 AEP $32.6 $22.9 $18.6 $13.1 $11.7 $17.5 $0.0 $0.0 $0.0 $0.0 $0.0 $0.0 $116.5 AP $18.0 $9.4 $8.4 $6.2 $4.8 $5.4 $0.0 $0.0 $0.0 $0.0 $0.0 $0.0 $52.1 BGE $7.0 $4.4 $4.2 $2.6 $2.8 $3.4 $0.0 $0.0 $0.0 $0.0 $0.0 $0.0 $24.5 ComEd $36.3 $26.1 $28.0 $19.4 $16.9 $18.4 $0.0 $0.0 $0.0 $0.0 $0.0 $0.0 $145.1 DAY $7.8 $4.6 $4.5 $3.3 $2.2 $3.7 $0.0 $0.0 $0.0 $0.0 $0.0 $0.0 $26.1 DLCO $3.5 $1.9 $2.1 $1.2 $0.7 $1.6 $0.0 $0.0 $0.0 $0.0 $0.0 $0.0 $11.0 Dominion $20.2 $11.8 $11.1 $7.0 $8.2 $11.5 $0.0 $0.0 $0.0 $0.0 $0.0 $0.0 $70.0 DPL $6.8 $4.3 $4.0 $2.9 $2.4 $2.2 $0.0 $0.0 $0.0 $0.0 $0.0 $0.0 $22.6 JCPL $8.3 $5.6 $3.7 $2.4 $2.1 $1.8 $0.0 $0.0 $0.0 $0.0 $0.0 $0.0 $23.9 Met-Ed $2.4 $1.4 $1.2 $0.9 $0.8 $1.4 $0.0 $0.0 $0.0 $0.0 $0.0 $0.0 $8.1 PECO $8.0 $4.3 $3.5 $2.6 $2.9 $4.1 $0.0 $0.0 $0.0 $0.0 $0.0 $0.0 $25.4 PENELEC $12.1 $5.6 $4.3 $4.1 $5.0 $5.6 $0.0 $0.0 $0.0 $0.0 $0.0 $0.0 $36.7 Pepco $6.0 $3.6 $4.3 $3.1 $2.8 $3.7 $0.0 $0.0 $0.0 $0.0 $0.0 $0.0 $23.5 PJM $14.1 $6.0 $4.8 $2.0 $3.2 $1.3 $0.0 $0.0 $0.0 $0.0 $0.0 $0.0 $31.3 PPL $10.1 $6.5 $5.5 $3.8 $3.0 $4.5 $0.0 $0.0 $0.0 $0.0 $0.0 $0.0 $33.3 PSEG $10.1 $8.8 $7.1 $6.0 $5.1 $4.9 $0.0 $0.0 $0.0 $0.0 $0.0 $0.0 $41.9 RECO $0.6 $0.4 $0.3 $0.3 $0.2 $0.2 $0.0 $0.0 $0.0 $0.0 $0.0 $0.0 $2.0 Total $207.3 $129.7 $117.2 $82.6 $76.0 $92.3 $0.0 $0.0 $0.0 $0.0 $0.0 $0.0 $705.2

© 2009 Monitoring Analytics, LLC www.monitoringanalytics.com 31
ENERgy MARkET, PART 1 31 2 486 7 AEC D FJH I K
5B
APP
ENDIX
GL
M N O
APP
ENDIX
SECTION
SECTION
APP
ENDIX
SECTION
SECTION
APP
ENDIX
SECTION
APP
ENDIX
SECTION
SECTION
APP
ENDIX
APP
ENDIX
APP
ENDIX
APP
ENDIX
APP
ENDIX
APP
ENDIX
APP
ENDIX
APP
ENDIX
APP
ENDIX
PREF
ACE
APP
ENDIX
VOLU
ME
1SECTION
2009 Quarterly State of the Market Report for PJM: January through June
Virtual Offers and BidsType of day-ahead marginal units: January through June 2009 (See 2008 SOM, Table 2-73
Table 2-77)
Generation Transaction Decrement BidIncrement
OfferPrice-Sensitive
DemandJan 20.6% 32.2% 33.3% 13.0% 1.0%
Feb 17.4% 38.8% 28.5% 14.6% 0.8%
Mar 14.9% 39.8% 27.6% 17.0% 0.7%
Apr 16.2% 38.7% 28.6% 16.0% 0.5%
May 12.2% 38.5% 29.1% 19.0% 1.2%
Jun 17.3% 30.7% 27.2% 24.0% 0.8%
Annual 16.4% 36.4% 29.1% 17.3% 0.8%
PJM day-ahead aggregate supply curves: 2009 example day (See 2008 SOM, Figure 2-17 Figure 2-16)
Price Convergence
Day-Ahead and Real-Time Energy Market LMP (Dollars per MWh): January through Table 2-74 June 2009 (See 2008 SOM, Table 2-78)
Day Ahead Real Time DifferenceDifference as Percent
Real TimeAverage $40.01 $40.12 $0.11 0.3%
Median $37.46 $35.42 ($2.04) (5.8%)
Standard deviation $15.38 $19.30 $3.92 20.3%
Day-Ahead and Real-Time Energy Market LMP (Dollars per MWh): Calendar years Table 2-75 2000 through June 2009 (See 2008 SOM, Table 2-79)
Year Day Ahead Real Time Difference Difference as Percent Real Time2000 $31.97 $30.36 ($1.61) (5.3%)
2001 $32.75 $32.38 ($0.37) (1.1%)
2002 $28.46 $28.30 ($0.16) (0.6%)
2003 $38.73 $38.28 ($0.45) (1.2%)
2004 $41.43 $42.40 $0.97 2.3%
2005 $57.89 $58.08 $0.18 0.3%
2006 $48.10 $49.27 $1.17 2.4%
2007 $54.67 $57.58 $2.90 5.0%
2008 $66.12 $66.40 $0.28 0.4%
2009 $40.01 $40.12 $0.11 0.3%

© 2009 Monitoring Analytics, LLC www.monitoringanalytics.com32
ENERgy MARkET, PART 131 2 486 7 AEC D FJH I K
5B
APP
ENDIX
GL
M N O
APP
ENDIX
SECTION
SECTION
APP
ENDIX
SECTION
SECTION
APP
ENDIX
SECTION
APP
ENDIX
SECTION
SECTION
APP
ENDIX
APP
ENDIX
APP
ENDIX
APP
ENDIX
APP
ENDIX
APP
ENDIX
APP
ENDIX
APP
ENDIX
APP
ENDIX
PREF
ACE
APP
ENDIX
VOLU
ME
1SECTION
2009 Quarterly State of the Market Report for PJM: January through June
Frequency distribution by hours of PJM real-time and day-ahead LMP difference (Dollars per MWh): 2005 through June 2009 (See 2008 SOM, Table 2-80)Table 2-76
2005 2006 2007 2008 2009
LMP FrequencyCumulative
Percent FrequencyCumulative
Percent FrequencyCumulative
Percent FrequencyCumulative
Percent FrequencyCumulative
Percent< ($150) 0 0.00% 1 0.01% 0 0.00% 0 0.00% 0 0.00%
($150) to ($100) 1 0.01% 1 0.02% 0 0.00% 1 0.01% 0 0.00%
($100) to ($50) 64 0.74% 9 0.13% 33 0.38% 88 1.01% 3 0.07%
($50) to $0 5,015 57.99% 5,205 59.54% 4,600 52.89% 5,120 59.30% 2,541 58.58%
$0 to $50 3,471 97.61% 3,372 98.04% 3,827 96.58% 3,247 96.27% 1,772 99.38%
$50 to $100 190 99.78% 152 99.77% 255 99.49% 284 99.50% 25 99.95%
$100 to $150 17 99.98% 9 99.87% 31 99.84% 37 99.92% 2 100.00%
$150 to $200 2 100.00% 4 99.92% 5 99.90% 4 99.97% 0 100.00%
$200 to $250 0 100.00% 1 99.93% 1 99.91% 2 99.99% 0 100.00%
$250 to $300 0 100.00% 3 99.97% 3 99.94% 0 99.99% 0 100.00%
$300 to $350 0 100.00% 0 99.97% 2 99.97% 1 100.00% 0 100.00%
$350 to $400 0 100.00% 1 99.98% 1 99.98% 0 100.00% 0 100.00%
$400 to $450 0 100.00% 0 99.98% 1 99.99% 0 100.00% 0 100.00%
$450 to $500 0 100.00% 1 99.99% 1 100.00% 0 100.00% 0 100.00%
>= $500 0 100.00% 1 100.00% 0 100.00% 0 100.00% 0 100.00%
Hourly real-time minus hourly day-ahead LMP: January through June 2009 (See 2008 SOM, Figure 2-17) Figure 2-18

© 2009 Monitoring Analytics, LLC www.monitoringanalytics.com 33
ENERgy MARkET, PART 1 31 2 486 7 AEC D FJH I K
5B
APP
ENDIX
GL
M N O
APP
ENDIX
SECTION
SECTION
APP
ENDIX
SECTION
SECTION
APP
ENDIX
SECTION
APP
ENDIX
SECTION
SECTION
APP
ENDIX
APP
ENDIX
APP
ENDIX
APP
ENDIX
APP
ENDIX
APP
ENDIX
APP
ENDIX
APP
ENDIX
APP
ENDIX
PREF
ACE
APP
ENDIX
VOLU
ME
1SECTION
2009 Quarterly State of the Market Report for PJM: January through June
Monthly average of real-time minus day-ahead LMP: January through June 2009 Figure 2-19 (See 2008 SOM, Figure 2-18)
PJM system hourly average LMP: January through June 2009 (See 2008 SOM, Figure 2-20 Figure 2-19)
Zonal Price Convergence
Zonal Day-Ahead and Real-Time Energy Market LMP (Dollars per MWh): January Table 2-77 through June 2009 (See 2008 SOM, Table 2-81)
Day Ahead Real Time Difference Difference as Percent Real TimeAECO $45.38 $44.59 ($0.78) (1.8%)
AEP $36.19 $36.37 $0.18 0.5%
AP $41.11 $41.77 $0.66 1.6%
BGE $46.01 $45.22 ($0.79) (1.8%)
ComEd $30.42 $30.28 ($0.14) (0.5%)
DAY $35.34 $35.90 $0.56 1.6%
DLCO $34.04 $34.49 $0.45 1.3%
Dominion $44.17 $43.53 ($0.64) (1.5%)
DPL $45.80 $45.20 ($0.61) (1.3%)
JCPL $45.58 $44.92 ($0.66) (1.5%)
Met-Ed $44.24 $43.73 ($0.51) (1.2%)
PECO $44.67 $43.63 ($1.04) (2.4%)
PENELEC $40.30 $40.06 ($0.24) (0.6%)
Pepco $45.60 $44.77 ($0.83) (1.9%)
PPL $43.82 $43.14 ($0.68) (1.6%)
PSEG $46.27 $45.44 ($0.83) (1.8%)
RECO $45.06 $44.22 ($0.84) (1.9%)

© 2009 Monitoring Analytics, LLC www.monitoringanalytics.com34
ENERgy MARkET, PART 131 2 486 7 AEC D FJH I K
5B
APP
ENDIX
GL
M N O
APP
ENDIX
SECTION
SECTION
APP
ENDIX
SECTION
SECTION
APP
ENDIX
SECTION
APP
ENDIX
SECTION
SECTION
APP
ENDIX
APP
ENDIX
APP
ENDIX
APP
ENDIX
APP
ENDIX
APP
ENDIX
APP
ENDIX
APP
ENDIX
APP
ENDIX
PREF
ACE
APP
ENDIX
VOLU
ME
1SECTION
2009 Quarterly State of the Market Report for PJM: January through June
Price Convergence by Jurisdiction
Jurisdiction Day-Ahead and Real-Time Energy Market LMP (Dollars per MWh): Table 2-78 January through June 2009 (See 2008 SOM, Table 2-82)
Day Ahead Real Time DifferenceDifference as Percent of
Real TimeDelaware $45.21 $44.87 ($0.34) (0.8%)
Illinois $30.42 $30.28 ($0.14) (0.5%)
Indiana $35.47 $35.71 $0.24 0.7%
Kentucky $35.95 $36.25 $0.30 0.8%
Maryland $45.89 $45.20 ($0.69) (1.5%)
Michigan $36.78 $37.07 $0.29 0.8%
New Jersey $45.94 $45.16 ($0.78) (1.7%)
North Carolina $43.03 $42.45 ($0.58) (1.4%)
Ohio $35.29 $35.69 $0.40 1.1%
Pennsylvania $42.33 $41.88 ($0.45) (1.1%)
Tennessee $36.51 $36.34 ($0.17) (0.5%)
Virginia $43.40 $42.77 ($0.63) (1.5%)
West Virginia $37.35 $37.62 $0.27 0.7%
District of Columbia $45.68 $44.92 ($0.76) (1.7%)
Load and Spot Market
Real-Time Load and Spot MarketMonthly average percentage of real-time self-supply load, bilateral-supply load Table 2-79
and spot-supply load based on parent companies: 2008 through June 2009 (See 2008 SOM, Table 2-83)
2008 2009Difference in Percentage
PointsBilateral Contract Spot
Self-Supply
Bilateral Contract Spot
Self-Supply
Bilateral Contract Spot
Self-Supply
Jan 14.3% 17.3% 68.4% 12.6% 15.4% 72.0% (1.7%) (1.9%) 3.6%
Feb 15.2% 17.3% 67.5% 13.4% 14.5% 72.1% (1.7%) (2.9%) 4.6%
Mar 16.0% 17.1% 66.9% 13.8% 16.7% 69.5% (2.3%) (0.4%) 2.6%
Apr 16.6% 18.0% 65.4% 13.5% 17.2% 69.3% (3.1%) (0.8%) 3.9%
May 16.0% 18.8% 65.3% 14.6% 18.8% 66.7% (1.4%) (0.0%) 1.4%
Jun 13.1% 21.0% 65.9% 12.5% 16.5% 71.0% (0.6%) (4.5%) 5.1%
Jul 13.7% 20.6% 65.7%
Aug 14.9% 22.6% 62.4%
Sep 14.7% 23.0% 62.2%
Oct 15.1% 22.7% 62.2%
Nov 14.8% 22.9% 62.3%
Dec 12.1% 20.5% 67.4%
Annual 14.6% 20.1% 65.2% 13.4% 16.4% 70.2% (1.3%) (3.7%) 5.0%

© 2009 Monitoring Analytics, LLC www.monitoringanalytics.com 35
ENERgy MARkET, PART 1 31 2 486 7 AEC D FJH I K
5B
APP
ENDIX
GL
M N O
APP
ENDIX
SECTION
SECTION
APP
ENDIX
SECTION
SECTION
APP
ENDIX
SECTION
APP
ENDIX
SECTION
SECTION
APP
ENDIX
APP
ENDIX
APP
ENDIX
APP
ENDIX
APP
ENDIX
APP
ENDIX
APP
ENDIX
APP
ENDIX
APP
ENDIX
PREF
ACE
APP
ENDIX
VOLU
ME
1SECTION
2009 Quarterly State of the Market Report for PJM: January through June
Day-Ahead Load and Spot MarketMonthly average percentage of day-ahead self-supply load, bilateral supply load, and spot-supply load based on parent companies: 2008 through June 2009 (See 2008 SOM, Table 2-84)Table 2-80
2008 2009 Difference in Percentage PointsBilateral Contract Spot Self-Supply Bilateral Contract Spot Self-Supply Bilateral Contract Spot Self-Supply
Jan 4.2% 15.6% 80.2% 4.4% 13.9% 81.7% 0.2% (1.7%) 1.5%
Feb 4.5% 16.0% 79.5% 4.5% 12.7% 82.9% (0.1%) (3.3%) 3.4%
Mar 4.7% 16.0% 79.3% 4.3% 13.2% 82.5% (0.4%) (2.8%) 3.2%
Apr 5.0% 16.8% 78.2% 4.4% 14.1% 81.5% (0.5%) (2.7%) 3.3%
May 5.0% 18.2% 76.8% 4.6% 15.9% 79.5% (0.4%) (2.3%) 2.7%
Jun 5.5% 20.2% 74.3% 4.7% 14.2% 81.2% (0.8%) (6.1%) 6.9%
Jul 5.6% 20.4% 74.0%
Aug 4.9% 20.2% 75.0%
Sep 5.4% 19.3% 75.3%
Oct 5.4% 20.3% 74.3%
Nov 5.6% 18.9% 75.5%
Dec 4.6% 19.1% 76.3%
Annual 5.0% 18.4% 76.5% 4.5% 13.9% 81.6% (0.5%) (4.5%) 5.0%
Virtual Markets
Increment Offers and Decrement BidsMonthly volume of cleared and submitted INCs, DECs: January through June 2009 (See 2008 SOM, Table 2-85)Table 2-81
Increment Offers Decrement Bids
Average Cleared MW Average Submitted MWAverage Cleared
VolumeAverage Submitted
Volume Average Cleared MW Average Submitted MWAverage Cleared
Volume Average Submitted VolumeJan 13,986 21,401 423 621 16,879 26,080 487 670
Feb 13,487 22,228 484 739 15,557 24,967 420 624
Mar 13,364 22,639 552 820 15,186 23,243 459 651
Apr 11,363 19,935 380 645 13,900 21,173 428 607
May 12,853 16,863 388 750 13,973 19,274 529 805
Jun 12,375 15,369 315 750 14,777 18,402 482 802
Jul
Aug
Sep
Oct
Nov
Dec
Annual 12,906 19,719 423 721 15,043 22,169 468 693

© 2009 Monitoring Analytics, LLC www.monitoringanalytics.com36
ENERgy MARkET, PART 131 2 486 7 AEC D FJH I K
5B
APP
ENDIX
GL
M N O
APP
ENDIX
SECTION
SECTION
APP
ENDIX
SECTION
SECTION
APP
ENDIX
SECTION
APP
ENDIX
SECTION
SECTION
APP
ENDIX
APP
ENDIX
APP
ENDIX
APP
ENDIX
APP
ENDIX
APP
ENDIX
APP
ENDIX
APP
ENDIX
APP
ENDIX
PREF
ACE
APP
ENDIX
VOLU
ME
1SECTION
2009 Quarterly State of the Market Report for PJM: January through June
Demand-Side Response (DSR)
emergency Program
Zonal capability in the Emergency Program for the 2009 peak day through June (By Table 2-82 option): January 16, 2009 (See 2008 SOM, Table 2-86)
Energy Only Full Capacity OnlySites MW Sites MW Sites MW
AECO 0 0.0 70 20.0 7 8.6
AEP 0 0.0 137 512.5 54 698.5
AP 0 0.0 100 138.9 39 133.7
BGE 0 0.0 196 428.4 46 32.8
ComEd 0 0.0 69 95.6 877 820.9
DAY 0 0.0 23 8.4 8 50.0
DLCO 0 0.0 13 27.0 21 45.6
Dominion 0 0.0 59 5.5 74 81.1
DPL 0 0.0 60 79.3 29 46.0
JCPL 0 0.0 80 97.6 33 14.5
Met-Ed 0 0.0 70 150.7 24 40.8
PECO 0 0.0 146 60.7 154 216.9
PENELEC 0 0.0 38 50.5 35 30.0
Pepco 0 0.0 109 46.8 35 21.3
PPL 0 0.0 114 59.6 97 278.7
PSEG 0 0.0 236 175.3 63 19.9
RECO 0 0.0 3 1.0 21 1.1
Total 0 0.0 1,523 1,957.8 1,617 2,540.4
Zonal monthly capacity credits: January 1, 2009, through June 30, 2009 (See 2008 Table 2-83 SOM, Table 2-87)
Zone January February March April May June
AECO $154,551 $139,595 $154,551 $149,566 $154,551 $375,086
AEP $2,578,133 $2,328,636 $2,578,133 $2,494,967 $2,578,133 $3,746,728
APS $966,835 $873,270 $966,835 $935,647 $966,835 $2,982,596
BGE $2,882,161 $2,603,243 $2,882,161 $2,789,189 $2,882,161 $4,464,694
ComEd $3,294,602 $2,975,769 $3,294,602 $3,188,324 $3,294,602 $4,217,299
DAY $258,904 $233,849 $258,904 $250,552 $258,904 $646,419
DLCO $258,489 $233,474 $258,489 $250,151 $258,489 $375,138
Dominion $296,319 $267,643 $296,319 $286,760 $296,319 $1,602,407
DPL $665,561 $601,152 $665,561 $644,091 $665,561 $971,656
JCPL $554,279 $500,639 $554,279 $536,399 $554,279 $868,932
Met-Ed $681,734 $615,760 $681,734 $659,743 $681,734 $1,313,605
PECO $1,375,581 $1,242,460 $1,375,581 $1,331,207 $1,375,581 $2,052,483
PENELEC $283,241 $255,831 $283,241 $274,105 $283,241 $1,282,941
Pepco $572,160 $516,789 $572,160 $553,703 $572,160 $788,433
PPL $1,200,552 $1,084,370 $1,200,552 $1,161,825 $1,200,552 $3,500,850
PSEG $922,290 $833,036 $922,290 $892,538 $922,290 $1,720,276
RECO $10,219 $9,230 $10,219 $9,890 $10,219 $17,897
Total $16,955,611 $15,314,746 $16,955,611 $16,408,656 $16,955,611 $30,927,439

© 2009 Monitoring Analytics, LLC www.monitoringanalytics.com 37
ENERgy MARkET, PART 1 31 2 486 7 AEC D FJH I K
5B
APP
ENDIX
GL
M N O
APP
ENDIX
SECTION
SECTION
APP
ENDIX
SECTION
SECTION
APP
ENDIX
SECTION
APP
ENDIX
SECTION
SECTION
APP
ENDIX
APP
ENDIX
APP
ENDIX
APP
ENDIX
APP
ENDIX
APP
ENDIX
APP
ENDIX
APP
ENDIX
APP
ENDIX
PREF
ACE
APP
ENDIX
VOLU
ME
1SECTION
2009 Quarterly State of the Market Report for PJM: January through June
economic Program
Economic Program registration on the last day of the month: January 2007 through Table 2-84 June 200910 (New table)
2007 2008 2009
MonthRegistered
Sites Registered MWRegistered
Sites Registered MW Registered Sites Registered MWJan 508 1,530 4,906 2,959 4,862 3,303Feb 953 1,567 4,902 2,961 4,869 3,219Mar 959 1,578 4,972 3,012 4,867 3,227Apr 980 1,648 5,016 3,197 2,582 3,242May 996 3,674 5,069 3,588 1,250 2,860Jun 2,490 2,168 3,112 3,014 1,261 2,455Jul 2,872 2,459 4,542 3,165Aug 2,911 2,582 4,815 3,232Sep 4,868 2,915 4,836 3,263Oct 4,873 2,880 4,846 3,266Nov 4,897 2,948 4,851 3,271Dec 4,898 2,944 4,851 3,290Avg. 2,684 2,408 4,727 3,185 3,282 3,051
Zonal capability in the Economic Program: January 16, 2009 (See 2008 SOM, Table 2-89)Table 2-85
Sites MWAECO 32 11.4AEP 13 251.1AP 33 228.2BGE 143 608.1ComEd 3,849 969.5DAY 9 10.0DLCO 27 95.6Dominion 63 208.9DPL 114 127.3JCPL 77 120.3Met-Ed 41 99.3PECO 192 222.3PENELEC 12 23.3Pepco 16 16.4PPL 91 225.3PSEG 148 93.2RECO 3 0.9Total 4,863 3,311.0
10 The site count and registered MW associated with May 2007 are for May 9, 2007. Several new sites registered in May of 2007 overstated their MW capability, and it remains overstated in PJM data.
Economic Program Payments: Calendar years 2007 (without incentive payments), Figure 2-21 2008 and January through June of 200911 (See 2008 SOM, Figure 2-20)
$2,000,000
$3,000,000
$4,000,000
$5,000,000
$6,000,00020082007
$0
$1,000,000
$2,000,000
1 2 3 4 5 6 7 8 9 10 11 12 Jan-09 Feb-09 Mar-09 Apr-09 May-09 Jun-09
Month
11 All May and June settlement, reduction and credit data are subject to change. Settlements may be submitted up to 60 days following an event day. EDC/LSEs have up to 10 business days to approve which could result in a maximum lag of approximately 74 calendar days. In addition, June data submitted after July 1, 2009 is not reflected due to changes to the PJM DSR settlement collection system and database structure. All MWh reductions and CSP credits have been provided by PJM as the best data available as of July 27, 2009.

© 2009 Monitoring Analytics, LLC www.monitoringanalytics.com38
ENERgy MARkET, PART 131 2 486 7 AEC D FJH I K
5B
APP
ENDIX
GL
M N O
APP
ENDIX
SECTION
SECTION
APP
ENDIX
SECTION
SECTION
APP
ENDIX
SECTION
APP
ENDIX
SECTION
SECTION
APP
ENDIX
APP
ENDIX
APP
ENDIX
APP
ENDIX
APP
ENDIX
APP
ENDIX
APP
ENDIX
APP
ENDIX
APP
ENDIX
PREF
ACE
APP
ENDIX
VOLU
ME
1SECTION
2009 Quarterly State of the Market Report for PJM: January through June
PJM Economic Program by zonal reduction: January through June 2009 (See 2008 SOM, Table 2-92)Table 2-86
Real Time Day Ahead Dispatched in Real Time Totals MWh Credits Hours MWh Credits Hours MWh Credits Hours MWh Credits Hours
AECO 35 $1,123 89 0 $0 0 4 $117 15 40 $1,241 104
AEP 3,895 $53,692 247 0 $25,038 44 0 $0 0 3,895 $78,730 291
AP 121 $8,079 81 0 $0 0 10 $562 11 131 $8,641 92
BGE 45 $2,193 246 0 $0 0 0 $0 0 45 $2,193 246
ComEd 21 $316 72 0 $0 0 647 $4,351 771 669 $4,667 843
DAY 0 $0 0 0 $0 0 0 $0 0 0 $0 0
DLCO 0 $0 0 0 $0 0 0 $0 0 0 $0 0
Dominion 3,365 $200,005 690 42 $442 76 130 $4,953 109 3,537 $205,400 875
DPL 10 $414 244 0 $0 0 0 $0 0 10 $414 244
JCPL 0 $0 0 0 $0 0 9 $248 30 9 $248 30
Met-Ed 64 $3,218 90 0 $0 0 4 $254 14 68 $3,472 104
PECO 5,125 $122,640 9,968 0 $0 0 204 $13,496 1,053 5,329 $136,136 11,021
PENELEC 154 $6,661 26 0 $0 0 2 $47 6 156 $6,708 32
Pepco 126 $4,224 63 0 $0 0 39 $1,753 71 164 $5,977 134
PPL 6,582 $260,617 2,933 1,895 $65,199 730 172 $14,954 336 8,649 $340,770 3,999
PSEG 62 $1,809 90 0 $0 0 5 $177 32 68 $1,987 122
RECO 1 $12 24 0 $0 0 0 $0 0 1 $12 24
Total 19,606 $665,003 14,863 1,937 $90,679 850 1,227 $40,914 2,448 22,769 $796,596 18,161
Max 6,582 $260,617 9,968 1,895 $65,199 730 647 $14,954 1,053 8,649 $340,770 11,021
Avg 1,153 $39,118 874 114 $5,334 50 72 $2,407 144 1,339 $46,859 1,068
Settlement days submitted by month in the Economic Program: 2007, 2008 and January through June 2009 (New table)Table 2-87
Month 2007 2008 2009Jan 887 2,894 1,224
Feb 1,099 2,785 630
Mar 1,185 2,802 542
Apr 1,468 3,386 318
May 1,609 3,309 260
Jun 1,731 3,072 30
Jul 2,421 3,209
Aug 3,783 3,732
Sep 3,320 3,179
Oct 3,446 1,947
Nov 2,819 1,068
Dec 2,655 933
Total 26,423 32,316 2,396

© 2009 Monitoring Analytics, LLC www.monitoringanalytics.com 39
ENERgy MARkET, PART 1 31 2 486 7 AEC D FJH I K
5B
APP
ENDIX
GL
M N O
APP
ENDIX
SECTION
SECTION
APP
ENDIX
SECTION
SECTION
APP
ENDIX
SECTION
APP
ENDIX
SECTION
SECTION
APP
ENDIX
APP
ENDIX
APP
ENDIX
APP
ENDIX
APP
ENDIX
APP
ENDIX
APP
ENDIX
APP
ENDIX
APP
ENDIX
PREF
ACE
APP
ENDIX
VOLU
ME
1SECTION
2009 Quarterly State of the Market Report for PJM: January through June
Distinct customers and CSPs submitting settlements in the Economic Program by month: Calendar years 2007, 2008 and January through June 2009 (New table)Table 2-88
2007 2008 2009Month Active CSPs Active Customers Active CSPs Active Customers Active CSPs Active CustomersJan 10 68 11 260 13 234Feb 8 83 10 241 11 128Mar 8 82 10 216 9 143Apr 9 92 11 204 5 67May 10 103 9 227 4 79Jun 10 163 14 276 1 13Jul 13 227 14 255Aug 15 285 15 270Sep 13 280 14 276Oct 9 240 10 222Nov 8 202 11 205Dec 9 241 10 192Total Distinct Active 17 384 20 494 13 271
Hourly frequency distribution of Economic Program MWh reductions and credits: January through June 2009 (See 2008 SOM, Table 2-93)Table 2-89
MWh Reductions Program CreditsHour MWh Reductions Percent Cumulative Frequency Cumulative Percent Credits Percent Cumulative Frequency Cumulative Percent1 338 1.48% 338 1.48% $5,752 0.72% $5,752 0.72%2 350 1.54% 689 3.02% $5,909 0.74% $11,660 1.46%3 376 1.65% 1,065 4.68% $7,064 0.89% $18,724 2.35%4 398 1.75% 1,462 6.42% $7,454 0.94% $26,178 3.29%5 404 1.77% 1,866 8.20% $8,087 1.02% $34,265 4.30%6 432 1.90% 2,298 10.09% $11,313 1.42% $45,578 5.72%7 1,408 6.19% 3,707 16.28% $85,289 10.71% $130,867 16.43%8 1,772 7.78% 5,479 24.06% $102,739 12.90% $233,606 29.33%9 1,639 7.20% 7,118 31.26% $65,834 8.26% $299,441 37.59%10 1,227 5.39% 8,345 36.65% $51,673 6.49% $351,113 44.08%11 1,055 4.63% 9,400 41.28% $45,952 5.77% $397,065 49.85%12 980 4.30% 10,379 45.58% $28,932 3.63% $425,998 53.48%13 967 4.25% 11,347 49.83% $25,788 3.24% $451,785 56.71%14 989 4.34% 12,336 54.18% $25,913 3.25% $477,699 59.97%15 950 4.17% 13,286 58.35% $21,354 2.68% $499,053 62.65%16 940 4.13% 14,226 62.48% $17,649 2.22% $516,702 64.86%17 1,055 4.63% 15,282 67.11% $25,788 3.24% $542,490 68.10%18 1,238 5.44% 16,519 72.55% $46,513 5.84% $589,003 73.94%19 1,470 6.46% 17,989 79.01% $54,571 6.85% $643,574 80.79%20 1,502 6.59% 19,491 85.60% $52,930 6.64% $696,504 87.43%21 1,316 5.78% 20,807 91.38% $58,154 7.30% $754,658 94.74%22 848 3.72% 21,655 95.10% $23,813 2.99% $778,470 97.72%23 612 2.69% 22,266 97.79% $11,193 1.41% $789,663 99.13%24 503 2.21% 22,769 100.00% $6,933 0.87% $796,596 100.00%

© 2009 Monitoring Analytics, LLC www.monitoringanalytics.com40
ENERgy MARkET, PART 131 2 486 7 AEC D FJH I K
5B
APP
ENDIX
GL
M N O
APP
ENDIX
SECTION
SECTION
APP
ENDIX
SECTION
SECTION
APP
ENDIX
SECTION
APP
ENDIX
SECTION
SECTION
APP
ENDIX
APP
ENDIX
APP
ENDIX
APP
ENDIX
APP
ENDIX
APP
ENDIX
APP
ENDIX
APP
ENDIX
APP
ENDIX
PREF
ACE
APP
ENDIX
VOLU
ME
1SECTION
2009 Quarterly State of the Market Report for PJM: January through June
Frequency distribution of Economic Program zonal, load-weighted, average LMP (By hours): January through June 2009 (See 2008 SOM, Table 2-94)Table 2-90
MWh Reductions Program Credits
LMP MWh Reductions PercentCumulative Frequency
Cumulative Percent Credits Percent
Cumulative Frequency
Cumulative Percent
$0 to $25 122 0.53% 122 0.53% $5,406 0.68% $5,406 0.68%
$25 to $50 10,460 45.94% 10,581 46.47% $146,563 18.40% $151,969 19.08%
$50 to $75 4,892 21.48% 15,473 67.96% $125,629 15.77% $277,597 34.85%
$75 to $100 3,327 14.61% 18,800 82.57% $152,876 19.19% $430,474 54.04%
$100 to $125 1,698 7.46% 20,498 90.03% $108,344 13.60% $538,817 67.64%
$125 to $150 1,082 4.75% 21,581 94.78% $92,569 11.62% $631,386 79.26%
$150 to $200 804 3.53% 22,385 98.31% $94,528 11.87% $725,914 91.13%
$200 to $250 318 1.40% 22,702 99.71% $51,662 6.49% $777,576 97.61%
$250 to $300 9 0.04% 22,712 99.75% $2,175 0.27% $779,751 97.89%
> $300 58 0.25% 22,769 100.00% $16,845 2.11% $796,596 100.00%
Load Management (LM)
Available LM MW by program type: Delivery years 2007 through 2009 (New table)Table 2-91
Delivery Year Total DR MW Total ILR MW Total LM MW2007/2008 560.7 1,584.6 2,145.3
2008/2009 1,017.7 3,480.5 4,498.2
2009/2010 1,021.1 6,273.8 7,294.9
Demand Response (DR) offered and cleared in RPM Base Residual Auction: Delivery years 2007 through 2012 (New table)Table 2-92
Planning Year DR Offered in BRA DR Cleared in BRA2007/2008 123.5 123.5
2008/2009 691.9 536.2
2009/2010 906.9 856.2
2010/2011 935.6 908.1
2011/2012 1,597.3 1,319.5
2012/2013 9,535.4 6,824.1