trade and employment in the global crisis · worldexports of selected manufactures by quarter, 2008...
TRANSCRIPT

Trade and Employment in the Global Crisis
Launch
June 21, 2010
Marion Jansen (and Erik von Uexkull)ILO Employment Sector / Trade and Employment Program
http://www.ilo.org/trade

It’s a long way from Wall Street to a Liberian Rubber Farm...

Outline
1. Trade and Employment During the Crisis: Global Data
2. Country Case Studies: employment effects of trade
fluctuations during the crisis
3. Trade and employment effects of policy responses

While everyone was affected, some regions suffered more than others...
20082009(Jan-Sep) 2008
2009(Jan-Sep)
World 15.1 -30 15.2 -30
Western Europe 11.3 -30 12 -32
Asia 14.4 -24 20.4 -27
North America 10.6 -27 7.6 -30
South/Central America 20.5 -25 30.1 -32
CIS 35.3 -45 32 -41
Africa & Middle East 31.2 -50 25.9 -21
Exports Imports
Source: Finger (2010) based on data from WTO and CPB Trade Monitor

... and some products declined sharper than others.
World Exports of selected manufactures by Quarter, 2008 to 2009 Q3
2008Q1 2008Q2 2008Q3 2008Q4 2009Q1 2009Q2 2009Q3
Manufactures 15.4 17.9 12.5 -11 -28 -29.9 -20.8
Iron and steel 13.8 25.9 41.4 3.7 -38 -55.5 -54.8
Automotive products 14.8 15 2.6 -26.5 -47.1 -45.8 -16.8
Office and Telecom Equipment 9.3 12.4 6.6 -14.7 -28.4 -22 -29.6
Chemicals 18.4 23.5 20.4 -6.7 -23.5 -24.6 -12.4
Textiles and Clothing 9.6 9.5 6 -7.2 -16 -19.8 -14.5
(Percentage changes, y-o-y, current dollars)
Source: Finger (2010) based on data from WTO and CPB Trade Monitor

The global slowdown in employment growth (and losses of existing jobs)...
Source: ILO Global Employment Trends (2010)
2007 2009 diff 2007 2009 diffWorld 5.2 -1.1 -6.2 1.9 0.7 -1.2Developed Economies and European Union 2.6 -3.5 -6.2 1.4 -2.5 -3.9Central and South Eastern Europe (non-EU) & CIS 7.6 -6.5 -14.1 2.1 -2.2 -4.3East Asia 11.2 6.1 -5.1 0.9 0.9 0.0South-East Asia and the Pacific 6.5 0.5 -6.1 2.5 1.7 -0.8South Asia 8.7 5.0 -3.7 2.4 1.8 -0.6Latin America and the Caribbean 5.7 -2.5 -8.2 2.1 0.2 -1.9Middle East 6.1 1.4 -4.7 3.0 3.7 0.7North Africa 5.8 3.7 -2.1 2.7 2.4 -0.3Sub-Saharan Africa 6.8 1.2 -5.7 3.0 2.8 -0.2
Real GDP growth Employment growth

Most jobs were lost in manufacturing.
Source: ILO Sectoral Activities Department (2010)
Change in Employment in Selected Countries (mln. jobs)by Region and Industry

Some companies also reacted by cutting wages...
Source: ILO Sectoral Activities Department (2010)
-3.0
-2.0
-1.0
0.0
1.0
2.0
3.0
4.0
5.0
6.0
Average Change in Wages by Industry in Selected Countries

How do we expect trade to affect labour markets in individual countries during a global crisis?
Source: ILO Sectoral Activities Department (2010)
• We expect the direct effect to be sector specific : export sectors are most affected.
• In the short-run, we expect the strongest negative effect to be on sector specific production factors (capital?) and on factors intensively used in export sectors (low skilled labour in developing/emerging economies?)
• We expect there to be indirect effects via supply and income effects, but a priori we do not know how rapidly the effects will spread.
• We expect to observe different combinations of wage and employment effects depending on company and government policies.

ILO country level work
Source: ILO Sectoral Activities Department (2010)
• Ukraine Rapid Assessments
• Liberia and Uganda Rapid Assessments
• India and South Africa (quantitative: SAM based Leontieff Multiplier model)
• Brazil (quantitative: SAM based CGE model)
• Egypt Rapid assessment

Population (mln.)
GDP pc ($ PPP) Income Group
Trade / GDP
Trade ($) per
capita2007 2007 2007 av 2000-7 2008 2009 2006-8 2006-8 av 2000-7 2008 2009
Brazil 190 9'684 Upper Middle 3.5 5.1 -0.7 26.2 1'854 16.6 23.2 -22.7Egypt 80 5'042 Lower middle 4.7 7.2 4.7 72.9 1'217 21.6 22.1 -19.3India 1'125 2'753 Lower middle 7.2 7.3 5.4 47.6 467 20.8 34.5 -17.9Liberia 4 371 Low 0.0 7.1 4.9 114.5 227 6.3 32.7 -38.5South Africa 48 9'768 Upper middle 4.2 3.1 -2.2 67.5 3'837 13.2 15.7 -22.1Uganda 31 1'075 Low 7.3 9.0 7.0 53.6 212 21.3 35.2 17.8Ukraine 47 6'933 Lower middle 7.5 2.1 -14.0 98.0 3'026 20.4 35.8 -40.7
World 6614.40 9996.00 4.2 3.0 -1.1 56.8 4'267 12.1 14.9 -23.0source: World Bank World Bank World Bank IMF IMF IMF WTO WTO
Real GDP growth
Total exports of goods on a free-on-board (f.o.b) (%
change pa)
IMF, National Central Banks

Ukraine: an example of a country specialized in the “wrong” sectors ...
42 % of total exports
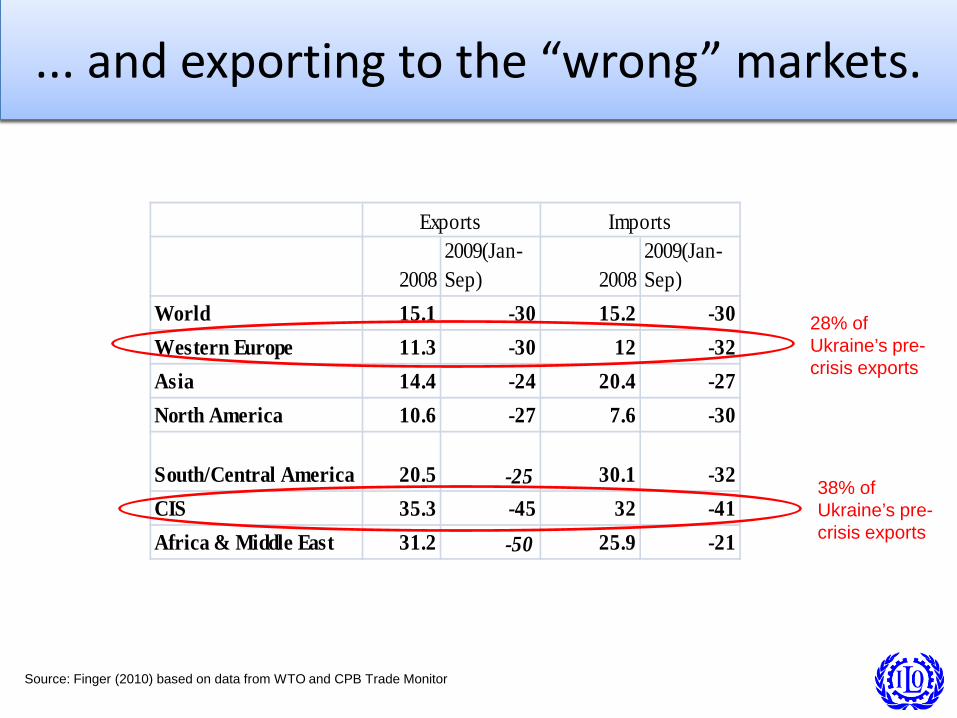
... and exporting to the “wrong” markets.
38% of Ukraine’s pre-crisis exports
20082009(Jan-Sep) 2008
2009(Jan-Sep)
World 15.1 -30 15.2 -30
Western Europe 11.3 -30 12 -32
Asia 14.4 -24 20.4 -27
North America 10.6 -27 7.6 -30
South/Central America 20.5 -25 30.1 -32
CIS 35.3 -45 32 -41
Africa & Middle East 31.2 -50 25.9 -21
Exports Imports
28% of Ukraine’s pre-crisis exports
Source: Finger (2010) based on data from WTO and CPB Trade Monitor
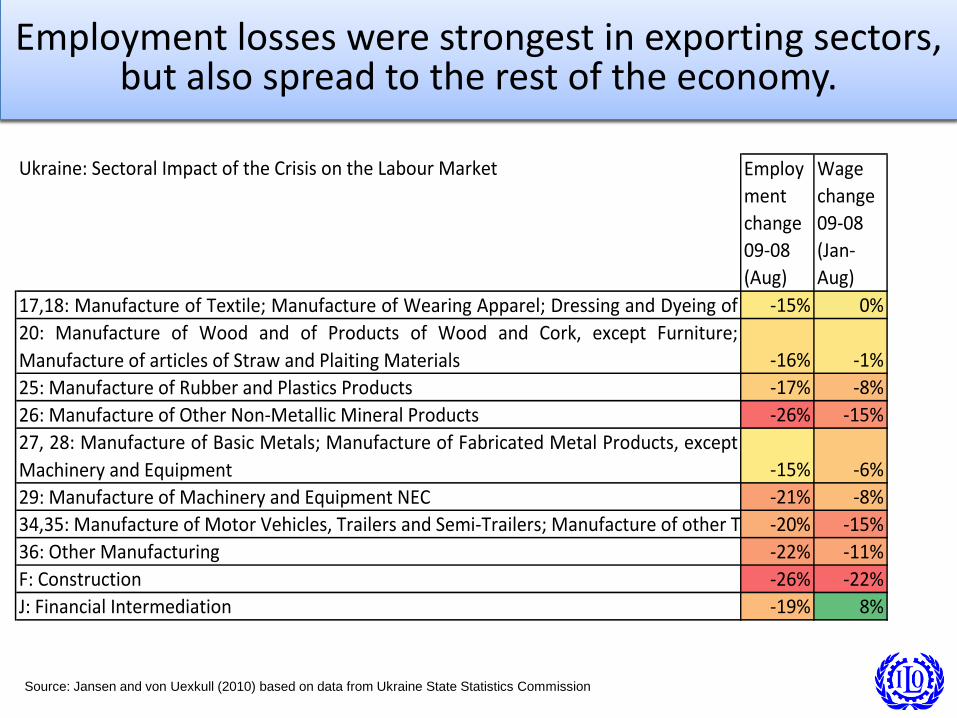
Employment losses were strongest in exporting sectors, but also spread to the rest of the economy.
Source: Jansen and von Uexkull (2010) based on data from Ukraine State Statistics Commission
Ukraine: Sectoral Impact of the Crisis on the Labour Market Employment change 09-08 (Aug)
Wage change 09-08 (Jan-Aug)
17,18: Manufacture of Textile; Manufacture of Wearing Apparel; Dressing and Dyeing of -15% 0%20: Manufacture of Wood and of Products of Wood and Cork, except Furniture;Manufacture of articles of Straw and Plaiting Materials -16% -1%25: Manufacture of Rubber and Plastics Products -17% -8%26: Manufacture of Other Non-Metallic Mineral Products -26% -15%27, 28: Manufacture of Basic Metals; Manufacture of Fabricated Metal Products, exceptMachinery and Equipment -15% -6%29: Manufacture of Machinery and Equipment NEC -21% -8%34,35: Manufacture of Motor Vehicles, Trailers and Semi-Trailers; Manufacture of other T -20% -15%36: Other Manufacturing -22% -11%F: Construction -26% -22%J: Financial Intermediation -19% 8%

South Africa: estimated employment impact of trade shock during the crisis
Source: Simulation results from Kucera et al (2010)
1 Agriculture, hunting, forestry and fishing -2410382 Coal mining -30043 Gold mining and other mining -78934 Food processing -140887 Clothing -10447
10 Wood products -12891912 Printing and publishing -2312616 Glass products -1034219 Metal products -4140327 other manufacturing -4016728 Non tradeable goods and industries -36606036 All industries -886486
Tra
dea
ble
go
od
s in
du
stri
e
Of which 390,000 through income induced effects

Predicted income losses in South Africa are substantial, especially for richer households.
Source: Simulation results from Kucera et al (2010)
South Africa : Impact of Trade on Income by Household

All factors are predicted to lose, but very low wage earners are hit the hardest.
Brazil: Predicted Changes in Factor Incomes
North NE C West South Sao P Rio SE
V low wages -11.15 -7.27 -1.60 -6.00 -7.43 -7.71 -8.80
Low wages -9.24 -6.78 -2.13 -5.64 -6.48 -6.80 -7.99
Med wages -7.37 -6.09 -2.06 -5.94 -5.68 -5.96 -6.71
High wages -2.85 -2.48 -0.95 -2.44 -2.56 -2.44 -2.86
V high wages -2.83 -2.19 -1.08 -2.36 -2.77 -1.41 -2.94
Capital -4.64 -3.73 -5.26 -4.75 -5.10 -2.39 -5.16
Land -9.51 -5.48 6.37 -1.01 -3.37 -8.69 -6.97
Source: Simulation results in McDonald et al (2010)

Brazil
Simulated changes in tax revenues (% change)

Liberia: export earnings declined rapidly as world market demand for rubber (80% of total exports) collapsed...
• Plantations reacted to the crisis through lay-offs and by increased use of precarious contracts (using contractual rather than regularly employed labour)
• Smallholders suffered severe income losses.
• Increasingly tense labour relations and riots on two large rubber plantations
• Reduced bargaining power of the government in ongoing re-negotiations of rubber concessions may lead to negative outcomes well into the future

Long run effects of fluctuations in Liberia
Company investment decisions affected:
• Insecurity among smallholders on replanting decisions increased
Household investment decisions are affected:
• Short term declines in the incomes of the poorest households can perpetuate into the future -> eg.: children have to be taken out of school ; households migrate
Distribution of gains from investments is affected:
• Government lost bargaining power in concession negotiations due to the need to protect employment and secure revenues in the short run -> lower government revenues
Volatility is bad for growth
Volatility can be bad for government revenue

Policy Responses: trade vs. labour “views”
• Trade policy and trade finance
• Sectoral and company-specific stimulus programmes
• Cross-sectoral measures

Trade Policy and Trade Finance
• Leaders (including ILO) warned against spirals of protectionism
• G20 pledged to make US$ 250 billion available for trade finance (... But there is country level evidence of trade finance not being used during crisis)

Sector specific policies
• Relatively high potential to be trade distortive (can be challenged under WTO Agreements).
• ILO Global Jobs Pact supports them in employment intensive sectors.
• Infrastructure is “different”: low potential to be trade distortive, can spur future trade flows and is highly employment intensive.
OECD-UNCTAD-WTO G20 report asks for dismantling of sector specific measures especially those that
“support capital rather than labour”

Cross-sectoral Policies
• Examples: unemployment benefits, income transfers (to poor, young, elderly)
• Not trade distortive
• Have the potential to address direct and indirect employment effects of trade shocks
• Effective cushions against external shocks (ILO, WB)
• Automatic buffers if in place before crisis

Conclusions
• Employment effects of trade shocks have been significant
• Trade shocks have contributed to pressure on nominal wages
• Income induced employment effects of trade shocks have been estimated to represent as much as half of the total employment effect
• There is evidence that trade shocks have affected investment decisions with possible negative consequences for growth
Strong social protection systems are an essential element of socially sustainable globalization:
not trade distortive effective buffers