2009 office market overview presented by spencer stouffer managing director 703.770.3462...
TRANSCRIPT

2009 Office Market Overview
Presented by
Spencer StoufferManaging Director
January 27, 2009

AgendaAgenda
1. Cassidy & Pinkard Colliers
2. Capital Markets Overview
3. Office Statistics for DC area & Predictions
– DC
– Northern Va.
– Maryland
– GSA
4. Construction Pricing

• Leasing Portfolio of 53M square feet
• Management Portfolio of 21M square feet
• Largest Lease Deals in the Region
• Largest Finance Deals
• Sales – Transacted $1B of the $3.4B
Cassidy & Pinkard ColliersCassidy & Pinkard Colliers

• 320 million sf properties under management
• 210 million sf of space for lease
• $5 billion in annual capital market transactions
• $13 billion in transactions
• $800 million in construction projects
• 22,000 managed corporate facilities
• 2,000 employees
• 210 owners
Cassidy & Pinkard – ConsolidationCassidy & Pinkard – ConsolidationNew Company OverviewNew Company Overview

Investment Sales MarketInvestment Sales Market

Office Sales Lowest Since 1999Office Sales Lowest Since 1999
$2.7$3.7 $4.0 $3.9
$6.4$7.3
$10.2
$9.1
$6.4
$3.4
$0.0
$2.0
$4.0
$6.0
$8.0
$10.0
$12.0
$14.0
$16.0
1999 2000 2001 2002 2003 2004 2005 2006 2007 2008
$2.7$3.7 $4.0 $3.9
$6.4$7.3
$10.2
$9.1
$6.4
$3.4
$0.0
$2.0
$4.0
$6.0
$8.0
$10.0
$12.0
$14.0
$16.0
1999 2000 2001 2002 2003 2004 2005 2006 2007 2008
Washington Metro Area, $VolumeWashington Metro Area, $Volume
BillionsBillions
Source: Cassidy & Pinkard ColliersSource: Cassidy & Pinkard Colliers
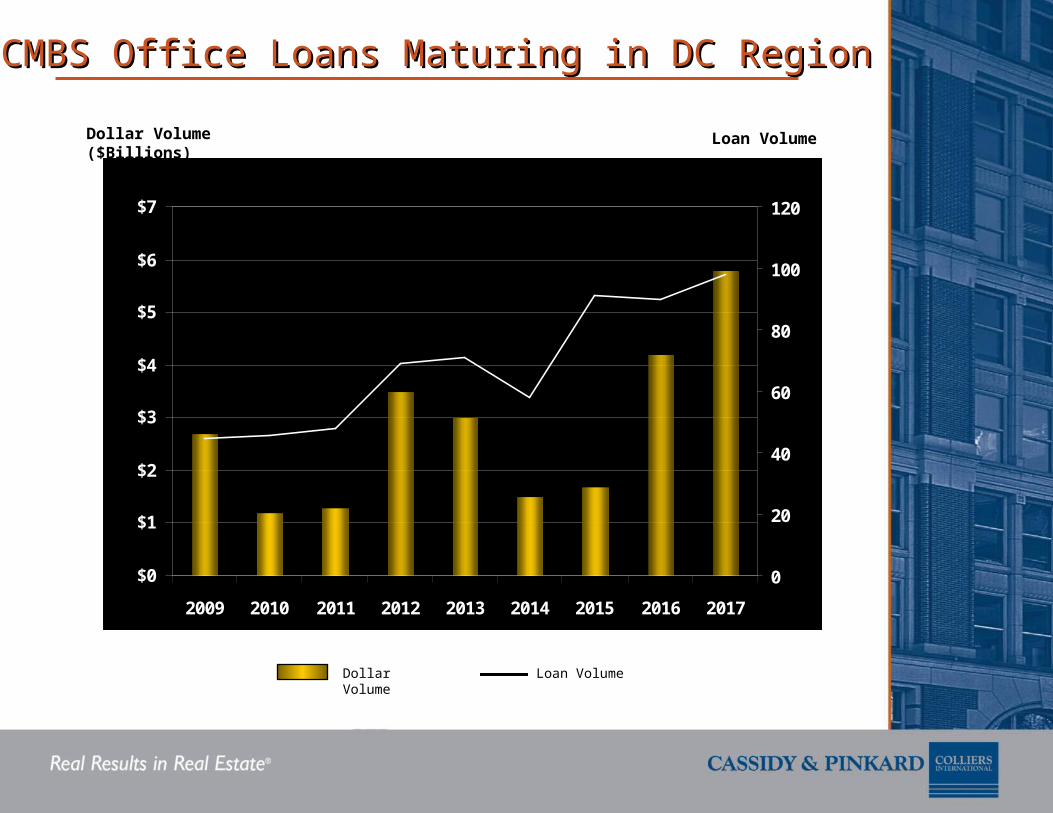
Loan VolumeDollar Volume ($Billions)
Dollar Volume Loan Volume
$0
$1
$2
$3
$4
$5
$6
$7
2009 2010 2011 2012 2013 2014 2015 2016 2017
0
20
40
60
80
100
120
CMBS Office Loans Maturing in DC RegionCMBS Office Loans Maturing in DC Region

• Sales Volume Forecasted below $2B in 2009
• Being in DC is good
• Back to Basics – Equity Contribution 2-3x 2007 levels
• You don’t want to be a Seller
• Pricing has changed (Cap rates up 200 bps)
• Recovery????
• Relationships Matter
ConclusionsConclusions

Office Leasing MarketOffice Leasing Market

• 80-90% renewals
• Tenants & Tenant brokers skeptical regarding
Landlord’s ability to perform (self-help, escrow)
• Moved from a “Negotiation” market to a
“Competition” market
• Many deals being retraded at the last minute
• Sublease space inventory increasing
Leasing – What is happening out there?Leasing – What is happening out there?

District of Columbia: District of Columbia: New Supply Mostly in Non-Core MarketsNew Supply Mostly in Non-Core Markets
0.0
0.5
1.0
1.5
2.0
2.5
2003 2004 2005 2006 2007 2008 2009 2010
CBD East End Capitol Hill/NoMa SW/SE
Sq
uare
Feet
(Million
s)
Source: Cassidy & Pinkard Colliers
PredictionPrediction
“The District will be the only office market in the
country to record positive absorption in 2009.”

Northern Virginia Northern Virginia
Office MarketOffice Market

Tenant ActivityTenant Activity
• 8,000,000 sf of “Tenants in the Northern Va. Market”
• 20+ deals “in the market” over 75,000 sf
Continued consolidation among large contractors – many "one
off" offices will be closed at lease
expiration
Two or Three Gov. Contractors sign leases in excess of
400,000 sf in 2009
PredictionsPredictions
Construction CostsConstruction Costs

Metro Washington, DC Construction MarketMetro Washington, DC Construction Market
Cost Item Budget (Jan. 1, 08)
Budget (Jan. 1, 09)
Hard Costs $45-$50 $36-$41
A/E Design Costs/Peer Review /Permit Cost
$5.00 $4.50
Project Management/ Reimbursable
$4.00 $3.50
Project Contingency (10%) $5.00 $4.00
Total Hard & Soft TI Costs
$59.00-$64.00 $48.00-$53.00
2009 Trends
• Approximately 20% Reduction in Cost

GSA &GSA &
Federal LeasingFederal Leasing

Big Deals: The Consolidation will Continue 2003 - 2008: Over 5.2 Million Square Feet of Consolidation LeasesMedian Size: 575,000 Square Feet2009 – 2013: Well Over 4 Million Square Feet of Consolidation DemandWinners: NOMA, Southwest, Prince George’s
TRENDS: What’s on the Federal Horizon
Renewals will Continue for Sub-prospectus Leases2005 – 2008: Renewals Exceeded 91% of Expiring LeasesPoor GSA Planning will Continue to Result in Lease HoldoversWinners: CBD and Crystal City
GSA Leasing MethodologyProtests are Killing Source Selection Criteria Price Only Competition will Reemerge as the StandardWinners: No One! (maybe the taxpayers)
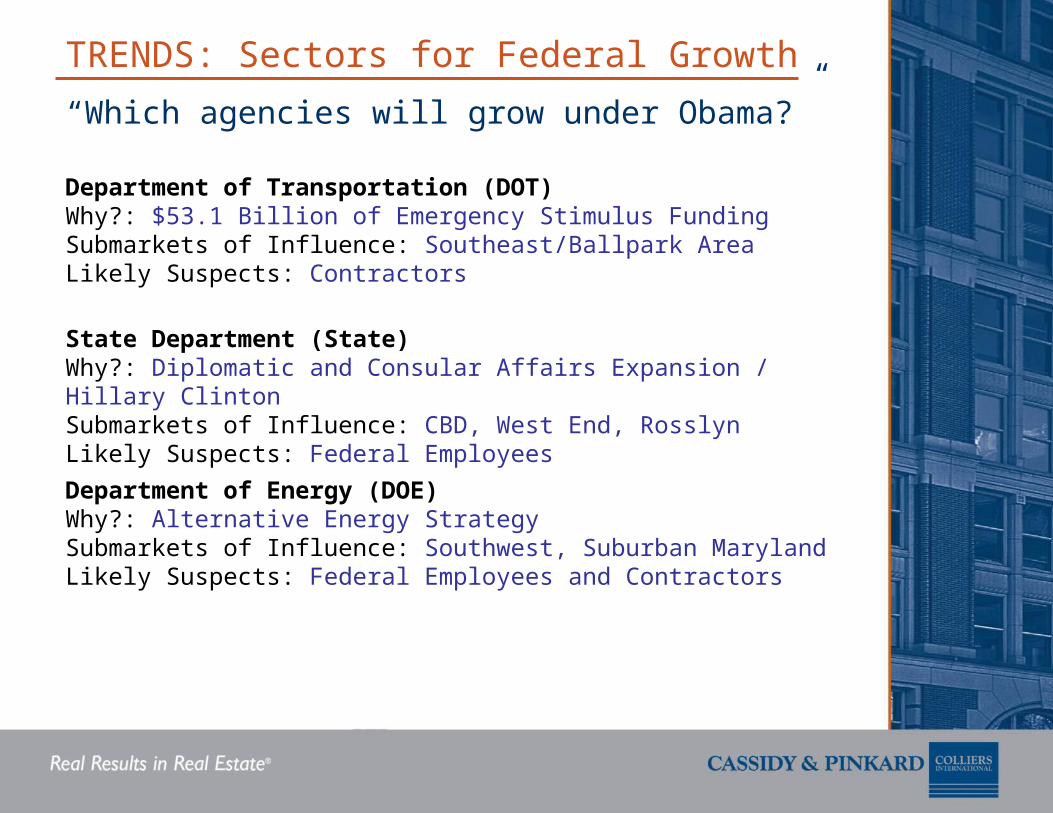
Department of Transportation (DOT)Why?: $53.1 Billion of Emergency Stimulus FundingSubmarkets of Influence: Southeast/Ballpark AreaLikely Suspects: Contractors
TRENDS: Sectors for Federal Growth
“Which agencies will grow under Obama?”
State Department (State)Why?: Diplomatic and Consular Affairs Expansion / Hillary ClintonSubmarkets of Influence: CBD, West End, RosslynLikely Suspects: Federal Employees
Department of Energy (DOE)Why?: Alternative Energy Strategy Submarkets of Influence: Southwest, Suburban MarylandLikely Suspects: Federal Employees and Contractors

TRENDS: Sectors for Federal Growth
National Institutes of Health (NIH)Why?: Medical Research / Health Care System OverhaulSubmarkets of Influence: Suburban MarylandLikely Suspects: Federal Employees and Contractors
Department of Education (EDU)Why?: $66 Billion of Emergency Stimulus Funding Submarkets of Influence: Southwest, CBDLikely Suspects: Federal Employees
Health and Human Services (HHS)Why?: Health Care System Overhaul Submarkets of Influence: Suburban MarylandLikely Suspects: Federal Employees and Contractors
SummarySummary

SummarySummary
• We are fortunate to be in DC Area
• “Back to Basics”
• Service and Relationships
• Guiding Strategy – Bridge to the better market

2009 Office Market Overview
Presented by
Spencer StoufferManaging Director
January 27, 2009