2009 - ir pocket
TRANSCRIPT

ANNUAL REPORT
Year ended March 31, 2009
2009
Company Profile
The present report contains forward-looking statements regarding the JCM Group plans, forecasts, strategies, business results and other items. These forward-looking statements are based on judgments made using the information available at the time. Actual business results will be affected by various risk factors and uncertainties, and readers are advised that they may therefore differ substantially from the projections presented herein. Factors affecting future projections include, but are not limited to, the economic conditions under which the JCM Group operates, competitive pressures, relevant laws and regulations, the status of product development programs, and fluctuations in exchange rates.
Forward-looking statements
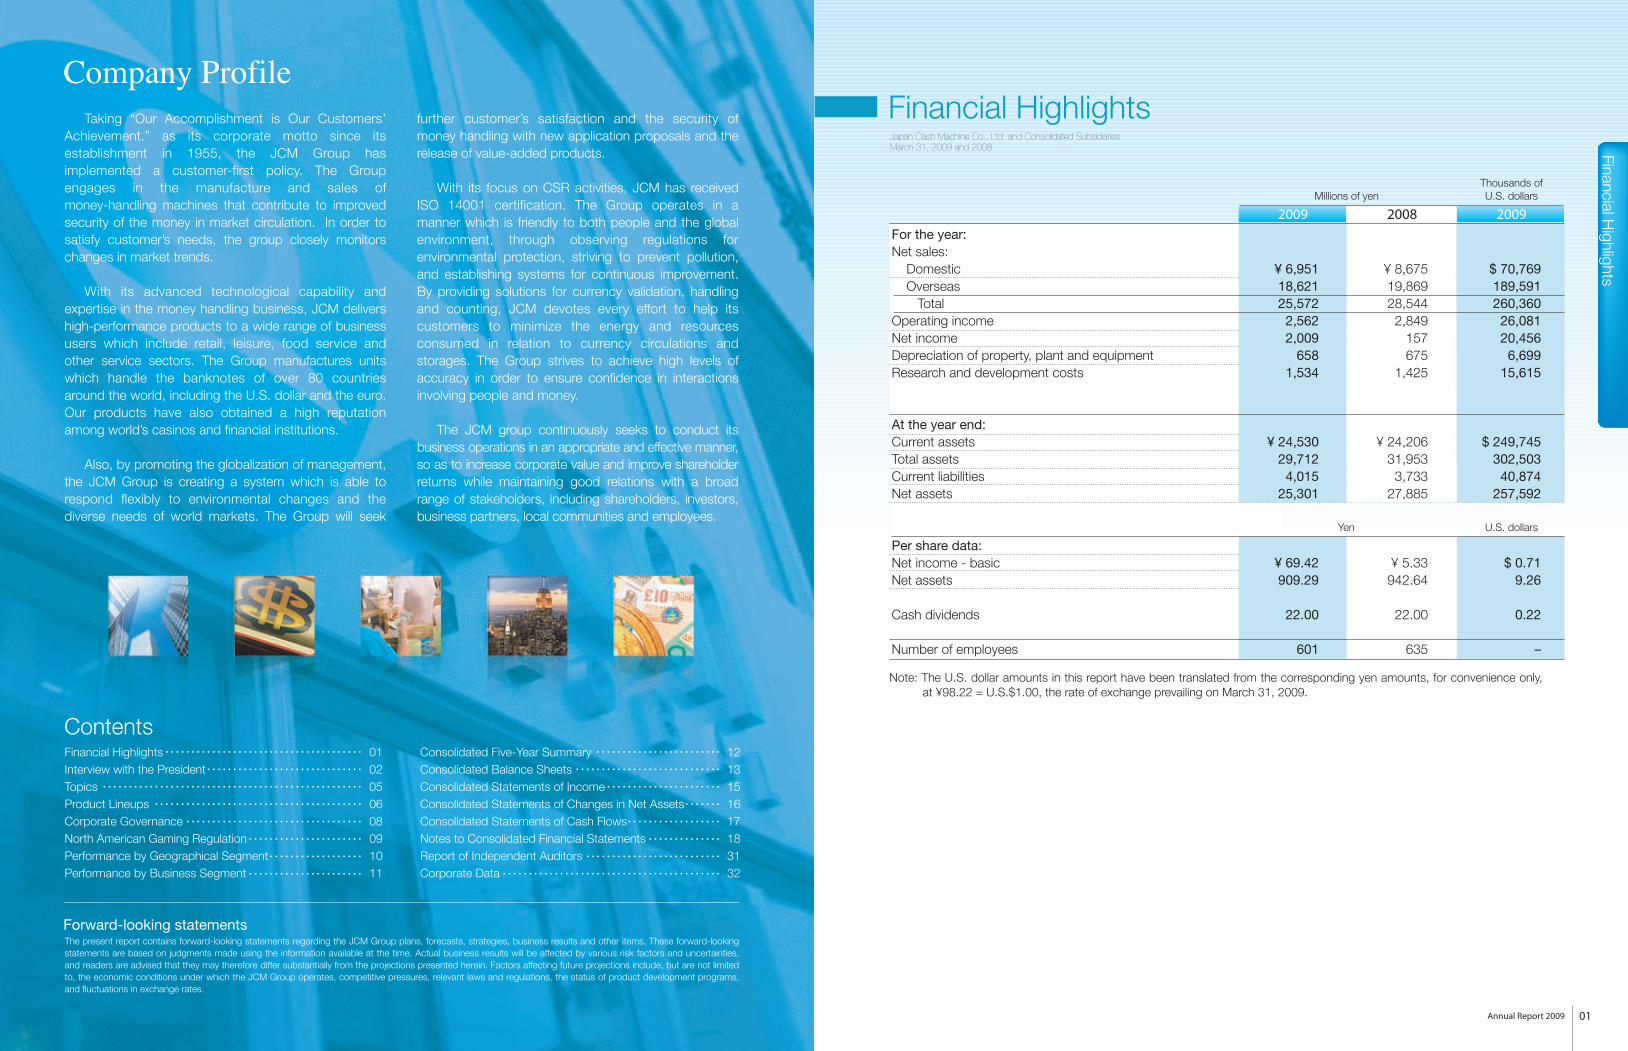
For the year:Net sales: Domestic Overseas TotalOperating incomeNet incomeDepreciation of property, plant and equipmentResearch and development costs
At the year end:Current assetsTotal assetsCurrent liabilitiesNet assets
Per share data:Net income - basicNet assets
Cash dividends
Number of employees
¥ 6,95118,62125,572
2,5622,009
6581,534
¥ 24,53029,712
4,01525,301
¥ 69.42 909.29
22.00
601
2009 2008 2009
¥ 8,67519,86928,544
2,849157675
1,425
¥ 24,206
31,9533,733
27,885
¥ 5.33 942.64
22.00
635
$ 70,769189,591260,360
26,08120,456
6,69915,615
$ 249,745
302,50340,874
257,592
$ 0.71 9.26
0.22
–
Millions of yenThousands ofU.S. dollars
Yen U.S. dollars
Note: The U.S. dollar amounts in this report have been translated from the corresponding yen amounts, for convenience only, at ¥98.22 = U.S.$1.00, the rate of exchange prevailing on March 31, 2009.
ContentsFinancial HighlightsInterview with the PresidentTopicsProduct LineupsCorporate GovernanceNorth American Gaming RegulationPerformance by Geographical SegmentPerformance by Business Segment
0102050608091011
Consolidated Five-Year SummaryConsolidated Balance SheetsConsolidated Statements of IncomeConsolidated Statements of Changes in Net AssetsConsolidated Statements of Cash FlowsNotes to Consolidated Financial StatementsReport of Independent AuditorsCorporate Data
1213151617183132
Taking “Our Accomplishment is Our Customers’ Achievement.” as its corporate motto since its establishment in 1955, the JCM Group has implemented a customer-first policy. The Group engages in the manufacture and sales of money-handling machines that contribute to improved security of the money in market circulation. In order to satisfy customer’s needs, the group closely monitors changes in market trends.
With its advanced technological capability and expertise in the money handling business, JCM delivers high-performance products to a wide range of business users which include retail, leisure, food service and other service sectors. The Group manufactures units which handle the banknotes of over 80 countries around the world, including the U.S. dollar and the euro. Our products have also obtained a high reputation among world’s casinos and financial institutions.
Also, by promoting the globalization of management, the JCM Group is creating a system which is able to respond flexibly to environmental changes and the diverse needs of world markets. The Group will seek
further customer’s satisfaction and the security of money handling with new application proposals and the release of value-added products.
With its focus on CSR activities, JCM has received ISO 14001 certification. The Group operates in a manner which is friendly to both people and the global environment, through observing regulations for environmental protection, striving to prevent pollution, and establishing systems for continuous improvement. By providing solutions for currency validation, handling and counting, JCM devotes every effort to help its customers to minimize the energy and resources consumed in relation to currency circulations and storages. The Group strives to achieve high levels of accuracy in order to ensure confidence in interactions involving people and money.
The JCM group continuously seeks to conduct its business operations in an appropriate and effective manner, so as to increase corporate value and improve shareholder returns while maintaining good relations with a broad range of stakeholders, including shareholders, investors, business partners, local communities and employees.
・・・・・・・・・・・・・・・・・・・・・・・・・・・・・・・・・・・・・・
・・・・・・・・・・・・・・・・・・・・・・・・・・・・・・
・・・・・・・・・・・・・・・・・・・・・・・・・・・・・・・・・・・・・・・・・・・・・・・・・・
・・・・・・・・・・・・・・・・・・・・・・・・・・・・・・・・・・
・・・・・・・・・・・・・・・・・・・・・・
・・・・・・・・・・・・・・・・・・・・・・・・・・・・・・・・・・・・・・・・
・・・・・・・・・・・・・・・・・・
・・・・・・・・・・・・・・・・・・・・・・
・・・・・・・・・・・・・・・・・・・・・・・・
・・・・・・・・・・・・・・・・・・・・・・・・・・・・
・・・・・・・・・・・・・・・・・・・・・・
・・・・・・・
・・・・・・・・・・・・・・・・・・
・・・・・・・・・・・・・・
・・・・・・・・・・・・・・・・・・・・・・・・・・
・・・・・・・・・・・・・・・・・・・・・・・・・・・・・・・・・・・・・・・・・・
Financial HighlightsJapan Cash Machine Co., Ltd. and Consolidated SubsidiariesMarch 31, 2009 and 2008
01Annual Report 2009
Financial Highlights
Impr
ovem
ent o
f pro
fitab
ility
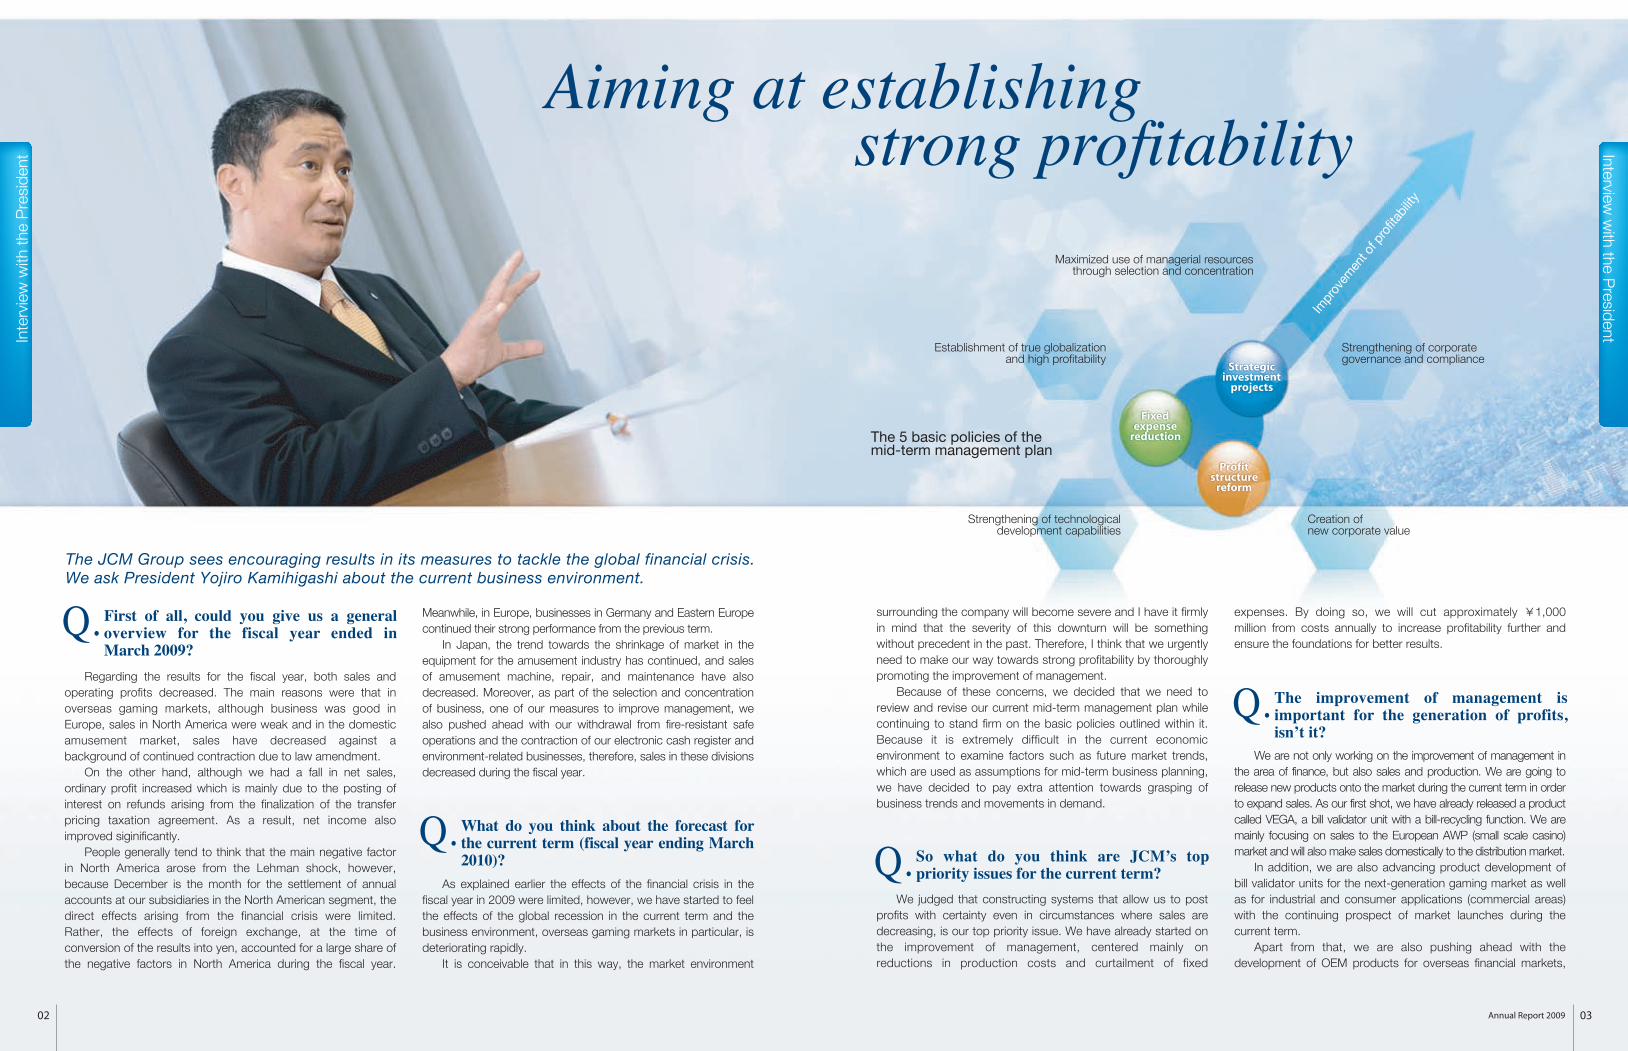
Strategicinvestment
projects
Fixedexpense
reduction
Profitstructure
reform
Maximized use of managerial resourcesthrough selection and concentration
Establishment of true globalizationand high profitability
Strengthening of technologicaldevelopment capabilities
Creation ofnew corporate value
Strengthening of corporategovernance and compliance
Aiming at establishingstrong profitability
First of all, could you give us a general overview for the fiscal year ended in March 2009?
Q.
What do you think about the forecast for the current term (fiscal year ending March 2010)?
Q.So what do you think are JCMʼs top priority issues for the current term?Q.
The improvement of management is important for the generation of profits, isnʼt it?
Q.
The JCM Group sees encouraging results in its measures to tackle the global financial crisis.We ask President Yojiro Kamihigashi about the current business environment.
Regarding the results for the fiscal year, both sales and operating profits decreased. The main reasons were that in overseas gaming markets, although business was good in Europe, sales in North America were weak and in the domestic amusement market, sales have decreased against a background of continued contraction due to law amendment.
On the other hand, although we had a fall in net sales, ordinary profit increased which is mainly due to the posting of interest on refunds arising from the finalization of the transfer pricing taxation agreement. As a result, net income also improved siginificantly.
People generally tend to think that the main negative factor in North America arose from the Lehman shock, however, because December is the month for the settlement of annual accounts at our subsidiaries in the North American segment, the direct effects arising from the financial crisis were limited. Rather, the effects of foreign exchange, at the time of conversion of the results into yen, accounted for a large share of the negative factors in North America during the fiscal year.
Meanwhile, in Europe, businesses in Germany and Eastern Europe continued their strong performance from the previous term.
In Japan, the trend towards the shrinkage of market in the equipment for the amusement industry has continued, and sales of amusement machine, repair, and maintenance have also decreased. Moreover, as part of the selection and concentration of business, one of our measures to improve management, we also pushed ahead with our withdrawal from fire-resistant safe operations and the contraction of our electronic cash register and environment-related businesses, therefore, sales in these divisions decreased during the fiscal year.
As explained earlier the effects of the financial crisis in the fiscal year in 2009 were limited, however, we have started to feel the effects of the global recession in the current term and the business environment, overseas gaming markets in particular, is deteriorating rapidly.
It is conceivable that in this way, the market environment
surrounding the company will become severe and I have it firmly in mind that the severity of this downturn will be something without precedent in the past. Therefore, I think that we urgently need to make our way towards strong profitability by thoroughly promoting the improvement of management.
Because of these concerns, we decided that we need to review and revise our current mid-term management plan while continuing to stand firm on the basic policies outlined within it. Because it is extremely difficult in the current economic environment to examine factors such as future market trends, which are used as assumptions for mid-term business planning, we have decided to pay extra attention towards grasping of business trends and movements in demand.
We judged that constructing systems that allow us to post profits with certainty even in circumstances where sales are decreasing, is our top priority issue. We have already started on the improvement of management, centered mainly on reductions in production costs and curtailment of fixed
expenses. By doing so, we will cut approximately ¥1,000 million from costs annually to increase profitability further and ensure the foundations for better results.
We are not only working on the improvement of management in the area of finance, but also sales and production. We are going to release new products onto the market during the current term in order to expand sales. As our first shot, we have already released a product called VEGA, a bill validator unit with a bill-recycling function. We are mainly focusing on sales to the European AWP (small scale casino) market and will also make sales domestically to the distribution market.
In addition, we are also advancing product development of bill validator units for the next-generation gaming market as well as for industrial and consumer applications (commercial areas) with the continuing prospect of market launches during the current term.
Apart from that, we are also pushing ahead with the development of OEM products for overseas financial markets,
The 5 basic policies of themid-term management plan
03Annual Report 200902
Interview w
ith the PresidentIn
terv
iew
with
the
Pre
side
nt

【 Name 】
【 Year of Birth 】
【 Birth Place 】
【 Work Record 】
Yojiro Kamihigashi
1959
Osaka, Japan
October 1984
June 1993
April 1997
April 2002
April 2006
June 2006
April 2007
Joined Japan Cash Machine Co., Ltd.
Director at Japan Cash Machine Co., Ltd.
Deputy General Manager of Sales Division
at Japan Cash Machine Co., Ltd.
General Manager of Overseas Sales Division
at Japan Cash Machine Co., Ltd.
General Manager of International Marketing &
Operations Division at Japan Cash Machine Co., Ltd.
Operating Officer at Japan Cash Machine Co., Ltd.
President at Japan Cash Machine Co., Ltd.
Yojiro KamihigashiPresident
June 25, 2009
Brief Personal History of the President
The New Product “VEGA”The next generation bill validator unit with bill-recycling function
JCM has launched VEGA, a bill validator unit able to handle a wide variety of applications, onto the market. This machine is a high value-added product, with features including a bill-recycling function, which is highly demand in the European AWP markets. The flexible configuration is one of VEGA’s advantage that allows it to be installed into various machines used in the markets, such as gaming, vending, and even retail.
With the release of VEGA, JCM will expand sales in UK and European amusement markets and seek for market shares in the South American and Asian markets in the future. JCM aims at making VEGA the global standard for bill validator units with bill-recycling functions.
Announcement on the verdict in the Nevada Federal District Court lawsuit
Reacquisition of JCM treasury stock
On January 2, 2009, the Nevada Federal District Court presented its judgement regarding the lawsuit that the JCM Group has continued to dispute since receiving notice in North America in 2005, ordering the payment of US$11,422,000 approximately ¥1 billion) by the US competitor to the JCM Group under the verdict of the trial by jury. It is possible that the competitor may appeal this verdict in the future.
JCM resolved to reacquire treasury stock at the meeting of the Board of Directors held on May 8, 2009.
In order to facilitate flexible fund management in respond to changes in the business environment
Establishment of JCM Systems Co., Ltd.
Please tell us about JCMʼs policy for returning profits to shareholders.Q.
Finally, could you give a message to JCM shareholders?Q.
JCM acquired a new subsidiary in the equipment for the amusement industry business, but what was the aim of that acquisition?
Q.
as a new business, and will line up bill validator units for ATMs, automatic vending machines, ticket machines and the likes during the current term. In addition, we will expand our business in the commercial market.
While advancing defensive reinforcement steadily such as management improvement in the area of finance, we think that it is of strategic importance to be positive in promoting investment projects aimed at the expansion of profitability. This includes new business development, corporate acquisitions and alliances, and the strengthening of our sales and development bases in the Kanto region in Japan. We are confident that these activities will lead to achievement of the basic policy in the mid-term management plan.
This acquisition was carried out to shore up the company’s interests in the equipment for the amusement industry area, where results have stagnated in recent years. We think that enhancing our product composition is essential in order to ensure solid earnings, and acquiring a company specializing in Pachinko machine peripheral equipment will bring about a significant expansion of our product line-up as well as makes our business more efficient. As a result, we will be able to secure an edge in the amusement industry.
We have made our basic policy in regard to term-end dividends to have a consolidated dividend payout ratio of at
least 30% and paid a dividend of ¥11 per share (annual total of ¥22 per share). We will continue to make returns to shareholders for the fiscal year 2010 onwards in accordance with this basic policy.
On the other hand, we decided to abolish the shareholder special benefit plan, which we have operated until the fiscal year 2009. After a careful investigation of this system from various angles, we decided to unify all shareholder benefits in cash dividends based on our policy of returning profits to shareholders.
Also, in addition to treasury stock acquired during the fiscal year 2009 (a total value of ¥1,487 million/about 6% of shares issued), new acquisition funds of ¥1,000 million have been approved, and we will continue to push ahead with such purchases. We will continue to hold the treasury stock and will use them effectively as a resource in order to execute flexible capital measures such as stock exchanges during M&A as required.
We anticipate that the market environment surrounding the JCM Group in the current term, will be severe. We will continue to work positively on the improvement of management mainly in terms of finance, and also in the areas of sales and production as I stated.
We will listen to the voices of all stakeholders and whatever difficulties we face, we will promote management activities with a serious attitude. Furthermore, in order to increase profitability and contribute to the return of profits to shareholders, we intend to realize the importance of a stable, long-term growth and further improvement of corporate value.
I sincerely appreciate the ongoing support and encouragement from all shareholders.
Topics
Reason for reacquisition:
Common shares of JCMType of shares to be reacquired:
Up to 1 million common shares of JCM
(A proportion of 3.59% of the total number of shares issued [excluding treasury stock])
Total number of shares that may be reacquired:
Up to ¥1 billionTotal cost of the shares to be reacquired:
From May 12, 2009 to September 30, 2009 (trade date base)Reacquisition period:
Reacquisition on the Osaka Stock Exchange through a trust bank
Method of reacquisition:
Pachislot markets have seen significant changes in gaming element since the revision of “Ordinance for Enforcement of the Act on Control and Improvement of Amusement Business, etc.” in 2004. There has been a sharp decrease in models which are received well by halls and users, and the management environment for the equipment for the amusement industry business has reached a turning point. There has been a 30% drop in the number of units on the market for pachislot since 2006.
Meanwhile, there has been a healthy growth in the market of pachinko equipment as the development and supply of products with various kinds of gaming elements are now feasible. JCM judged that in such a market environment, enhancing the product mix was
an urgent task in order to secure profits in this business and therefore, acquired 100% interest in Sammy Systems Corporation, which excels at peripherial equipment for pachinko and renamed it as JCM Systems Co., Ltd. In July, JCM will spin off the equipment for the amusement industry business, allowing JCM Systems Co., Ltd. to take it over, and also will merge JCM Techno Support Corporation, a company providing a repair and maintenance service, with JCM Systems Co., Ltd.
JCM aims to acquire new orders by realizing the enhancement of the product lineup and efficient business management and also, by improved quality of sales and services and market competitiveness.
05Annual Report 200904
TopicsIn
terv
iew
with
the
Pre
side
nt

Transportationtechnology
Validationtechnology
UBA-SS
UBA ICB&RW TOOL
UBA-Seriesbill validators
The UBA series is the company’s core products in the gaming market, and the series can handle the banknotes of more than 80 countries around the world. It has the unique JCM technology such as strong anti-pull back function and an optional ICB (Intelligent Cash Box) function.
DBV-301/RC-10
The DBV-301/RC-10 is mainly installed in automatic vending machines. In combination with RC-10 recycling unit, it is possible to store temporarily a maximum of 10 banknotes and pay them out as required.
The Vega is a bill validator unit with a bill-recycling function (option) for wide variety use.Its flexible configurations allow it to be installed into various applications used in gaming, vending, and even retail markets.It is mainly designed for the European AWP markets, and is also expected to expand sales in South American and Asian markets as well as the domestic retail market.
bill validator
UBC-10
The UBC-10 is a counterfeit detector specialized in financial institutions able to handle multiple types of currency and accept up to 30 banknotes. In addition to standard US$, users can also add euro and Chinese Yuan validating functions optionally.
bill validator
VEGAbill validator
CT-20
The CT-20 is a small-sized coin change machine that calculates and pays change automatically. The CT-20 is characterized by its compact size and a high speed dispensing function, adopted by businesses such as fast food shops, etc.
small-sized coin change machine
SR-7000
The SR-7000 is a token supply and collection system for pachinko and slot machines. The system is even equipped with an automatic token cleaning function in its collection and supply process, also making it useful for laborsaving at pachinko parlors.
A ball lender system compatible with the “i-Clear System” that realizes transparent, healthy and clean pachinko hall management with cutting edge security technology. This unit enables immediate responses to user needs, allowing full control of lending balls.
automatic token supply and collection system
AD-Series
The AD series is a standard bill recycling unit for commercial market. These devices are installed in equipment, such as ATMs, automatic vending machines and fare adjustment machines that require the payment of change in banknotes.
bill recycler
TM-Series
The TM series are installed at retailers such as restaurants, supermarkets and home centers and at other business places that handle cash. The series is the centerpiece of money management systems overseeing multiple shops, including cash receipt and automatic settlement, storage in cash boxes and also cash collection work based on tie-ups with cash transport companies.
automatic payment machine
The PUB-7 is mainly sold in the European gaming market (AWP) as a low cost bill validator. It has a strong anti-pull back function with drum type transport mechanism, and the bezel is equipped with full color LED, appealing more players.
bill validator
AD-XAD-1-4
TM-35S
TM-70
PUB-7 (TAIKO)
Ball lender systemSH10000CT
JCM Core Technology
infinite potential to JCM products.and transportation technology gives
The fusion of bill validation technology
07Annual Report 200906
Product LineupsP
rodu
ct L
ineu
ps

Shareholders’ Meeting
Corporate Planning Dept
Appointment/DismissalReport
Executive Committee
Presentation ofpolicy guidanceReport
Direction Report
Direction
Direction
Direction
Support
Report
Appointment/Dismissal
Report/Coordination
Appointment/Dismissal
Appointment/DismissalOversight
Examine performanceof the duty
Internal ControlOver FinancialReporting
InternalControl
Examineperformanceof their duties
Appointment/DismissalDirection/Oversight
Management/Operation
Report
Presentation of
policy guidance
Examine performance of their duties
Agreement of appointmentand reappointment
Board of Corporate Auditors
Board of Directors7 board members
4 corporate auditors
(Deliberation of important matters)
Risk Managem
ent Comm
ittee
Internal Control C
omm
ittee
Com
pliance Com
mittee
Environm
ent Com
mittee
President
Each division/Each subsidiary
Global Meeting
Board of Operating Officer
AccountingAuditors
Corporate Governance North American Gaming Regulation
Acquisition of Gaming Licenses
Jurisdictions whereJCM group has a gaming license
Gaming Jurisdictions where JCM groupdoes not do business directly or doesbusiness but does not require a license
Jurisdictions wheregaming is not authorized
In casinos and the gaming industry strict legal regulations are imposed on casino management and the manufacture and sales of gaming machines to ensure that persons unconnected with criminal organizations operate honestly using bona fide gaming machines and components. These legal regulations not only require that authorization be obtained from the appropriate authority to sell bill validation units fitted to gaming machines, but in most US states and jurisdictions bill validation units are also regarded as a type of gaming machine, and their testing, approval, and sale requires the same authorization as that for gaming machines themselves. For this reason, the JCM group has not only swiftly obtained authorization for sales of bill validation units when this is required, but also responded in a timely fashion when the regulations governing slot machines and other gaming machines have changed even if bill validation units are not themselves subject to regulation. The company has never been denied a license, nor has one ever been suspended or revoked.
When obtaining gaming licenses, not only the JCM group itself but also its individual directors undergo rigorous screening procedures. At present the JCM group holds over 140 gaming licenses in North America. In the future the company will not only renew its existing licenses but also obtain the new ones required for manufacturing and sales of its products where market potential and revenue justify the costs of such new or renewal process.
North American Gaming Regulation
Improving corporate governance and compliance are important foundation stones for the company to achieve healthy development. Since the foundation of the company, we have built a corporate culture trusted by society by making these foundations rock-solid.
Without the improvement of corporate governance, we cannot obtain and maintain the trust of stakeholders. Important management decisions have been taken at the company through meetings of the Board of Directors, and we have enabled speedy decision-making and appropriate management judgement by keeping the composition of the board to the minimum size required. In addition, JCM has an Executive Committee made up mainly of the president and executive directors as part of a governance system unique to the company. By reviewing important projects in advance of meetings of the Board of Directors, JCM has established a system that allows more appropriate business judgement.
The corporate auditors conduct audits of the execution of the work of directors and the legality of business operations, etc, as work entrusted by the shareholders, and this post is positioned as one that contributes to the healthy development
of the company. The outside corporate auditors conduct audits of the execution of the work of directors of course, and use their specialist knowledge to take on the role of objective checking of the company’s management from a variety of angles. In addition, JCM introduced an operating officer system since 2006 and by dividing responsibility for “management/oversight” and “operation,” we have brought about the clarification of executive responsibility.
On the other hand, there already exists proof of sound management at the company based on its sophisticated compliance system. That is that the company has acquired a great many strictly reviewed gaming licenses in the North American casino market. This is evaluated frequently in the industry, but we are not becoming complacent in this regard. We are planning the improvement of compliance on an everyday work level including the establishment and diffusion of a “JCM Code of Conduct for the Observance of Laws” and educational activities for each place of business.
In addition, we have established internal control system in each division of the company and at subsidiary companies in Japan and overseas to maintain the reliability of financial reports according to J-Sox.
Corporate Auditors’ Office
WA
OR
CA
NV
UT
AZ
ID
MT
WY
CO
NM
AK
HI
TX
OK
KS
NE
SD
ND
MN
IA
MO
AR
LA
MS AL GA
FL
SC
TN
KYNC
VAWV
OHIN
MI
IL
WI
PA
NY
NH
MA
RICT
NJDEDC
MD
VT ME
The JCM group holds
gaming licenses in North America140 over
Internal Control Group Internal Audit Group
North A
merican G
aming R
egulationC
orpo
rate
Gov
erna
nce
09Annual Report 200908

Business development in America, Europe and Asia
Performance by Geographical Segment Performance by Business Segment
Japan North America Europe Asia
Years ended March 31
Money-handling machines Electronic cash registers Equipment forthe amusement industry
Other products
Years ended March 31
Change in Net Sales Composition(Millions of yen)
35,000
30,000
25,000
20,000
15,000
10,000
5,000
'07 '09'08
Japan
Europe
North America
Asia
Money-Handling Machines Equipment for the Amusement Industry
Other Products
International Gaming Market
2009 Net Sales Composition
0.4%
36.0%27.3%
36.3%
2009 Net Sales Composition
3.0%
15.8%
81.2%
31,785
28,544
25,572
Change in Net Sales Composition(Millions of yen)
35,000
30,000
25,000
20,000
15,000
10,000
5,000
'07 '09'08
31,785
28,544
25,572
In the overseas market, exports to Europe grew and sales increased. Meanwhile, in the domestic amusement industry, although sales of facilities and equipment continued at about the same level as the previous term, pachislot machines and maintenance sales decreased, causing the sales decline in this segment. On the other hand, because exports to Europe, where JCM has a comparatively high profit margin, increased, the profits increased in this segment.
To focus on profitability, JCM worked positively during the fiscal year in 2009 on measures such as focusing more on R&D, reducing market quality maintenance costs by improving product quality, and reducing human resource costs by encouraging employees to apply for the early retirement program, etc.
In the North American gaming market, the effects of the economic downturn were limited because the accounting period of JCM overseas subsidiaries ends on December 31. On a local currency basis, both sales and profits have maintained the same level as the previous term, however, as the average exchange rate applied during the fiscal year for conversion into Japanese yen was about 15 yen per dollar higher than the previous term, both sales and profits reduced.
The amusement market has continued to scale down, but signs of recovery become apparent. The managements’ attitude towards investment at pachinko halls becomes more positive. However, as the attitude of financial institutions towards investment continued to remain cautious, facility investment by pachinko halls was weak. As for the pachislot machine area that JCM particularly specializes in, the preferences of amusement customers have tended to concentrate on pachinko machines since the revision of the amusement machine regulations, and the market continues to remain in a severe condition. Under such circumstances, the group sold products and services taking into consideration the environmental and hygiene issues, and also made efforts to expand its product mix.
JCM withdrew from the fire-resistant safe business as of September 30, 2008. As for hygiene and environment-related equipment operations, JCM liquidated its subsidiary and consolidated their activities as one of its divisions, aiming to achieve synergy in combination with the business of equipment for the amusement industry. JCM also pushed ahead with the reorganization of its electronic cash register business, including withdrawal from the low-profit POS area, and focused on sales of low-cost equipment such as ECRs.
In the international gaming market, the business environment continued to be severe in North America. The casino hotel investments continued to diminish due to the impact of high commodity prices, etc., from the beginning of the term. It caused a decrease in sales of the group’s bill validator units. Meanwhile, the effects of the economic downturn since last fall were limited because the accounting period of JCM overseas subsidiaries ends on December 31.
International Commercial MarketIn the European gaming market, demand from
Germany and Eastern Europe continued to be strong as in the previous term, and sales of the group’s bill validator units also increased. The rapid appreciation of the Japanese yen since last fall caused sales reductions in comparison to the previous term in both North America and Europe on a yen basis.
Japanese MarketIn the domestic distribution market, JCM mainly
focused on sales activities to OEM customers.
*JCM has scaled down its business on “electronic cash registers”. Because the impact on results of this business is minor, it is included under “Other products”.
JCM mainly manufactures currency handling equipment and amusement industry equipment in Asia, where the group’s overseas production base is located. While sales of products to overseas markets increased during the fiscal year, the cost of materials from Japan increased as a result of the weak-dollar, strong-yen situation, along with other factors, resulted in the deterioration of the cost ratio. On the other hand, the impacts of increasing labor costs and high raw material costs in China were limited during this term. As a result, sales increased while profits decreased in this segment.
In the European segment, there were negative effects on currency conversion due to the high value of Japanese yen, but orders from the gaming markets of Germany and Eastern Europe continued to perform strongly from the previous term, both sales and profits increased.
Perform
ance by Business S
egment
Per
form
ance
by
Geo
grap
hica
l Seg
men
t
11Annual Report 200910

For the year:
Net sales
Money-handling machines
Electronic cash registers
Equipment for the amusement industry
Other
Gross profit
Operating income
Net income
Cash flows from operating activities
Cash flows from investing activities
Cash flows from financing activities
Cash and cash equivalents at end of year
At the year end:
Total assets
Net assets
Return on equity (%)
Number of employees
¥25,572
20,760
—
4,029
783
12,429
2,562
2,009
4,317
215
(2,136)
12,559
¥29,712
25,301
7.6
601
2009
¥28,544
21,768
338
5,501
937
13,367
2,849
157
3,912
(995)
(696)
11,469
¥31,953
27,885
0.6
635
2008
¥31,785
22,112
510
8,075
1,088
14,602
3,432
1,759
1,780
(1,760)
(947)
9,526
¥35,295
28,510
6.3
653
2007
¥32,595
18,341
526
12,540
1,188
15,184
4,824
2,969
2,370
(2,617)
(1,417)
10,242
¥34,947
27,487
11.3
606
2006
¥37,947
23,993
718
12,160
1,076
18,412
8,644
4,984
3,169
(1,976)
(899)
11,621
¥32,876
25,020
21.8
582
2005
$260,360
211,367
—
41,025
7,968
126,543
26,081
20,456
43,957
2,188
(21,752)
127,868
$302,503
257,592
—
—
2009
Millions of yenThousands ofU.S. dollars
Consolidated Five-Year SummaryJapan Cash Machine Co., Ltd. and Consolidated Subsidiaries Japan Cash Machine Co., Ltd. and Consolidated Subsidiaries
March 31, 2009 and 2008
Assets
Current assets:
Cash and deposits (Note 14)
Trade receivables:
Notes
Accounts
Securities (Note 6)
Inventories (Note 5)
Deferred income taxes (Note 8)
Income taxes refundable
Prepaid expenses and other current assets
Less allowance for doubtful accounts
Total current assets
Property, plant and equipment, at cost:
Land
Buildings and structures
Machinery and equipment
Less accumulated depreciation
Property, plant and equipment, net
Investments and other assets:
Investments in securities (Note 6)
Investment in an unconsolidated subsidiary
Deferred income taxes (Note 8)
Long-term loans receivable
Other
Less allowance for doubtful accounts
Total investments and other assets
Total assets
¥ 12,559
679
2,751
3,430
192
5,327
866
1,737
520
(101)
24,530
663
2,664
5,049
8,376
(5,670)
2,706
875
16
210
33
1,629
(287)
2,476
¥ 29,712
2009
¥ 11,469
833
3,116
3,949
1,347
6,013
677
161
687
(97)
24,206
790
2,821
4,933
8,544
(5,469)
3,075
1,026
16
357
1
3,612
(340)
4,672
¥ 31,953
2008
$ 127,868
6,918
28,006
34,924
1,953
54,238
8,815
17,680
5,291
(1,024)
249,745
6,750
27,121
51,406
85,277
(57,723)
27,554
8,909
165
2,138
332
16,589
(2,929)
25,204
$ 302,503
2009
Millions of yen
Thousands ofU.S. dollars
(Note 4)
Consolidated Balance Sheets
Net Sales(Millions of yen)
40,000
35,000
30,000
25,000
20,000
15,000
10,000
5,000
0’05 ’06
37,947
’07
32,595
’08
31,785
’09
25,572
28,544
Net Income(Millions of yen)
5,000
4,000
3,000
2,000
1,000
0’05 ’06
4,984
’07
2,969
’08
1,759
’09
2,009
157
Total Assets(Millions of yen)
40,000
35,000
30,000
25,000
20,000
15,000
10,000
5,000
0
32,87634,947 35,295
’05 ’06 ’07 ’08 ’09
29,71231,953
Net Assets and ROE(Millions of yen) (%)
30,000
25,000
20,000
15,000
10,000
5,000
0
35
30
25
20
15
10
0
Net AssetsROE
25,020
28,510
25,301
27,885
0.60.6
7.67.6
’05 ’06 ’08 ’09’07
27,487
11.311.3
21.821.8
6.36.3
13Annual Report 200912
FINANCIAL SECTIONFINANCIAL SECTION

15Annual Report 200914
Liabilities and Net Assets
Current liabilities:
Trade payables:
Notes
Accounts
Accrued income taxes (Note 8)
Accrued bonuses for employees
Accrued bonuses for directors and corporate auditors
Allowance for loss on liquidation of a subsidiary
Other current liabilities
Total current liabilities
Long-term liabilities:
Accrued retirement benefits for employees (Note 7)
Deferred income taxes (Note 8)
Other
Total long-term liabilities
Contingent liabilities (Note 13)
Net assets:
Shareholders’ equity (Note 9):
Common stock:
Authorized – 118,000,000 shares
Issued – 29,662,851 shares in 2009 and 2008
Capital surplus
Retained earnings (Note 17)
Less treasury stock, at cost :
1,838,039 shares in 2009 and 80,827 shares in 2008
Total shareholders’ equity
Valuation and translation adjustments:
Net unrealized holding gain on securities
Net deferred (losses) gains on hedges
Translation adjustments
Total valuation and translation adjustments
Total net assets
Total liabilities and net assets
¥ 15
1,863
1,878
278
346
26
—
1,487
4,015
161
18
217
396
2,217
2,069
24,307
(1,600)
26,993
166
(21)
(1,837)
(1,692)
25,301
¥ 29,712
2009
¥ 11
1,839
1,850
70
238
—
71
1,504
3,733
20
29
286
335
2,217
2,069
22,846
(112)
27,020
273
90
502
865
27,885
¥ 31,953
2008
$ 150
18,973
19,123
2,829
3,528
260
—
15,134
40,874
1,640
181
2,216
4,037
22,571
21,065
247,479
(16,288)
274,827
1,686
(216)
(18,705)
(17,235)
257,592
$ 302,503
2009
Millions of yen
Thousands ofU.S. dollars
(Note 4)
Japan Cash Machine Co., Ltd. and Consolidated SubsidiariesMarch 31, 2009 and 2008
Consolidated Balance SheetsJapan Cash Machine Co., Ltd. and Consolidated SubsidiariesYears ended March 31, 2009 and 2008
Net sales (Note 16)
Cost of sales (Note 11)
Gross profit on sales
Realized gross profit on installment sales
Gross profit
Selling, general and administrative expenses (Note 11)
Operating income (Note 16)
Other income:
Interest and dividend income
Reversal of allowance for doubtful accounts
Interest on tax refund
Gain on settlement of bad debt
Other
Other expenses:
Interest expense
Foreign exchange loss
Loss on disposal of property, plant and equipment
Loss on devaluation of investments in securities
Impairment loss (Note 12)
Bad debt loss
Provision for allowance for doubtful accounts
Loss on liquidation of a subsidiary
Other
Income before income taxes
Income taxes (Note 8):
Current
Prior years
Deferred
Net income
¥ 25,572
13,166
12,406
23
12,429
9,867
2,562
182
50
434
42
133
841
0
245
64
94
—
—
—
—
64
467
2,936
812
75
40
¥ 2,009
2009
¥ 28,544
15,193
13,351
16
13,367
10,518
2,849
215
18
9
—
126
368
3
299
73
318
10
831
88
71
27
1,720
1,497
723
(157)
774
¥ 157
2008
$ 260,360
134,051
126,309
234
126,543
100,462
26,081
1,858
509
4,416
423
1,358
8,564
1
2,495
651
962
—
—
—
—
651
4,760
29,885
8,262
764
403
$ 20,456
2009
Millions of yen
Thousands ofU.S. dollars
(Note 4)
Consolidated Statements of Income
FINANCIAL SECTIONFINANCIAL SECTION

FINANCIAL SECTIONFINANCIAL SECTION
17Annual Report 200916
Japan Cash Machine Co., Ltd. and Consolidated SubsidiariesYears ended March 31, 2009 and 2008
Operating activities:Income before income taxes Adjustments to reconcile income before income taxes to net cash provided by operating activities: Depreciation and amortization Impairment loss Bad debt loss (Reversal of) Provision for loss on liquidation of a subsidiary Provision for (Reversal of) allowances and accruals Interest and dividend income Interest expense Foreign exchange loss, net Gain on sales of investments in securities Loss on devaluation of investments in securities Other Changes in operating assets and liabilities: Trade receivables Inventories Trade payables Consumption taxes receivable Other operating assets and liabilities Subtotal Interest and dividends received Interest paid Income taxes paidRefund of income taxes paid in previous years Net cash provided by operating activities
Investing activities:Purchases of property, plant and equipment Proceeds from sales of property, plant and equipment Sales (Purchases) of securitiesPurchases of investments in securities Proceeds from sales of investments in securities Purchases of other assets Payment for long-term loans receivableOther Net cash provided by (used in) investing activities
Financing activities:Decrease in short-term bank loans, netPurchases of treasury stockProceeds from sales of treasury stockCash dividends paid Net cash used in financing activities Effect of exchange rate changes on cash and cash equivalents Net increase in cash and cash equivalents Cash and cash equivalents at beginning of year Cash and cash equivalents at end of year (Note 14)
2009 2008 2009
Millions of yen
Thousands ofU.S. dollars
(Note 4)
Consolidated Statements of Cash FlowsJapan Cash Machine Co., Ltd. and Consolidated SubsidiariesYears ended March 31, 2009 and 2008
Balance at March 31, 2007 Net income for the year ended March 31, 2008 Cash dividends Sales of treasury stock Increase in treasury stock Net unrealized holding loss on securities Deferred gains on hedges Translation adjustments Balance at March 31, 2008 Net income for the year ended March 31, 2009 Cash dividends Sales of treasury stock Increase in treasury stock Net unrealized holding loss on securities Deferred losses on hedges Translation adjustments Effect of changes in accounting policies applied to an overseas consolidated subsidiaryBalance at March 31, 2009
Millions of yen
¥ 28,510
157
(621)
1
(2)
(76)
90
(174)
¥ 27,885
2,009
(646)
0
(1,488)
(107)
(111)
(2,339)
98
¥ 25,301
Total netassets
¥ 676
—
—
—
—
—
—
(174)
¥ 502
—
—
—
—
—
—
(2,339)
—
¥ (1,837)
Translationadjustments
—
—
—
—
—
—
90
—
¥ 90
—
—
—
—
—
(111)
—
—
¥ (21)
Netdeferred
gains (losses)on hedges
¥ 23,310
157
(621)
—
—
—
—
—
¥ 22,846
2,009
(646)
—
—
—
—
—
98
¥ 24,307
Retainedearnings
¥ (111)
—
—
1
(2)
—
—
—
¥ (112)
—
—
0
(1,488)
—
—
—
—
¥ (1,600)
Treasurystock, at
cost
¥ 27,485
157
(621)
1
(2)
—
—
—
¥ 27,020
2,009
(646)
0
(1,488)
—
—
—
98
¥ 26,993
Totalshareholders’
equity
¥ 349
—
—
—
—
(76)
—
—
¥ 273
—
—
—
—
(107)
—
—
—
¥ 166
Net unrealizedholdinggain on
securities
¥ 2,069
—
—
(0)
—
—
—
—
¥ 2,069
—
—
(0)
—
—
—
—
—
¥ 2,069
Capitalsurplus
¥ 2,217
—
—
—
—
—
—
—
¥ 2,217
—
—
—
—
—
—
—
—
¥ 2,217
Commonstock
29,662,851
—
—
—
—
—
—
—
29,662,851
—
—
—
—
—
—
—
—
29,662,851
Number ofshares in issue
Consolidated Statements of Changes in Net Assets
Balance at March 31, 2008 Net income for the year ended March 31, 2009 Cash dividends Sales of treasury stock Increase in treasury stock Net unrealized holding loss on securities Deferred losses on hedges Translation adjustments Effect of changes in accounting policies applied to an overseas consolidated subsidiaryBalance at March 31, 2009
Thousands of U.S. dollars (Note 4)
$ 283,906
20,456
(6,582)
2
(15,155)
(1,087)
(1,133)
(23,817)
1,002
$ 257,592
Total netassets
$ 5,112
—
—
—
—
—
—
(23,817)
—
$ (18,705)
Translationadjustments
$ 917
—
—
—
—
—
(1,133)
—
—
$ (216)
Netdeferred
gains (losses)on hedges
$ 232,603
20,456
(6,582)
—
—
—
—
—
1,002
$ 247,479
Retainedearnings
$ (1,136)
—
—
3
(15,155)
—
—
—
—
$ (16,288)
Treasurystock, at
cost
$ 275,104
20,456
(6,582)
2
(15,155)
—
—
—
1,002
$ 274,827
Totalshareholders’
equity
$ 2,773
—
—
—
—
(1,087)
—
—
—
$ 1,686
Net unrealizedholdinggain on
securities
$ 21,066
—
—
(1)
—
—
—
—
—
$ 21,065
Capitalsurplus
$ 22,571
—
—
—
—
—
—
—
—
$ 22,571
Commonstock
29,662,851
—
—
—
—
—
—
—
—
29,662,851
Number ofshares in issue
¥ 2,936
934——
(71)272
(597)0
131—9463
193(391)916107
(110)4,477
198(0)
(518)160
4,317
(572)11
978(107)
—(63)(30)
(2)¥ 215
¥ —(1,488)
0(648)
(2,136)(1,306)1,090
11,469¥ 12,559
¥ 1,497
87510
83171
(461)(215)
3236(13)318
73
1,2911,470
(1,745)54
3474,642
206(3)
(1,067)134
3,912
(615)2
(56)—22
(340)—(8)
¥ (995)
¥ (75)(2)1
(620)(696)(278)
1,9439,526
¥ 11,469
$ 29,885
9,507——
(725)2,772
(6,076)1
1,331—
961640
1,966(3,984)9,3291,095
(1,115)45,5872,016
(1)(5,273)1,628
43,957
(5,825)116
9,959(1,094)
—(640)(305)(23)
$ 2,188
$ —
(15,155)2
(6,599)(21,752)(13,295)11,098
116,770 $ 127,868

FINANCIAL SECTIONFINANCIAL SECTION
19Annual Report 200918
Japan Cash Machine Co., Ltd. and Consolidated SubsidiariesYears ended March 31, 2009 and 2008
Notes to Consolidated Financial Statements
1. Basis of Preparation of Consolidated Financial Statements
2. Summary of Significant Accounting Policies
Japan Cash Machine Co., Ltd. (the “Company”) and its domestic subsidiaries maintain their accounts and records in accordance with accounting principles generally accepted in Japan. Its overseas subsidiaries maintain their accounts in conformity with the requirements of their respective countries of domicile.
The accompanying consolidated financial statements of the Company and its consolidated subsidiaries are prepared on the basis of accounting principles generally accepted in Japan, which are different in certain respects as to the application and disclosure requirements of International Financial Reporting Standards, and are compiled from the consolidated financial statements prepared by the Company as required
by the Financial Instruments and Exchange Act of Japan. In preparing the accompanying consolidated financial statements,
certain reclassifications and rearrangements have been made to present them in a form which is familiar to readers outside Japan. However, no adjustments have been made which would change the financial position or the results of operations as presented in the original consolidated financial statements.
A reclassification of previously reported amount has been made to conform the consolidated financial statements for the year ended March 31, 2008 to the 2009 presentation. Such reclassification had no effect on consolidated net income or net assets.
The accompanying consolidated financial statements include the accounts of the Company and its significant subsidiaries. All significant intercompany items have been eliminated in consolidation. All assets and liabilities of the subsidiaries are revalued at fair value on acquisition, if applicable.
The overseas consolidated subsidiaries are consolidated on the basis of fiscal periods ending December 31, which differs from the balance sheet date of the Company. As a result, adjustments have been made for any significant intercompany transactions which took place during the period between the year end of these overseas consolidated subsidiaries and that of the Company.
Investment in an unconsolidated subsidiary is carried at cost.
Foreign currency transactionsAll monetary assets and liabilities denominated in foreign currencies are
translated into yen at the rates of exchange in effect at the balance sheet date, except that receivables and payables hedged by qualified forward foreign exchange contracts are translated at the corresponding contract rates. All other assets and liabilities denominated in foreign currencies are translated at their historical rates. Revenue and expense items arising from transactions denominated in foreign currencies are generally translated into yen at the exchange rates in effect at the respective transaction dates. Gain or loss on the transactions is credited or charged to income in the period in which such gain or loss is recognized for financial reporting purposes.
Financial statements of overseas consolidated subsidiariesThe financial statements of the overseas consolidated subsidiaries
are translated into yen at the rates of exchange in effect at the balance sheet date, except that the revenue and expense accounts are translated at the average exchange rates in effect during the fiscal year and the components of net assets are translated at their historical rates. Differences resulting from translating the financial statements of the overseas consolidated subsidiaries are not included in the determination of net income, but are presented as translation adjustments in a component of net assets in the accompanying consolidated balance sheets.
Cash and cash equivalents include cash on hand and in banks and
other highly liquid investments with maturities of three months or less when purchased.
Inventories of the Company and its domestic consolidated subsidiaries are stated at the lower of cost or net selling value determined by the first-in, first-out method. Inventories of the overseas consolidated subsidiaries are stated at the lower of cost or market, the cost of inventories at JCM American Corporation and JCM Gold USA, Inc. being determined by the first-in, first-out method, and the cost of inventories at Japan Cash Machine Germany GmbH, JCM Gold (HK) Ltd. and JCM United Kingdom Ltd. being determined by the moving-average method.
Securities are classified into three categories: trading securities, held-to-maturity debt securities, and other securities. Trading securities are stated at fair value. Gain or loss, both realized and unrealized, are credited or charged to income. Held-to-maturity debt securities are stated at amortized cost. Marketable securities classified as other securities are carried at fair value with any changes in unrealized holding gain or loss, net of the applicable income taxes, included directly in net assets. Non-marketable securities classified as other securities are carried at cost. Cost of securities sold is determined by the moving-average method.
Derivative financial instruments are utilized by the Company principally in order to manage certain risks arising from adverse fluctuation in foreign currency exchange rates. The Company has established a control environment which includes policies and procedures for risk assessment, and for the approval, reporting and monitoring of transactions involving derivatives. The Company does not hold or issue derivatives for speculative trading purposes.
The Company is exposed to certain market risk arising from its forward foreign exchange contracts. The Company is also exposed to the risk of credit loss in the event of non-performance by the counterparties to these contracts; however, the Company does not anticipate non-performance by any of these counterparties, all of whom are financial institutions with high credit ratings.
Derivatives are carried at fair value with any changes in unrealized gain or loss charged or credited to income, except for those which meet the criteria for deferral hedge accounting under which unrealized gain or loss is deferred as an asset or a liability.
Property, plant and equipment is stated on the basis of cost. The Company calculates depreciation principally by the declining-balance method based on the estimated useful lives of the respective assets and the respective residual value determined by the Company and its domestic subsidiaries, except for buildings (exclusive of any structures attached to the buildings) acquired on or after April 1, 1998 which are depreciated by the straight-line method. The consolidated subsidiaries calculate depreciation principally by the straight-line method over the estimated useful lives of the respective assets.
The useful lives of property, plant and equipment are 3 to 50 years for buildings and structures and 4 to 12 years for machinery and equipment.
Costs for maintenance, repairs and minor renewals are charged to income when incurred. Major renewals and betterments are capitalized.
(Additional information)Effective April 1, 2007, the Company and its domestic consolidated
subsidiaries have changed their method of accounting for depreciation of property, plant and equipment acquired before April 1, 2007. The depreciation expense for property, plant and equipment acquired before April 1, 2007 is computed based on the residual value of 5% of acquisition cost, and the amount between the residual value (5% of acquisition cost) and memorandum value is depreciated from the year following the year in which the book value of an asset reaches 5% of its acquisition cost by the straight-line method over a period of 5 years. This change was made based on an amendment to the Corporate Tax Law. As a result, operating income and income before income taxes decreased by ¥23 million for the year ended March 31, 2008 from the corresponding amounts which would have been recorded under the previous method. The impact on segment information is outlined in Note 17.
Research and development costs are charged to income when incurred. Expenditures relating to computer software developed for internal use are charged to income when incurred, except if these are deemed to contribute to the generation of future income or cost savings. Such expenditures are capitalized as assets and amortized by the straight-line method over their respective estimated useful lives, generally a period of five years. Computer software developed for sales purposes is amortized by the straight-line method over its economic life, generally a period of three years or less.
The Company and its domestic consolidated subsidiaries provide allowances for doubtful receivables based on their historical experience of bad debts on ordinary receivables plus an additional estimate of probable specific doubtful accounts from customers experiencing financial difficulties.
The allowance for doubtful accounts of the overseas consolidated subsidiaries has been provided at the estimated amount of their probable bad debts.
Accrued bonuses for directors and employees are provided at the estimated amount of bonuses to be paid to the employees in the following year which has been allocated to the current fiscal year.
Capitalized leased assets are depreciated by the straight-line method based over the lease term with no residual value. However, non-cancelable leases of the Company that started before March 31, 2008 are accounted for as operating leases (whether such leases are classified as operating or finance leases), except that leases which stipulate the transfer of ownership of the leased assets to the lessee are accounted for as finance leases. (see Note 10)
Employees (except directors and corporate auditors) of the Company and its domestic consolidated subsidiaries are, in general, covered by the Company’s funded non-contributory pension plans.
Accrued retirement benefits are provided based on the amount of the projected benefit obligation reduced by the pension plan assets at fair value as of the balance sheet date.
Actuarial gain or loss is credited or charged to income in the year in which such gain or loss is recognized for financial reporting purposes.
The overseas consolidated subsidiaries have no retirement benefit plans.
(Additional information)On May 22, 2007, the Company’s Board of Directors approved a
resolution to abolish the retirement benefit plan for directors and corporate auditors. In addition, a resolution for payments of retirement benefits to directors and corporate auditors for services rendered up to that date was approved at a shareholders’ meeting held on June 27, 2007.
As a result, the accrual for the outstanding balance of ¥227 million provided in the retirement allowance for directors and corporate auditors as of March 31, 2008 was reclassified as other long-term liabilities.
The total amount of retirement benefits payable to directors and corporate auditors on their respective dates of retirement included in other long-term liabilities was ¥227 million at March 31, 2008.
The Company and certain consolidated subsidiaries recognize both sales and costs of sales in the period of the installment sales and defer the related gross profit to the periods in which they collect the related cash.
Income taxes are calculated based on taxable income and charged to income on an accrual basis. Certain temporary differences exist between taxable income and income reported for financial statement purposes which are entered into the determination of taxable income in a different period. The Company and its consolidated subsidiaries recognize the tax effect of such temporary differences in their consolidated financial statements.
Distribution of retained earnings with respect to a given financial period is made by resolution of the Board of Directors at a meeting held subsequent to the close of the financial period. The accounts for that period do not, therefore, reflect such distribution (see Note 17).
(a) Principles of Consolidation and Accounting for Investments in Unconsolidated Subsidiaries
(h) Research and Development Costs and Computer Software (except for leased assets)
(m) Revenue Recognition of Installment Sales
(n) Income Taxes
(o) Distribution of Retained Earnings
(i) Allowance for Doubtful Accounts
(j) Accrued Bonuses for Directors and Employees
(b) Foreign Currency Translation
(c) Cash and Cash Equivalents
(d) Inventories
(g) Property, Plant and Equipment (except for leased assets)
(k) Leases
(l) Retirement Benefits
(e) Investments in Securities
(f) Derivatives and Hedging Activities

FINANCIAL SECTIONFINANCIAL SECTION
21Annual Report 200920
3. Changes in Accounting Policy
4. U.S. Dollar Amounts
The translation of yen amounts into U.S. dollar amounts is included solely for convenience, as a matter of arithmetic computation only, at the rate of ¥98.22 = U.S.$1.00, the approximate rate of exchange in effect on March 31, 2009. This translation should not be construed as a representation that yen have been, could have been, or could in the future be, converted into U.S. dollars at the above or any other rate.
Securities and investments in securities classified as other securities at March 31, 2009 and 2008 were as follows
Effective the year ended March 31, 2009, the Company and its domestic subsidiaries adopted “Accounting Standard for Measurement of Inventories” (Accounting Standards Board of Japan (ASBJ) Statement No. 9 issued on July 5, 2006). As a result of this change in measurement of inventories, operating income, ordinary income and income before taxes decreased by ¥16 million ($164 thousand) from the corresponding amounts which would have been recorded under the previous method. The impact on segment information is outlined in Note 16.
Effective the year ended March 31, 2009, the Company and its domestic consolidated subsidiaries adopted “Accounting Standards for Lease Transactions” (ASBJ Statement No. 13 issued on June 17, 1993, revised on March 30, 2007) and “Guidance on Accounting Standard for Lease Transactions” (ASBJ Guidance No. 16 issued on January 18, 1994, revised on March 30, 2007). The new accounting standards require that all finance lease transactions must be capitalized. Non-cancelable leases of the Company that started before March 31, 2008 continue to be accounted for as operating leases (whether such leases are classified as operating or finance leases), except that leases which stipulate the transfer of ownership of the leased assets to the lessee are accounted for as finance leases. This
change had no impact on income.
Effective the year ended March 31, 2009, the Company adopted “Practical Solution on Unification of Accounting Policies Applied to Foreign Subsidiaries for Consolidated Financial Statements” (ASBJ PITF No. 18 issued in May 17, 2006) and made certain necessary adjustments for the consolidated financial closing. As a result of this change, operating income, ordinary income and income before income taxes increased by ¥56 million ($568 thousand) from the corresponding amounts which would have been recorded under the previous method. The impact on segment information is outlined in Note 16.
In accordance with the 2007 revision of the Corporate Tax Law, the method of accounting for depreciation of property, plant and equipment acquired on or after April 1, 2007 has been changed to the procedure stipulated in the revised law. As a result of this change in method of depreciation, operating income and income before income taxes decreased by ¥62 million for the year ended March 31, 2008 from the corresponding amounts which would have been recorded under the previous method. The impact on segment information is outlined in Note 16.
Finished goods Work in process Raw materials and supplies
$ 38,6272,283
13,328$ 54,238
¥ 3,794224
1,309¥ 5,327
¥ 4,261337
1,415¥ 6,013
2009 2008 2009Millions of yen
Thousands ofU.S. dollars
5. Inventories
Inventories at March 31, 2009 and 2008 are summarized as follows:
Government bonds whose fair value: – exceeds their carrying value – does not exceed their carrying valueTotal
¥ 1—
¥ 1
¥ 169—
¥ 169
¥ 170—
¥ 170
2009
2009
2008
Millions of yen
Securities and investments in securities classified as held-to-maturity debt securities at March 31, 2009 and 2008 were as follows:
Carrying value Fair value Unrealized gain
2009
6. Securities and Investments in Securities
Securities whose carrying value exceeds their acquisition costs: Equity securities Other SubtotalSecurities whose carrying value does not exceed their acquisition costs: Equity securities Other SubtotalTotal
¥ 284—
284
(102)(17)
(119)¥ 165
¥ 115—
115
37975
454¥ 569
¥ 399—
399
27758
335¥ 734
Acquisition costs Carrying value Unrealized gain (loss)
Millions of yen
(a) Measurement of Inventories
(b) Lease Transactions
(c) Unification of Accounting Policies
(d) Depreciation
Securities whose carrying value exceeds their acquisition costs: Equity securities Other SubtotalSecurities whose carrying value does not exceed their acquisition costs: Equity securities Other SubtotalTotal
$ 2,890—
2,890
(1,045)(169)
(1,214)$ 1,676
$ 1,171
—1,171
3,862762
4,624$ 5,795
$ 4,061—
4,061
2,817593
3,410$ 7,471
Acquisition costs Carrying value Unrealized gain (loss)
Thousands of U.S. dollars
Securities whose carrying value exceeds their acquisition costs: Equity securities Other SubtotalSecurities whose carrying value does not exceed their acquisition costs: Equity securities Other SubtotalTotal
¥ 4271
428
—(6)(6)
¥ 422
¥ 3472
349
14750
197¥ 546
¥ 7743
777
14744
191¥ 968
Acquisition costs Carrying value Unrealized gain (loss)
Millions of yen
Government bonds whose fair value: – exceeds their carrying value – does not exceed their carrying valueTotal
—¥ (16)¥ (16)
—¥ 1,347¥ 1,347
—¥ 1,331¥ 1,331
2008Millions of yen
Carrying value Fair value Unrealized loss
Government bonds whose fair value: – exceeds their carrying value – does not exceed their carrying valueTotal
$ 8—
$ 8
$ 1,720—
$ 1,720
$ 1,728—
$ 1,728
2009Thousands of U.S. dollars
Carrying value Fair value Unrealized gain
FINANCIAL SECTIONFINANCIAL SECTION
23Annual Report 200922
2009
$ (13,570)11,930(1,640)
——
$ (1,640)
¥ (1,333)1,172(161)
——
¥ (161)
¥ (1,468)1,502
—34
(54) ¥ (20)
2009 2008 2009Millions of yen
Thousands ofU.S. dollars
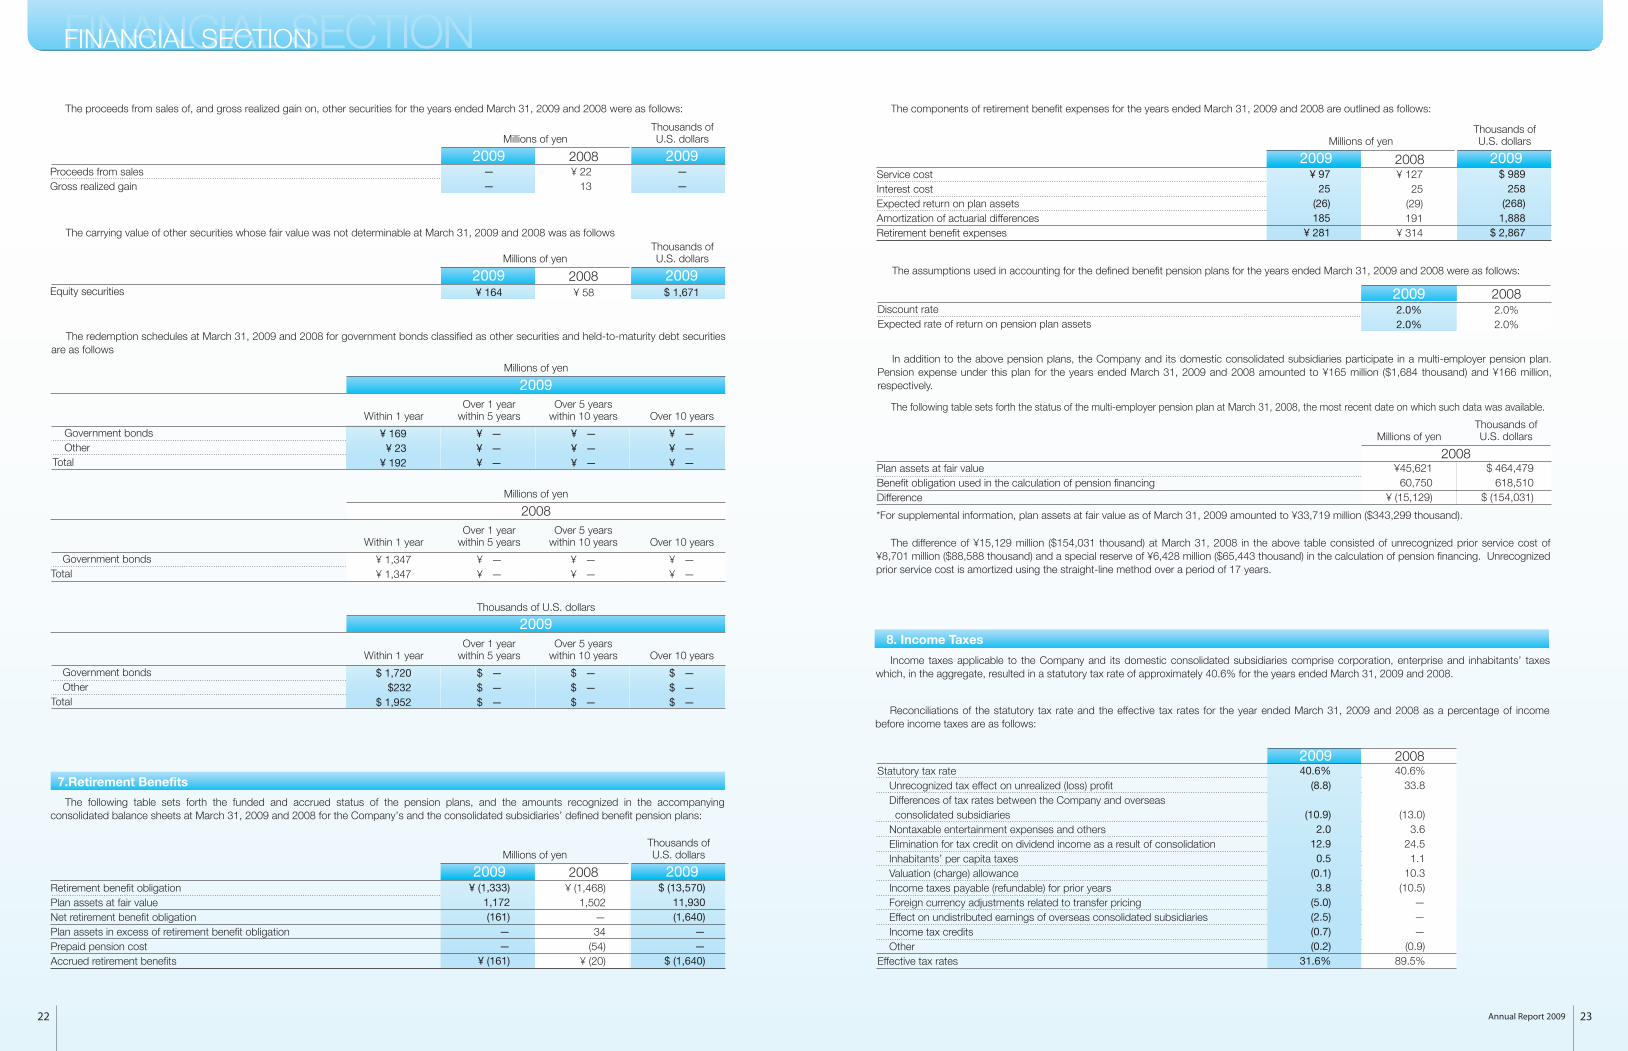
The redemption schedules at March 31, 2009 and 2008 for government bonds classified as other securities and held-to-maturity debt securities are as follows
The following table sets forth the funded and accrued status of the pension plans, and the amounts recognized in the accompanying consolidated balance sheets at March 31, 2009 and 2008 for the Company’s and the consolidated subsidiaries’ defined benefit pension plans:
Retirement benefit obligation Plan assets at fair value Net retirement benefit obligationPlan assets in excess of retirement benefit obligationPrepaid pension costAccrued retirement benefits
7.Retirement Benefits
2009
Government bonds OtherTotal
Over 1 yearwithin 5 years
¥ —¥ —¥ —
¥ —¥ —¥ —
¥ —¥ —¥ —
¥ 169¥ 23
¥ 192
Within 1 yearOver 5 years
within 10 years Over 10 years
Millions of yen
$ 989258
(268)1,888
$ 2,867
¥ 9725
(26)185
¥ 281
¥ 12725
(29)191
¥ 314
2009 2008 2009Millions of yen
Thousands ofU.S. dollars
Service cost Interest cost Expected return on plan assets Amortization of actuarial differencesRetirement benefit expenses
The components of retirement benefit expenses for the years ended March 31, 2009 and 2008 are outlined as follows:
40.6%(8.8)
(10.9)2.0
12.90.5
(0.1)3.8
(5.0)(2.5)(0.7)(0.2)
31.6%
200840.6%
33.8
(13.0)3.6
24.51.1
10.3(10.5)
———
(0.9)89.5%
Income taxes applicable to the Company and its domestic consolidated subsidiaries comprise corporation, enterprise and inhabitants’ taxes which, in the aggregate, resulted in a statutory tax rate of approximately 40.6% for the years ended March 31, 2009 and 2008.
Reconciliations of the statutory tax rate and the effective tax rates for the year ended March 31, 2009 and 2008 as a percentage of income before income taxes are as follows:
Statutory tax rate Unrecognized tax effect on unrealized (loss) profit Differences of tax rates between the Company and overseas consolidated subsidiaries Nontaxable entertainment expenses and others Elimination for tax credit on dividend income as a result of consolidation Inhabitants’ per capita taxes Valuation (charge) allowance Income taxes payable (refundable) for prior years Foreign currency adjustments related to transfer pricing Effect on undistributed earnings of overseas consolidated subsidiaries Income tax credits OtherEffective tax rates
8. Income Taxes
2.0%2.0%
2.0%2.0%
2009 2008
The assumptions used in accounting for the defined benefit pension plans for the years ended March 31, 2009 and 2008 were as follows:
In addition to the above pension plans, the Company and its domestic consolidated subsidiaries participate in a multi-employer pension plan. Pension expense under this plan for the years ended March 31, 2009 and 2008 amounted to ¥165 million ($1,684 thousand) and ¥166 million, respectively.
The difference of ¥15,129 million ($154,031 thousand) at March 31, 2008 in the above table consisted of unrecognized prior service cost of ¥8,701 million ($88,588 thousand) and a special reserve of ¥6,428 million ($65,443 thousand) in the calculation of pension financing. Unrecognized prior service cost is amortized using the straight-line method over a period of 17 years.
Discount rate Expected rate of return on pension plan assets
2008
Government bondsTotal
Over 1 yearwithin 5 years
¥ —¥ —
¥ —¥ —
¥ —¥ —
¥ 1,347¥ 1,347
Within 1 yearOver 5 years
within 10 years Over 10 years
Millions of yen
2009
Government bonds OtherTotal
Over 1 yearwithin 5 years
$ —$ —$ —
$ —$ —$ —
$ —$ —$ —
$ 1,720$232
$ 1,952
Within 1 yearOver 5 years
within 10 years Over 10 years
Thousands of U.S. dollars
The carrying value of other securities whose fair value was not determinable at March 31, 2009 and 2008 was as follows
Equity securities2009 2008 2009
Millions of yenThousands ofU.S. dollars
$ 1,671¥ 164 ¥ 58
The proceeds from sales of, and gross realized gain on, other securities for the years ended March 31, 2009 and 2008 were as follows:
Proceeds from salesGross realized gain
2009 2008 2009Millions of yen
Thousands ofU.S. dollars
——
——
¥ 2213
Millions of yenThousands ofU.S. dollars
The following table sets forth the status of the multi-employer pension plan at March 31, 2008, the most recent date on which such data was available.
*For supplemental information, plan assets at fair value as of March 31, 2009 amounted to ¥33,719 million ($343,299 thousand).
$ 464,479618,510
$ (154,031)
¥45,62160,750
¥ (15,129)
2008Plan assets at fair valueBenefit obligation used in the calculation of pension financingDifference

FINANCIAL SECTIONFINANCIAL SECTION
25Annual Report 200924
2009
Machinery and equipment ¥ 9
¥ 22 ¥ 13
Acquisition costs
Acquisition costs
Acquisition costs
Accumulateddepreciation Net book value
Millions of yen
2008
Machinery and equipment ¥ 13
¥ 22 ¥ 9
Accumulateddepreciation Net book value
Millions of yen
2009
Machinery and equipment $ 93
$ 226
$ 133
Accumulateddepreciation Net book value
Thousands of U.S. dollars
Year ending March 312010 2011 and thereafter Total
$ 3756
$ 93
¥ 45
¥ 9
Millions of yen Thousands of U.S. dollars
Movements in treasury stock for the year ended March 31, 2009 and 2008 are summarized as follows:
2009
Treasury stock 1,838,0391,757,526 (314)
Increase
80,827
March 31, 2008 Decrease March 31, 2009
Number of shares
2008
Treasury stock 80,8271,871 (972)
Increase
79,928
March 31, 2007 Decrease March 31, 2008
Number of shares
The following pro forma amounts represent the acquisition costs, accumulated depreciation and net book value of the leased assets at March 31, 2009 and 2008, which would have been reflected in the accompanying consolidated balance sheets if finance lease accounting had been applied to the finance leases currently accounted for as operating leases:
10. Leases
11. Research and Development Costs
Research and development costs included in general and administrative expenses and manufacturing costs for the years ended March 31, 2009 and 2008 amounted to ¥1,534 million ($15,615 thousand) and ¥1,425 million, respectively.
The Corporation Law of Japan (the “Law”) provides that an amount equal to 10% of the amount to be disbursed as distributions of capital surplus (other than the capital reserve) and retained earnings (other than the legal reserve) be transferred to the capital reserve and the legal reserve, respectively, until the sum of the capital reserve and the legal reserve equals 25% of the capital stock account. Such distributions can be made at any time by resolution of the shareholders or by the Board of Directors if certain conditions are met.
The Company’s legal reserve included in retained earnings at March 31, 2009 and 2008 amounted to ¥274 million ($2,793 thousand) and ¥274 million, respectively.
Under the Law, upon the issuance and sale of new shares of common stock, the entire amount of the proceeds is required to be accounted for as common stock, although a company may, by resolution of the Board of Directors, account for an amount not exceeding one-half of the proceeds of the sale of new shares as additional paid-in capital.
Lease payments relating to finance leases accounted for as operating leases for the years ended March 31, 2009 and 2008 amounted to ¥4 million ($41 thousand) and ¥4 million, respectively. Depreciation of the leased assets computed by the straight-line method over the respective lease terms for the years ended March 31, 2009 and 2008 amounted to ¥4 million ($41 thousand) and ¥4 million, respectively.
Future minimum lease payments subsequent to March 31, 2009 for finance leases accounted for as operating leases are summarized as follows:
Treasury stock
9. Shareholders’ Equity
Deferred income taxes reflect the net effect of the temporary differences between the carrying amounts of the assets and liabilities for financial reporting purposes and the corresponding amounts reported for income tax purposes. The components of deferred tax assets and liabilities at March 31, 2009 and 2008 were as follows:
2009 2008 2009Millions of yen
Thousands ofU.S. dollars
$ 1,311726
4,1431,483
—1,2932,1683,005
14,129(1,318)12,811
984108947
2,039 $ 10,772
¥ 12971
407146
—127213295
1,388(130)
1,258
971093
200 ¥ 1,058
¥ 4790
416103217135195276
1,479(130)
1,349
15084
110344
¥ 1,005
Deferred tax assets: Unrealized profit Retirement benefits payable to directors and corporate auditors Write-downs of inventories Accrued bonuses for employees Net operating loss carryforward Non-deductible selling and administrative expenses Non-deductible software expenses Other Gross deferred tax assets Valuation allowanceTotal deferred tax assets
Deferred tax liabilities: Unrealized holding gain on securities Undistributed profit of consolidated subsidiaries Other Total deferred tax liabilitiesNet deferred tax assets
Year ending March 3120102011 and thereafter Total
$ 1715
$ 32
¥ 21
¥ 3
Millions of yen Thousands of U.S. dollars
Future minimum lease payments subsequent to March 31, 2009 for operating leases are summarized as follows:

FINANCIAL SECTIONFINANCIAL SECTION
27Annual Report 200926
At March 31, 2009, the Company and one consolidated subsidiary were contingently liable as guarantors of accounts payable of third parties in the amount of ¥870 million ($8,857 thousand).
13. Contingent Liabilities
Cash and deposits in the accompanying consolidated balance sheets at March 31, 2009 and 2008 correspond to cash and cash equivalents in the accompanying consolidated statements of cash flows for the years then ended.
14. Supplemental Information to Consolidated Statements of Cash Flows
As mentioned in Note 3(a), the Company and its domestic subsidiaries have changed their measurement method of inventories. As a result, operating income in the Japan segment decreased by ¥16 million ($164 thousand) from the corresponding amounts which would have been recorded under the previous method.
Unallocated assets included in eliminations/corporate at March 31, 2009 and 2008 totaled ¥1,080 million ($10,992 thousand) and ¥4,021 million, respectively. These assets consisted primarily of surplus funds and long-term investments.
Net sales: External customers Inter-segment TotalOperating expenses Operating income
Total assets
Thousands of U.S dollars
Millions of yen
$ 71,283124,585195,868193,804 $ 2,064
$ 232,653
$ 94,634502
95,13690,481
$ 4,655
$ 47,633
$ 1,21683,98085,19681,970
$ 3,226
$ 23,942
$ 93,227989
94,21683,492
$ 10,724
$ 82,658
$ —(210,056)(210,056)(215,468) $ 5,412
$ (84,383)
$ 260,360—
260,360234,279
$ 26,081
$ 302,503
2009
Japan North America ConsolidatedEliminations/
corporateEuropeAsia
The Company and its consolidated subsidiaries are primarily engaged in the manufacture and sales of cash machines. The operations of the Company and its consolidated subsidiaries are classified into two segments: cash machines (bill validators, cash registers) and related equipment, and leisure and related businesses. As net sales, operating income and total assets of the leisure and related businesses constituted less than 10% of net sales, operating income and total assets of all segments for the years ended March 31, 2009 and 2008, the disclosure of business segment information has been omitted.
The geographical segment information of the Company and its consolidated subsidiaries for the years ended March 31, 2009 and 2008 is summarized as follows:
16. Segment Information
Net sales: External customers Inter-segment TotalOperating expenses Operating income
Total assets
¥ 7,00112,23719,23819,035¥ 203
¥ 22,851
¥ 9,295
499,3448,887¥ 457
¥ 4,678
¥ 1198,2498,3688,051¥ 317
¥ 2,352
¥ 9,15797
9,2548,200
¥ 1,054
¥ 8,119
¥ —
(20,632)(20,632)(21,163)
¥ 531
¥ (8,288)
¥ 25,572
—25,57223,010
¥ 2,562
¥ 29,712
2009
Japan North America ConsolidatedEliminations/
corporateEuropeAsia
Net sales: External customers Inter-segment TotalOperating expenses Operating income (loss)
Total assets
Millions of yen
¥ 8,70611,09119,79719,927¥ (130)
¥ 20,578
¥ 11,048
13211,18010,562¥ 618
¥ 5,432
¥ 4066,7227,1286,719¥ 409
¥ 2,998
¥ 8,384
738,4577,580¥ 877
¥ 5,337
¥ —
(18,018)(18,018)(19,093)¥ 1,075
¥ (2,392)
¥ 28,544
—28,54425,695
¥ 2,849
¥ 31,953
Japan North America ConsolidatedEliminations/
corporateEuropeAsia
¥ 10
¥ 10
2008Millions of yen
Location
Fujiidera City,Osaka Prefecture
Use
Businessequipment
Classification
Buildings,equipment and other
Total
The Company recognized a loss on impairment for the year ended March 31, 2008 as follows:
12. Impairment Loss
The Company and its consolidated subsidiaries group fixed assets by minimum cash generating unit generally independent from cash flows from other assets or asset groups. Idle assets of the Company and its consolidated subsidiaries are grouped by individual asset.
Consequently, the Company’s consolidated subsidiaries have written down the above business equipment as a result of decreased profitability due to severe competition to their net recoverable amounts, and have recorded a related impairment loss of ¥10 million in the accompanying consolidated statements of income for the year ended March 31, 2008.
The recoverable amounts of such business equipment are estimated at nil.
The financial data for the computation of basic net income per share for the years ended March 31, 2009 and 2008 is summarized as follows:
Basic net income per share has been computed based on the net income attributable to shareholders of common stock and the weighted-average number of shares of common stock outstanding during the year.
Diluted net income per share for the years ended March 31, 2009 and 2008 has not been computed because there were no potential shares of common stock with a dilutive effect.
The amounts per share of net assets have been computed based on the number of shares of common stock outstanding at the year end.
15. Amounts per Share
$ 0.719.26
¥ 69.42909.29
¥ 5.33942.64
2009 2008 2009Yen U.S. dollars
Net income - basicNet assets
$ 20,456—
¥ 2,00928,941,561
¥ 15729,582,214
2009 2008 2009Millions of yen
Thousands ofU.S. dollars
Net incomeWeighted-average number of shares
2008

FINANCIAL SECTIONFINANCIAL SECTION
29Annual Report 200928
The following distribution of retained earnings of the Company, which has not been reflected in the accompanying consolidated financial statements for the year ended March 31, 2009, was approved at a Board of Directors’ meeting held on June 4, 2009:
(a) Distribution of Retained Earnings
At a meeting of the Board of Directors of the Company held on May 8, 2009, in accordance with the Company’s Articles of Incorporation applied under Article 459, Section 1 of the Law, the Company approved a purchase of shares up to 1,000,000 of treasury stock for an aggregate acquisition cost not exceeding ¥1,000 million ($10,181 thousand) during the period from May 12, 2009 through September 30, 2009.
At a meeting of the Board of Directors of the Company held on May 8, 2009, the Company decided to spin off and combine the businesses of 1) sales and manufacturing of pachinko machines and pachislot related amusement products and 2) amusement center operations (hereinafter referred to as “Amusement Businesses”) into a single company from July 1, 2009. It was resolved that JCM Systems Co., Ltd. (hereinafter referred to as “JCM Systems”), a wholly owned subsidiary of the Company (outlined above), would inherit the Amusement Businesses and absorb JCM Techno Support Co., Ltd. (hereinafter referred to as “JCM Techno Support”), also a wholly owned subsidiary of the Company, in order to integrate the Company’s amusement businesses.
Amusement Businesses have reached a turning point due to the revision of “Ordinance for Enforcement of the Act on Control and Improvement of Amusement Business, etc.” in July 2004. As a result, the gaming element has changed considerably in the market of pachislot equipment, and the number of machine models, which are able to obtain a good reputation from game halls and users, has dropped substantially. Meanwhile, there has been a steady growth in the market of pachinko equipment as the development and supply of products with various kinds of gaming elements are now feasible.
(b) Acquisition of Treasury Stock
At a meeting of the Board of Directors of the Company held on April 28, 2009, the Company resolved to acquire 100% interest in Sammy Systems Corporation (hereinafter referred to as ‘SS’) from SEGA Sammy Holdings, Inc. SS was renamed as JCM Systems Co., Ltd on May 1, 2009.
Company NameDescription of Business
Number of Shares IssuedNet SalesOrdinary LossNet LossTotal AssetsNet Asset Deficiency
Sammy Systems CorporationDevelop, manufacture, and sales of giveaway POS systems, counting equipment, and pachinko ball dispensers for the amusement industry70,990¥3,536 million (U.S.$ 35,999 thousand)¥762 million (U.S.$ 7,762 thousand)¥1,608 million (U.S.$ 16,376 thousand)¥2,505 million (U.S.$ 25,508 thousand)¥5,971 million (U.S.$ 60,790 thousand)
Number of SharesAcquisition CostOwnership Percentage
70,990¥70,990 (U.S.$ 723)100%
(1) Reasons and Purpose for the Acquisition of StockThe Company acquired SS, which excels at peripheral equipment for pachinko, with the aim to enhance the product composition of the group in order to secure a steady profit in the amusement industry.
(3) Schedule of the acquisition of stockApril 28, 2009: Execution of stock acquisition agreementMay 1, 2009: Execution of stock acquisition
(4) Number of shares acquired, cost of acquisition, and ownership percentage
(2) Outline of SS as of March 31, 2009
(c) Acquisition of Sammy Systems Corporation
(d) Restructuring of Businesses in the Amusement Industry
17. Subsequent Events
As mentioned in Note 3(d), the Company and its domestic consolidated subsidiaries have changed their method of accounting for depreciation of property, plant and equipment. As a result, operating expenses in the Japan segment increased by ¥62 million and operating income decreased by the same amount for the year ended March 31, 2008 as compared to the corresponding amounts which would have been recorded under the previous method.
As mentioned in Note 3(c), the Company adopted “Practical Solution on Unification of Accounting Policies Applied to Foreign Subsidiaries for Consolidated Financial Statements” (ASBJ PITF No. 18 issued in May 17, 2006). As a result of this adoption, operating income in the Europe segment increased by ¥56 million ($568 thousand) from the corresponding amounts which would have been recorded under the pervious method.
As mentioned in Note 2(g), the Company and its domestic consolidated subsidiaries have changed their method of accounting for depreciation. The residual value of property, plant and equipment of the Company and its domestic consolidated subsidiaries acquired before April 1, 2007 is computed based on the residual value of 5% of acquisition cost, and the amount between the residual value (5% of acquisition cost) and memorandum value is depreciated from the year following the year in which the book value of an asset reaches 5% of its acquisition cost by the straight-line method over a period of 5 years. As a result, operating expenses in the Japan segment increased by ¥23 million and operating income decreased by the same amount for the year ended March 31, 2008 as compared to the corresponding amounts which would have been recorded under the previous method.
Cash dividends (¥11.0 = U.S.$0.112 per share) $ 3,116¥ 306
Millions of yen Thousands of U.S. dollars
Overseas net sales Consolidated net salesOverseas net sales as a percentage of consolidated net sales
Millions of yen
¥ 8,288
32.4%
¥ 8,885
34.7%
¥ 1,448
5.7%
¥ 18,621¥ 25,572
72.8%
2009TotalOtherEuropeNorth America
Overseas net sales Consolidated net salesOverseas net sales as a percentage of consolidated net sales
Millions of yen
¥ 10,060
35.2%
¥ 8,190
28.7%
¥ 1,619
5.7%
¥ 19,869¥ 28,544
69.6%
2008TotalOtherEuropeNorth America
Overseas net sales Consolidated net salesOverseas net sales as a percentage of consolidated net sales
Thousands of U.S dollars
$84,390
32.4%
$90,458
34.7%
$14,743
5.7%
$189,591$260,360
72.8%
2009TotalOtherEuropeNorth America
Overseas net sales, which include export sales of the Company and its domestic consolidated subsidiaries and sales (other than exports to Japan) of the overseas consolidated subsidiaries, for the years ended March 31, 2009 and 2008 are summarized as follows:
Overseas net sales

FINANCIAL SECTIONFINANCIAL SECTION
31Annual Report 200930
1. Outline of JCM Systems as of May 1, 2009
Under such market environments, the Company acquired 100% interest in SS, considering the necessity to enhance product composition in order to secure a steady profit in the Amusement Businesses. Additionally, the Company decided to integrate the Amusement Businesses into a single company. As mentioned above, JCM Systems will inherit the business and absorb JCM Techno Support, which provides repair and maintenance services. This will lead to an improvement in product composition and effective business operation at the same time. The Company aims to acquire new customers by enhancements and improvements in sales, services and competitiveness in the market.
Note: The amounts of total assets and net assets outlined above are based on the estimated amounts at the time of acquisition.
Company NameDescription of Businesses
Date of EstablishmentCompany AddressRepresentative’s Name and TitleCapitalNumber of Shares IssuedTotal Assets Net AssetsFiscal Year EndMajor Shareholder and Ownership Percentage
JCM Systems Co., Ltd. (Transferee)Development, manufacturing and sales of giveaway POS systems, counting equipment, and pachinko ball dispensers for the amusement industryJanuary 4, 19542-3-15 Nishiwaki, Hirano-ku,Osaka, JapanToshizumi Kitamori, President¥179 million (U.S.$1,832 thousand)70,990¥610 million (Non-consolidated) (U.S.$6,216 thousand)¥1,024 million (Non-consolidated) (U.S.$10,435 thousand)March 31
Japan Cash Machine Co., Ltd. 100%
2. Outline of business division being spun off as of March 31, 2009
Description of Business
Net SalesTotal Assets
Manufacturing and sales of pachinko machines, and pachislot related amusement products and amusement center operations¥2,787 million (U.S.$28,381 thousand)¥1,848 million (U.S.$18,819 thousand)
3. Outline of JCM Techno Support (as of March 31, 2009)
Company NameDescription of Businesses
Date of EstablishmentCompany AddressRepresentative’s Name and TitleCapitalNumber of Shares IssuedTotal AssetsNet AssetsFiscal Year EndMajor Shareholder and Ownership Percentage
JCM Techno Support Co., Ltd. (Merged company)Sales, rental, construction, maintenance, inspection, repair, and consulting for pachislot machines, and pachinko related amusement productsOctober 1, 20012-3-15 Nishiwaki, Hirano-ku, Osaka, JapanToshizumi Kitamori, President¥70 million (U.S.$713 thousand)1,400¥628 million (Non-consolidated) (U.S.$6,395 thousand)¥369 million (Non-consolidated) (U.S.$3,761 thousand)March 31
Japan Cash Machine Co., Ltd. 100%

33Annual Report 200932
Corporate DataAs of June 25, 2009
Number of shares authorized for issue by company
Number of shares issued
Number of shares per unit
Number of shareholders
118,000,000
29,662,851
100
22,068
Individuals/other21,801 shareholders, 98.79%
Business corporations/other corporations145 shareholders, 0.66%
Financial institutions28 shareholders, 0.12%
Securities companies26 shareholders, 0.12%
Overseas corporations, etc.68 shareholders, 0.31%
Directors
Chairperson
Representative DirectorPresident
Executive Director
Executive Director
DirectorSenior Operating Officer
DirectorSenior Operating Officer
DirectorSenior Operating Officer
Full-time Corporate Auditor
Full-time Corporate Auditor
Outside Corporate Auditor
Outside Corporate Auditor
Senior Operating Officer
Senior Operating Officer
Operating Officer
Operating Officer
Operating Officer
Operating Officer
Operating Officer
Operating Officer
Koichiro Kamihigashi
Yojiro Kamihigashi
Toshizumi Kitamori
Hisashi Maki
Kazuhito Kawase
Akiyoshi Isoi
Hikaru Izawa
Taizo Nakamura
Sachio Tamura
Hideyuki Koizumi
Hiroshi Morimoto
Michimasa Teraoka
Shigeru Yamazawa
Hideji Naruo
Susumu Fukuchi
Hiroshi Sato
Norihito Nakatani
Tsuyoshi Takagaki
Yoshihiro Iuchi
Share Overview
Name
Date of Establishment
Headquarters
Primary Business Activities
Capital
Principal Banks
Fiscal Year-End
Internet Site
Investor E-mail Address
Japan Cash Machine Co., Ltd
January 11, 1955
2-3-15, Nishiwaki, Hirano-ku, Osaka 547-0035, JapanPhone:+81-6-6703-8400 Fax: +81-6-6707-0348
Manufacture, sales and marketing of money-handling machines(bill acceptors, coin and bill counting and processing machines,OEM terminals for sports and track facilities, and otherequipment for the financial industry), and equipment for theamusement industry
¥2,217 million
Resona Bank, Ltd.Sumitomo Mitsui Banking CorporationMizuho Bank, Ltd.
March 31
http://www.jcm-hq.co.jp/
Investors may send e-mail queries to: [email protected]
As of March 31, 2009
JCM Systems Co., Ltd.
JCM Techno Support Co., Ltd.
JCM Meiho Co., Ltd.
Development, manufacturing and sales of giveaway POS systems,counting equipment, and pachinko ball dispensers for the amusement industry.Nissay Higashi-Ueno Bldg., 5-2-2 Higashiueno, Taitou-ku,Tokyo 110-0015 JapanPhone: +81-3-5826-5220 Fax: +81-3-5826-5226
Maintenance of money-handling machines,establishment of construction work,repair contracts of money-handling machines2-4-21, Hirano-Baba, Hirano-ku, Osaka 547-0048, JapanPhone: +81-6-6760-2300 Fax: +81-6-6702-1940
Sales of equipment for the amusement industry3F, Seika Bldg., 2-20-1, Higashi-Ueno, Taito-ku,Tokyo 110-0015, JapanPhone: +81-3-3833-4891 Fax: +81-3-3833-4895
Headquarters:
Tokyo Branch Office:
Domestic Sales Offices:
Plant:
Laboratories:
2-3-15, Nishiwaki, Hirano-ku, Osaka 547-0035, JapanPhone: +81-6-6703-8400 Fax: +81-6-6707-0348
1F, Nissay Higashi-Ueno Bldg., 5-2-2, Higashi-Ueno, Taito-ku,Tokyo 110-0015, JapanPhone: +81-3-5826-7371 Fax: +81-3-5826-7451
Tohoku, Shizuoka, Nagoya, Hiroshima,Shikoku, Fukuoka
Nagahama
Sagamihara, Kofu
Company Outline
Domestic
Main Consolidated Subsidiaries
Directory
Breakdown of shareholders by type
22,068shareholders
Individuals/other17,593 thousand shares, 59.31%
Business corporations/other corporations6,810 thousand shares, 22.96%
Financial institutions4,317 thousand shares, 14.55%
Securities companies76 thousand shares, 0.26%
Overseas corporations, etc.865 thousand shares, 2.92%
Breakdown of shareholders by number of shares
Major shareholders
29,662thousand shares
Name
Johto Investment and Development, Inc.
Koichiro Kamihigashi
Yojiro Kamihigashi
Japan Trustee Services Bank,Ltd.(trust account 4G)
Tamotsu Kamihigashi
Mars Engineering Corporation
Resona Bank, Ltd.
Sumitomo Mitsui Banking Corporation
Yamaoka Co.,Ltd
J.P.Morgan Clearing Corp-Sec(standing proxy:Citibank Japan Ltd. )
4,661
2,707
1,458
977
877
744
629
503
500
475
15.72
9.13
4.92
3.30
2.96
2.51
2.12
1.70
1.69
1.60
Number ofshares held(thousands)
Percentage ofoutstandingshares(%)
【North America】
【Europe】
【Asia】
JCM American Corporation
Japan Cash Machine Germany GmbH.
JCM United Kingdom Ltd.
JCM Bulgaria Ltd.
JCM Gold (HK) Ltd.
Macau Branch
J-Cash Machine (Thailand) Co., Ltd.
Sales of money-handling machines925 Pilot Road., Las Vegas, NV 89119, USAPhone: +1-702-651-0000 1-800-683-7248(Toll free) Fax: +1-702-651-0003
Sales of money-handling machinesMündelheimer Weg 60, D-40472 Düsseldorf, GermanyPhone: +49-211-530645-0 Fax: +49-211-530645-65
Sales of money-handling machinesUnit B, Third Avenue, Denbigh West Business Park Bletchley, Milton Keynes, Buckinghamshire, MK1 1EJ, U.K. Phone: +44-870-770-2863 Fax: +44-1908-377834
7 Kukush str. 1345 Sofia BulgariaPhone: +359-2-812-9320 Fax: +359-2-812-9344
Manufacuture of money-handling machines, equipmentfor the amusement industryUnit 1-7, 3/F, Favor Industrial Centre2-6 Kin Hong Street., Kwai Chung, N.T., Hong KongPhone: +852-2428-7187 Fax: +852-2420-8864
Unit N, 6/F, Dynasty Plaza 393-437 Alameda Dr. CarlosD'Assumpcao, MacauPhone: +853-2872-2684 Fax: +853-2872-2823
46/161 MU 12, Klongkoom, Bungkoom, Bangkok 10230 ThailandPhone: +66-2363-7509 Fax: +66-2363-7508
Overseas
Note: Apart from the above, the Company holds 1,838,039 shares as treasury stock.

2-3-15, Nishiwaki, Hirano-ku, Osaka 547-0035, JapanTel: +81-6-6703-8400 Fax: +81-6-6707-0348
URL: http://www.jcm-hq.co.jp