2008 | annual report · 2008 | annual report covington strategic ... the acquisition of platespin...
TRANSCRIPT
For The Year Ended August 31, 2008
2008 | Annual Report
Covington StrategicCapital Fund Inc.Covington Fund II Inc.

An nual Report 20081
Table Of Contents ......................................................................................................................................................................................................... 1 - 2Annual Message from the Manager ........................................................................................................................................................................... 3
COVINGTON STRATEGIC CAPITAL FUND INC.
Management Responsibility for Financial Reporting ........................................................................................................................................ 4Auditors’ Report ................................................................................................................................................................................................................... 5
FINANCIAL STATEMENTS
Statements of Financial Position ........................................................................................................................................................................... 6 Statements of Operations .......................................................................................................................................................................................... 7 Statements of Changes in Net Assets ........................................................................................................................................................... 8 - 9 Statements of Cash Flows ...................................................................................................................................................................................... 10 Statement of Investment Portfolio ............................................................................................................................................................... 11 - 12 Supplementary Schedules ....................................................................................................................................................................................... 13
COVINGTON FUND II INC.
Management Responsibility for Financial Reporting ....................................................................................................................................... 14Auditors’ Report ................................................................................................................................................................................................................. 15
FINANCIAL STATEMENTS
Statements of Financial Position .......................................................................................................................................................................... 16 Statements of Operations ........................................................................................................................................................................................ 17 Statements of Changes in Net Assets ................................................................................................................................................................ 18 Statements of Cash Flows ....................................................................................................................................................................................... 19 Statement of Investment Portfolio ............................................................................................................................................................ 20 - 23 Supplementary Schedules ............................................................................................................................................................................. 24 - 25
TABLE OF CONTENTS

An nual Report 2008 2
TABLE OF CONTENTS
NOTES TO FINANCIAL STATEMENTS
Corporate Status and Activities ............................................................................................................................................................................ 26 Significant Accounting Policies .................................................................................................................................................................. 27 - 30 Share Capital ......................................................................................................................................................................................................... 30 - 31 Non-monetary Transactions.................................................................................................................................................................................... 31 Commitments ..................................................................................................................................................................................................... 32 - 33 Related Party Transactions ..................................................................................................................................................................................... 33 Income Taxes ......................................................................................................................................................................................................... 33 - 34 Guarantees .................................................................................................................................................................................................................... 34 Securities Pledge ......................................................................................................................................................................................................... 34 Financial Instruments ...................................................................................................................................................................................... 34 - 36 Reclassification of Comparative Figures ........................................................................................................................................................... 36 Future Accounting Standards ................................................................................................................................................................................ 37 Subsequent Event ....................................................................................................................................................................................................... 37
Corporate Information.................................................................................................................................................................................................... 38

An nual Report 2008
Covi ngton Strategic Capital Fun d Inc. an d Covi ngton Fun d II Inc.
3
AN N UAL M ESSAG E FROM TH E MANAG ER
For Canada’s venture capital industry, the first half of 2008 has been a time of contradiction. While overall venture activity in Canada continued to slow, the dollar value of investments completed in Ontario increased by 17% over the same time period a year ago.1 Nevertheless, investors continued to focus on supporting their existing investments, and the majority of investment dollars throughout Ontario are still going toward later-stage, follow-on financings versus new investment opportunities.
Additional macro economic factors affecting Canada’s venture capital industry include a depressed initial public offering market (with the number of new issues down, and a decrease in the dollar value of deals of almost 20% from the same period in 2007) and the value of the country’s merger and acquisition market down almost 25%1. The slowdown in these markets has increased the average investment life cycle for a portfolio holding as venture investors wait for overall market conditions to improve and rejuvenate the venture exit environment.
In spite of the challenges facing Canada’s venture sector as a whole, Covington Strategic Capital Fund Inc. (“CSCF”) closed off Q1 2008 with the first exit in the life of the Fund. The acquisition of PlateSpin Ltd. by Novell, Inc. resulted in a realized gain of over 19 times the invested capital. As a result of the success of this transaction, Covington is pleased to announce that in September of 2008, Covington Capital Corporation was selected as the recipient of the Canadian Venture Capital Association’s 2008 “Deal of the Year” award for its investment in PlateSpin Ltd. The award is given to investment firms that have generated the most significant returns over a twelve month period. Gross proceeds from the sale totalled approximately $10 million US and the gain increased the Fund’s NAVPS to $18.03 and $18.12 for Series I and II respectively, resulting in a one year return of 31% (from August 31, 2007 to August 31, 2008). CSCF is well capitalized with several other portfolio holdings that remain well positioned to support ongoing growth and the Fund’s investment objectives.
As one of Covington’s most mature venture funds, Covington Fund II Inc. has transitioned to primarily later-stage investments and public holdings; with approximately 30% of its venture portfolio invested in the public markets. As such, performance this past year was negatively impacted by the movement in these public holdings. Most notably SXC Health Solutions Inc., (“SXC”) (SXC:TSX, SXCI:NASDQ) and EGI Financial Holdings Inc. (“EGI”) (EFH:TSX) posted declines in the value of their stock (SXC down 31% and EGI down 11% over a one year period).
Both these investments demonstrated positive growth in a number of key business segments. SXC completed the strategic acquisition of National Medical Health Card Systems Inc., which provided the company with a broader and more technical set of services to offer their clients. Additionally, EGI has demonstrated significant growth through expansion via the formation of a US subsidiary. As a result, EGI has now accelerated its efforts to capitalize on opportunities in the US non-standard auto insurance sector. We continue to hold these positions based on the core fundamentals exhibited by both SXC and EGI.
Despite strains on the Canadian economy, the opportunities for Canadian businesses to capitalize on the ever-expanding global marketplace remain strong. A number of CSCF and Fund II’s portfolio holdings continue to build their business outside of Canada; however, the movement of the Canadian dollar has been challenging for a number of the companies in the portfolio who have fixed Canadian dollar labour costs and overhead while experiencing a decline in net margins due to foreign exchange on export revenues.
Notwithstanding the pressure of reduced fund raising and increased liquidity obligations on Ontario’s labour sponsored fund industry, Covington’s management continues to focus on supporting existing holdings within its respective portfolios as well as sourcing future exit opportunities. Given the maturity of our portfolios and the strength of their underlying venture investments, we remain confident in the long-term future for the Funds and we look forward to the opportunities that lie ahead in 2009.
Sincerely,Covington Capital Corporation
1. Thomson Financial. Canada’s Venture Capital Industry in Q2 2008. 2008 2. PriceWaterhouseCoopers: Perfect storm of factors pushes IPO market
toward rocky shores. July 2008.

An nual Report 2008 4
The accompanying financial statements of Covington Strategic Capital Fund Inc. are the responsibility of management. They have been prepared in accordance with Canadian generally accepted accounting principles using information available to October 15, 2008 and management’s best estimates and judgments.
Management has developed and maintains a system of internal controls to provide reasonable assurance that all assets are safeguarded and to produce relevant, reliable and timely financial information, including the accompanying financial statements.
The Board of Directors discharges its duties to the financial statements primarily through the activities of its Valuation and Audit Committees (the “Committees”), which are composed of members of the Board of Directors. The Committees have responsibility for determining the net asset value of the Fund, including the net asset value of the Class A shares of the Fund. The Committees also meet with management and the external auditors to review both the financial statements and the results of the audit examination. The external auditors have unrestricted access to the Committees. The Committees also consider, for review by the Board of Directors and approval by the shareholders, the engagement or re-appointment of the external auditors.
These financial statements have been approved by the Board of Directors and have been audited by Ernst & Young LLP, Chartered Accountants, on behalf of the shareholders. The auditors’ report outlines the scope of their audit and their opinion on the financial statements.
Scott D. Clark Barbara FennPresident & CEO, Chief Financial Officer,Covington Capital Corporation Covington Capital Corporation
Covi ngton Strategic Capital Fun d Inc.
MANAG EM ENT RESPONSI BI LITY FOR FI NANCIAL REPORTI NG

An nual Report 2008
Covi ngton Strategic Capital Fun d Inc.
5
AU DITORS’ REPORT
To the Shareholders of Covington Strategic Capital Fund Inc.
We have audited the statements of financial position of the Covington Strategic Capital Fund Inc. (the “Fund”) as at August 31, 2008 and 2007; the statement of investment portfolio as at August 31, 2008 and the statements of operations, changes in net assets and cash flows for the years ended August 31, 2008 and 2007. These statements are the responsibility of the Fund’s management. Our responsibility is to express an opinion on these financial statements based on our audits.
We conducted our audits in accordance with Canadian generally accepted auditing standards. Those standards require that we plan and perform an audit to obtain reasonable assurance whether the financial statements are free of material misstatement. An audit includes examining, on a test basis, evidence supporting the amounts and disclosures in the financial statements. An audit also includes assessing the accounting principles used and significant estimates made by management, as well as evaluating the overall financial statement presentation.
In our opinion, these financial statements present fairly, in all material respects, the financial position of the Fund as at August 31, 2008 and 2007, its investments as at August 31, 2008 and the results of its operations, changes in net assets, and its cash flows for the years ended August 31, 2008 and 2007 in accordance with Canadian generally accepted accounting principles.
Toronto, Canada Ernst & Young LLPOctober 15, 2008 Chartered Accountants Licensed Public Accountants

An nual Report 2008
Covi ngton Strategic Capital Fun d Inc.
STATEM ENTS OF FI NANCIAL POSITION
[in $ thousands except per share amounts and number of shares]
As at August 31 2008 2007
ASSETS AND LIABILITIES Assets Cash 198 81 Venture investments, at fair value 7,378 9,002 Marketable securities, at fair value 12,154 5,537 Accounts receivable 1,136 1 Accrued interest receivable 5 5 20,871 14,626 Liabilities Accounts payable and accrued liabilities 351 99 Contingent incentive participation amount payable [Note 5] 274 607 Income taxes payable 15 4 640 710 Net assets, at fair value 20,231 13,916 Net assets, at fair value Class A Shares, Series I 14,644 10,130 Class A Shares, Series II 5,587 3,786 Class A Shares Outstanding Series I 812,118 735,157 Series II 308,436 273,439 Net asset value per Class A Share Series I $ 18.03 $ 13.78 Series II $ 18.12 $ 13.85
On behalf of the Board of Directors: _________________ _________________ David A. Griffin Henry J. Pankratz Director DirectorSee accompanying schedules and notes
6

An nual Report 2008
Covi ngton Strategic Capital Fun d Inc.
7
STATEM ENTS OF OPERATIONS
[in $ thousands except per share amounts]
For the years ended August 31 2008 2007
INCOME Interest on marketable securities 329 140 Interest on venture securities 35 - Other income 5 2 369 142 EXPENSES Incentive participation amount [Note 5] 1,378 607 Investment Advisor’s fees [Note 5] 514 - Distribution Services fees [Note 5] 240 121 Audit fees 126 87 Fund Administration fees [Note 5] 103 47 Legal fees 59 33 Goods and Services Taxes 55 15 Sponsor’s fees [note 5] 51 - Directors fees and expenses [Note 5] 33 3 Capital taxes 26 3 Other 26 3 Services fees 24 12 Marketing 21 11 Custodial fees 13 11 Shareholders’ communications 12 17 2,681 970 Loss before income taxes (2,312) (828)Income taxes - - Net loss for the year (2,312) (828) Net realized gain on sale of investments 8,765 -Change in unrealized appreciation/(depreciation) of marketable securities (5) (12) Change in unrealized appreciation/(depreciation) of venture investments (1,907) 1,685Net realized and unrealized gain on sale of investments 6,853 - Net results of operations for the year 4,541 845 Net results of operations for the year for Class A share: Series I 3,286 617 Series II 1,255 228 Net results of operations for the year per Class A share: (based on average number of shares outstanding) Series I $ 4.24 $ 1.38 Series II $ 4.27 $ 1.17
See accompanying schedules and notes

An nual Report 2008
Covi ngton Strategic Capital Fun d Inc.
8
STATEM ENTS OF CHANG ES I N N ET ASSETS
[in $ thousands]
For the years ended August 31 2008 2007
Class A Class A Class A Class A Shares, Shares, Shares, Shares, Series I Series II Total Series I Series II Total Net assets, beginning of year (Note 2) 10,130 3,786 13,916 5,281 2,224 7,505
INVESTMENT ACTIVITIESNet results of operations for the year 3,286 1,255 4,541 617 228 845
CAPITAL TRANSACTIONS Proceeds from the issuance of Class A shares 1,416 602 2,018 4,289 1,350 5,639 Amounts paid for Class A shares redeemed (188) (55) (243) (57) (16) (73)Net assets, end of year 14,644 5,587 20,231 10,130 3,786 13,916

An nual Report 20089
Covi ngton Strategic Capital Fun d Inc.
STATEM ENTS OF CHANG ES I N N ET ASSETS [Cont’d ]
[in $ thousands]
For the years ended August 31 2008 2007
REALIZED GAIN (LOSS) ON SALE OF INVESTMENTSMarketable securities Bonds, at cost, beginning of year 2,391 2,386Bonds, purchased during the year 5 5 Bonds repaid during the year - - 2,396 2,391Bonds, at cost, end of year 2,396 2,391Cost of bonds sold - - Proceeds on sale of bonds - - Realized gain/(loss) on sale of bonds - - Venture investments Venture investments, at cost, beginning of year 6,697 3,428 Venture investments, purchased during the year 1,794 3,269 Venture investments repaid during the year (107) - 8,384 6,697 Venture investments, at cost, end of year 6,980 6,697Carrying cost of venture investments sold 1,404 - Proceeds from sale of venture investments 10,169 - Realized gain /(loss) on sale of venture investments 8,765 - Net realized gain/(loss) on sale of investments 8,765 - Unrealized net appreciation (depreciation) of investments Balance, beginning of period 2,293 620 Net increase (decrease) for the period Venture investments (1,907) 1,685 Marketable securities (5) (12)Balance, end of period 381 2,293 See accompanying schedules and notes

An nual Report 2008
For the years ended August 31 2008 2007
Operating activities Net results of operations for the year 4,541 845 Items not affecting cash Change in unrealized depreciation (appreciation) of marketable securities 5 12 Change in unrealized depreciation (appreciation) of venture investments 1,907 (1,685) Net realized gain on sale of venture investments (8,765) -Change in non-cash working capital Change in other assets and liabilities (1,205) 681 (3,517) (147) Financing activities Proceeds from Class A shares issued 2,018 5,639 Cost of Class A shares redeemed (243) (73) 1,775 5,566 Investing activities Proceeds from sale of venture investments 10,169 - Purchase of venture investments (1,687) (3,269)Purchase of marketable securities (6,623) (2,162) 1,859 (5,431) Net increase/ (decrease) in cash during the year 117 (12)Cash, beginning of year 81 93 Cash, end of year 198 81 See accompanying schedules and notes
STATEM ENTS OF CASH FLOWS
[in $ thousands]
10
Covi ngton Strategic Capital Fun d Inc.

An nual Report 2008
Covi ngton Strategic Capital Fun d Inc.
STATEM ENT OF I NVESTM ENT PORTFOLIO
[in $ thousands except par value $]
As at August 31, 2008
Marketable securities
Par Value Issuer Coupon Rate Maturity Date Average Cost Market Value $ % $ $
Short-term investments 1,303,000 Nova Scotia Power 3.09 September 10, 2008 1,302 1,302 8,496,000 Enbridge Gas Distribution 3.03 October 3, 2008 8,472 8,472 9,774 9,774
Bonds 2,400,000 Royal Bank of Canada 3.47 May 12,2009 2,396 2,380 2,396 2,380 Total marketable securities 12,170 12,154
Unrealized net appreciation (depreciation) of marketable securities (17)
11

An nual Report 2008
Covi ngton Strategic Capital Fun d Inc.
STATEM ENT OF I NVESTM ENT PORTFOLIO [Cont’d ]
[in $ thousands except par value $]
Venture Investments
Investee companies * Number of shares Debt, Equities, or par value at cost at cost Total $ $ $ $
1293551 Ontario Ltd., prime + 1/2% demand promissory note $250,000 250 - 250 1293551 Ontario Ltd., Series II, Class B convertible preferred 116,866 - 495 495 Acorn Energy Inc.*+, common 6,087 - 27 27 Business Propulsion Systems Inc., 10% debenture due December 24, 2009 $1,549,000 1,549 - 1,549 Business Propulsion Systems Inc., 5% debenture due December 24, 2009 $578,000 578 - 578 Business Propulsion Systems Inc., Class A convertible preferred 485,000 - 485 485 Business Propulsion Systems Inc., Warrants $0.01, November 27, 2014 26,372 - - - Cyence International Inc., 7% convertible debenture due August 2, 2010 $560,000 560 - 560 Cyence International Inc., 7% convertible debenture due March 31, 2009 $1,000,000 1,000 - 1,000Gatehouse Capital Inc., 6% convertible debenture due November 1, 2009 $190,000 190 - 190 Gatehouse Capital Inc., warrant 1 - - - Nexgen Financial LP, LP units 7,895 - - - Nexgen Financial LP, 6% convertible debenture due April 30, 2016 $500,000 500 - 500 Powerband Canada Inc., common 4,452,592 - 850 850 RuggedCom Inc.*, common 34,900 - 496 496 Total venture investments, at cost 4,627 2,353 6,980Unrealized net appreciation (depreciation) of venture investments 398 Total venture investments, at fair value 7,378 * Indicates a publicly traded security.+ Indicates foreign property.
% Total venture Cost of % Total venture Fair value investments Number of investments investments at cost of investments at fair value companies $ % $ % Stage of Development Start-up/Early* 4 4,152 59 4,107 56Expansion 4 2,828 41 3,271 44Later - - - - - 8 6,980 100 7,378 100 * On August 24, 2007 the Fund acquired the assets of Financial Industry Opportunities Fund Inc. As part of this, the Fund acquired two positions in financial services businesses both of which are in their early stage of development.
See accompanying schedules and notes
12
An nual Report 2008
Covi ngton Strategic Capital Fun d Inc.
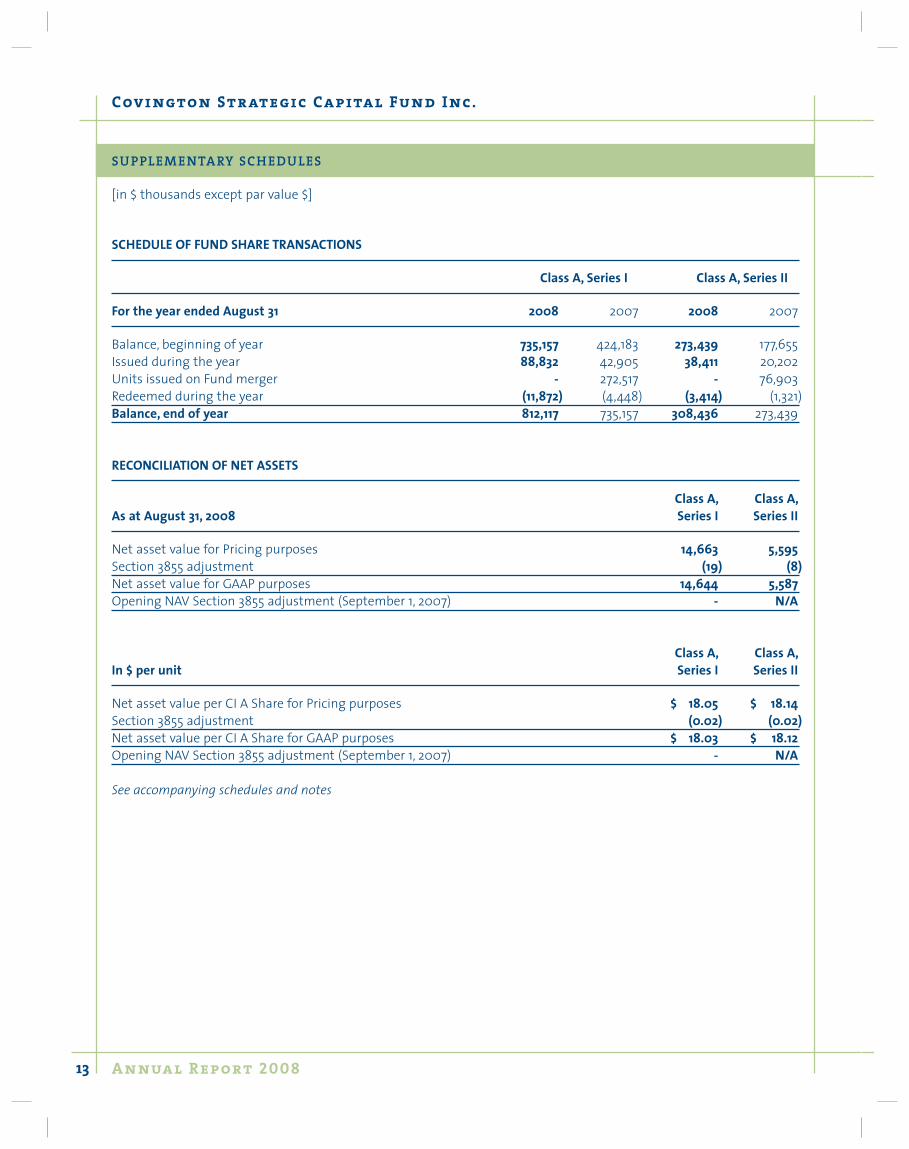
SU PPLEM ENTARY SCH EDU LES
[in $ thousands except par value $]
SCHEDULE OF FUND SHARE TRANSACTIONS
Class A, Series I Class A, Series II
For the year ended August 31 2008 2007 2008 2007
Balance, beginning of year 735,157 424,183 273,439 177,655Issued during the year 88,832 42,905 38,411 20,202Units issued on Fund merger - 272,517 - 76,903Redeemed during the year (11,872) (4,448) (3,414) (1,321)Balance, end of year 812,117 735,157 308,436 273,439
RECONCILIATION OF NET ASSETS
Class A, Class A,As at August 31, 2008 Series I Series II
Net asset value for Pricing purposes 14,663 5,595Section 3855 adjustment (19) (8)Net asset value for GAAP purposes 14,644 5,587Opening NAV Section 3855 adjustment (September 1, 2007) - N/A
Class A, Class A,In $ per unit Series I Series II
Net asset value per CI A Share for Pricing purposes $ 18.05 $ 18.14Section 3855 adjustment (0.02) (0.02)Net asset value per CI A Share for GAAP purposes $ 18.03 $ 18.12Opening NAV Section 3855 adjustment (September 1, 2007) - N/A
See accompanying schedules and notes
13

An nual Report 2008
Covi ngton Fun d II Inc.
MANAG EM ENT RESPONSI BI LITY FOR FI NANCIAL REPORTI NG
The accompanying financial statements of Covington Fund II Inc. are the responsibility of management. They have been prepared in accordance with Canadian generally accepted accounting principles using information available to October 15, 2008 and management’s best estimates and judgments.
Management has developed and maintains a system of internal controls to provide reasonable assurance that all assets are safeguarded and to produce relevant, reliable and timely financial information, including the accompanying financial statements.
The Board of Directors discharges its duties to the financial statements primarily through the activities of its Valuation and Audit Committees (the “Committees”), which are composed of members of the Board of Directors. The Committees have responsibility for determining the net asset value of the Fund, including the net asset value of the Class A shares of the Fund. The Committees also meet with management and the external auditors to review both the financial statements and the results of the audit examination. The external auditors have unrestricted access to the Committees. The Committees also consider, for review by the Board of Directors and approval by the shareholders, the engagement or re-appointment of the external auditors.
These financial statements have been approved by the Board of Directors and have been audited by Ernst & Young LLP, Chartered Accountants, on behalf of the shareholders. The auditors’ report outlines the scope of their audit and their opinion on the financial statements.
Scott D. Clark Barbara FennPresident & CEO, Chief Financial Officer,Covington Capital Corporation Covington Capital Corporation
14

An nual Report 200815
Covi ngton Fun d II Inc.
AU DITORS’ REPORT
To the Shareholders of Covington Fund II Inc.
We have audited the statements of financial position of the Covington Fund II Inc. (the “Fund”) as at August 31, 2008 and 2007; the statement of investment portfolio as at August 31, 2008 and the statements of operations, changes in net assets and cash flows for the years ended August 31, 2008 and 2007. These statements are the responsibility of the Fund’s management. Our responsibility is to express an opinion on these financial statements based on our audits.
We conducted our audits in accordance with Canadian generally accepted auditing standards. Those standards require that we plan and perform an audit to obtain reasonable assurance whether the financial statements are free of material misstatement. An audit includes examining, on a test basis, evidence supporting the amounts and disclosures in the financial statements. An audit also includes assessing the accounting principles used and significant estimates made by management, as well as evaluating the overall financial statement presentation.
In our opinion, these financial statements present fairly, in all material respects, the financial position of the Fund as at August 31, 2008 and 2007, its investments as at August 31, 2008 and the results of its operations, changes in net assets, and its cash flows for the years ended August 31, 2008 and 2007 in accordance with Canadian generally accepted accounting principles.
Toronto, Canada Ernst & Young LLPOctober 15, 2008 Chartered Accountants Licensed Public Accountants

An nual Report 2008
As at August 31 2008 2007 $ $
ASSETS AND LIABILITIES Assets Cash 180 15 Marketable securities, at fair value 17,869 36,642 Venture investments, at fair value 83,848 88,461 Accrued dividend and interest receivable 1,302 1,065 Accounts receivable and prepaid expenses 518 5,913 103,717 132,096 Liabilities Accounts payable and accrued liabilities 751 892 Redemptions payable 115 22 866 914 Net assets, at fair value 102,851 131,182 Class A Shares outstanding 14,341,035 16,777,760 Net asset value per Class A Share $ 7.17 $ 7.82
On behalf of the Board of Directors: _________________ _________________ David A. Griffin Henry J. Pankratz Director DirectorSee accompanying schedules and notes
STATEM ENTS OF FI NANCIAL POSITION
[in $ thousands except per share amounts and number of shares]
16
Covi ngton Fun d II Inc.

An nual Report 2008
For the year ended August 31 2008 2007 $ $
INCOME Interest on marketable securities 1,489 1,692 Interest on venture securities 514 18 Dividend income 251 502 Other income 24 114 2,278 2,326 EXPENSES Investment Advisor’s fees [note 5] 2,351 2,898 Fund Advisor’s fees [note 5] 885 1,087 Fund Administration fees [note 5] 704 867 Service fees 621 682 Sponsor’s fees [note 5] 369 476 Goods and Services Taxes 218 308 Audit fees 150 125 Other 131 304 Shareholders communications 118 69 Directors fees and expenses [note 5] 110 48 Custodial fees 39 36 Legal fees 30 53 Capital taxes (2) (55) 5,724 6,898 Loss before income taxes (3,446) (4,572)Provision for income taxes (recovery) - (71)Net loss for the year (3,446) (4,501) Realized and unrealized gain/(loss) on investments Net realized loss on sale of investments (4,177) (5,719)Change in unrealized appreciation/(depreciation) of accounts receivable - 86 Change in unrealized appreciation of marketable securities 1,394 5 Change in unrealized appreciation/(depreciation) of venture investments (2,588) 5,495 Net realized and unrealized loss on investments (5,371) (133)Net results of operations for the year (8,817) (4,634) Net results of operations for the year per Class A Share $ (0.56) $ (0.28) (based on weighted average number of shares outstanding) See accompanying schedules and notes
STATEM ENTS OF OPERATIONS
[in $ thousands except per share amounts]
17
Covi ngton Fun d II Inc.

An nual Report 2008
STATEM ENTS OF CHANG ES I N N ET ASSETS
[in $ thousands]
For the years ended August 31 2008 2007 $ $
Net assets, beginning of year [Note 2] 129,671 136,192
INVESTMENT ACTIVITIES Net results of operations for the year (8,817) (4,634) CAPITAL TRANSACTIONS Class A Shares Net proceeds from issuance of Class A Shares 636 1,196 Amounts paid for Class A Shares redeemed (18,639) (1,572)
Net assets, end of year 102,851 131,182 REALIZED GAIN/(LOSS) ON SALE OF INVESTMENTS Marketable securities Bonds, at cost, beginning of year 31,063 29,574 Bonds purchased during the year - 4,000 31,063 33,574 Bonds, at cost, end of year 9,974 31,063 Cost of bonds sold 21,089 2,511 Proceeds on sale of bonds 20,548 2,511 Realized loss on sale of bonds (541) - Venture investments Venture investments, at cost, beginning of year 78,843 91,470 Venture investments purchased during the year 12,341 11,575 91,184 103,045 Venture investments, at cost, end of year 78,398 78,843 Cost of venture investments sold 12,786 24,202 Proceeds from sale of venture investments 9,150 18,483 Realized loss on sale of venture investments (3,636) (5,719)Net realized loss on sale of investments (4,177) (5,719) See accompanying schedules and notes
18
Covi ngton Fun d II Inc.

An nual Report 2008
STATEM ENTS OF CASH FLOWS
[in $ thousands]
For the years ended August 31 2008 2007 $ $
Operating activities Net results of operations for the year (8,817) (4,634)Items not affecting cash: Net realized (gain)/loss on sale of investments 4,177 5,719 Change in unrealized appreciation of investments 1,194 (5,500) Fee income from venture investments [Note 4] (5) - Net change in non-cash working capital: Change in other assets and liabilities 5,110 (227) 1,659 (4,642) Financing activities Net proceeds from issuance of Class A Shares 636 1,196 Amounts paid for Class A Shares redeemed (18,639) (1,572) (18,003) (376) Investing activities Purchase of short term investments (174,976) (135,831)Purchase of venture investments (12,086) (4,000)Purchase of bonds - (11,575)Proceeds from sale of short term investments 174,123 140,927 Proceeds from sale of venture investments 8,900 12,975 Proceeds from sale of bonds 20,548 2,511 16,509 5,007 Net increase/(decrease) in cash during the year 165 (11)Cash, beginning of year 15 26 Cash, end of year 180 15 Non-monetary transactions [Note 4] Securities received from debt financing and share exchange 255 - Proceeds from share exchange 250 -
See accompanying schedules and notes
19
Covi ngton Fun d II Inc.

An nual Report 2008
As at August 31, 2008
Marketable securities
Par Value Issuer Coupon Rate Maturity Date Average Cost Fair Value $ % $ $
Short-term investments 4,241,000 Enbridge Inc 3.25 October 3, 2008 4,226 4,228 2,506,000 Nova Scotia Power 3.55 September 15, 2008 2,499 2,502 6,725 6,730
Bonds 7,000,000 Farm Credit Corporation 4.55 February 10, 2015 7,000 8,164 3,000,000 Royal Bank of Canada 3.47 May 12, 2009 2,974 2,975 9,974 11,139 Total marketable securities 16,699 17,869
STATEM ENT OF I NVESTM ENT PORTFOLIO
[in $ thousands except par value $]
20
Covi ngton Fun d II Inc.

An nual Report 2008
STATEM ENT OF I NVESTM ENT PORTFOLIO [Cont’d ]
[in $ thousands except number of shares [or par value $]]
Venture Investments
Investee companies Number of shares Debt, Equities, or par value at cost at cost Total $ $ $ $
Adventus Remediation Tech. Inc. Demand promissory note, 10% $225,000 225 - 225 Adventus Remediation Tech. Inc. Common shares 709,942 - - - Adventus Remediation Tech. Inc. Class A Preferred shares 6,990,523 - 7,007 7,007 BTE Technologies Inc., Convertible debenture, 10%, due July 07, 2009 * USD $420,000 520 - 520 BTE Technologies Inc. Exchangeable shares* 6,095 - 2,128 2,128 BTE Technologies Inc., Common* 1,736 - - - Business Propulsion Systems Inc., Class A convertible preferred shares 1,520,000 - 1,520 1,520 Business Propulsion Systems Inc., Demand promissory note, 12% $500,000 500 - 500 Business Propulsion Systems Inc., Convertible debenture, 10%, due December 24, 2009 $796,667 797 - 797 Business Propulsion Systems Inc., Convertible debenture, 5%, due December 24, 2009 $1,700,000 1,700 - 1,700 Business Propulsion Systems Inc., Warrants $0.01, due November 27, 2014 40,758 - - - Coast Software Inc. Promissory note due December 31, 2010 $150,000 150 - 150 Cyence International Inc. Class A Common shares 584,059 - - - Cyence International Inc., 7% convertible debenture due August 02, 2010 $7,107,255 7,107 - 7,107 Cyence International Inc. Convertible Preferred shares 9,060,360 - 7,974 7,974 EGI Financial Holdings Inc., Common shares+ 1,790,848 - 12,133 12,133 Exco Technologies Ltd., Common shares+ 202,528 - 1,524 1,524 Fidelity Stainless Inc., Demand promissory note, 6% $285,623 286 - 286 Fidelity Stainless Inc., Common 2,060,000 - 2,060 2,060 Ivey-Robarts CSBIF I Inc. Class A Common shares 250,000 - 2,500 2,500 Ivey-Robarts CSBIF II Inc. Class A Common shares 250,000 - 2,500 2,500 Linea Marketing Inc., Demand promissory note, 7% $500,000 500 - 500 Linea Marketing Inc. Debenture, 12%, due February 10, 2012 $2,400,000 2,400 - 2,400 Linea Marketing Inc. Common shares 2,353,334 - 2,000 2,000 Linea Marketing Inc., Warrants $0.01, due June 5, 2012 1,201,000 - - - Marketrend Inc., Class A Preferred shares 2,775,000 - 5,000 5,000 Marketrend Inc., Class D Preferred shares 3,330 - 1,910 1,910
21
Covi ngton Fun d II Inc.

An nual Report 2008
Venture Investments
Investee companies Number of shares Debt, Equities, or par value at cost at cost Total $ $ $ $
Marketrend Inc., Senior secured debenture, 4.5%, due June 30, 2009 $249,000 249 - 249 Marketrend Inc., Subordinated debenture, 0%, due June 30, 2009 $2,000,000 2,000 - 2,000 Mist Mobility Integrated Systems Technology Inc., Demand promissory note, 12% $3,400,000 3,400 - 3,400 Mist Mobility Integrated Systems Technology Inc., Debenture, 15%, due November 04, 2009 $750,000 750 - 750 Mist Mobility Integrated Systems Technology Inc., Subordinated debenture, 5%, due November 04, 2009 $2,250,000 2,250 - 2,250 Mist Mobility Integrated Systems Technology Inc., Common shares 3,690,136 - 2,250 2,250 Mo Products Inc., Debenture, 10% debenture, November 1, 2011 $375,000 375 - 375 Mo Products Inc., Common 117,475 - - - Mo Products Inc., Preferred 1,055 - - - PowerBand Canada Inc., Common 1,000,000 - 150 150 Soliton Inc., Series A Preferred shares 210,000 - - - Statpro Plc, Common shares+* 150,095 - 284 284 SXC Health Solutions Corp. (formerly Systems Xcellence Inc.), Common shares+ 1,331,405 - 3,728 3,728 TNR Doors Inc., Subordinate debenture, 12%, due August 31, 2010 $271,292 271 - 271 TNR Doors Inc. Class A Common shares 250,000 - 250 250 Total venture investments, at cost 23,480 54,918 78,398 Unrealized appreciation of venture investments 5,450 Venture investments, at fair value 83,848 Total investments, at fair value 101,717 Other assets, net of liabilities 1,134 Net assets, at fair value 102,851 * Indicates foreign property. + Indicates a publicly traded security.
STATEM ENT OF I NVESTM ENT PORTFOLIO [Cont’d ]
[in $ thousands except number of shares [or par value $]]
22
Covi ngton Fun d II Inc.

An nual Report 2008
STATEM ENT OF I NVESTM ENT PORTFOLIO [Cont’d ]
[in $ thousands except number of shares [or par value $]]
% Total venture Cost of % Total venture Fair value investments Number of investments investments at cost of investments at fair value companies $ % $ % Stage of Development Start-Up / Early 2 525 0.7 525 0.6Expansion 14 74,003 94.4 80,527 96.0Later 3 3,870 4.9 2,796 3.4 19 78,398 100.0 83,848 100.00
Industry Class Entertainment/Retail 1 375 0.5 375 0.4Health Sciences 1 2,648 3.4 1,568 1.9Financial Services 7 36,881 47.0 43,511 51.9Technology 5 20,553 26.2 29,193 34.8Manufacturing 5 17,941 22.9 9,201 11.0 19 78,398 100.0 83,848 100.0 See accompanying schedules and notes
23
Covi ngton Fun d II Inc.

An nual Report 2008
Covi ngton Fun d II Inc.
SCHEDULE OF NET ASSET VALUE RECONCILIATION [Note 2]
For the year ended August 31 2008 2007
Net asset value for Pricing purposes 103,380 132,561Section 3855 adjustment (388) N/AUnamortized deferred sales commissions (141) (1,379)Net asset value for GAAP purposes 102,851 131,182Opening NAV Section 3855 adjustment (September 1, 2007) (1,511) N/A
Per Class A Share Per Class A ShareFor the year ended August 31 2008 2007
Net asset value per Class A Share for Pricing purposes 7.21 7.90Section 3855 adjustment (0.03) N/AUnamortized deferred sales commissions (0.01) (0.08)Net asset value per Class A Share for GAAP purposes 7.17 7.82Opening NAV Section 3855 adjustment (September 1, 2007) (0.09) N/A
SCHEDULE OF FUND SHARE TRANSACTIONS
For the year ended August 31 2008 2007
Class A SharesBalance, beginning of year 16,777,760 16,821,808Issued during the year 88,989 139,253Redeemed during the year (2,525,714) (183,301)Balance, end of year 14,341,035 16,777,760
Class B SharesBalance, beginning and end of year 100 100
SU PPLEM ENTARY SCH EDU LES
[in $ thousands except per share amounts and number of shares]
24

An nual Report 2008
Covi ngton Fun d II Inc.
25
SU PPLEM ENTARY SCH EDU LES [Cont’d ]
[in $ thousands except per share amounts and number of shares]
SCHEDULE OF LOSS CARRYFORWARDS (IN 000’S) AS AT AUGUST 31, 2008
Capital loss carryforwards $20,556
Year of expiry 2009 2010 2014 2026 2027 2028Non-capital loss carryforwards $5,229 $5,032 $6,348 $3,925 $5,268 $3,761
See accompanying schedules and notes

An nual Report 2008
Notes To Fi nanc ial Statements
AS AT AUGUST 31, 2008
[In $ thousands except per share amounts and number of shares]
1. CORPORATE STATUS AND ACTIVITIES
Each of the Funds is registered as a labour-sponsored investment fund corporation (“LSIF”) under the Community Small Business Investment Funds Act (Ontario) (the “Ontario Act”) and is a prescribed labour-sponsored venture capital corporation under the Income Tax Act (Canada) (the “Act”).
The following funds (the “Funds”) were incorporated under the laws of Ontario by articles of incorporation:
Covington Strategic Capital Fund Inc. (“CSCF”) – November 18, 2003Covington Fund II Inc. (“Fund II”) – September 20, 1999
The Manager of the Funds is Covington Capital Corporation (“Covington” or the “Manager”). The administrator of the Funds is CI Investments Inc. (the “Fund Administrator”). The sponsor of the Funds is the Canadian Police Association (the “Sponsor”).
On January 1, 2007, the Manager of the Fund, Covington Capital Corporation, amalgamated with its affiliated company, Covington Group of Funds Inc., to be continued as Covington Capital Corporation. As a result, Covington Capital Corporation has assumed the Fund Advisor role for both CSCF and Fund II.
Fund Acquisition
On August 24, 2007 (the “Effective Date”) CSCF acquired the assets of Financial Industry Opportunities Fund Inc. (“FIOF”). After the acquisition, shares of FIOF were exchanged for shares of CSCF as follows:
• FIOF Class A shares, Series I, were entitled to receive, in exchange for those shares, Class A shares of the same series in the capital of CSCF equal to the number of FIOF Class A shares of the series so held multiplied by the net asset value per Class A share of the series held of FIOF divided by the net asset value per Class A share of the same series of CSCF all as determined on the Effective Date. On August 24, 2007, there were 470,588 Class A, Series I shares of FIOF exchanged for 272,517 Class A, Series I shares of CSCF. The value of the exchange was $3,755.
• FIOF Class A shares, Series II, were entitled to receive, in exchange for those shares, Class A shares of the same series in the capital of CSCF equal to the number of FIOF Class A shares of the series so held multiplied by the net asset value per Class A share of the series held of FIOF divided by the net asset value per Class A share of the same series of CSCF all as determined on the Effective Date. On August 24, 2007, there were 131,726 Class A Series II shares of FIOF exchanged for 76,903 Class A, Series II shares of CSCF. The value of the exchange was $1,067.
This transaction has been accounted for as a purchase with the results of operations of FIOF included with those of the acquirer (CSCF) from the date of acquisition.
26

An nual Report 2008
Notes To Fi nanc ial Statements
27
AS AT AUGUST 31, 2008
[In $ thousands except per share amounts and number of shares]
2. SIGNIFICANT ACCOUNTING POLICIES
These financial statements have been prepared by management in accordance with Canadian Generally Accepted Accounting Principles (“GAAP”). The significant accounting policies are as follows:
Adoption of new accounting standards
The Canadian Institute of Chartered Accountants (“CICA”) has issued section 3855, “Financial Instruments – Recognition and Measurement” effective for interim and annual financial statements relating to fiscal years beginning on or after October 31, 2006. This section sets out standards for the fair valuation of investments and the way transaction costs are recorded for financial reporting purposes. Specifically, it stipulates that the fair value of financial instruments which are traded in active markets be measured based on the bid price for long securities and the ask price for securities sold short.
National Instrument 81-106 (“NI 81-106”), which governs continuous disclosure requirements for investment funds, requires the Funds’ financial statements to be prepared in accordance with Canadian GAAP. While Section 3855 defines specific measurement parameters for fair valuation of financial instruments which are traded in active markets, NI 81-106 allows daily net asset values of investment funds to be calculated using the fair value of the fund’s assets and liabilities. The valuation rules and techniques used by the Funds are in accordance with the Funds’ prospectus but are not necessarily in accordance with Section 3855. NI 81-106 has been amended to allow the daily Net Asset Value (“NAV”) of an investment fund to be calculated in a manner that is not in accordance with Canadian GAAP for other than financial statement purposes. The adoption of Section 3855, therefore, results in a different valuation method for determining the Funds’ net assets as described in the Funds’ valuation methodologies below. Consequently, the Funds have applied section 3855 for financial statement reporting purposes only.
For each of the Funds, a reconciliation between the net asset value calculated in accordance with GAAP (referred to as “Net Assets” or “net assets for GAAP purposes”) and the price used for subscriptions and redemptions (referred to as “Net Asset Value” or “net assets for pricing purposes”) is provided in the supplementary schedules for each of CSCF and Fund II.
The Funds have adopted Section 3855 on a retrospective basis without restatement of prior periods for financial statements for the year ended August 31, 2008. The opening net asset value in the Statement of Changes in Net Assets as at September 1, 2007 has been restated. Section 3855 also requires that transaction costs, such as brokerage commissions, incurred in the purchase and sale of securities be charged to net income in the period. The Funds already expense these transaction costs as disclosed in Note 5.
The implementation of Section 3855 for the year ended August 31, 2008 has also had an impact on the Funds’ accounting policies for Marketable securities and Venture investments, as discussed under those headings in the significant accounting policies summarized below.
The Funds have adopted CICA Handbook Section 3861 – Financial Instruments – Disclosure and Presentation, which is effective for fiscal years commencing on or after October 1, 2006. This section requires enhanced disclosure and presentation for financial instruments covered under Section 3855.
Cash and cash equivalents
Cash equivalents are comprised of short term debt instruments having original terms to maturity of 90 days or less when acquired. Cash equivalents are classified as held for trading and are recorded at amortized cost, which approximates fair value.

An nual Report 2008
Notes To Fi nanc ial Statements
28
AS AT AUGUST 31, 2008
[In $ thousands except per share amounts and number of shares]
Marketable securities
Short-term investments maturing greater than 90 days but less than 365 days from acquisition are classified as held for trading and are valued at bid prices. Prior to section 3855, short term investments were valued at amortized cost, which approximated fair value.
Bonds are classified as held for trading and are valued on the basis of closing bid prices as at August 31. The difference between the fair value and the average cost of the bonds is recorded as unrealized appreciation (depreciation) of marketable securities. Prior to section 3855, bonds were valued at closing market prices.
Purchases and sales of marketable securities are recorded on a trade date basis.
Venture investments
Venture investments are classified as held for trading in accordance with section 3855 and are recorded at fair value.
Venture investments having quoted market values and which are publicly traded on a recognized stock exchange, and are not otherwise restricted or thinly traded securities, are recorded at fair values based on closing bid prices as at August 31. If no bid price is reported, the most recent closing price is used. Prior to Section 3855, the publicly traded venture investments were valued based on the last traded price of the security.
Venture investments for which no quoted market value exists, or venture investments in restricted or thinly traded securities, are recorded at estimated fair value. The fair values of the investments are determined by the Manager using the appropriate valuation methodology after considering: the history and nature of the business; operating results and financial conditions; the general economic, industry and market conditions; capital market and transaction market conditions; independent valuations of the business; contractual rights relating to the investment; public market comparable public company transactions and results multiples, where applicable, and other pertinent considerations.
For warrants which are not traded on a recognized securities exchange, no market value is readily available. When there are sufficient and reliable observable market inputs, a valuation technique is used. If no such market inputs are available, the warrants are valued at intrinsic value, which is equal to the higher of the closing bid price of the underlying security as at August 31, 2008, less the exercise price of the warrant, or NIL.
The process of valuing venture investments for which no published market exists is subject to inherent uncertainties and the resulting values may differ from values which would have been used had a ready market existed for those investments.
To comply with National Instrument 81-106 Investment Fund Continuous disclosure, the Funds are exempt from disclosing individual current fair values for venture investments because their auditors have reviewed, in conjunction with their audit using qualified valuators, the net asset value of each series or class of Class A Shares as at each date of the statements of financial position. The Funds’ independent auditors have expressed an opinion that the net assets per Class A Share determined by the Valuation Committees and presented in the financial statements of the Funds as at August 31, 2008, represent a reasonable estimate of fair value per share.
The Tax Act and the Ontario Act require that the Funds ensure that the value of Class A Shares be determined by an independent qualified person. The Funds satisfy these requirements by obtaining an independent valuation review, as described above, from their auditors.

An nual Report 2008
Notes To Fi nanc ial Statements
29
AS AT AUGUST 31, 2008
[In $ thousands except per share amounts and number of shares]
2. SIGNIFICANT ACCOUNTING POLICIES (Cont’d)
Deferred charges
Consistent with industry practice, Fund II capitalized sales commissions it paid prior to January 1, 2004 related to the sale of the Class A Shares, as deferred charges. Deferred charges were amortized, net of related income taxes, on a straight-line basis to retained deficit over eight years from the date of issue of the related shares. Redemptions prior to eight years from the date of issue were charged an early redemption fee which was applied against the unamortized deferred charges related to such share subscriptions.
In July 2003, the Accounting Standards Board of The CICA issued a new recommendation, revising the definition of GAAP. The result of this change was that for fiscal periods beginning on or after October 1, 2003, any unamortized balance of deferred charges was no longer allowable as an asset. Fund II was required to write off the unamortized balance of the deferred charges to the deficit commencing October 1, 2003. This reduced the net asset value of the Class A Shares, by the amount of the deferred charges written off.
On September 30, 2003, the Ontario Securities Commission (“OSC”) issued OSC Staff Notice 81-706 allowing, for transitional purposes, limited exemptive relief from the requirement to calculate net asset value for purposes of pricing purchases and redemptions in accordance with GAAP for LSIFs that cease adding new sales commissions to the existing deferred charges asset balance by December 31, 2003. The OSC Staff Notice allows prices for purchases and redemptions to be determined on the basis that the deferred charge for accounting purposes, existing as an asset of Fund II at December 31, 2003, may continue to be amortized over its remaining amortization period.
For Fund II, the reconciliation of the net asset value for trading purposes and net assets for GAAP purposes as at August 31, 2008 and 2007 is disclosed in the supplementary schedules to Fund II.
Sales commissions and fees related to the sale of CSCF Class A, Series I and Series II shares are paid by the Fund Manager and therefore, there are no differences related to deferred charges.
Series allocations
CSCF allocates income, expenses, realized gains (losses) and unrealized gains (losses) on the following basis:
Income and realized and unrealized gains (losses) are apportioned on a daily basis based on the net asset value for pricing purposes of the respective series to the total net asset value of the CSCF as at the most recent valuation date.
Expenses are categorized and tracked as to expenses directly attributable to a specific series (“direct expenses”) and those that are common expenses of CSCF. Direct expenses of a particular series are recorded as a direct expense to that series. Common expenses are allocated to each series in a consistent manner as the common income allocation described above.
Accounts receivable, other assets and liabilities
Other assets such as accounts receivable, receivables for venture investments sold and income receivables are classified as loans and receivables and are recorded at cost or amortized cost. Other liabilities such as accounts payable, accrued expenses and incentive participation amount payable are designated as other financial liabilities and recorded at cost or amortized cost.

An nual Report 2008
Notes To Fi nanc ial Statements
30
AS AT AUGUST 31, 2008
[In $ thousands except per share amounts and number of shares]
Income recognition and security holder transactions
Interest and other income are recorded on an accrual basis. Dividend income is recognized on the ex-dividend date.
Investment transactions are accounted for on a trade date basis and gains and losses from such transactions are calculated based on average cost. Net realized and unrealized gain (loss) on investments includes the related foreign exchange gains and losses.
Foreign currency translation
The Funds hold certain venture investments where the original purchase price was stated in US dollars. The cost is converted to Canadian dollars at the exchange rate in effect at the time of purchase and this amount becomes the historical cost of the investment. When a venture investment has its operations primarily in the United States, these investments are adjusted daily for the change in the exchange rate.
Use of estimates
The preparation of financial statements in accordance with Canadian GAAP requires management to make estimates and assumptions that affect the reported amounts of assets and liabilities at the reporting date and the reported amounts of income and expenses during the reporting period. Actual results could differ from those estimates and the differences could be material.
3. SHARE CAPITAL
The following is a description of the authorized and issued share capital:
Authorized
For Covington Strategic Capital Fund Inc.:Unlimited number of Class A shares, issuable in series, discretionary dividend entitlement, voting, restrictions on redemption, entitled to elect one of six directors.
Unlimited Class B shares issuable only to the Sponsor of the Fund, no dividend entitlement, voting entitled to elect, five of six directors.
Unlimited number of Class C shares, issuable in series.
For Covington Fund II Inc.:Unlimited number of Class A shares, issuable from treasury, discretionary dividend entitlement, voting, restrictions on transfer and redemption, entitled to elect two of six directors.
25,000 Class B shares issuable only to the Sponsor of the Fund, no dividend entitlement, voting entitled to elect five of six directors.
Unlimited number of Class C shares, issuable in series.
100 Class D Shares.

An nual Report 2008
Notes To Fi nanc ial Statements
31
AS AT AUGUST 31, 2008
[In $ thousands except per share amounts and number of shares]
3. SHARE CAPITAL (Cont’d)
Issued
For issued and outstanding share capital, see the supplementary schedules for each of CSCF and Fund II.
Redemption of Class A Shares
A shareholder may redeem all or part of the Class A shares held at the net asset value per Class A share, subject to certain restrictions. One of these restrictions provides that the Funds are not required to redeem Class A Shares, in any financial year having an aggregate redemption price exceeding 20% of the Net Asset Value of the Funds as at the last day of the preceding fiscal year. The Funds cannot guarantee that they will be able to honour all redemption requests in the month in which they are made. Some of the Funds’ investments are held in non-liquid securities. As such, if all shareholders were to redeem their shares at the same time, the Funds may need to liquidate these investments at lower values than currently described and shareholders may not receive the Net Asset Value ascribed. The redemption of Class A Shares may be suspended in certain circumstances as permitted by applicable securities laws.
For CSCF Class A, Series I Shares a redemption fee is charged in the amount of up to 10% of the original issue price calculated as 1.25% of the original issue price times the number of years or part years remaining until the eighth anniversary date of issue. For CSCF Class A, Series II Shares, a redemption fee is charged in the amount of up to 6% of the original issue price calculated as 0.75% of the original issue price times the number of years or part years remaining until the eighth anniversary date of issue.
For Fund II Class A Shares a redemption fee is charged in the amount of up to 6% of the redemption price calculated as 0.75% of the redemption amount times the number of years or part years remaining until the eighth anniversary date of issue.
Class B Shares
CSCF has 200 Class B shares issued and outstanding to the Sponsor. No such shares have been issued or redeemed in 2008 or 2007. Fund II has 100 Class B Shares issued and outstanding to the Sponsor. No such shares have been issued or redeemed in 2008 or 2007.
4. NON-MONETARY TRANSACTION
Included in interest income, for both CSCF and Fund II, from the venture portfolio for the year ended August 31, 2008 is $5 of interest in each Fund earned on a promissory note that was converted to a debenture as a result of corporate reorganization. The Funds did not receive cash but recorded the interest portion of the transactions as interest income at fair value in accordance with the provisions of the debt instruments that were converted.

An nual Report 2008
Notes To Fi nanc ial Statements
32
AS AT AUGUST 31, 2008
[In $ thousands except per share amounts and number of shares]
5. COMMITMENTS
The Funds have contracted with Covington to, among other things, provide investment advisory services, fund advisory services and engage and supervise service providers to the Funds.
CSCF pays Covington, the Manager, an annual fee calculated monthly for its services at the annual rate of 2.025% of the net asset value of the Fund. This fee was waived by the Manager from the Fund’s inception to August 31, 2007. However, for the year ended August 31, 2008, these fees were $347 and would have been $166 in 2007 had they not been waived.
CSCF also pays Covington a monthly fee of 0.16% of the original issue price of the issued and unredeemed Class A, Series I Shares and 0.096% of the original issue price of issued and unredeemed Class A, Series II Shares for distribution services. The distribution fees for the year were $197 (year ended August 31, 2007 - $96) for Class A, Series I Shares and $43 for Class A, Series II Shares (year ended August 31, 2007 - $25).
Covington is entitled to an incentive participation amount (the “IPA”) based on performance of CSCF as disclosed in the annual prospectus. The amount of $1,378 (2007 – $607) was expensed during the year. $1,711 (2007 – $NIL) was paid in 2008 based on a realized gain from CSCF’s exit of PlateSpin Ltd. CSCF has a contingent liability of $274 for IPA as of August 31,2008 (August 31,2007 - $607). Contingent IPA is calculated on the basis of what would be payable to the Manager if the venture portfolio were disposed of at its year end carrying value. As at August 31, 2008, the conditions to pay the contingent IPA have not been met.
CSCF pays Covington (formerly Covington Group of Funds) the Fund Advisor to provide marketing and investor relations services. CSCF pays the Fund Advisor an annual fee calculated monthly for its services at the annual rate of 1.225% of the net asset value of the Fund. This fee was waived by the Fund Advisor from the Fund’s inception to August 31, 2007. Effective August 24, 2007, this fee was decreased to 0.975%. For the year ended August 31, 2008, these fees were $167 and would have been $101 in 2007 had they not been waived.
Fund II pays Covington, the Investment Advisor, to source and manage eligible Canadian investments for the Fund.
Fund II pays the Investment Advisor an annual fee calculated monthly for its services at the annual rate of 2% of the Net Asset Value of the Fund.
Fund II pays Covington (formerly Covington Group of Funds) the Fund Advisor to provide marketing and investor relations services to Fund II. Fund II pays the Fund Advisor an annual fee calculated monthly for its services at the annual rate of 0.75% of the Net Asset Value of the Fund.
Covington is also entitled to an IPA based on performance of Fund II as disclosed in the annual prospectus (No amounts paid in 2008 or 2007).
The Funds have entered into a Fund Administration Agreement with CI Mutual Funds Inc. to provide administration and client services, shareholder reporting, and transfer agency services to the Fund. The Funds pays the Fund Administrator an annual fee calculated monthly for its services at the annual rate of 0.6% of the net asset value of the Funds.

An nual Report 2008
Notes To Fi nanc ial Statements
33
AS AT AUGUST 31, 2008
[In $ thousands except per share amounts and number of shares]
5. COMMITMENTS (Cont’d)
Both Funds pay the Sponsor an annual fee of up to 0.3% of the net asset value of the Funds with respect to the Funds share of the first $200,000 of combined assets of CSCF and Fund II and at a rate of 0.1% of the net asset value of the combined Funds with respect to their share of any combined assets in excess of $200,000, provided that all assets of Fund II shall be included in the first $200,000 of the combined assets. This fee was waived by the Sponsor for CSCF from inception to August 31, 2007. For the year ended August 31, 2008, these fees were $51 and would have been $8 in 2007 had they not been waived.
The Funds pay a service fee to agents selling CSCF Class A, Series II shares and Fund II Class A shares equal to 0.5% of the annual net asset value of the respective Funds.
Directors of CSCF who are independent of the Sponsor and who are members of the Audit Committee, Valuation Committee or Investment Committee are entitled to receive a fee of $7 and a fee of $0.75 per meeting. Directors of CSCF who are nominees of the Sponsor are entitled to a fee of $0.50 per meeting. CSCF has two such independent directors who both agreed to waive their fees for the year ended August 31, 2007.
Directors of Fund II who are independent of the Sponsor, the Fund Advisor, and the Investment Advisor are entitled to receive an annual fee of $15 and a fee of $0.75 for each meeting day. Directors of Fund II who are nominees of the Sponsor are entitled to an annual fee of $12.
During the course of the Funds’ investment activities, the Funds may pay commissions and other transaction costs to dealers in connection with purchases and sales of venture investments. During the year, CSCF paid commissions of $1 [2007 – $NIL] and Fund II paid commissions of $NIL (2007 – $NIL).
6. RELATED PARTY TRANSACTIONS
Included in accounts receivable for CSCF as at August 31, 2008 is $2 (2007 – $NIL) due from the Manager in respect of sales commissions paid to brokers. Included in accounts payable and accrued liabilities for CSCF as at August 31, 2008, is $67 (2007 – $30) due to the Manager for distribution services fees and $56 (2007 – $NIL) for advisory fees. Payment of $1,711 of IPA during the year and future payment of contingent IPA, if any, are also related party transactions of the CSCF.
Included in accounts payable and accrued liabilities for Fund II as at August 31, 2008 is $237 (2007 – $333) due to the Investment Advisor and Fund Advisor for advisory fees.
7. INCOME TAXES
Under the Act, no income taxes are payable by the Funds on dividends received from Canadian corporations, and income taxes payable on capital gains will be fully refundable on a formula basis when shares of the Funds are redeemed or capital gains dividends are paid or deemed to be paid by the Funds to their shareholders. A portion of the income taxes payable on interest income earned by the Funds is also refundable on payment or on a deemed payment of dividends to the shareholders.

An nual Report 2008
Notes To Fi nanc ial Statements
34
AS AT AUGUST 31, 2008
[In $ thousands except per share amounts and number of shares]
Both the Act and the Ontario Act set minimum levels of venture investments for the Funds. If the minimum level of qualifying venture investments is not met as at the calendar year end, the Funds will be subject to defined taxes and penalties. At December 31, 2007, the Funds were in compliance with both requirements set out in the Tax Act and the Ontario Act.
Fund II has capital and non-capital losses as disclosed in the schedule of loss carry forwards available to offset future taxable capital gains and income. The benefit, if any, of those losses have not been recognized in these financial statements. See the supplementary schedules to Fund II for a breakdown of these losses.
CSCF has no capital losses and has used up all of its non-capital loss carry forwards in the year ended August 31, 2008. CSCF would have had taxes payable of $474 for the 2008 fiscal year; however, on July 24, 2008, the CSCF Board of Directors approved in principle, an increase in the paid up capital of the Fund which will result in a deemed dividend to CSCF shareholders. This dividend will be a capital gains dividend in the amount of $2, 260 and will allow CSCF to claim a refund of taxes otherwise payable for its August 31, 2008 year end. This dividend will not be paid in cash but rather will result in an increase to each Class A shareholder’s adjusted cost base.
The tax amounts reflected in these financial statements are based on management’s best estimate of the amounts that will ultimately be assessed. This determination is based on numerous factors such as the pace at which the Funds make qualifying venture investments, the amount of share capital raised and redeemed, and the net income and undistributed net realized gains (losses) on sale of investments by the Funds. Should actual events not agree with the estimates made by management of the Funds, material adjustments to the tax amounts may be required.
8. GUARANTEES
CSCF and Fund II have provided guarantees in favour of investee companies of the Funds for amounts of up to $80 USD and $1,000 USD respectively for operating credit facilities. Should the guarantees be drawn, the amounts would be recorded as follow-on investments in the investee companies.
9. SECURITIES PLEDGE
Fund II has pledged certain of its securities of one of the Fund’s investee companies with a cost of $2060 to be used as collateral for a specified loan of the investee company.
10. FINANCIAL INSTRUMENTS
Along with the adoption of CICA section 3855, the Funds have also enhanced disclosure requirements under CICA Section 3861 with respect to financial instruments. Among the assets held for trading by the Funds are venture investments for which no quoted market values exist. These investments are in privately held companies whereby fair values are estimated by the Manager using valuation techniques as described in Note 2.

An nual Report 2008
Notes To Fi nanc ial Statements
35
AS AT AUGUST 31, 2008
[In $ thousands except per share amounts and number of shares]
10. FINANCIAL INSTRUMENTS (Cont’d)
Included in the statements of operations for each of the Funds are changes in unrealized gains or losses on venture investments for which the fair values have been estimated based on assumptions that may not be supported by observable market prices.
The potential effect of changing the assumptions to reasonably possible alternative assumptions on the fair value of the venture investments would result in a decrease or increase in net assets as follows:
Fair value of of venture Increase/ investments decrease $
CSCF 7,378 -1.51% to +1.50%Fund II 83,848 -0.54% to +5.50%
The table below separates out changes in unrealized appreciation/ (depreciation) of venture investments of the privately held companies within the venture investment portfolio:
For the year-ended August 31, 2008 Change in unrealized Amount of change in appreciation/(depreciation) unrealized appreciation/ of fair value of venture (depreciation) of fair value of investments per Statement venture investments related of Operations to privately held companies $ $
CSCF (1,907) (1,976)Fund II (2,588) (5,635)
The Funds’ activities expose it to a variety of financial risks: foreign currency risk, liquidity risk, valuation and other market risk, and credit risk as described below. The Funds’ overall risk management program seeks to minimize potential adverse effects on the Funds’ financial performance.
(a) Foreign currency risk
Foreign currency risk arises from venture investments that are denominated in a currency other than the Canadian dollar, which is the Funds’ functional currency. CSCF and Fund II each hold one investment which is denominated in US dollars and converted to Canadian dollars to determine the fair value of the investments. The Manager has flexibility to manage the foreign currency risk by hedging its currency exposure; however, the Manager did not engage in currency hedging during the year.
An nual Report 2008
Covi ngton Strategic Capital Fun d Inc. an d Covi ngton Fun d II Inc.
36
AS AT AUGUST 31, 2008
[In $ thousands except per share amounts and number of shares]
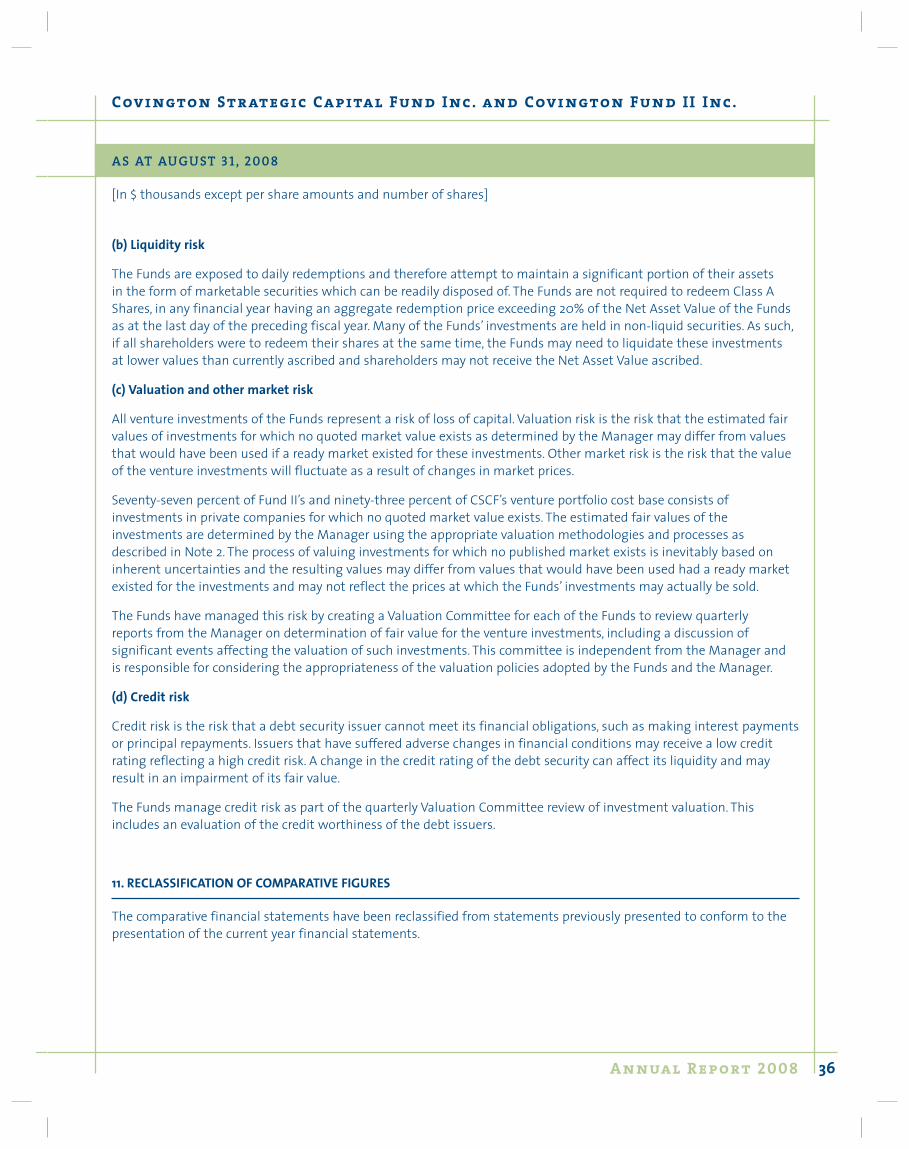
(b) Liquidity risk
The Funds are exposed to daily redemptions and therefore attempt to maintain a significant portion of their assets in the form of marketable securities which can be readily disposed of. The Funds are not required to redeem Class A Shares, in any financial year having an aggregate redemption price exceeding 20% of the Net Asset Value of the Funds as at the last day of the preceding fiscal year. Many of the Funds’ investments are held in non-liquid securities. As such, if all shareholders were to redeem their shares at the same time, the Funds may need to liquidate these investments at lower values than currently ascribed and shareholders may not receive the Net Asset Value ascribed.
(c) Valuation and other market risk
All venture investments of the Funds represent a risk of loss of capital. Valuation risk is the risk that the estimated fair values of investments for which no quoted market value exists as determined by the Manager may differ from values that would have been used if a ready market existed for these investments. Other market risk is the risk that the value of the venture investments will fluctuate as a result of changes in market prices.
Seventy-seven percent of Fund II’s and ninety-three percent of CSCF’s venture portfolio cost base consists of investments in private companies for which no quoted market value exists. The estimated fair values of the investments are determined by the Manager using the appropriate valuation methodologies and processes as described in Note 2. The process of valuing investments for which no published market exists is inevitably based on inherent uncertainties and the resulting values may differ from values that would have been used had a ready market existed for the investments and may not reflect the prices at which the Funds’ investments may actually be sold.
The Funds have managed this risk by creating a Valuation Committee for each of the Funds to review quarterly reports from the Manager on determination of fair value for the venture investments, including a discussion of significant events affecting the valuation of such investments. This committee is independent from the Manager and is responsible for considering the appropriateness of the valuation policies adopted by the Funds and the Manager.
(d) Credit risk
Credit risk is the risk that a debt security issuer cannot meet its financial obligations, such as making interest payments or principal repayments. Issuers that have suffered adverse changes in financial conditions may receive a low credit rating reflecting a high credit risk. A change in the credit rating of the debt security can affect its liquidity and may result in an impairment of its fair value.
The Funds manage credit risk as part of the quarterly Valuation Committee review of investment valuation. This includes an evaluation of the credit worthiness of the debt issuers.
11. RECLASSIFICATION OF COMPARATIVE FIGURES
The comparative financial statements have been reclassified from statements previously presented to conform to the presentation of the current year financial statements.

An nual Report 2008
Covi ngton Strategic Capital Fun d Inc. an d Covi ngton Fun d II Inc.
12. FUTURE ACCOUNTING STANDARDS
The Funds will adopt CICA Section 3862 – “Financial Instruments – Disclosures” and CICA Section 3863 – “Financial Instruments – Presentation” for interim and annual financial statements commencing August 1, 2008. These sections replace Section 3861 “Financial Instruments – Disclosure and Presentation, and will require additional disclosures pertaining to the nature and extent of risks arising from financial instruments and the management of those risks. These sections will require additional disclosures in the Funds’ fiscal years commencing September 1, 2008 but will not impact financial results.
CICA Section 1535, “Capital Disclosures”, requires an entity to disclose its objectives, policies, and processes for managing capital, as well as quantitative data about capital. This section will require additional disclosure in the Fund’s fiscal year commencing September 1, 2008 but will not impact financial results.
The CICA will adopt the International Financial Reporting Standards (“IFRS”) for fiscal years beginning in 2011. On May 9, 2008, the Canadian Securities Administrators (“CSA”) issued CSA Staff Notice 52-320 Disclosure of Expected Changes in Accounting Policies Relating to Changeover to International Financial Reporting Standards. The Notice references disclosure requirements for investment funds relating to IFRS.
The Funds are currently developing their IFRS changeover plan and will identify the key elements and timing, and will assess the impact on accounting policies, information technology and data systems, the impact on financial reporting and, if any, on net asset value per unit, and the impact on business activities, including risk management activities. The Funds’ progress will be reported in interim and annual financial statements beginning September 1, 2008.
13. SUBSEQUENT EVENT
Deemed Dividend
On October 7, 2008, the Board of Directors of CSCF approved a resolution increasing the stated capital of the Class A Shares by $2,060, resulting in a deemed dividend on the issued and outstanding Class A Shares of the Fund. Class A shareholders will be deemed to have received a capital gains dividend equal to the holder’s proportionate share of such deemed dividend even though there will not be a cash distribution from the Fund. While this deemed dividend has no impact for shareholders who own their shares within an RRSP or RRIF, Class A shareholders who hold the shares outside of registered plans must include the amount of the dividend in their capital gains for their taxation year that includes October 7, 2008, even though no cash has been received from the Fund.
NOTES
37

An nual Report 2008
Covi ngton Strategic Capital Fun d Inc. an d Covi ngton Fun d II Inc.
CORPORATE I N FORMATION
Fund Symbols
Covington Strategic Capital Fund Inc. Series I - CIG916Series II - CIG917
Covington Fund II Inc. CIG912
Fund Manager
Covington Capital Corporation200 Front Street West, Suite 3003Toronto, ON M5V 3K2
Administrator
CI Investments Inc.CI Place151 Yonge Street, 8th FloorToronto, ON M5C 2W7Customer Service: 416 364 0759Toll Free: 1 888 746 4751
Sponsor
Canadian Police Association141 Catherine Street, Suite 100Ottawa, ON K2P 1C3
Auditor
Ernst & Young LLPErnst & Young TowerP.O. Box 251Toronto-Dominion CentreToronto, ON M5K 1J7
Transfer Agent and Registrar
CI Investments Inc.151 Yonge Street, 8th FloorToronto, ON M5C 2W7Customer Service: 1 888 746 4751
Legal Counsel
Gowling Lafleur Henderson LLPSuite 16001 First Canadian Place100 King Street WestToronto, ON M5X 1G5
38

Covi ngton Venture Fun d
200 Front Street WestSuite 3003Toronto, ON M5V 3K2Telephone: 416 365 0060Facsimile: 416 365 9822Email: [email protected]: www.covingtonfunds.com
SKU CGOF 1071 10/08