city of covington, kentucky comprehensive annual financial ... · city of covington, kentucky...
TRANSCRIPT


CITY OF COVINGTON, KENTUCKY COMPREHENSIVE ANNUAL FINANCIAL REPORT
Year Ended June 30, 2009
TABLE OF CONTENTS PAGE INTRODUCTORY SECTION Letter of Transmittal 1 – 5 GFOA Certificate of Achievement 6 Organizational Chart 7 List of Principal Officials 8 FINANCIAL SECTION Independent Auditors' Report 9 – 10 Management’s Discussion and Analysis (MD&A) 11 – 23 Basic Financial Statements Government-Wide Financial Statements
Statement of Net Assets 24
Statement of Activities 25 Fund Financial Statements
Balance Sheet – Governmental Funds 26
Reconciliation of the Balance Sheet – Governmental Funds to the Statement of Net Assets 27
Statement of Revenues, Expenditures and Changes in Fund Balance – Governmental Funds 28
Reconciliation of the Statement of Revenues, Expenditures, and Changes in Fund Balance – Governmental Funds to the Statement of Activities 29
Statement of Net Assets – Proprietary Funds 30
Statement of Revenues, Expenses and Changes in Fund Net Assets – Proprietary Funds 31
Statement of Cash Flows – Proprietary Funds 32
Statement of Fiduciary Net Assets – Fiduciary Funds 33
Statement of Changes in Fiduciary Net Assets – Fiduciary Funds 34 Notes to the Financial Statements 35 – 55

CITY OF COVINGTON, KENTUCKY COMPREHENSIVE ANNUAL FINANCIAL REPORT
Year Ended June 30, 2009
TABLE OF CONTENTS (Continued)
PAGE REQUIRED SUPPLEMENTARY INFORMATION Schedule of Revenues, Expenditures and Changes in Fund Balance
Budget and Actual – General Fund 56 – 58
Budget and Actual – Community Development Block Grant 59
Budget and Actual – Home Program 60
Budget and Actual – Housing Voucher Program 61 OTHER SUPPLEMENTARY INFORMATION
Combining Financial Statements – Non-Major Governmental Funds
Non-Major Governmental Funds 62 – 63
Combining Balance Sheet – Non-Major Governmental Funds 64 – 65
Combining Statement of Revenues, Expenditures and Changes in Fund Balances – Non-Major Governmental Funds 66 – 67
Individual Fund Schedules – Non-Major Governmental Funds
Schedule of Revenues, Expenditures and Changes in Fund Balance – Budget and Actual – Police and Fire Incentive 68
Schedule of Revenues, Expenditures and Changes in Fund Balance – Budget and Actual – Newport Steel UDAG 69
Schedule of Revenues, Expenditures and Changes in Fund Balance – Budget and Actual – Devou Park Maintenance 70
Schedule of Revenues, Expenditures and Changes in Fund Balance – Budget and Actual – Investor Program 71
Schedule of Revenues, Expenditures and Changes in Fund Balance – Budget and Actual – City Hall Operations 72
Schedule of Revenues, Expenditures and Changes in Fund Balance – Budget and Actual – Federal and State Grant Fund 73
Schedule of Revenues, Expenditures and Changes in Fund Balance – Budget and Actual – Arts District 74
Schedule of Revenues, Expenditures and Changes in Fund Balance – Budget and Actual – 501 Main Street Operations 75
Schedule of Revenues, Expenditures and Changes in Fund Balance – Budget and Actual – Police Forfeiture 76

CITY OF COVINGTON, KENTUCKY COMPREHENSIVE ANNUAL FINANCIAL REPORT
Year Ended June 30, 2009
TABLE OF CONTENTS (Continued)
PAGE
Schedule of Revenues, Expenditures and Changes in Fund Balance – Budget and Actual – Police Block Grant 77
Schedule of Revenues, Expenditures and Changes in Fund Balance – Budget and Actual – CAD System 78
Schedule of Revenues, Expenditures and Changes in Fund Balance – Budget and Actual – Renaissance Grant Fund 79
Schedule of Revenues, Expenditures and Changes in Fund Balance – Budget and Actual – Working Capital Reserve 80
Schedule of Revenues, Expenditures and Changes in Fund Balance – Budget and Actual – Property Acquisitions 81
Schedule of Revenues, Expenditures and Changes in Fund Balance – Budget and Actual – Home Consortium Fund 82
Schedule of Revenues, Expenditures and Changes in Fund Balance – Budget and Actual – Capital Improvement Fund 83
Schedule of Revenues, Expenditures and Changes in Fund Balance – Budget and Actual – KLC Series 2002 84
Schedule of Revenues, Expenditures and Changes in Fund Balance – Budget and Actual – 2004 Pension Obligation Bonds 85
Schedule of Revenues, Expenditures and Changes in Fund Balance – Budget and Actual – 2005 Refunding Bonds 86
Schedule of Revenues, Expenditures and Changes in Fund Balance – Budget and Actual – Sewer Maintenance Fees 87
Combining Financial Statements – Proprietary Funds
Combining Statement of Net Assets – Internal Service Funds 88
Combining Statement of Revenues, Expenses and Changes in Fund Net Assets – Internal Service Funds 89
Combining Statement of Cash Flows – Internal Service Funds 90
Individual Fund Schedules – Proprietary Funds
Schedule of Revenues, Expenses and Changes in Fund Net Assets – Budget and Actual – Liability Insurance 91
Schedule of Revenues, Expenses and Changes in Fund Net Assets – Budget and Actual – Medical and Dental Insurance 92
Combining Financial Statements – Fiduciary Funds
Combining Statement of Fiduciary Net Assets – Fiduciary Funds 93
Combining Statement of Changes in Fiduciary Net Assets – Fiduciary Funds 94

CITY OF COVINGTON, KENTUCKY COMPREHENSIVE ANNUAL FINANCIAL REPORT
Year Ended June 30, 2009
TABLE OF CONTENTS (Continued)
PAGE STATISTICAL SECTION Net Assets by Component 95
Change in Net Assets 96
Fund Balances, Governmental Funds 97
Changes in Fund Balance, Governmental Funds 98
Occupational License Fees - Payroll Withholding 99
Principal Occupational Payroll Tax Payers 100
Assessed Value and Estimated Actual Value of Taxable Property 101
Direct and Overlapping Property Tax Rates 102
Principal Property Tax Payers 103
Property Tax Levies and Collections 104
Ratios of Outstanding Debt by Type 105
Ratios of General Bonded Debt Outstanding 106
Legal Debt Margin Information 107
Demographic and Economic Statistics 108
Principal Employers 109
Full-Time-Equivalent City Government Employees by Function/Program 110
Operating Indicators by Function/Program 111
Capital Assets Statistics by Function/Program 112 SINGLE AUDIT SECTION Schedule of Expenditures of Federal Awards 113
Independent Auditors’ Report on Internal Control Over Financial Reporting and on Compliance and Other Matters Based on an Audit of Financial Statements Performed in Accordance with Government Auditing Standards 114 – 115
Independent Auditors’ Report on Compliance with Requirements Applicable to Each Major Program and Internal Control Over Compliance in Accordance with OMB Circular A-133 116 – 117
Schedule of Findings and Questioned Costs 118 – 119
Schedule of Status of Prior Year Findings and Questioned Costs 120 – 121

INTRODUCTORY SECTION


6
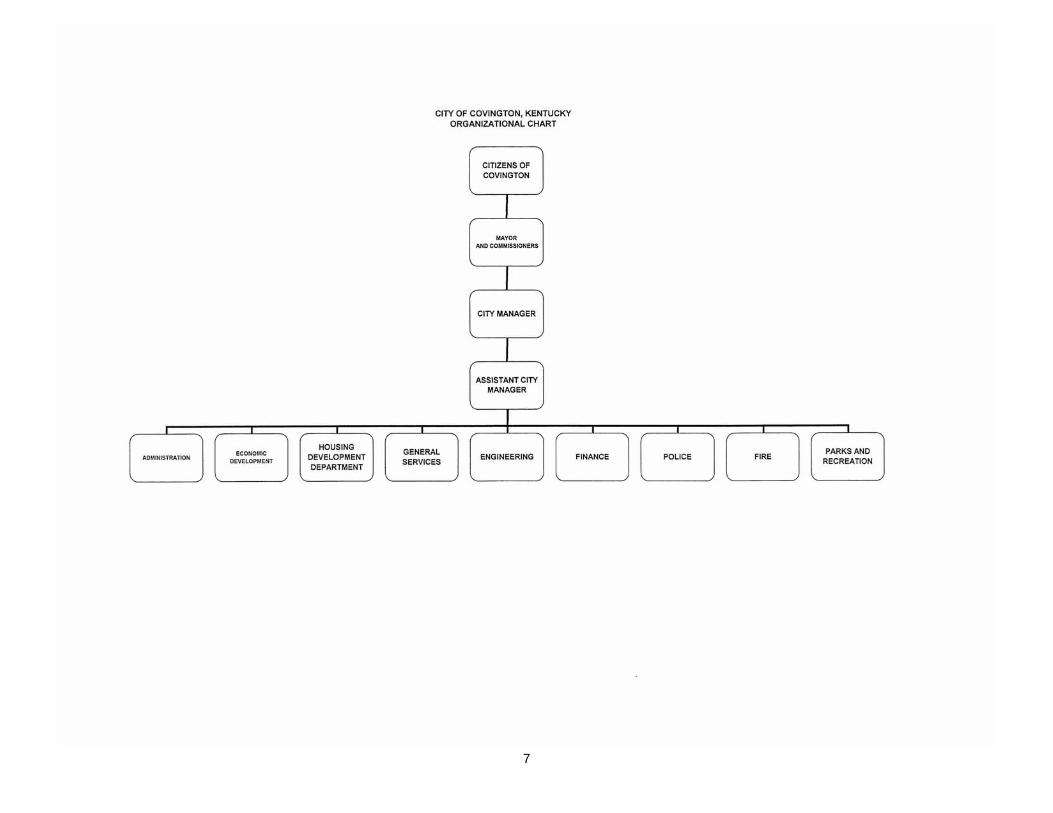
7

8
CITY OF COVINGTON, KENTUCKY LIST OF PRINCIPAL OFFICIALS
June 30, 2009
MAYOR
Denny Bowman
COMMISSIONERS
Shawn Masters
Sherry Carran
Mildred Rains
Jerry Stricker
STAFF
City Manager – Larry Klein
City Solicitor – Frank Warnock
City Clerk – Tracy Denham
Finance Director – Robert J. Due
Chief of Police – Lee Russo
Fire Chief – Mark Young
City Engineer – Tom Logan
Housing Development Director – Aaron Wolfe-Bertling
Director of Code Enforcement – Keith Bales

FINANCIAL SECTION

9
INDEPENDENT AUDITORS' REPORT Honorable Mayor Board of Commissioners City of Covington, Kentucky We have audited the accompanying financial statements of the governmental activities, the aggregate discretely presented component units, each major fund, and the aggregate remaining fund information of the City of Covington, Kentucky, as of and for the year ended June 30, 2009, which collectively comprise the City’s basic financial statements as listed in the table of contents. These financial statements are the responsibility of City of Covington, Kentucky’s management. Our responsibility is to express opinions on these financial statements based on our audit. We did not audit the financial statements of Devou Properties, Inc. (a non-profit organization), the discretely presented component unit. Those financial statements were audited by other auditors whose report thereon has been furnished to us, and our opinion, insofar as it relates to the amounts included for Devou Properties, Inc. is based on the report of the other auditors. We conducted our audit in accordance with auditing standards generally accepted in the United States of America and the standards applicable to financial audits contained in Government Auditing Standards, issued by the Comptroller General of the United States. Those standards require that we plan and perform the audit to obtain reasonable assurance about whether the financial statements are free of material misstatement. The financial statements of Devou Properties, Inc. were not audited in accordance with Government Auditing Standards. An audit includes examining, on a test basis, evidence supporting the amounts and disclosures in the financial statements. An audit also includes assessing the accounting principles used and significant estimates made by management, as well as evaluating the overall financial statement presentation. We believe that our audit and the report of other auditors provide a reasonable basis for our opinions. In our opinion, based on our audit and the report of other auditors, the financial statements referred to above present fairly, in all material respects, the respective financial position of the governmental activities, the aggregate discretely presented component units, each major fund, and the aggregate remaining fund information of the City of Covington, Kentucky, as of June 30, 2009, and the respective changes in financial position and cash flows, where applicable, thereof for the year then ended in conformity with accounting principles generally accepted in the United States of America. In accordance with Government Auditing Standards, we have also issued our report dated November 24, 2009, on our consideration of the City of Covington, Kentucky’s internal control over financial reporting and on our tests of its compliance with certain provisions of laws, regulations, contracts, and grant agreements and other matters. The purpose of that report is to describe the scope of our testing of internal control over financial reporting and compliance and the results of that testing, and not to provide an opinion on the internal control over financial reporting or on compliance. That report is an integral part of an audit performed in accordance with Government Auditing Standards and should be considered in assessing the results of our audit.

10
Honorable Mayor Board of Commissioners City of Covington, Kentucky Page Two The management’s discussion and analysis on pages 11 through 23 and budgetary comparison schedules on pages 56 through 61 are not required parts of the basic financial statements, but are supplementary information required by accounting principles generally accepted in the United States of America. We have applied certain limited procedures, which consisted principally of inquiries of management regarding the methods of measurement and presentation of the supplementary information. However, we did not audit the information and express no opinion on it. Our audit was conducted for the purpose of forming opinions on the financial statements that collectively comprise the City of Covington, Kentucky basic financial statements. The other supplementary information, as listed in the table of contents, is presented for purposes of additional analysis and is not a required part of the basic financial statements. The supplementary schedule of expenditures of federal awards is presented for the purpose of additional analysis as required by the U.S. Office of Management and Budget Circular A-133, Audits of States, Local Governments, and Non-Profit Organizations, and is also not a required part of the basic financial statements. The other supplementary information and the supplementary schedule of expenditures of federal awards have been subjected to the auditing procedures applied in the audit of the basic financial statements and, in our opinion, are fairly stated in all material respects in relation to the basic financial statements taken as a whole. The introductory section and statistical sections, as listed in the table of contents, are presented for purposes of additional analysis and are not a required part of the basic financial statements. Such information has not been subjected to the auditing procedures applied by us and the other auditors in the audit of the basic financial statements and, accordingly, we express no opinion on them.
VonLehman & Company Inc. Fort Mitchell, Kentucky November 24, 2009

11
CITY OF COVINGTON, KENTUCKY MANAGEMENT’S DISCUSSION AND ANALYSIS
The Management Discussion and Analysis (MD&A) of the City of Covington, Kentucky’s (the City’s) financial statements provides readers an overview and analysis of the City’s financial position and activities for the fiscal year ended June 30, 2009. The information presented here should be read in conjunction with the City’s basic financial statements which immediately follow this analysis.
USING THIS ANNUAL REPORT This annual report consists of a series of financial statements. The Statement of Net Assets and the Statement of Activities (on pages 24 and 25) provide information about the activities of the City as a whole and present a longer-term view of the City’s finances. Fund financial statements start on page 26. For governmental activities, these statements tell how these services were financed in the short term as well as what remains for future spending. Fund financial statements also report the City’s operations in more detail than the government-wide statements by providing information about the City’s most financially significant funds. This report was published under the standards for governmental financial reporting prescribed by the Governmental Accounting Standards Board. The governmental reporting model is designed to provide improved information through the elimination of fund transfers and the use of consolidated statements. This model is found in the government-wide financial statements.
Financial Highlights
The assets of the City exceeded its liabilities at the close of the most recent year by $53,409,347 (net assets), and represent a decrease of $5,079,405 from the prior year. This amount includes $36,577,167 that is invested in capital assets net of related debt. Another $193,693 is restricted for debt service and $16,638,487 is unrestricted and available to fund the City’s future obligations, activities, and projects. An increase in accumulated depreciation of $4,558,984 is one of the reasons for the decrease in net assts and net assets invested in Capital Assets respectively. As of the close of the current fiscal year, the City’s governmental funds reported a combined ending fund balance of $5,944,993, an increase of $265,230 from the previous year. Of the $5,944,993 in combined fund balance, $730,555 in the General Fund was unreserved, undesignated, and available. The City has a minimum reserve retention policy of a minimum of 5% of General Fund revenue. The $771,969 in General Fund combined with the fund balance of $1,770,264 in the Working Capital Reserve Special Revenue Fund equals $2,542,233, or 5.4% of General Fund revenue. Last fiscal year, the City’s fund balance in General Fund and Working Capital Reserve was $2,110,586, or 4.7% of General Fund revenue.

12
CITY OF COVINGTON, KENTUCKY MANAGEMENT’S DISCUSSION AND ANALYSIS
(Continued)
Government-Wide Financial Statements Government-Wide financial statements include the Statement of Net Assets and the Statement of Activities. These statements utilize the accrual basis of accounting, which is similar to the accounting used by most private-sector companies. Accrual accounting means the financial statements recognize revenue when it is earned and expense when it is incurred regardless of when the cash is actually received or paid. The Statement of Net Assets presents information on all City assets and liabilities as of June 30, 2009. Net assets are the difference between the assets and liabilities. Over time, increases or decreases in the City’s net assets are one indicator of whether its financial health is improving or deteriorating. In assessing the City’s condition, other factors must be considered as well, such as changes in the City’s property tax base, occupational license tax base, and the condition of the City’s capital assets (roads, buildings, equipment, and sidewalks) to assess the overall health of the City. The Statement of Activities presents the City’s annual revenues and expenses as well as any other transactions that increase or decrease net assets. Program revenues are offset by program expenses in order to provide net program costs that are financed by general government revenues. The government-wide statements divide the City functions into two kinds of activities:
Governmental activities: Most of the City’s basic services are reported here, including police, fire, street maintenance, parks and recreation, and general administration services. Payroll occupational license fees, property taxes, and net profit license fees, and insurance premiums license tax, and service charges finance most of these activities.
Component Units: Devou Properties Inc. was formed to maintain and operate the Drees
Pavilion at Devou Memorial Overlook for the benefit of Devou Park which is owned by the City. Although a legally separate entity, Devou Properties is included in these financial statements because of its financial accountability to the City.

13
CITY OF COVINGTON, KENTUCKY MANAGEMENT’S DISCUSSION AND ANALYSIS
(Continued)
Fund Financial Statements Fund financial statements report the City’s operations in more detail than the government-wide statements. The analysis of the City’s major funds begins on page 55. The non-major fund financial statements begin on page 61. Some funds are required to be established by State law or by bond covenants. However, the City Commission may establish many other funds to help control and manage money for particular purposes (i.e., Police Forfeiture Fund, Devou Park Maintenance Fund, City Hall Operations Fund, etc.) or to show that it is meeting legal responsibilities for grant funds (i.e. Community Development Block Grant Fund, Housing Voucher Fund, HOME Program Fund, etc.). The City’s reports financial activity under three kinds of funds, governmental and proprietary, and fiduciary. Governmental funds: Most of the City’s basic services are reported in governmental funds, which focus on how money flows into and out of those funds and the balances left at year-end that are available for spending. These funds are reported using an accounting method called modified accrual accounting, which measures cash and all other financial assets that can readily be converted to cash. The governmental fund statements provide a detailed short-term view of the City’s general government operations and the basic services it provides. Governmental fund information helps determine whether there are more or fewer financial resources that can be spent in the near future to finance the City’s programs. The relationship (or differences) between governmental activities (reported in the Statement of Net Assets and the Statement of Activities) and governmental funds is described in a reconciliation attached to the fund financial statements. The City considers the General Fund, Community Development Block Grant Fund, HOME Program Fund, and Housing Voucher Fund to be major governmental funds. Proprietary funds: When the City charges customers for the full cost of the services it provides whether to outside customers or to other units of the City, these services are reported in proprietary funds. The subcategories of the funds include enterprise funds, which are business-type activities and internal service funds, which report services provided to internal units of government. Proprietary funds are reported in the same way that all activities are reported in the Statement of Net Assets and the Statement of Activities. The City has no enterprise funds and reports two internal service funds, the Liability Self Insurance Fund and the Medical and Dental Self Insurance Fund. Fiduciary funds: Fiduciary funds are used to account for resources held for the benefit of parties outside the government. Fiduciary funds are not reflected in the government-wide financial statements because the resources of those funds are not available to support the City of Covington’s own programs. The accounting used for fiduciary funds is much like that used for proprietary funds. The City is trustee, or fiduciary for two retirement funds. The Police and Firemen’s Pension Fund is a closed pension that is held solely for trust beneficiaries. The Employees’ Retirement fund has two active employee members and is also held solely for trust beneficiaries.

14
CITY OF COVINGTON, KENTUCKY MANAGEMENT’S DISCUSSION AND ANALYSIS
(Continued)
Statement of Net Assets
For the year ended June 30, 2009, net assets changed as follows:
Governmental Governmental IncreaseActivities Activities (Decrease)
2009 2008 From FYE 08
Current and other assets $ 29,205,060 $ 29,018,317 $ 186,743 Capital assets 63,115,916 65,807,399 (2,691,483) Other Non Current Assets 8,539,255 9,558,132 (1,018,877) Total assets 100,860,231 104,383,848 (3,523,617) Current liabilities 10,017,697 11,331,806 (1,314,109) Non-current liabilities 37,433,187 34,563,290 2,869,897 Total liabilities 47,450,884 45,895,096 1,555,788 Net assets: Invested in capital assets, net of debt 36,577,167 41,334,965 (4,757,798) Restricted 193,693 550,682 (356,989) Unrestricted 16,638,487 16,603,105 35,382 Total net assets $ 53,409,347 $ 58,488,752 $ (5,079,405)
The total assets of the City on June 30, 2009 were $100.9 million, while total liabilities were $47.5 million, resulting in net assets of $53.4 million. The largest component of the City’s net assets, $36.6 million, or 68.5%, reflects its investment in capital assets. Unrestricted net assets which represent funds that may be used at the City’s discretion increased $35,382. Total net assets decreased by $5.1 million. Some capital additions were financed through capital leases and therefore increased liabilities by $1.6 million. The amount by which depreciation exceeded capital outlays for the period was $1.8 million. Of the projects financed with the capital lease, $2.3 million was used for energy conservation measures. Operational savings of $1.9 million are guaranteed per contract over a twenty year period as a certified “Guaranteed Energy Savings Contract “as defined in the Kentucky Revised Statutes. The energy savings measures were not capitalized but expensed for the year, as they do not add to the economic useful life of the related assets. There was no corresponding increase to net assets when combined with new debt would account for the $5.1 million decrease in net assets.

15
CITY OF COVINGTON, KENTUCKY MANAGEMENT’S DISCUSSION AND ANALYSIS
(Continued)
Statement of Activities
Governmental Governmental IncreaseActivities Activities (Decrease)
2009 2008 From 2008Revenues:Program revenues: Charges for services $ 5,517,552 $ 5,239,308 $ 278,244 Operating grants and contributions 9,664,170 10,823,567 (1,159,397) Capital grants 1,650,920 2,050,654 (399,734) General revenues: Taxes 41,346,331 39,102,516 2,243,815 Interest 112,064 317,416 (205,352) Other 1,495,817 2,015,326 (519,509) Total revenues 59,786,854 59,548,787 238,067
Expenses: General government 11,008,141 7,807,872 3,200,269 Police 15,847,046 15,501,195 345,851 Fire 15,113,010 14,753,208 359,802 General services 7,185,210 5,995,347 1,189,863 Recreation 2,740,960 2,426,639 314,321 Housing and economic developmen 10,217,357 9,777,154 440,203 Parking Garage 701,986 747,677 (45,691) Interest on long term debt 2,052,549 1,935,242 117,307 Total expenses 64,866,259 58,944,334 5,921,925
Increase in net assets before transfers and other expenses (5,079,405) 604,453 (5,683,858) Transfers - - - Other expenses - - - Increase in net assets (5,079,405) 604,453 (5,683,858) Net assets - July 1 58,488,752 57,884,299 604,453 Net assets - June 30 $ 53,409,347 $ 58,488,752 $ (5,079,405)

16
CITY OF COVINGTON, KENTUCKY MANAGEMENT’S DISCUSSION AND ANALYSIS
(Continued)
Revenues for the City’s governmental activities were $59,768,854, an increase of $238,067 from the prior year. Taxes which include occupational license fees, property taxes, insurance premiums taxes, and net profit taxes increased $2,243,815 (5.7%) and represent 69.2% of all revenue. The biggest increases were realized in insurance premiums tax and property taxes. Operating grants and contributions decreased by $1,159,397. Prior year unobligated Community Development Block Grant funds that were spent in the 2007-2008 fiscal year were no longer available in fiscal year 2008-2009 and reserves that had accumulated in the Housing Voucher began to diminish with reduced subsidies from the Department of Housing and Urban Development. Total expenses for the City’s governmental activities were $64.9 million, a 10.1% increase from the prior year. The $2.3 million in energy conservation measures referenced above is the reason for the increase in General Government expenses. Increases in waste collection costs accounted for the sharp increase in General Service Expense. A mandatory toter program was implemented in May of 2008 and fiscal year 2008-2009 was the first full year for the program.
Fund Financial Statements
GENERAL FUND The following schedules and charts present a summary of the General Fund revenues and expenditures for the fiscal year ended June 30, 2009, and the amount and percentage of increases and decreases in relation to the prior year.
Increase Percent
FYE 2009 Percent (Decrease) Increase
Revenues Amount Of Total From FYE 2008 (Decrease)
Taxes $ 13,921,746 29.73% $ 885,552 7.34%
Licenses and permits 26,550,329 56.70% 192,853 0.91%
Intergovernmental 738,525 1.58% 229,612 24.37%
Fines and forfeitures 712,072 1.52% 42,812 8.94%
Charges for services 4,462,977 9.53% 259,363 7.19%
Interest 21,730 0.05% (69,785) -445.31%
Miscellaneous 415,657 0.89% 48,471 18.71%
Total revenues $ 46,823,036 100.00% $ 1,588,878 3.68%

17
CITY OF COVINGTON, KENTUCKY MANAGEMENT’S DISCUSSION AND ANALYSIS
(Continued)
Taxes which include real estate taxes, personal property taxes, and insurance premiums taxes increased modestly by $885,552. During the year, the Board of Commissioners approved an increase in the property tax rate from .2924 per $100 valuation to .2995 per $100 valuation. Total taxable assessed value increased by $66.9 million, or 3.4%. Increase in rate and assessed value combined for a $367,729 increase in property tax revenue. Insurance Premiums tax increased $570,434, or 11.7%. Insurance premiums tax had decreased $382,143, or 7.3% from the previous fiscal year and remains one of the least predictable revenue streams. Occupational License revenue includes both a payroll occupational license fee and a net profit occupational license fee on businesses. The payroll occupational license fee increased $409,687, or 1.8% and the net profit occupational license fee decreased $224,400, or 8.1% from the prior fiscal year. There is a real potential that growth rate for occupational license fees could continue to decline until the middle or end of 2010. The Covington Independent School District reimbursed the City for School Resource Officers for both the current fiscal but also the prior year as well. Total reimbursement was $200,000 and is the reason for the increase in Intergovernmental revenue. Interest income, which by contract is tied to Federal Funds rate, decreased due to historic low near zero Federal Fund rate.
2009 General Fund Revenues
30%2%9%
2%
0%
1%
56%
Property taxes $13,921,746
Licenses and permits $26,550,329
Intergovernmental $1,054,265
Charges for services $4,462,977
Fines $712,072
Interest $21,730
Miscellaneous $415,657

18
CITY OF COVINGTON, KENTUCKY MANAGEMENT’S DISCUSSION AND ANALYSIS
(Continued)
Increase PercentFYE 2009 Percent (Decrease) Increase
Expenditures Amount Of Total From FYE 2008 (Decrease)
General government $ 2,921,987 6.91% $ 28,435 1.16%Public safety 27,195,423 64.27% (127,138) -0.62%General services 6,690,503 15.81% 1,045,520 14.72%Recreation 2,533,103 5.99% 186,055 25.24%Code enforcement and economic development 1,452,438 3.43% 26,961 2.58%Parking garage 701,986 1.66% (45,691) -6.14%Debt service 819,539 1.94% (66,096) -14.38%
Total expenditures $ 42,314,979 100.00% $ 1,048,046 2.68%
Expenditures increased from the prior year by 2.68%, or $1,048,046. Personnel Costs represent 78.4% of all General Fund expenditures before transfers out to other funds. Overtime was reduced by $737,995 from $3.1 million in fiscal year 2007-2008 to $2.3 million in fiscal year 2008-2009. Public Safety was responsible for the overtime savings and explains the decrease in Public Safety expenses. Total personnel costs increased $368,511, or 1.1%.

19
CITY OF COVINGTON, KENTUCKY MANAGEMENT’S DISCUSSION AND ANALYSIS
(Continued)
A new waste collection contract was awarded at the end of the 2007-2008 fiscal year. Fiscal Year 2008-2009 was the first full year of the new contract with expanded service to include a mandatory toter program. As a result of the new expanded waste collection contract, expenditures for general Services jumped 14.72%. Motor Fuel costs and utilities have decreased $149,280, or 22.1% and $39,682, or 4.5% respectively.
2009 General Fund Expenditures
7%
34%
30%
16%
6%
2%
2%
3%
General Government $2,921,987
Police $14,350,564
Fire $12,835,651
General Services $6,690,503
Recreation $2,533,103
Code Enforcement andeconomic development $1,452,438 Parking Garage $701,986
Debt Service $819,539

20
CITY OF COVINGTON, KENTUCKY MANAGEMENT’S DISCUSSION AND ANALYSIS
(Continued)
Other Governmental Funds
The City’s governmental funds reported a combined ending fund balance of $5,944,993, an increase of $265,230 from the previous year. General Fund Balance increased $31,647. The US Department of Housing and Urban Development (HUD) is the funding source for the Housing Voucher Program. During the year, actual assistance payments to landlords exceeded payments from HUD by $338,114. A fund balance had accrued in the past which HUD had not reclaimed as unspent funds. HUD began to spend down the fund balance this current year causing the decrease in fund balance. The Sewer Maintenance Fund Special Revenue Account decreased $348,615. The Sewer Maintenance Fund Special Revenue Fund is used to retire debt owed to the Northern Kentucky Sanitation District. The decreases in Housing Voucher and Sewer Maintenance Fund were offset by increases in fund balances in other Non-Major Governmental Funds. Fund balances increased by $172,367 in the Newport Steel UDAG Fund and by $119,289 in the Investor Program Fund. The increases in Newport Steel UDAG Fund and the Investor Program Fund are the result of payments received on Economic Development loans issued by the City. The funds received will be available to lend again in an effort to facilitate business activity and job growth. The $400,000 increase in Working Capital Reserve fund balance consists of a transfer from General Fund. The fund balance from the Working Capital Reserve is combined with the fund balance of the General Fund to calculate the City’s progress toward a minimum 5% of General Fund revenue fund balance retention policy. Disbursements from the fund can only be made by resolution adopted by the Board of Commissioners. No disbursements from the Working Capital Reserve have been approved since its inception.
General Fund Budgetary Highlights
Over the course of the fiscal year, the City Commission approved revisions of the General Fund budget one time. The total budget was not changed. The General Fund revenue budget was also not changed. Only the departmental budgets were adjusted. The budget amendment was made to more closely reflect the anticipated actual expense for the year and to formally adopt as part of the budget changes in staff or activities that were approved by the City Commission during the year. General Fund revenue including transfers in was 98.0% of budget and General Fund expense including transfers out was 97.9% of budget

21
CITY OF COVINGTON, KENTUCKY MANAGEMENT’S DISCUSSION AND ANALYSIS
(Continued)
DEBT AND CAPITAL ASSET ADMINISTRATION
Debt Administration
At year-end, the City had $42,006,452 in outstanding notes, capital leases, bonds, and uncompensated absences compared to $40,511,669 the prior year. The following is a summary of the changes in the City’s outstanding long-term debt from fiscal year 2008 to fiscal year 2009.
GovernmentalActivities
2009 2008
Mortgage Bonds payable (backed by city) $ 21,015,581 $ 22,783,036 Note payable (backed by city) 606,130 1,006,916 Capital lease obligations (backed by city) 18,781,698 15,271,145 Compensated Absences 1,603,043 1,450,572
Totals $ 42,006,452 $ 40,511,669
A capital lease in the amount of $4,509,181 was signed with the Kentucky League of Cities Funding Trust Program to subsidize various projects. Of the $4,509,181 that was borrowed, $2,254,211 was disbursed for energy conservation measures as defined in the Kentucky Revised Statute, Section 45A.352 et seq. In addition, two pumpers and a staff car were purchased for the Fire Department. Ten new police cruisers were purchased as part of its regular fleet replacement program. Communication equipment at the public safety dispatch center was replaced. Principal payments of $3,166,869 were made during the year. The Kentucky Constitution states that the total principal amount of City indebtedness, which excludes self-supporting obligations, revenue bonds, special assessment debt, and non-tax supported debt, cannot exceed 10% of the value of taxable property in the City. The debt limit for the City of Covington is $205 million. Additional information on the City’s long-term debt can be found on pages 44-49.

22
CITY OF COVINGTON, KENTUCKY MANAGEMENT’S DISCUSSION AND ANALYSIS
(Continued)
Capital Assets
The City’s capital assets, net of depreciation as of June 30, 2009 totaled $63,115,916, a decrease of $2,690,483 from last year. This year’s major capital additions are as follows: Land Acquisition Restricted for Development $ 618,700 Building & Land Improvements City Hall 25,298 Meinken Field 30,721 Infrastructure Including Street Resurfacing Etc. 1,118,322 Communication Systems for Public Safety 85,668 Police Cruisers 236,790 General Service Trucks & Equipment 639,611 Fleet – Code Enforcement 119,394 Construction in Progress 105,606 The following is a summary of changes in the City’s capital assets from fiscal year 2008 to fiscal year 2009.
Governmental
Activities
2009 2008
Land $ 14,971,764 $ 15,078,717
Land improvements 1,288,802 1,276,802
Building 23,114,294 23,095,573
Building Improvements 8,477,032 8,438,401
Vehicles 10,213,327 9,852,183
Other equipment 4,780,087 4,510,852
Public domain infrastructure 106,537,828 105,518,537
Construction in progress 1,242,099 986,667
TOTALS $ 170,625,233 $ 168,757,732
The Engineering Department presented an evaluation of Covington’s worst streets and proposed a strategy to address the funding needs. An estimate of $7.5 million of capital investment would be required to address the worst streets. An investment of this amount would also mean that future capital requirements for ongoing preventive and routine street maintenance could be budgeted at approximately $2 to $3 million annually. Budget priority will be given in fiscal year 2009-2010 to address the targeted worst streets. Additional information on the City’s capital assets can be found on page 42.

23
CITY OF COVINGTON, KENTUCKY MANAGEMENT’S DISCUSSION AND ANALYSIS
(Continued)
ECONOMIC FACTORS AND NEXT YEAR’S BUDGET
The budget for the 2010 fiscal year was developed to maintain current levels of City services and staffing. Increasing General Fund and Working Capital Reserve fund balances, control of salary and health care costs, and continuation of basic city services without any layoffs or other service reductions remain the primary goal. Significant progress has been made on increasing the City’s financial reserves. As discussed in the financial highlights, the combined fund balance in the General Fund and the Working Capital Reserve is $2,542,233, or 5.4%, of General Fund revenue. Four years ago, the combined fund balance in the General Fund and Working Capital Reserve was $235,127, or .6%, of General Fund revenue. The City, however, continues to under fund its capital investment. Over the next five years an investment of $47.2 million is required. The 2010 budget includes only $6.1 million in capital investment which is well short of the $9.4 million per year average that is required. With progress toward the minimum financial reserves, plans will be focused on increasing investment in capital assets. The economic outlook is gloomy for the coming year. Revenue estimates have been reduced. The housing mortgage crisis and credit crunch will continue to dampen growth. With the economic slowdown, job expansion is not expected until after June 30, 2010.
CONTACTING THE CITY’S FINANCIAL MANAGEMENT This financial report is designed to provide our citizens, taxpayers, customers, and creditors with a general overview of the City’s finances and to show the City’s accountability for the money it receives. If you have questions about this report or need additional financial information, contact Robert J. Due, Finance Director, 638 Madison Avenue, Covington, Kentucky 41011. Questions or requests for additional information can also be e-mailed to [email protected].

CITY OF COVINGTON, KENTUCKYSTATEMENT OF NET ASSETS
June 30, 2009
Primary ComponentGovernment Unit
Governmental Activities
Devou Properties,
Inc.Assets Current Assets Cash and Cash Equivalents $ 6,073,240 $ 1,697,010 Receivables Property Taxes 633,041 - Intergovernmental 263,890 - Notes 15,028,368 - Accounts 6,348,228 179,827 Prepaids 41,414 3,460 Due from Pension Trust Funds 816,879 -
Total Current Assets 29,205,060 1,880,297
Noncurrent Assets Deferred Charges, Net 354,074 - Net Pension Obligation Asse 8,185,181 - Land and Construction in Progress 17,502,665 - Depreciable Capital Assets 153,122,568 17,184 Less Accumulated Depreciation (107,509,317) (12,736)
Total Noncurrent Assets 71,655,171 4,448
Total Assets 100,860,231 1,884,745
Liabilities Current Liabilities Accounts Payable 1,326,576 74,059 Accrued Liabilities 2,678,192 10,228 Accrued Interest Payable 132,980 - Unearned Revenue 1,108,445 339,153 Line of Credit 198,239 Accumulated Compensated Absences 1,603,043 - Current Portion of Capital Lease Obligations 1,118,478 - Current Portion of Bonds and Notes Payable 1,851,744 -
Total Current Liabilities 10,017,697 423,440
Noncurrent Liabilities Noncurrent Portion of Capital Lease Obligations 17,663,220 - Noncurrent Portion of Bonds and Notes Payable 19,769,967 -
Total Noncurrent Liabilities 37,433,187 -
Total Liabilities 47,450,884 423,440
Net Assets Invested in Capital Assets, Net of Related Deb 36,577,167 4,448 Restricted for Debt Service 193,693 - Unrestricted 16,638,487 1,456,857
Total Net Assets $ 53,409,347 $ 1,461,305
See accompanying notes
24

CITY OF COVINGTON, KENTUCKYSTATEMENT OF ACTIVITIES
Year Ended June 30, 2009
and Changes in Net AssetsPrimary
Operating Capital Grants GovernmentCharges for Grants and and Governmental Component
Functions/Programs Expenses Services Contributions Contributions Activities Unit
Primary GovernmentGovernmental Activities
General Government $ 11,008,141 $ 993,267 $ 213,448 $ 950,047 $ (8,851,379) Police 15,847,046 406,557 898,749 169,604 (14,372,136) Fire 15,113,010 1,077,448 - 6,215 (14,029,347) General Services 7,185,210 1,859,171 328,883 521,792 (4,475,364) Recreation 2,740,960 - - - (2,740,960) Code Enforcement and Economic Development 10,217,357 37,833 8,223,090 3,262 (1,953,172) Parking Garage 701,986 1,143,276 - - 441,290 Interest on Long-Term Debt 2,052,549 - - - (2,052,549)
Total Governmental Activities 64,866,259 5,517,552 9,664,170 1,650,920 (48,033,617)
Total Primary Government $ 64,866,259 $ 5,517,552 $ 9,664,170 $ 1,650,920 (48,033,617)
Component Unit
Devou Properties, Inc. $ 577,560 $ 895,759 $ - $ - $ 318,199
General revenues: Taxes Real Property Taxes, Levied for General Purposes 6,024,885 - Personal Property Taxes, Levied for General Purposes 653,748 - Public Service Taxes 2,140,821 - Taxes, Levied for Bank Deposits 53,161 - Insurance Premium Taxes 5,430,628 - Payroll Taxes 23,697,247 - Net Profits Taxes 2,555,089 - Other Taxes 790,752 - Investment Earnings 112,064 36,039 Miscellaneous 1,495,817 -
Total General Revenues 42,954,212 36,039
Change in Net Assets (5,079,405) 354,238
Net Assets June 30, 2008 58,488,752 1,107,067
Net Assets June 30, 2009 $ 53,409,347 $ 1,461,305
See accompanying notes
25
Net (Expense) RevenueProgram Revenue

CITY OF COVINGTON, KENTUCKYBALANCE SHEET
GOVERNMENTAL FUNDSJune 30, 2009
General Fund
Community Development Block Grant
HOME Program
Housing Voucher Program
Non-Major Governmental
Funds
Total Governmental
FundsAssets Cash and Cash Equivalents $ 788,360 $ - $ 111,055 $ 1,663,729 $ 2,077,000 $ 4,640,144 Receivables Taxes 633,041 - - - - 633,041 Intergovernmental - 172,402 42,091 - 49,397 263,890 Notes - 6,931,024 5,537,760 - 2,559,584 15,028,368 Accounts 5,308,700 - - 14,071 1,025,457 6,348,228 Due from Other Funds 2,147,470 505,703 31,629 - 1,859,176 4,543,978 Prepaids 41,414 - - - - 41,414
Total Assets $ 8,918,985 $ 7,609,129 $ 5,722,535 $ 1,677,800 $ 7,570,614 $ 31,499,063
Liabilities and Fund Balances Liabilities Accounts Payable $ 1,043,264 $ 24,252 $ 8,000 $ 47,026 $ 201,249 $ 1,323,791 Accrued Liabilities 1,390,512 - - - - 1,390,512 Due to Other Funds 3,403,415 - - 17,045 1,373,018 4,793,478 Deferred Revenue 2,309,825 7,584,877 5,537,760 54,888 2,558,939 18,046,289
Total Liabilities 8,147,016 7,609,129 5,545,760 118,959 4,133,206 25,554,070
Fund Balances Reserved for: Prepaids 41,414 - - - - 41,414 Unreserved Undesignated, Reported In General Fund 730,555 - - - - 730,555 Special Revenue Funds - - 176,775 1,558,841 3,085,464 4,821,080 Capital Projects Funds - - - - 158,251 158,251 Debt Service Funds - - - - 193,693 193,693
Total Fund Balances 771,969 - 176,775 1,558,841 3,437,408 5,944,993
Total Liabilities and Fund Balances $ 8,918,985 $ 7,609,129 $ 5,722,535 $ 1,677,800 $ 7,570,614 $ 31,499,063
See accompanying notes
26

CITY OF COVINGTON, KENTUCKYRECONCILIATION OF THE BALANCE SHEET - GOVERNMENTAL FUNDS TO
THE STATEMENT OF NET ASSETSJune 30, 2009
Total Fund Balance - Governmental Funds $ 5,944,993
Amounts reported for governmental activities in the Statement of Net Assets are different because:
Capital assets used in governmental activities are not current financial resources and therefore are not reported in this fund financial statement, but are reported in the governmental activities of the Statement of Net Assets.
Cost of Capital Assets $ 170,625,233 Accumulated Depreciation (107,509,317)
63,115,916 Certain other long-term assets are not available to pay current period expenditures and are therefore deferred in the funds. 16,937,850
Internal service funds are used by management to charge the cost of certain activities, such as liability and health and dental insurance, to individual funds. The assets and liabilities of the internal service funds must be added to the statement of net assets. The assets and liabilities of the internal service funds are:
Cash and Cash Equivalents 1,433,096 Due From Other Funds 1,093,740 Accounts Payable (2,791) Estimated Liability for Claims (1,287,680) Due to Other Funds (27,361)
1,209,004
Deferred charges represent costs related to the issuance of new bonds and also refunding costs. Deferred charges are reported as an other use of funds in the governmental funds statements. However, on the government wide statement of net assets these costs are capitalized and reported as a deferred charge, and amortized over the life of the related bonds. 354,074
Net pension obligation asset represents contributions made to the City's pension funds in excess of the actuarially required contribution. The excess contributions are capitalized and amortized. 8,185,181
Interest payable on long term debt does not require current financial resources. Therefore accrued interest payable is not reported as a liability in the governmental funds balance sheet. (132,980)
Some capital additions were financed through a line of credit. In governmental funds, a line of credit is considered a source of financing, but in the Statement of Net Assets, the obligation is reported as a liability. (198,239)
Long-term liabilities, including bonds payable, are not due and payable in the current period and therefore are not reported as liabilities in the funds. Long-term liabilities at year end consist of:
Bonds Payable 21,621,711 Capital Lease Obligations Payable 18,781,698 Compensated Absences Payable 1,603,043
(42,006,452)
Total Net Assets - Governmental Activities $ 53,409,347
See accompanying notes.
27

CITY OF COVINGTON, KENTUCKYSTATEMENT OF REVENUES, EXPENDITURES AND CHANGES IN FUND BALANC
GOVERNMENTAL FUNDSYear Ended June 30, 2009
General Fund
Community Development Block Grant
HOME Program
Housing Voucher Program
Non-Major Governmental
Funds
Total Governmental
Funds Revenues Taxes $ 13,921,746 $ - $ - $ - $ 785,551 $ 14,707,297 Licenses and Permits 26,550,329 - - - - 26,550,329 Intergovernmental 738,525 1,462,656 1,106,412 5,770,696 2,613,174 11,691,463 Charges for Services 4,462,977 - - - 281,081 4,744,058 Fines and Forfeitures 712,072 - - - - 712,072 Investment Earnings 21,730 - 1,159 17,073 59,657 99,619 Miscellaneous 415,657 390,719 336,941 13,834 400,717 1,557,868
Total Revenues 46,823,036 1,853,375 1,444,512 5,801,603 4,140,180 60,062,706
Expenditures Current General Government 2,921,987 - - - 861,536 3,783,523 Police 14,350,564 - - - 536,297 14,886,861 Fire 12,844,859 - - - 470,668 13,315,527 General Services 6,690,503 - - - - 6,690,503 Recreation 2,533,103 - - - - 2,533,103 Code Enforcement and Economic Development 1,452,438 765,974 1,371,600 6,139,717 408,841 10,138,570 Parking Garages 701,986 - - - - 701,986 Debt Service Principal 553,137 67,000 - - 2,896,380 3,516,517 Interest and Other Charges 266,402 29,492 - - 1,758,622 2,054,516 Capital Outlay - 1,003,534 - - 5,702,308 6,705,842
Total Expenditures 42,314,979 1,866,000 1,371,600 6,139,717 12,634,652 64,326,948
Excess (Deficit) of Revenues Over Expenditures 4,508,057 (12,625) 72,912 (338,114) (8,494,472) (4,264,242)
Other Financing Sources (Uses) Transfers In 1,095,000 - - - 4,968,518 6,063,518 Proceeds from Sale of Land - 323,625 304,929 628,554 Proceeds from Short Term Debt - - - - 75,419 75,419 Capital Lease Acquisitions - - - - 4,509,181 4,509,181 Transfers Out (5,571,410) (311,000) - - (864,790) (6,747,200)
Total Other Financing Sources (Uses) (4,476,410) 12,625 - - 8,993,257 4,529,472
Net Change in Fund Balances 31,647 - 72,912 (338,114) 498,785 265,230
Fund Balance July 1, 2008 740,322 - 103,863 1,896,955 2,938,623 5,679,763
Fund Balance June 30, 2009 $ 771,969 $ - $ 176,775 $ 1,558,841 $ 3,437,408 $ 5,944,993
See accompanying notes
28

CITY OF COVINGTON, KENTUCKYRECONCILIATION OF THE STATEMENT OF REVENUES, EXPENDITURE
AND CHANGES IN FUND BALANCE - GOVERNMENTAL FUNDS TOTHE STATEMENT OF ACTIVITIES
Year Ended June 30, 2009
Change in Fund Balances - Total Governmental Funds $ 265,230
Amounts reported for Governmental Activities in the Statement of Activities are different because:
Capital Outlays to purchase or build capital assets are reported in governmentafunds as expenditures. However, for governmental activities those costs are shown in the statement of net assets and allocated over their estimated useful lives as annual depreciation expense in the statement of activities. This is the amount by which depreciation expense exceeds capital outlays in the period.
Depreciation Expense $ (4,900,978) Capital Outlays 3,021,526
(1,879,452)
Governmental funds report the entire net sales price (proceeds) from sale of an asset as revenue because it provides current financial resources. In contrast, the Statement of Activities reports only the gain or loss on the sale of the assets. Thus, the change in net assets differs from the change in fund balance by the net book value of the asset sold. (812,030)
Governmental funds do not present revenues that are not available to pay current obligations. In contrast, such revenues are reported in the Statement ofActivities when earned. (3,294)
Repayment of bond, note and capital lease principal is an expenditure in the governmental funds, but it reduces long-term liabilities in the statement of net assets and does not affect the statement of activities. 3,166,869
The Statement of Activities reports annual pension cost, which includes the actuarially required contribution along with an interest factor and adjustment of the net pension obligation asset. (1,051,091)
Accrued interest not reflected on Governmental funds. 14,472
In the Statement of Activities, compensated absences (sick leave) are measured by the amounts earned during the year. In the governmental funds, however, expenditures for these items are measured by the amount of financial resources used (essentially, the amounts actually paid). The additional expense reported in the statement of activities is a result of the change in long-term accumulated sick leave. (152,471)
Repayments of line of credit is an expenditure in the governmental funds, but it reduces liabilities in the statement of net assets and does not affect the statement of activities. 229,508
Some capital additions were financed through capital leases. In governmental funds, a capital lease arrangement is considered a source of financing, but in the Statement of Net Assets, the lease obligation is reported as a liability.
(4,509,181)
Costs related to the new capital leases are reported as an other use of funds in the governemental funds financial statements. However, on the government-wide statement of net assets these costs are capitalized and reported as a deferred charge, and subsequently amortized over the life of the related capital lease. 83,970
Costs related to the issuance of new bonds and deferred refunding costs are reported as an other use of funds in the governmental funds financial statements. However, on the government-wide statement of net assets, these costs are capitalized and reported as a deferred charge, and subsequently amortized over the life of the related bonds. This is the amount of current year amortization expense. (51,752)
Internal service funds are used by management to charge the costs of certain activities, such as fleet maintenance and information technology, to individual funds. The net revenue (expense) of certain internal service funds is reported with governmental activities. (380,183)
Total Change in Net Assets - Governmental Activities $ (5,079,405)
See accompanying notes.
29
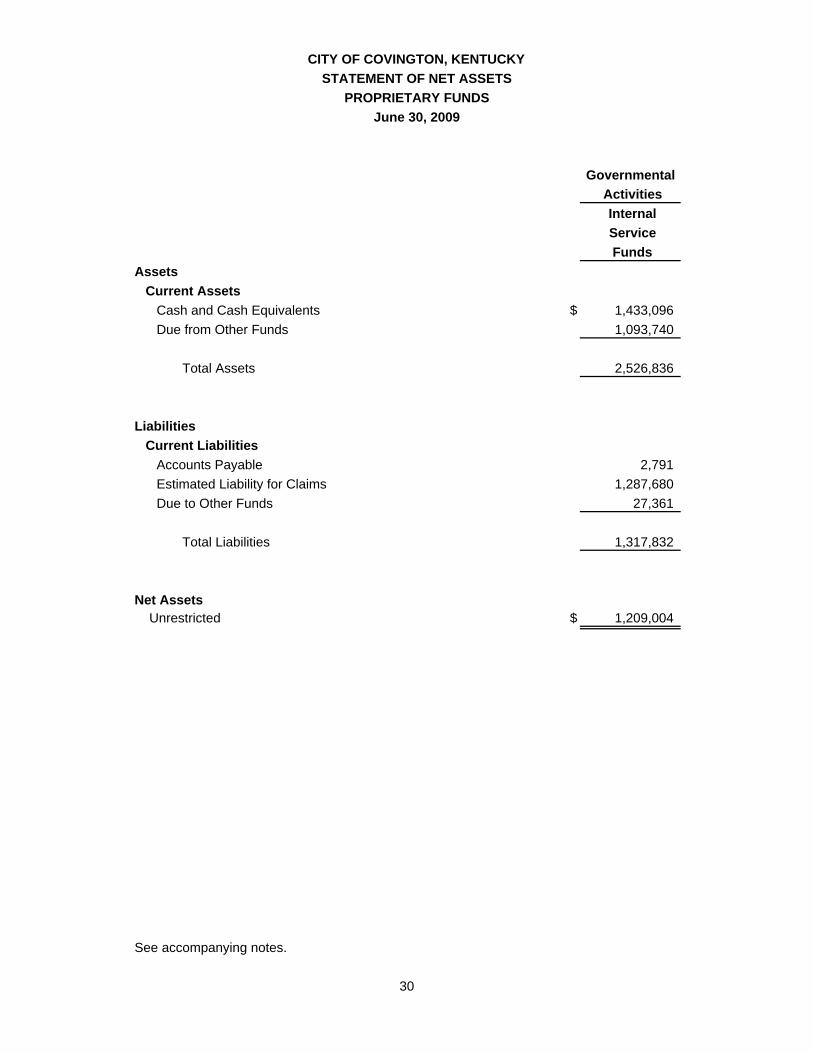
CITY OF COVINGTON, KENTUCKY
STATEMENT OF NET ASSETS
PROPRIETARY FUNDS
June 30, 2009
Governmental
Activities
Internal
Service
Funds
Assets
Current Assets
Cash and Cash Equivalents $ 1,433,096
Due from Other Funds 1,093,740
Total Assets 2,526,836
Liabilities
Current Liabilities
Accounts Payable 2,791
Estimated Liability for Claims 1,287,680
Due to Other Funds 27,361
Total Liabilities 1,317,832
Net Assets Unrestricted $ 1,209,004
See accompanying notes.
30

CITY OF COVINGTON, KENTUCKY
STATEMENT OF REVENUES, EXPENSES AND CHANGES IN FUND NET ASSETS
PROPRIETARY FUNDS
Year Ended June 30, 2009
Governmental
Activities
Internal
Service
Funds
Operating Revenues
Insurance Premium Payments $ 5,179,713
Other Operating Revenues 148,308
Total Operating Revenues 5,328,021
Operating Expenses
Contractual Services 643,617
Claims and Judgments 5,760,714
Total Operating Expenses 6,404,331
Operating Loss (1,076,310)
Non-Operating Revenues
Investment Income 12,445
Loss Before Transfers (1,063,865)
Transfers In 683,682
Change in Net Assets (380,183)
Net Assets July 1, 2008 1,589,187
Net Assets June 30, 2009 $ 1,209,004
See accompanying notes.
31

Governmental
Activities
Internal
Service
Funds
Cash Flows From Operating Activities
Cash Received from Other Funds $ 6,173,201
Cash Received from Other Activities 148,308
Cash Paid for Claims (6,227,611)
Net Cash Used by Operating Activities 93,898
Cash Flows from Non-Capital Financing Activities
Transfer from Other Funds 683,682
Cash Flows from Investing Activities
Interest Income 12,445
Net Change in Cash 790,025
Cash and Cash Equivalents July 1, 2008 643,071
Cash and Cash Equivalents June 30, 2009 $ 1,433,096
Reconciliation of Operating Loss to Net
Cash Used by Operating Activities
Operating Loss $ (1,076,310)
Change in Assets and Liabilities
Accounts Receivable 210,968
Due from Other Funds 1,305,159
Accounts Payable (48,929)
Estimated Liability Claims 225,649
Due to Other Funds (522,639)
Net Cash Used by Operating Activities $ 93,898
See accompanying notes.
32
CITY OF COVINGTON, KENTUCKY
STATEMENT OF CASH FLOWS
PROPRIETARY FUNDS
Year Ended June 30, 2009

CITY OF COVINGTON, KENTUCKY
STATEMENT OF FIDUCIARY NET ASSETS
FIDUCIARY FUNDS
June 30, 2009
Fiduciary
Funds
Assets
Cash and Cash Equivalents $ 1,487,360
Investments - Mutual Funds 12,444,623
Notes Receivable 2,582
Total Assets 13,934,565
Liabilities
Accounts Payable 945
Due to Other Funds 816,879
Total Liabilities 817,824
Net Assets Held in Trust for Pension Benefits $ 13,116,741
See accompanying notes.
33

CITY OF COVINGTON, KENTUCKY
STATEMENT OF CHANGES IN FIDUCIARY NET ASSETS
FIDUCIARY FUNDS
Year Ended June 30, 2009
Fiduciary
Funds
Additions
Contributions
Employee Contributions $ 8,485
Impounding Lot 116,353
Total Revenues 124,838
Investment Earnings
Interest and Dividends 586,876
Net (Depreciation) in
Fair Value of Investments (4,224,307)
Total Investment Earnings (3,637,431)
Total Additions (3,512,593)
Deductions
Benefit Payments 2,337,984
Administration 62,805
Impounding Lot 10,111
Total Deductions 2,410,900
Change in Net Assets (5,923,493)
Net Assets July 1, 2008 19,040,234
Net Assets June 30, 2009 $ 13,116,741
See accompanying notes.
34

35
CITY OF COVINGTON, KENTUCKY NOTES TO THE FINANCIAL STATEMENTS
NOTE 1 – SUMMARY OF SIGNIFICANT ACCOUNTING POLICIES
Basis of Presentation The basic financial statements of the City of Covington, Kentucky, have been prepared in conformity with U.S. generally accepted accounting principles (GAAP) as applied to government units. The Governmental Accounting Standards Board (GASB) is the accepted standard-setting body for establishing governmental accounting and financial reporting principles. The significant accounting policies of the City are described below. Financial Reporting Entity The City of Covington is a municipality that operates under a City Manager form of government. Legislative authority is vested in the elected Mayor and four City Commissioners. As required by U.S. generally accepted accounting principles, these financial statements present the government and its component units, entities for which the government is considered to be financially accountable. Blended component units, although legally separate entities are, in substance, part of the government's operations and so data from these units are combined with data of the primary government. Each blended component unit of the City has a June 30 year end. The component units discussed below are included in the City's reporting entity as part of the primary government because of the significance of its operational and/or financial relationship with the City. Blended Component Units Included Within the Reporting Entity: City of Covington Non-Uniformed Employees' Pension Fund Certain City employees participate in the non-uniformed employee pension fund. The fund functions for the benefit of these employees and is governed by a four member board of trustees. The mayor, finance director, and two appointed and approved employees constitute the board. The City and plan participants are obligated to fund all costs based upon actuarial valuations. City of Covington Police and Firemen's Pension Fund All public safety employees who retired prior to August 1, 1989 participate in the Police & Firemen's Pension Fund. The fund functions for the benefit of the retirees and is governed by a four member board of trustees, the mayor, finance director and two public safety retirees. The City is obligated to fund all costs based upon actuarial valuations. City of Covington Municipal Properties Corporation The City of Covington Municipal Properties Corporation was formed to act as an agent and to be instrumental in the financing of public improvements and projects of a capital nature for the City and for the particular purpose of acquiring real estate located within the City and constructing, acquiring and equipping thereon capital improvements, facilities, buildings, structures and related appurtenances. The Corporation finances these projects by the issuance of debt. These debt issues are secured by (1) first mortgage liens on the projects, (2) lease and option agreements between the Corporation and the City, the construction agreements and pledged receipts. The lease and option agreements require the City to pay rental, on a yearly basis with the option to renew each year, equal to the amount of bonds and interest coupons coming due in that year. If the City renews the leases from year-to-year, and pays the rentals for each year as stipulated, and when the Corporation has fully paid and retired all of the bonds, the Corporation agrees it will convey the properties to the City free and clear.

CITY OF COVINGTON, KENTUCKY
36
NOTE 1 – SUMMARY OF SIGNIFICANT ACCOUNTING POLICIES (Continued) Discretely Presented Component Units Included Within the Reporting Entity:
Devou Properties, Inc. (a non-profit organization) is included in the City’s financial statements as a discretely presented component unit. Although a legally separate entity, Devou Properties, Inc. is included in these financial statements because of is financial accountability to the City. Devou Properties, Inc. was formed to maintain and operate the Drees Pavilion at Devou Memorial Overlook for the City of Covington, for the benefit of Devou Park. Devou Properties, Inc. is responsible for renting out the facilities for events, including weddings, receptions and corporate events. Directors of Devou Properties, Inc. are appointed by the City’s Board of Commissioners, upon the recommendation of the Mayor. Any excess funds from operations of the facility are to be set aside to be used on Devou Park projects. As a discretely presented component unit, the financial statements of Devou Properties, Inc. are only included on the City’s government-wide financial statements in a column that makes it clearly separate from the primary government. Devou Properties, Inc. operates on a calendar year-end basis therefore the financial statements for the year ended December 31, 2008 are included in the City’s current financial statements. Audited financial statements of Devou Properties, Inc. are available and may be obtained by contacting the City Manager.
Basis of Presentation Government-Wide Financial Statements The government-wide financial statements (i.e., the statement of net assets and the statement of activities) report information on all of the non-fiduciary activities of the primary government. For the most part, the effect of interfund activity has been removed from these statements, however interfund services provided and used are not eliminated. Governmental activities, which are normally supported by taxes and intergovernmental revenues, are reported separately from business-type activities, which rely to a significant extent on fees and charges for support. The statement of activities demonstrates the degree to which direct expenses of a given function or segments are offset by program revenues. Direct expenses are those clearly identifiable with a specific function or segment. Program revenues include 1) charges to customers or applicants who purchase, use or directly benefit from goods, services or privileges provided by a given function or segment and 2) grants and contributions that are restricted to meeting the operational or capital requirements of a particular function or segment. Taxes and other items not properly included among program revenues are reported instead as general revenues. Amounts paid to acquire capital assets are capitalized as assets in the government-wide financial statements, rather than reported as an expenditure. Proceeds of long-term debt are recorded as a liability in the government-wide financial statements, rather than as another financing source. Amounts paid to reduce long-term indebtedness of the reporting government are reported as a reduction of the related liability, rather than as an expenditure. Measurement Focus, Basis of Accounting and Financial Statement Presentation The government-wide financial statements are reported using the economic resources measurement focus and the accrual basis of accounting as are the proprietary fund financial statements. Revenues are recorded when earned and expenses are recorded when a liability is incurred, regardless of the timing of related of the cash flows. Property taxes are recognized as revenues in the year for which they are levied. Grants and similar items are recognized as revenue as soon as all eligibility requirements imposed by the provider have been met.

CITY OF COVINGTON, KENTUCKY
37
NOTE 1 – SUMMARY OF SIGNIFICANT ACCOUNTING POLICIES (Continued) Governmental fund financial statements are reported using the current financial resources measurement focus and the modified accrual basis of accounting. Revenues are recognized as soon as they are both measurable and available. Revenues are considered to be available when they are collectible within the current period or soon enough thereafter to pay liabilities of the current period. For this purpose, the government considers revenues to be available if they are collected within 60 days of the end of the current fiscal period. Material revenues susceptible to accrual are payroll license fees, insurance fees and grant revenues. Expenditures generally are recorded when a liability is incurred, as under accrual accounting. However, debt service expenditures, as well as expenditures related to compensated absences and claims and judgments, are recorded only when payment is due. The government reports the following funds of the financial reporting entity:
The general fund is the government's primary operating fund. It accounts for all financial resources of the general government, except for those required to be accounted for in another fund.
The special revenue funds are used to account for the proceeds of specific revenue sources that are restricted to expenditures for specific purposes.
The capital projects funds are used to account for the accumulation of specific resources that are intended to be used for future capital improvements.
The debt service funds are used to account for the accumulation of resources for, and the payment of, general long-term debt principal and interest.
Proprietary funds distinguish operating revenues and expenses from non-operating revenues and expenses. Operating revenues and expenses generally result from providing services in connection with a proprietary fund's principal ongoing operations. All revenues and expenses not meeting this definition are reported as non-operating revenues and expenses.
The government reports the following proprietary funds:
The City has two internal service funds. One fund is for self-insurance for the City's health and dental insurance program for City employees. The second fund is for the self-insurance of the City's liability claims.
Additionally, the City reports two fiduciary funds. The two pension trust funds account for the activities of the Employees' Retirement Fund and the Police and Firemen's Pension Fund. These funds are for the accumulation of resources for pension benefit payments to qualified retired employees. The City reports the following major governmental funds:
The General Fund is the government's primary operating fund. It accounts for all financial resources of the general government that are not accounted for in the other funds.
The Community Development Block Grant Fund accounts for entitlements to the City under the provisions of Title 1 of the Housing and Development Act of 1974. Resources may only be used for activities which are directed toward developing urban communities and economic opportunities for persons of low and moderate income.
The HOME Program Fund Accounts for resources provided by the U.S. Department of Housing and Urban Development under the HOME Program. Proceeds are used for deferred loans which are used to acquire, construct or rehabilitate housing for low income families.
The Housing Voucher Fund accounts for funds provided to the City by the U.S. Department of Housing and Urban Development Section 8 rent subsidy program. Resources are used for the payment of rent subsidies to landlords on behalf of qualified tenants.

CITY OF COVINGTON, KENTUCKY
38
NOTE 1 – SUMMARY OF SIGNIFICANT ACCOUNTING POLICIES (Continued) Assets, Liabilities and Net Assets or Equity: Cash and Cash Equivalents Cash and cash equivalents includes amounts in demand deposits as well as short-term investments with an initial maturity date within three months of the date acquired by the City. The City is authorized by state statute to invest in:
Obligations of the United States and of its Agencies and Instrumentalities Certificates of Deposits Banker's Acceptances Commercial Paper Bonds of Other State or Local Governments Mutual Funds
Investments In accordance with Government Accounting Standards Board Statement No. 31, investments held at June 30, 2009 are recorded at fair value based on quoted market prices. Types of investments allowable in the Pension Trust Funds are governed by the Pension Board of Trustees. All investments are stated in accordance with Statement No. 31. Property Tax Receivable Property taxes are levied as of January 1 on property values assessed as of the same date. The taxes are billed on approximately August 15 and are due and payable on September 30. On October 1, the bill becomes delinquent and penalties and interest may be assessed by the City. A lien may be placed on the property on October 1. Notes Receivable Notes receivable are carried at their unpaid principal balance. Short-Term Interfund Receivables/Payables During the course of operations, numerous transactions occur between individual funds for goods provided or services rendered. These receivables and payables are classified as "due from/to other funds" on the balance sheet. Short-term interfund loans are classified as "interfund receivables/payables". Inventories Inventories are valued at cost, which approximates market, using the first-in/first-out (FIFO) method. The costs of governmental fund-type inventories are recorded as expenditures when consumed rather than when purchased. Prepaid Items Payments made to vendors for services that will benefit periods beyond June 30, 2009 are recorded as prepaid items in both the government wide and fund statements. Capital Assets General capital assets are those assets not specifically related to activities reported in a propriety fund. These assets are reported in the governmental activities column of the government-wide statement of net assets.

CITY OF COVINGTON, KENTUCKY
39
NOTE 1 – SUMMARY OF SIGNIFICANT ACCOUNTING POLICIES (Continued) The accounting and reporting treatment applied to capital assets associated with a fund are determined by its measurement focus. General capital assets are long-lived assets of the City as a whole. When purchased, such assets are recorded as expenditures in the governmental funds and capitalized. Infrastructure, such as streets, traffic signals and signs are capitalized, including infrastructure acquired prior to the implementation of the GASB Statement entitled “Basic Financial Statements and Management’s Discussion and Analysis for State and Local Governments”. The valuation basis for general capital assets are historical costs, or where historical cost is not available, estimated historical cost based on replacement cost. Donated capital assets are recorded at their fair market value on the date donated. Repairs and maintenance are recorded as expenses. Renewals and betterments are capitalized. The City maintains a capitalization threshold of one thousand dollars with the exception of Infrastructure for which the threshold is twenty-five thousand dollars. Capital assets used in operations are depreciated over their estimated useful lives using the straight-line method in the government-wide financial statements. Depreciation is charged as an expense against operations and accumulated depreciation is reported on the respective balance sheet. The range of lives used for depreciation purposes for each fixed asset class is as follows: Governmental Activities Description Estimated Lives Buildings 30 Years Building Improvements 10 – 20 Years Public Domain Infrastructure 25 – 35 Years Vehicles 5 – 10 Years Office Equipment 3 – 10 Years Compensated Absences Vested or accumulated vacation leave that has matured and is expected to be liquidated with expendable available financial resources is reported as an expenditure and a fund liability of the governmental fund that will pay it. In accordance with the provisions of Governmental Accounting Standards, no liability is recorded for non-vesting accumulating rights to receive sick pay benefits. Long-Term Obligations The accounting treatment of long-term debt depends on whether the assets are used in governmental fund operations or proprietary fund operations and whether they are reported in the government-wide or fund financial statements. In the government-wide financial statements, and proprietary fund types in the fund financial statements, long-term debt and other long-term obligations are reported as liabilities in the governmental activities, statement of net assets. Bond premiums and discounts, as well as issuance costs, are deferred and amortized over the life of the bonds. Long-term debt for governmental funds is not reported as liabilities in the fund financial statements. The debt proceeds are reported as revenue and payment of principal and interest reported as expenditures. The accounting for the proprietary fund is the same in the fund statements as it is in the government-wide statements. Unearned/Deferred Revenue In the government-wide financial statements, unearned revenue represents the amount for which revenue recognition criteria have not been met. In subsequent periods, when the incurrence of qualifying expenditures has been made, the liability for the unearned revenue is removed and the revenue is recognized. In the governmental fund financial statements, revenues are deferred for amounts that are unearned or unavailable.

CITY OF COVINGTON, KENTUCKY
40
NOTE 1 – SUMMARY OF SIGNIFICANT ACCOUNTING POLICIES (Continued) Fund Equity Net assets is the difference between assets and liabilities. Net assets invested in capital assets, net of related debt are capital assets, less accumulated depreciation and any outstanding debt related to the acquisition, construction or improvement of those assets. In the fund financial statements, government funds report reservations of governmental funds that represent amounts that are not available for appropriation such as prepaid expenses. Restricted net assets and restricted fund equity are reported when amounts are legally restricted by outside parties for use for a specific purpose. Unrestricted net assets and fund equity may be used at the City's discretion.
Revenues, Expenditures and Expenses:
Operating Revenues and Expenses Operating revenues and expenses for the proprietary fund are those that result from internal insurance premiums. It also includes all revenue and expenses related to capital and related financing, non-capital financing or investing activities. Expenditures/Expenses In the government-wide financial statements, expenses are classified by function for governmental activities. In the fund financial statements, governmental funds are classified as follows:
Governmental Funds – by Character Current – Further Classified by Function Debt Service Capital Outlay Proprietary Fund – by Operating and Non-Operating
In the fund financial statements, governmental funds report expenditures of financial resources. Proprietary funds report expenses related to the use of economic resources. Interfund Transactions
Interfund services provided/used are accounted for as revenues, expenditures or expenses. Transactions that constitute reimbursements to a fund for expenditures/expenses initially made from it that are properly applicable to another fund, are recorded as expenditures/expenses in the reimbursing fund and as reductions of expenditures/ expenses in the fund that is reimbursed. Use of Estimates
The process of preparing financial statements in conformity with U.S. generally accepted accounting principles requires management to make estimates and assumptions that affect reported amounts of assets, liabilities, designated fund balances, and disclosure of contingent assets and liabilities at the date of the financial statements, and the reported amounts of revenues and expenditures during the reporting period. Actual results could differ from those estimates.
Budgetary Information
Annual budgets are adopted on a basis consistent with U.S. generally accepted accounting principles for all governmental funds and for proprietary funds.

CITY OF COVINGTON, KENTUCKY
41
NOTE 2 – STEWARDSHIP, COMPLIANCE AND ACCOUNTABILITY The City follows these procedures in establishing the budgetary data reflected in the financial statements:
In accordance with City ordinance, prior to June 1, the City Manager submits to the Board of Commissioners, a proposed operating budget for the fiscal year commencing the following July 1. The operating budget includes proposed expenditures and the means of financing them for the upcoming year.
A public meeting is conducted to obtain taxpayer comment. Prior to June 30, the budget is legally enacted through passage of an ordinance. The City Manager is required by Kentucky revised statutes to present a quarterly report to the
Mayor and Board of Commissioners explaining any variance from the approved budget. Appropriations continue in effect until a new budget is adopted.
The Board of Commissioners may authorize supplemental appropriations during the year.
Expenditures may not legally exceed budgeted appropriations at the fund level. Any amendments to the budget that would change fund level totals must be approved by the Board of Commissioners. Encumbrance accounting is not employed by the City. During the year, the Board of Commissioners adopted two supplementary appropriation ordinances. Appropriations lapse at year end unless a new budget has not been adopted.
Excess of Expenditures over Appropriations
No funds had expenditures in excess of legally adopted appropriations for the year ended June 30, 2009.
NOTE 3 – DEPOSITS
Cash and Cash Equivalents
The City maintains deposits with financial institutions insured by the Federal Deposit Insurance Corporation (FDIC). As allowed by law, the depository bank should pledge securities along with FDIC insurance at least equal to the amount on deposit at all times.
As of June 30, 2009, $250,000 of the City's deposits are insured by the FDIC, and $6,275,100 of the City’s deposits are collateralized with securities held by the pledging institution’s trust department but not in the City's name. As of June 30, 2009, the City did not have any deposits in excess of insured and/or collateralized amounts.
As of December 31, 2008, Devou Properties, Inc. (a component unit of the City) had $1,447,010 in cash in excess of insured limits.
Investments
Investments are made by the City as an agent for the City Employee's Retirement Fund and the Police and Firemen's Pension Fund. The City maintains investment accounts with brokerage institutions which hold the investments registered in the City’s name. As of June 30, 2009, all of the City’s investments were covered by SIPC coverage or Excess SIPC coverage provided by the institution, and are therefore not subject to custodial credit risk.
Custodial Credit Risk
For deposits and investments, custodial credit risk is the risk that in the event of the failure of the counterparty, the City will be able to recover the value of its cash, investments or collateral securities that are in the possession of an outside party. The City has no formal policy on custodial credit risk. As of June 30, 2009, the City had $6,275,100 of deposits collateralized with securities held by the pledging institution’s trust department but not in the City’s name.

NOTE 4 - CAPITAL ASSETS AND DEPRECIATION
Balance BalanceBeginning Retirements/ End
of Year Additions Deletions of YearGovernmental ActivitiesCapital Assets Not Being Depreciated Land $ 15,078,717 $ 618,700 $ 725,653 $ 14,971,764 Land Improvements 1,276,802 12,000 - 1,288,802 Construction in Progress 986,667 361,038 105,606 1,242,099 Total Capital Assets Not Being Depreciated 17,342,186 991,738 831,259 17,502,665
Depreciable Capital Assets Buildings 23,095,573 18,721 - 23,114,294 Building Improvements 8,438,401 38,631 - 8,477,032 Infrastructure 105,518,537 1,118,322 99,031 106,537,828 Machinery and Equipment 4,510,852 289,105 19,870 4,780,087 Vehicles 9,852,183 670,614 309,470 10,213,327 Total Depreciable Capital Assets 151,415,546 2,135,393 428,371 153,122,568
Less: Accumulated Depreciation Buildings 7,874,035 571,692 - 8,445,727 Building Improvements 7,657,392 245,485 - 7,902,877 Infrastructure 75,240,332 3,088,006 12,654 78,315,684 Machinery and Equipment 3,753,521 273,377 19,870 4,007,028 Vehicles 8,425,053 722,418 309,470 8,838,001 Total Accumulated Depreciation 102,950,333 4,900,978 341,994 107,509,317
Depreciable Capital Assets, Net 48,465,213 (2,765,585) 86,377 45,613,251
Total Governmental Activities Capital Assets - Net $ 65,807,399 $ (1,773,847) $ 917,636 $ 63,115,916
Component UnitDevou Properties, Inc. Depreciable Capital Assets Property and Equipment $ 17,184 $ - $ - $ 17,184 Less: Accumulated Depreciation Property and Equipment 10,196 2,540 - 12,736
Total Component Unit Capital Assets - Net $ 6,988 $ (2,540) $ - $ 4,448
Governmental ActivitiesAdministration $ 3,627,838 Police 456,305 Fire 409,375 General Services 199,773 Parks and Recreation 207,687
$ 4,900,978
CITY OF COVINGTON, KENTUCKY
42
Capital asset activity for the fiscal year ended June 30, 2009 was as follows:
*Depreciation was charged to functions as follows:
Total Governmental Activities Depreciation Expense

Due From/To Other Funds:
Receivable Fund Payable Fund AmountGeneral Fund Police Block Grant $ -
Federal and State Grant 55,352Renaissance Grant 166,100CAD System 203,707Capital Improvement Fund 413,168Police Forfeiture 18,440Home Consortium 11,980Housing Choice Voucher 17,045Newport Steel 175,0842004 Pension Obligation 69,129Medical Self Insurance 6,148Devou Park 34,634Park National 76,554Police and Fire Incentive Pay 83,249City Employees 108,354Police and Firemen's Pension 708,526
Total Due to General Fund 2,147,470
CDBG General 505,703HOME Program General 31,629Investor Program General 40City Hall Operations General 6,190Arts District General 10,010501 Main Street Operations General 7,051Renaissance Grant Capital Improvement 64,476Working Capital Reserve General 1,770,264Property Acquisitions Rental Rehab 1,145
Interfund Transfers:
Transfer From Transfer To AmountGeneral Fund Arts District $ 30,220
Devou Park Maintenance 82,268 501 Main Street Operations 76,356 Working Capital Reserve 400,000 Liability Self Insurance 683,681 Capital Improvement 790,581 Debt Service 3,505,209 Federal and State Grant Fund 3,095
Total Transfer From General Fund 5,571,410
CAD General 784,000 Capital Improvement Fund Renaisance Grant 64,476 CDBG General 311,000 Investor Program Property Acquisition 15,944 Police Block Grant Police Forfeiture 370
$ 6,747,200
43
CITY OF COVINGTON, KENTUCKY
NOTE 5 - INTERFUND ACTIVITY
Interfund receivables/payables represent short-term loans from one fund to another to cover cash overdrafts.
Transfers are typically used to move unrestricted revenues collected in one fund to finance various programs accounted for in another fund in accordance with budgetary authorizations and to fund debt service payments when they become due. Much of the City's revenue is received in the general fund, then transferred to various other funds in order to fund immediate expenditures.
Much of the City's revenue is received in the general fund, then transferred to various other funds in order to fund immediate expenditures. Interfund receivables/payables were as follows at June 30, 2009:

Balance BalanceDebt Issue July 1, 2008 Issued Redeemed June 30, 2009
TRAN $ - $ 3,000,000 $ 3,000,000 $ - Line of Credit 427,747 75,419 304,927 198,239
$ 427,747 $ 3,075,419 $ 3,304,927 $ 198,239
Capital Lease Obligations
CapitalAssets
Buildings $ 8,664,929 Building Improvements 534,589 Equipment 597,819 Land 6,952,070 Infrastructure 989,002 Vehicles 2,208,054
Total Cost 19,946,463 Accumulated Depreciation 2,346,835
Net Book Value $ 17,599,628
During the year the City obtained a line of credit to facilitate real estate development. The total amount of credit available is $500,000 and the debt charges interest at 5.5%. This line of credit matures August 1, 2009 and had an outstanding balance at June 30, 2009 of $198,239.
During the year ended June 30, 2009, the following changes occurred in the City’s short term debt:
44
NOTE 7 - GENERAL LONG-TERM DEBT
Capital lease obligations in the government-wide financial statements are reported as liabilities at lease inception. The related assets along with depreciation are reported at that time. Lease payments are reported as a reduction of the liability. For capital lease obligations in governmental funds, “Other Financing Sources – Lease Proceeds” and the expenditure are recorded at lease inception. Lease payments are recorded as expenditures.
The following capital lease obligations payable are payable from governmental fund revenues.The City has entered into various lease agreements as lessee for financing the acquisition of capital assets. These lease agreements qualify as capital leases for accounting purposes and therefore, have been recorded at the present value of the future minimum lease payments as of the date of their inception. The following is an analysis of the capital assets acquired through capital leases as of June 30, 2009.
CITY OF COVINGTON, KENTUCKY
NOTE 6 - SHORT TERM DEBT
On July 1, 2008 the city issued a Tax and Revenue Anticipation Note in the amount of $3,000,000 for the purpose of providing working capital in advance of tax and revenue cash flows. This note carried a fixed interest rate of 3.08% and matured on June 30, 2009 at which time it was repaid out of the general fund.

CITY OF COVINGTON, KENTUCKY
45
NOTE 7 – GENERAL LONG-TERM DEBT (Continued) The following is a schedule of the future minimum lease payments under these capital leases, and the present value of the net minimum lease payments at June 30, 2009. Fiscal Years Ending June 30, Amount 2010 $ 1,911,001 2011 1,905,562 2012 1,907,667 2013 1,911,403 2014 1,893,375 2015-2019 8,409,149 2020-2024 6,118,881 2025-2029 1,047,398 Total Minimum Lease Payments 25,104,436 Less: Amount Representing Interest (6,322,738) Present Value of Future Minimum Lease Payments 18,781,698 Less Current Portion 1,118,478 Non Current Portion $ 17,663,220 The City is the lessor of office space located in the city building. These leases are on a year to year basis with cancelable terms. The City’s investment in property on operating leases and property held for lease as of June 30, 2009 is as follows: Cost $ 1,500,000 Carrying Amount $ 1,375,000 Current Depreciation $ 37,500

CITY OF COVINGTON, KENTUCKY
46
NOTE 7 – GENERAL LONG-TERM DEBT (Continued) Mortgage Bonds and Notes Payable The following schedule summarizes outstanding long-term mortgage bonds and notes payable at June 30, 2009.
Maturity Interest Dates Amounts Purpose Rates June 30, Issued Outstanding Mortgage Bonds 1989 Series A Infrastructure 11.25 % 2010 $ 587,737 $ 2,581 2003 Series Refunding 2.00-4.50 2018 4,996,000 3,438,000 KY Infrastructure Auth. Infrastructure 4.55 2014 460,327 142,130 HUD 108 Building Project 5.13 2015 1,000,000 464,000 2004 Series Pension Funding Variable 2030 14,410,000 13,115,000 2005 Series Refunding 3.00-3.30 2013 7,405,000 4,460,000
Interest on the variable rate 2004 Series Pension Obligation Bonds is paid at the rate of interest determined by the Remarketing Agent, determined on a weekly basis. The rate was 2.75% June 30, 2009. The bonds may be called prior to maturity at rates and redemption premiums specified in each issue. Assuming no issues are called prior to maturity, the minimum obligations of the City at June 30, 2009 are as follows: Fiscal Years Ending
June 30, Principal Interest Total 2010 $ 1,851,744 $ 877,756 $ 2,729,500 2011 1,917,505 807,654 2,725,159 2012 1,981,908 737,412 2,719,320 2013 2,060,377 661,828 2,722,205 2014 912,177 602,130 1,514,307 2015 - 2019 4,393,000 2,384,825 6,777,825 2020 - 2024 3,305,000 1,562,677 4,867,677 2025 - 2029 4,225,000 716,533 4,941,533 2030 - 2034 975,000 22,035 997,035 Totals $ 21,621,711 $ 8,372,850 $ 29,994,561
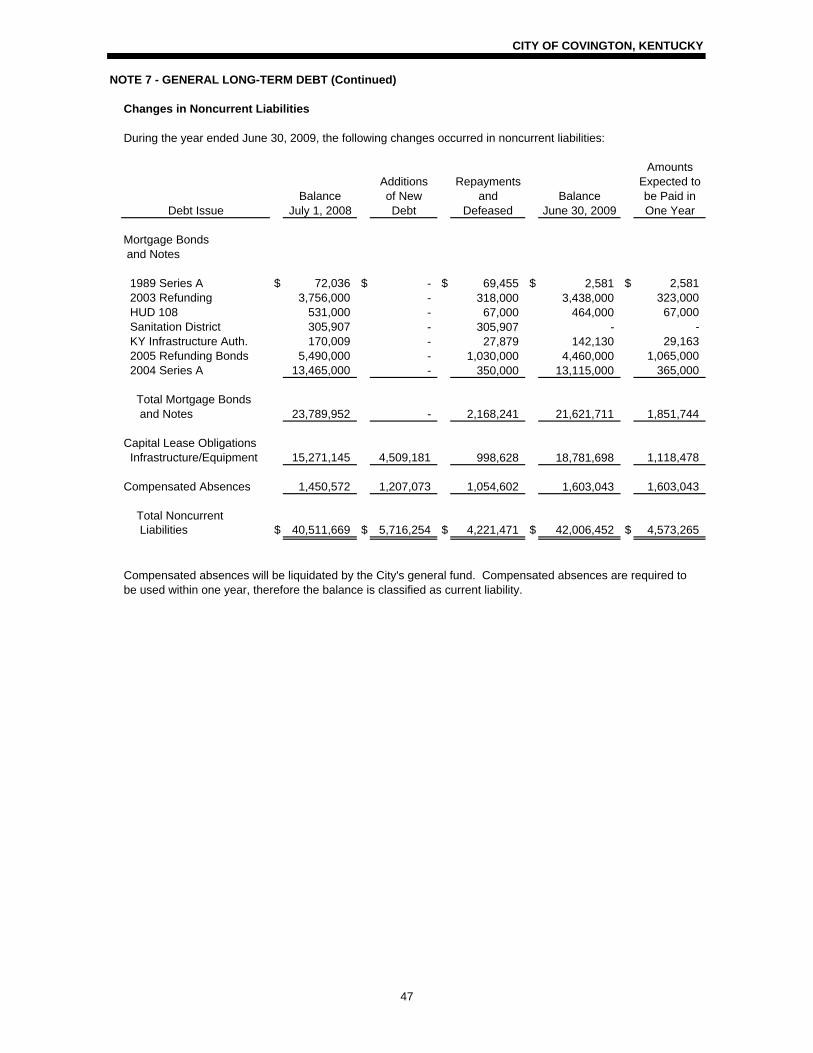
AmountsAdditions Repayments Expected to
Balance of New and Balance be Paid inDebt Issue July 1, 2008 Debt Defeased June 30, 2009 One Year
Mortgage Bonds and Notes
1989 Series A $ 72,036 $ - $ 69,455 $ 2,581 $ 2,581 2003 Refunding 3,756,000 - 318,000 3,438,000 323,000 HUD 108 531,000 - 67,000 464,000 67,000 Sanitation District 305,907 - 305,907 - - KY Infrastructure Auth. 170,009 - 27,879 142,130 29,163 2005 Refunding Bonds 5,490,000 - 1,030,000 4,460,000 1,065,000 2004 Series A 13,465,000 - 350,000 13,115,000 365,000
Total Mortgage Bonds and Notes 23,789,952 - 2,168,241 21,621,711 1,851,744
Capital Lease Obligations Infrastructure/Equipment 15,271,145 4,509,181 998,628 18,781,698 1,118,478
Compensated Absences 1,450,572 1,207,073 1,054,602 1,603,043 1,603,043
Total Noncurrent Liabilities $ 40,511,669 $ 5,716,254 $ 4,221,471 $ 42,006,452 $ 4,573,265
CITY OF COVINGTON, KENTUCKY
47
Compensated absences will be liquidated by the City's general fund. Compensated absences are required to be used within one year, therefore the balance is classified as current liability.
During the year ended June 30, 2009, the following changes occurred in noncurrent liabilities:
NOTE 7 - GENERAL LONG-TERM DEBT (Continued)
Changes in Noncurrent Liabilities

CITY OF COVINGTON, KENTUCKY
48
NOTE 7 – GENERAL LONG-TERM DEBT (Continued) Interest Rate Swap Objective of the Interest Rate Swap. As a means to lower its borrowing costs, when compared against fixed-rate bonds at the time of issuance in May, 2005, the City entered into an interest rate swap in connection with its $14.4 million 2004 Series variable-rate general obligation bonds. The intention of the swap was to effectively change the authority’s variable interest rate on the bonds to a synthetic fixed rate of 4.56 percent. Terms. The bonds mature on December 1, 2029, and the related swap agreement matures on December 1, 2014. The swap’s initial notional amount of $14.4 million matched the $14.4 million variable-rate bonds on an amortizing schedule. The swap was entered at the same time the bonds were issued (December, 2004). Starting in fiscal year 2006, the notional value of the swap and the principal amount of the associated debt decline. Under the swap, the City pays the counterparty a fixed payment of 4.56 percent and receives a variable payment based on the London Interbank Offered Rate (LIBOR). Conversely, the bond’s variable-rate coupons are based on a rate determined by the remarketing agent in accordance with the indenture. Fair Value. The swap had a fair value of $(1,016,438) as of June 30, 2009. The swap’s fair value may be countered by a reduction in total interest payments required under the variable-rate bonds, creating a lower synthetic interest rate. Because the coupons on the City’s variable-rate bonds adjust to changing interest rates, the bonds do not have a corresponding fair value increase or decrease. Credit Risk. As of June 30, 2009, the City was exposed to credit risk in the amount of the swap’s fair value. The swap counterparty was rated AA by Standard & Poor’s and Aa2 by Moody’s Investors Service as of June 30, 2009. Swap Payments and Associated Debt. For the year ended June 30, 2009, the City did not receive any payments from the agreement. Using rates as of June 30, 2009, debt service requirements of the variable-rate debt and net swap payments, assuming current interest rates remain the same for their term, were as follows. As rates vary, variable-rate bond interest payments and net swap payments will vary Fiscal Years Ending Variable-Rate Bonds
June 30, Principal Interest Swap, Net Total 2010 $ 365,000 $ 327,482 $ 262,240 $ 954,722 2011 385,000 345,331 227,291 957,622 2012 405,000 334,469 220,141 959,610 2013 425,000 323,056 212,630 960,686 2014 445,000 311,094 204,756 960,850 2015 - 2019 2,585,000 1,354,031 - 3,939,031 2020 - 2024 3,305,000 950,744 - 4,255,744 2025 - 2029 4,225,000 435,944 - 4,660,944 2030 - 2034 975,000 13,406 - 988,406 Totals $ 13,115,000 $ 4,395,557 $ 1,127,058 $ 18,637,615

CITY OF COVINGTON, KENTUCKY
49
NOTE 7 – GENERAL LONG-TERM DEBT (Continued)
Conduit Debt Obligations The City has issued Industrial Revenue Bonds to provide financial assistance to private-sector entities for the acquisition and construction of industrial and commercial facilities deemed to be in the public interest. The bonds are secured by the property financed and are payable solely from payments received on the underlying mortgage loans. Upon repayment of the bonds, ownership of the acquired facilities transfers to the private-sector entity served by the bond issuance. Neither the City, State, nor any political subdivision thereof, is obligated in any manner for repayment of the bonds. Accordingly, the bonds are not reported as liabilities in the accompanying financial statements. As of June 30, 2009, there were four series of Industrial Revenue Bonds outstanding, with an aggregate principal amount payable of $62.0 million.
NOTE 8 – RISK MANAGEMENT
The City is exposed to various risks to loss related to torts; theft of, damage to, and destruction of assets; errors and omissions; and natural disasters. The City has established a Liability Self Insurance Fund (an internal service fund) to account for and finance its uninsured risks of loss. Under this program, the Liability Self Insurance Fund provides coverage for all losses. The City purchases commercial insurance for fire and extended coverage losses. All funds of the City participate in the program and make payments to the Liability Self Insurance Fund, however the payments are not based on actuarial estimates of the amounts needed to pay prior and current-year claims but are intended to establish a reserve for catastrophic losses. That reserve was $1,206,915 at June 30, 2009 and is a designation of the Liability Self Insurance Fund retained earnings. The claims liability reported in the Fund at June 30, 2009, is based on the requirements of governmental accounting standards, which requires that a liability for claims be reported if information prior to the issuance of the financial statements indicates that it is probable that a liability has been incurred at the date of the financial statements and the amount of the loss can be reasonably estimated. Changes in the Fund's claims liability amount were: Claims and Claims and July 1, Changes In Claims June 30, Changes In Claims June 30, 2007 Estimates Payments 2008 Estimates Payments 2009 $ - $ 130,509 $ 130,509 $ - $ 711,895 $ 711,895 $ -
The City has also established a Medical Self Insurance Fund. Employees may elect to participate in this program or certain other medical insurance programs offered by the City. Under this program the first $125,000 of a participants medical claims are payable by the medical self insurance fund. The City purchases insurance for claims in excess of coverage provided by the fund. All funds of the City participate in the program and make payments to the medical self insurance fund based on historical estimates of the amounts needed to pay prior and current year claims. The claims liability of $1,287,680 reported in the fund at June 30, 2009, is based upon the requirements of governmental accounting standards, as explained above. Changes in the fund’s claims liability amount during the year ended June 30, 2009 were as follows: Claims and Claims and July 1, Changes In Claims June 30, Changes In Claims June 30, 2007 Estimates Payments 2008 Estimates Payments 2009 $ 995,832 $ 4,618,751 $ 4,552,552 $1,062,031 $ 5,048,819 $ 4,823,170 $ 1,287,680
There have been no significant reductions in insurance coverage from the prior year. There have been no settlements in excess of insurance coverage in the past three years.

CITY OF COVINGTON, KENTUCKY
50
NOTE 9 – EMPLOYEE RETIREMENT PLAN
The City of Covington maintains two single employer, defined benefit pension plans: Employees’ Pension Plan and Police and Firemen’s Pension Plan. Summary of Significant Accounting Policies Basis of Accounting. The plan’s financial statements are prepared using the accrual basis of accounting. Plan member contributions are recognized in the period in which the contributions are due. Employer contributions to each plan are recognized when due and the employer has made a formal commitment to provide the contributions. Benefits and refunds are recognized when due and payable in accordance with the terms of each plan. Method Used to Value Investment. Investments are reported at fair value. Short-term investments are reported at cost, which approximates fair value. Securities traded on a national or international exchange are valued at the last reported sales price at current exchange rates. Mortgages are valued on the basis of future principal and interest payments, and are discounted at prevailing interest rates for similar instruments. The fair value of real estate investments is based on independent appraisals. Investments that do not have an established market are reported at estimated fair value. The plans issued separate financial statements which may be obtained by request from the City of Covington. Plan Descriptions and Contribution Information Membership of each plan consisted of the following at the date of the latest actuarial valuation: Police and Employees’ Firemen’s Group July 1, 2009 July 1, 2009 Retirees and Beneficiaries Currently Receiving Benefits 57 90 Active Employees – Fully Vested 2 - 59 90
Employees’ Pension Plan Plan Description. The Employees Pension Plan is a single employer defined benefit pension plan that covers substantially all non-public safety employees hired prior to April 1, 1997. The plan provides retirement, disability and death benefits to plan members and their beneficiaries. Cost-of-living adjustments (COLA) are provided at the discretion of the Board of Trustees. Benefits are provided and may be amended by city ordinance. Contributions. Plan members are required to contribute 8% of their annual covered salary. The City is required to contribute at an actuarially determined rate. Contributions requirements of the plan members and the City are established and may be amended by city ordinance. Administrative costs are financed through investment earnings.

CITY OF COVINGTON, KENTUCKY
51
NOTE 9 – EMPLOYEE RETIREMENT PLAN (Continued) Police and Firemen’s Pension Plan Plan Description. The Police and Firemen’s Pension Plan is a single employer defined benefit pension plan that covers all retired police and firemen who were receiving benefits prior to August 1, 1989. The plan provides retirement, disability, and death benefits to plan members and their beneficiaries. Cost-of-living adjustments (COLA) are provided at the discretion of the Board of Trustees. Benefits are provided under Kentucky Revised Statutes (KRS) 95.852 to 95.991. Contributions. There are no active employees contributing to the plan. The City is required to contribute at an actuarially determined rate. Contribution requirements of the City are established under KRS 95.868. Administrative costs are financed through investment earnings. Employer Contributions Employees' Pension Plan Police & Firemen’s Pension Plan Years Annual Annual Ended Required Contributions Percentage Required Contributions Percentage June 30, Contribution Made Contributed Contribution Made Contributed 2009 $ - $ - - % $ - $ - - % 2008 - - - - - - 2007 146,203 - - 60,974 - - During the year ended June 30, 2005, the City issued Pension Obligation Bonds for the purpose of funding both Pension Plans. As a result, the City has a net pension obligation asset on the government-wide statement of net assets. As of June 30, 2009, the Plan liabilities in both the Police & Firemen’s Pension Plan and the Employees’ Pension Plan exceeded the assets. Therefore, the City did have an unfunded accrued liability in the Police & Firemen’s Pension Plan or the Employees’ Pension Plan. The City is required by state statute to contribute impounding lot income and required contributions into the Police & Firemen’s Pension Plan each year. Funded Status and Funding Progress Actuarial UAAL as a Actuarial Actuarial Accrued Unfunded Percentage Valuation Value of Liability (AAL) AAL Funded Covered of Covered Date Assets Entry Age (UAAL) Ratio Payroll Payroll July 1, (a) (b) (b-a) (a/b) (c) [(b-a)/c] Employees’ Pension Plan 2009 $ 3,867,919 $ 5,955,714 $ 2,087,795 65 % $ 105,381 1981 % 2007 6,650,730 6,605,645 (45,085) 101 114,311 N/A 2006 6,471,713 7,294,905 823,192 88 103,123 798 Police & Firemen’s Pension Plan 2009 $ 9,248,821 $ 11,972,124 $ 2,723,303 77 % $ N/A N/A % 2007 16,057,288 15,913,455 (143,833) 101 N/A N/A 2006 15,157,005 15,575,537 418,532 97 N/A N/A An actuarial valuation report was not prepared as of July 1, 2008 for the Employees’ Pension Plan and the Police & Firemen’s Pension Plan.

CITY OF COVINGTON, KENTUCKY
52
NOTE 9 – EMPLOYEE RETIREMENT PLAN (Continued)
Annual Pension Cost and Net Pension Obligation The City’s annual pension cost and net pension obligation to each plan for the current year were as follows: Police & Employees’ Firemen’s Pension Pension Plan Plan Annual Required Contribution (ARC) $ - $ - Interest on Net Pension Obligation (220,337) (472,384) Adjustment to ARC 554,662 1,189,149 Annual Pension Cost 334,325 716,765 Actual Contributions Made - - Increase (Decrease) in Net Pension Obligation 334,325 716,765 Net Pension Obligation (Asset) – Beginning of Year (2,937,822) (6,298,449) Net Pension Obligation (Asset) – End of Year $ (2,603,497) $ (5,581,684) Three-Year Trend Information Change Balance of Annual Percentage In Net Net Pension
Pension of APC Pension Obligation Years Ended Cost (APC) Contributed Obligation (Asset) Employees’ Pension Plan 06/30/09 $ 334,325 - % $ 334,325 $ (2,603,497) 06/30/08 311,000 - 311,000 (2,937,822) 06/30/07 448,525 - 448,525 (3,248,822) Police & Firemen’s Pension Plan 06/30/09 $ 716,765 - % $ 716,765 $ (5,581,684) 06/30/08 666,759 - 666,759 (6,298,449) 06/30/07 686,644 - 686,644 (6,965,208)

CITY OF COVINGTON, KENTUCKY
53
NOTE 9 – EMPLOYEE RETIREMENT PLAN (Continued)
The information presented in this note was determined as part of the actuarial valuations at the dates indicated. Additional information as of the latest actuarial valuation follows:
Police & Employees’ Firemen’s Pension Plan Pension Plan
Valuation Date July 1, 2009 July 1, 2009 Actuarial Cost Method Entry Age Unit Credit Amortization Method Level Percent Level Percent Closed Closed Remaining Amortization Period 10 Years 10 Years Asset Valuation Method Market Market Actuarial Assumptions: Investment Rate of Return * 7.5 % 7.5 % Projected Salary Increases* 6 % N/A * Includes Inflation at - % 2.5 % Cost-of-Living Adjustments - % 2.5 % County Employees Retirement System (CERS) City employees hired subsequent to April 1, 1977 who work at least 100 hours per month participate in the County Employees Retirement System (CERS). Under the provisions of Kentucky Revised Statute 61.645, the Board of Trustees of Kentucky Retirement Systems administers the CERS. The plan issues separate financial statements which may be obtained by request from Kentucky Retirement Systems, 1260 Louisville Road, Frankfort, Kentucky 40601. Plan Description – CERS is a cost-sharing multiple-employer defined benefit pension plan that covers substantially all regular full-time members employed in positions of each county and school board, and any additional eligible local agencies electing to participate in the System. The plan provides for retirement, disability, and death benefits to plan members. Retirement benefits may be extended to beneficiaries of plan members under circumstances. Cost-of-living (COLA) adjustments are provided at the discretion of the state legislature. Non-Hazardous Contributions – For the year ended June 30, 2009, plan members were required to contribute 5% of their annual creditable compensation. Participating employers were required to contribute at an actuarially determined rate. Per Kentucky Revised Statute Section 61.565(3), normal contribution and past service contribution rates shall be determined by the Board on the basis of an annual valuation last preceding the July 1 of a new biennium. The Board may amend contribution rates as of the first day of July of the second year of a biennium, if it is determined on the basis of a subsequent actuarial valuation that amended contribution rates are necessary to satisfy requirements determined in accordance with actuarial bases adopted by the Board. For the year ended June 30, 2009, participating employers contributed 13.50% of creditable compensation. Administrative costs of CERS are financed through employer contributions and investment earnings.

CITY OF COVINGTON, KENTUCKY
54
NOTE 9 – EMPLOYEE RETIREMENT PLAN (Continued) Hazardous Contributions – For the year ended June 30, 2009, plan members were required to contribute 8% of their annual creditable compensation. The City was required to contribute at an actuarially determined rate. Per Kentucky Revised Statute Section 61.565(3), normal contribution and past service contribution rates shall be determined by the Board on the basis of an annual valuation last preceding the July 1 of the second year of a biennium, if it is determined on the basis of a subsequent actuarial valuation that amended contribution rates are necessary to satisfy requirements determined in accordance with actuarial bases adopted by the Board. For the year ended June 30, 2009, participating employers contributed 29.50% of each employee’s creditable compensation. Administrative costs of CERS are financed through employer contributions and investment earnings. The required contribution and the actual percentage contributed for the City for the current and previous two years are as follows:
Actual Required Percentage Years Contribution Contributed
2009 $ 5,261,517 100 % 2008 5,617,523 100 2007 4,564,773 100 Deferred Compensation Plan Employees of the City of Covington may participate in a deferred compensation plan adopted under the provisions of Internal Revenue Code Section 457 (Deferred Compensation Plans with Respect to Service for State and Local Governments). The deferred compensation plan is available to all employees of the City. Under the plan, employees may elect to defer a portion of their salaries and avoid paying taxes on the deferred portion until the withdrawal date. The deferred compensation amount is not available for withdrawal by employees until termination, death, or unforeseeable emergency. The deferred compensation plan is administered by an unrelated third-party organization. Under the terms of an IRC Section 457 deferred compensation plan, all deferred compensation and income attributable to the investment of the deferred compensation amounts is held by the financial institution, until paid or made available to the employees or beneficiaries.

CITY OF COVINGTON, KENTUCKY
55
NOTE 10 – CONTINGENCIES
The city is a defendant in a lawsuit. The suit was filed by an individual for development rights and damages. The suit does not specify damages however; the city’s counsel has advised that the case has potential for a large judgment, up to $500,000. The city’s counsel has advised that at this stage in the proceeding he cannot offer an opinion as to the probable outcome. The city believes the action is without merit and intends to vigorously defend its position.

REQUIRED SUPPLEMENTARY INFORMATION
Note: The City’s budget is prepared using the modified accrual basis of accounting, which is the GAAP
basis used to report governmental funds.

Variancewith Final
Actual Budget Original Final
Revenues Taxes Real Property $ 5,481,474 $ 5,481,474 $ 5,643,388 $ 161,914 Personal Property 550,000 550,000 653,748 103,748 Bank Deposit 60,000 60,000 53,161 (6,839) Franchise 2,190,240 2,190,240 2,140,821 (49,419) Insurance Premium 5,402,250 5,402,250 5,430,628 28,378 Licenses and Permits Payroll License Fees 24,918,240 24,918,240 23,697,247 (1,220,993) Net Profits License Fees 2,809,000 2,809,000 2,555,089 (253,911) Night Club Permits 135,000 135,000 135,000 - Liquor and Beer Licenses 150,000 150,000 153,011 3,011 Building and Zoning - - 6,460 6,460 Dog Licenses 8,000 8,000 3,522 (4,478) Intergovernmental 535,000 910,000 738,525 (171,475) Fines and Forfeitures 620,000 620,000 712,072 92,072 Charges for Services Waste Fees 2,029,724 2,029,724 1,859,171 (170,553) Parking 1,075,000 1,075,000 1,143,276 68,276 Squad Runs 1,158,300 1,158,300 1,077,448 (80,852) Rental Property 340,000 340,000 244,137 (95,863) Other 117,000 117,000 138,945 21,945 Interest 67,200 67,200 21,730 (45,470) Miscellaneous 296,000 296,000 415,657 119,657
Total Revenues 47,942,428 48,317,428 46,823,036 (1,494,392)
Expenditures General Government Administration Department Payroll 720,416 720,416 727,666 (7,250) Employee Benefits 335,616 335,616 354,568 (18,952) Contractual Services 446,115 246,115 219,757 26,358 Materials and Supplies 51,050 51,050 64,182 (13,132) Miscellaneous - - 323 (323)
Total Administration Department 1,553,197 1,353,197 1,366,496 (13,299)
Legal Department Payroll 224,064 224,064 228,126 (4,062) Employee Benefits 107,215 107,215 102,337 4,878 Contractual Services 75,092 75,092 47,182 27,910 Materials and Supplies 21,000 21,000 11,701 9,299 Miscellaneous - - - -
Total Legal Department 427,371 427,371 389,346 38,025
Finance Department Payroll 560,187 560,187 521,487 38,700 Employee Benefits 284,703 284,703 258,311 26,392 Contractual Services 433,890 433,890 334,408 99,482 Materials and Supplies 93,350 93,350 51,939 41,411 Miscellaneous - - - -
Total Finance Department 1,372,130 1,372,130 1,166,145 205,985
Total General Government 3,352,698 3,152,698 2,921,987 230,711
(Continued)
Year Ended June 30, 2009
Budgeted Amounts
56
CITY OF COVINGTON, KENTUCKYSCHEDULE OF REVENUES, EXPENDITURES AND CHANGES IN FUND BALANCE
GENERAL FUNDBUDGET AND ACTUAL (WITH VARIANCES)

Variancewith Final
Actual Budget Original Final
PolicePayroll $ 8,329,537 $ 8,329,537 $ 7,995,454 $ 334,083 Employee Benefits 5,044,166 5,044,166 5,002,746 41,420 Contractual Services 842,554 842,554 913,222 (70,668) Materials and Supplies 541,730 541,730 439,142 102,588 Miscellaneous - - - -
Total Police 14,757,987 14,757,987 14,350,564 407,423
FirePayroll 7,423,764 7,423,764 7,455,903 (32,139) Employee Benefits 4,761,769 4,761,769 4,721,404 40,365 Contractual Services 384,332 384,332 340,246 44,086 Materials and Supplies 351,170 351,170 327,306 23,864 Miscellaneous - - - -
Total Fire 12,921,035 12,921,035 12,844,859 76,176
General ServicesPayroll 2,003,809 2,003,809 1,938,621 65,188 Employee Benefits 1,133,788 1,133,788 1,050,344 83,444 Contractual Services 2,925,549 2,925,549 2,815,055 110,494 Materials and Supplies 712,614 812,614 886,483 (73,869) Miscellaneous - - - -
Total General Services 6,775,760 6,875,760 6,690,503 185,257
RecreationPayroll 1,295,473 1,295,473 1,127,091 168,382 Employee Benefits 622,336 622,336 593,163 29,173 Contractual Services 441,500 541,500 563,642 (22,142) Materials and Supplies 327,200 327,200 249,207 77,993 Miscellaneous - - - -
Total Recreation 2,686,509 2,786,509 2,533,103 253,406
Code Enforcement and Economic Development
Code EnforcementPayroll 533,378 533,378 503,520 29,858 Employee Benefits 291,693 291,693 253,534 38,159 Contractual Services 160,154 160,154 182,237 (22,083) Materials and Supplies 30,500 30,500 23,932 6,568 Miscellaneous - - - -
Total Code Enforcement 1,015,725 1,015,725 963,223 52,502
(Continued)
Budgeted Amounts
57
(Continued)
CITY OF COVINGTON, KENTUCKYSCHEDULE OF REVENUES, EXPENDITURES AND CHANGES IN FUND BALANCE
GENERAL FUNDYear Ended June 30, 2009
BUDGET AND ACTUAL (WITH VARIANCES)

Variancewith Final
Actual Budget Original Final
Economic DevelopmentPayroll $ 285,906 $ 255,906 $ 209,206 $ 46,700 Employee Benefits 131,640 131,640 90,418 41,222 Contractual Services 133,630 163,630 175,273 (11,643) Materials and Supplies 15,350 15,350 14,318 1,032 Miscellaneous - - - -
Total Economic Development 566,526 566,526 489,215 77,311
Total Code Enforcement and Economic Development 1,582,251 1,582,251 1,452,438 129,813
Parking GaragesContractual Services 789,973 789,973 698,863 91,110 Materials and Supplies 9,000 9,000 3,123 5,877
Total Parking Garages 798,973 798,973 701,986 96,987
Capital OutlayGeneral Government - - - - Police - - - - Fire - - - - General Services - - - - Housing - - - - Recreation - - - -
Total Capital Outlay - - - -
Debt ServicePrincipal 538,458 538,458 553,137 (14,679) Interest 369,903 369,903 266,402 103,501
Total Debt Service 908,361 908,361 819,539 88,822
Total Expenditures 43,783,574 43,783,574 42,314,979 1,468,595
Excess (Deficit) of Revenues Over Expenditures 4,158,854 4,533,854 4,508,057 (25,797)
Other Financing Sources (Uses)Transfers In 956,000 956,000 1,095,000 139,000 Transfers Out (5,114,854) (5,114,854) (5,571,410) (456,556)
Total Other Financing Sources (Uses) (4,158,854) (4,158,854) (4,476,410) (317,556)
Net Change in Fund Balance - 375,000 31,647 (343,353) Fund Balance July 1, 2008 - - 740,322 740,322
Fund Balance June 30, 2009 $ - $ 375,000 $ 771,969 $ 396,969
Budgeted Amounts
(Continued)
58
CITY OF COVINGTON, KENTUCKYSCHEDULE OF REVENUES, EXPENDITURES AND CHANGES IN FUND BALANCE
GENERAL FUNDYear Ended June 30, 2009
BUDGET AND ACTUAL (WITH VARIANCES)

CITY OF COVINGTON, KENTUCKYSCHEDULE OF REVENUES, EXPENDITURES AND CHANGES IN FUND BALANCE
BUDGET AND ACTUAL (WITH VARIANCES) COMMUNITY DEVELOPMENT BLOCK GRANT
Year Ended June 30, 2009
Variancewith Final
Actual Budget Original Final
RevenuesIntergovernmental $ 2,216,159 $ 3,030,159 $ 1,462,656 $ (1,567,503) Miscellaneous 361,492 361,492 390,719 29,227
Total Revenues 2,577,651 3,391,651 1,853,375 (1,538,276)
ExpendituresCode Enforcement and Economic Development 1,065,659 1,530,659 765,974 764,685 Debt Service
Principal 67,000 67,000 67,000 - Interest and Other Charges 29,492 29,492 29,492 -
Capital Outlay 1,077,500 1,426,500 1,003,534 422,966
Total Expenditures 2,239,651 3,053,651 1,866,000 1,187,651
Excess (Deficit) of Revenues Over Expenditures 338,000 338,000 (12,625) (350,625)
Other Financing Sources (Uses)Proceeds From Sale of Land - - 323,625 (323,625) Transfers Out (338,000) (338,000) (311,000) 27,000
Total Other Financing Sources (Uses) (338,000) (338,000) 12,625 (296,625)
Net Change in Fund Balance - - - (647,250)
Fund Balance July 1, 2008 - - - -
Fund Balance June 30, 2009 $ - $ - $ - $ (647,250)
Budgeted Amounts
59

CITY OF COVINGTON, KENTUCKY
SCHEDULE OF REVENUES, EXPENDITURES AND CHANGES IN FUND BALANCE
BUDGET AND ACTUAL (WITH VARIANCES)
HOME PROGRAM
Year Ended June 30, 2009
Variance
with Final
Budgeted Amounts Actual Budget
Original Final
Revenues
Intergovernmental $ 489,874 $ 1,570,584 $ 1,106,412 $ (464,172)
Investment Earnings - - 1,159 1,159
Miscellaneous 210,000 210,000 336,941 126,941
Total Revenues 699,874 1,780,584 1,444,512 (336,072)
Expenditures
Code Enforcement and
Economic Development 635,286 1,715,996 1,371,600 344,396
Capital Outlay 64,588 64,588 - 64,588
Total Expenditures 699,874 1,780,584 1,371,600 408,984
Excess (Deficit) of Revenues
Over Expenditures - - 72,912 72,912
Fund Balance July 1, 2008 - - 103,863 103,863
Fund Balance June 30, 2009 $ - $ - $ 176,775 $ 176,775
60

CITY OF COVINGTON, KENTUCKY
SCHEDULE OF REVENUES, EXPENDITURES AND CHANGES IN FUND BALANCE
BUDGET AND ACTUAL (WITH VARIANCES)
HOUSING VOUCHER PROGRAM
Year Ended June 30, 2009
Variance
with Final
Actual Budget
Original Final
Revenues
Intergovernmental $ 6,086,652 $ 6,629,573 $ 5,770,696 $ (858,877)
Investment Earnings 30,000 30,000 17,073 (12,927)
Miscellaneous - - 13,834 13,834
Total Revenues 6,116,652 6,659,573 5,801,603 (857,970)
Expenditures
Code Enforcement and
Economic Development 6,075,947 6,659,573 6,139,717 519,856
Excess (Deficit) of Revenues
Over Expenditures 40,705 - (338,114) (338,114)
Fund Balance July 1, 2008 - - 1,896,955 1,896,955
Fund Balance June 30, 2009 $ 40,705 $ - $ 1,558,841 $ 1,558,841
61
Budgeted Amounts

OTHER SUPPLEMENTARY INFORMATION

COMBINING FINANCIAL STATEMENTS
NON-MAJOR GOVERNMENTAL FUNDS

62
CITY OF COVINGTON, KENTUCKY NON-MAJOR GOVERNMENTAL FUNDS
SPECIAL REVENUE FUNDS
Special revenue funds are used to account for specific revenues that are legally restricted to expenditures for particular purposes. Police and Fire Incentive Pay
This fund was established to account for entitlements received under the State of Kentucky's Policemen and Firemen's Supplemental Pay Programs. Newport Steel UDAG
This fund is used to account for the proceeds from the repayment of a U.S. Housing and Urban Development loan to Newport Steel, Inc. The proceeds may be used for any purpose for which the Community Development Block Grant Program income may be utilized. Devou Park Maintenance
This fund was established by Commissioners' ordinance in 1973 to account for the maintenance of roadways and streets within Devou Park. Investor Program
This fund is used to account for resources provided by loan repayments made by loan recipients who had previously received loans from the U.S. Department of Housing and Urban Development. Those funds are then made available for rehabilitation loans to qualified property owners. City Hall Operations
This fund was established to account for revenues and expenditures related to the City building. Federal and State Grant Funds
This fund was established to account for the revenues and expenditures related to grants awarded by federal and state agencies. Arts District
This fund was established to provide loans for specified projects within the Arts District in the city. 501 Main Street Operations
This fund was established to account for revenues and expenditures related to a city owned building at 501 Main Street. Police Forfeiture
This fund was established to account for the resources provided for by police forfeitures. Police Block Grant
This fund was established to account for revenues and expenditures related to the Police Block Grant. CAD System
This fund was established to account for revenues and expenditures related to the installation of a computer assisted dispatch system, and the subsequent debt service payments for the related capital lease.

63
CITY OF COVINGTON, KENTUCKY NON MAJOR GOVERNMENTAL FUNDS
(Continued)
Renaissance Grant Fund
This fund was established to account for revenues and expenses related to renaissance grants received by the City. Working Capital Reserve
This fund was established to accumulate funds to be used for future working capital needs of the City. Property Acquisitions
This fund was established to account for significant funds received and investments made by the City for real estate in connection with relocating Section 8 tenants. Home Consortium Fund
This fund was established to administer a HOME Program for a consortium of non entitlement cities in Northern Kentucky, including Newport, Bellevue, Dayton, Ludlow and Bromley. HOME funds are used to provide assistance to persons to purchase a home, owner-occupied rehab programs, and housing development activities with Community Housing Development organizations.
CAPITAL PROJECTS FUNDS
Capital projects funds are used to account for the accumulation of specific resources that are intended to be used for future capital improvements. Capital Improvement Fund
This fund was established to account for significant funds received by the City that will be used for future capital projects.
DEBT SERVICE FUNDS
Debt service funds are used to account for the accumulation of resources and payment of general obligation bond principal and interest from governmental resources. KLC Series 2002
This fund was established to account for the proceeds of a BAN to finance certain projects of the City. BAN proceeds were replaced by capital lease proceeds in the prior year to finish the projects. 2004 Pension Obligation Bonds
The proceeds of this issue were used to fund the Employees’ Retirement Fund and the Police and Fire Retirement Fund. 2005 Refunding Bonds
The proceeds of this issue were used to refund the 1995 First Mortgage Bonds.
Sewer Maintenance Fees
This fund was established to account for resources provided by the collection of sewer maintenance fees. These fees are to be used to retire the debt owed to the Sanitation District.

CITY OF COVINGTON, KENTUCKYCOMBINING BALANCE SHEET
NON-MAJOR GOVERNMENTAL FUNDSJune 30, 2009
Special Revenue Funds
Police and Fire Incentive
Newport Steel UDAG
Devou Park Maintenance
Investor Program
City Hall Operations
Federal and State
Grant Fund Arts
District
501 Main Street
Operations Police
Forfeiture
Police Block Grant
Assets Cash and Cash Equivalents $ 48,872 $ 349,174 $ 85,596 $ 572,926 $ 5,850 $ - $ - $ - $ 306,547 $ - Receivables Taxes - - - - - - - - - - Intergovernmental 36,804 - - - - - - - - - Notes - 1,601,418 - 797,166 - - - - - - Accounts - - - - - 134,626 - - - - Due from Other Funds - - - 40 6,190 - 10,010 7,051 - - Prepaids - - - - - - - - - -
Total Assets $ 85,676 $ 1,950,592 $ 85,596 $ 1,370,132 $ 12,040 $ 134,626 $ 10,010 $ 7,051 $ 306,547 $ -
Liabilities and Fund Balances Liabilities Accounts Payable $ - $ - $ - $ - $ 8,411 $ 79,207 $ - $ 7,051 $ 1,539 $ - Accrued Liabilities - - - - - - - - - - Due to Other Funds 83,249 175,084 34,634 1,145 - 55,352 - - 18,440 - Deferred Revenue - 1,600,773 - 797,166 - - - - - -
Total Liabilities 83,249 1,775,857 34,634 798,311 8,411 134,559 - 7,051 19,979 -
Fund Balances Reserved for Prepaids - - - - - - - - - - Unreserved Undesignated, Reported In Special Revenue Funds 2,427 174,735 50,962 571,821 3,629 67 10,010 - 286,568 - Capital Projects Funds - - - - - - - - - - Debt Service Funds - - - - - - - - - -
Total Fund Balances 2,427 174,735 50,962 571,821 3,629 67 10,010 - 286,568 -
Total Liabilities and Fund Balances $ 85,676 $ 1,950,592 $ 85,596 $ 1,370,132 $ 12,040 $ 134,626 $ 10,010 $ 7,051 $ 306,547 $ -
64

CITY OF COVINGTON, KENTUCKYCOMBINING BALANCE SHEET
NON-MAJOR GOVERNMENTAL FUNDSJune 30, 2009
(Continued)
CapitalProjects
CAD System
Renaissance Grant Fund
Working Capital Reserve
Property Acquisitions
Home Consortium
Fund
Capital Improvement
Fund KLC Series
2002
2004 Pension
Obligation Bonds
2005 Refunding
Bonds
Sewer Maintenance
Fees
Non-Major Governmental
Funds Assets Cash and Cash Equivalents $ 418,678 $ - $ - $ - $ - $ - $ - $ 186,361 $ 10,600 $ 92,396 $ 2,077,000 Receivables Taxes - - - - - - - - - - - Intergovernmental - - - - 12,593 - - - - - 49,397 Notes - - - - 161,000 - - - - - 2,559,584 Accounts - 113,791 - 75,419 - 697,787 - 3,828 6 - 1,025,457 Due from Other Funds - 64,476 1,770,264 1,145 - - - - - - 1,859,176 Prepaids - - - - - - - - - - -
Total Assets $ 418,678 $ 178,267 $ 1,770,264 $ 76,564 $ 173,593 $ 697,787 $ - $ 190,189 $ 10,606 $ 92,396 $ 7,570,614
Liabilities and Fund Balances Liabilities Accounts Payable $ - $ 12,167 $ - $ - $ 613 $ 61,892 $ - $ 30,369 $ - $ - $ 201,249 Accrued Liabilities - - - - - - - - - - - Due to Other Funds 203,707 166,100 - 76,554 11,980 477,644 - 69,129 - - 1,373,018 Deferred Revenue - - - - 161,000 - - - - - 2,558,939
Total Liabilities 203,707 178,267 - 76,554 173,593 539,536 - 99,498 - - 4,133,206
Fund Balances Reserved for Prepaids - - - - - - - - - - - Unreserved Undesignated, Reported In Special Revenue Funds 214,971 - 1,770,264 10 - - - - - - 3,085,464 Capital Projects Funds - - - - - 158,251 - - - - 158,251 Debt Service Funds - - - - - - - 90,691 10,606 92,396 193,693
Total Fund Balances 214,971 - 1,770,264 10 - 158,251 - 90,691 10,606 92,396 3,437,408
Total Liabilities and Fund Balances $ 418,678 $ 178,267 $ 1,770,264 $ 76,564 $ 173,593 $ 697,787 $ - $ 190,189 $ 10,606 $ 92,396 $ 7,570,614
65
Special Revenue Funds Debt Service Funds

CITY OF COVINGTON, KENTUCKYCOMBINING STATEMENT OF REVENUES, EXPENDITURES, AND CHANGES IN FUND BALANCE
NON-MAJOR GOVERNMENTAL FUNDSYear Ended June 30, 2009
Special Revenue Funds
Police and Fire Incentive
Newport Steel UDAG
Devou Park Maintenance
Investor Program
City Hall Operations
Federal and State
Grant Fund Arts
District
501 Main Street
Operations Police
Forfeiture
Police Block Grant
Revenues Taxes $ - $ - $ - $ - $ - $ - $ - $ - $ - $ - Licenses and Permits - - - - - - - - - - Intergovernmental 898,749 - - - - 413,768 - - 169,604 - Charges for Services - - - - 263,324 - - 17,748 - - Fines and Forfeitures - - - - - - - - - - Investment Earnings - 23,460 609 2,145 45 - - - 2,938 - Miscellaneous - 152,102 - 187,112 - - - - - -
Total Revenues 898,749 175,562 609 189,257 263,369 413,768 - 17,748 172,542 -
Expenditures Current General Government - - 57,336 - 259,740 415,143 - 26,993 - - Police 429,111 - - - - - - - 107,186 - Fire 469,015 - - - - 1,653 - - - - General Services - - - - - - - - - - Recreation - - - - - - - - - - Code Enforcement and Economic Development - 3,195 - 54,024 - - - - - - Parking Garage - - - - - - - - - - Debt Service Principal - - - - - - 20,000 19,394 - - Interest and Other Charges - - - - - - 10,220 47,717 - - Capital Outlay - - - - - - - - - -
Total Expenditures 898,126 3,195 57,336 54,024 259,740 416,796 30,220 94,104 107,186 -
Excess (Deficit) of Revenues Over Expenditures 623 172,367 (56,727) 135,233 3,629 (3,028) (30,220) (76,356) 65,356 -
Other Financing Sources (Uses) Transfers In - - 82,268 - - 3,095 30,220 76,356 369 - Capital Lease Acquisitions - - - - - - - - - - Transfers Out - - - (15,944) - - - - - (370)
Total Other Financing Sources (Uses) - - 82,268 (15,944) - 3,095 30,220 76,356 369 (370)
Net Change in Fund Balances 623 172,367 25,541 119,289 3,629 67 - - 65,725 (370)
Fund Balance July 1, 2008 1,804 2,368 25,421 452,532 - - 10,010 - 220,843 370
Fund Balance June 30, 2009 $ 2,427 $ 174,735 $ 50,962 $ 571,821 $ 3,629 $ 67 $ 10,010 $ - $ 286,568 $ -
66

CITY OF COVINGTON, KENTUCKYCOMBINING STATEMENT OF REVENUES, EXPENDITURES, AND CHANGES IN FUND BALANCE
NON-MAJOR GOVERNMENTAL FUNDSYear Ended June 30, 2009
(Continued)
CapitalProjects
CAD System
Renaissance Grant Fund
Working Capital Reserve
Property Acquisitions
Home Consortium
Fund
Capital Improvement
Fund
KLC Series 2002
2004 Pension
Obligation Bonds
2005 Refunding
Bonds
Sewer Maintenance
Fees
Non-Major Governmental
Funds Revenues Taxes $ 785,551 $ - $ - $ - $ - $ - $ - $ - $ - $ - $ 785,551 Licenses and Permits - - - - - - - - - - - Intergovernmental - 408,074 - - 201,187 521,792 - - - - 2,297,434 Charges for Services - - - 9 - - - - - - 281,081 Fines and Forfeitures - - - - - - - - - - - Investment Earnings 1,038 - - - - 27,047 - 960 90 1,325 59,657 Miscellaneous - - - - - 61,503 - - - - 400,717
Total Revenues 786,589 408,074 - 9 201,187 610,342 - 960 90 1,325 3,824,440
Expenditures Current General Government - - - - - - - 102,324 - - 861,536 Police - - - - - - - - - - 536,297 Fire - - - - - - - - - - 470,668 General Services - - - - - - - - - - - Recreation - - - - - - - - - - - Code Enforcement and Economic Development - 150,435 - - 201,187 - - - - - 408,841 Parking Garage - - - - - - - - - - - Debt Service Principal - - - 304,929 - 287,396 534,721 350,000 1,030,000 349,940 2,896,380 Interest and Other Charges - - - 15,943 - 187,154 464,401 877,602 155,585 - 1,758,622 Capital Outlay - 322,115 - 75,419 - 5,304,774 - - - - 5,702,308
Total Expenditures - 472,550 - 396,291 201,187 5,779,324 999,122 1,329,926 1,185,585 349,940 12,634,652
Excess (Deficit) of Revenues Over Expenditures 786,589 (64,476) - (396,282) - (5,168,982) (999,122) (1,328,966) (1,185,495) (348,615) (8,810,212)
Other Financing Sources (Uses) Transfers In - 64,476 400,000 15,944 - 790,581 999,122 1,320,502 1,185,585 - 5,284,258 Proceeds from Sale of Land - - - 304,929 - - - 304,929 Proceeds of Short Term Debt - - - 75,419 - - - - - - 75,419 Capital Lease Acquisitions - - - - - 4,509,181 - - - - 4,509,181 Transfers Out (784,000) - - - - (64,476) - - - - (864,790)
Total Other Financing Sources (Uses) (784,000) 64,476 400,000 396,292 - 5,235,286 999,122 1,320,502 1,185,585 - 9,308,997
Net Change in Fund Balances 2,589 - 400,000 10 - 66,304 - (8,464) 90 (348,615) 498,785
Fund Balance July 1, 2008 212,382 - 1,370,264 - - 91,947 - 99,155 10,516 441,011 2,938,623
Fund Balance June 30, 2009 $ 214,971 $ - $ 1,770,264 $ 10 $ - $ 158,251 $ - $ 90,691 $ 10,606 $ 92,396 $ 3,437,408
67
Special Revenue Funds Debt Service Funds

INDIVIDUAL FUND SCHEDULES
NON-MAJOR GOVERNMENTAL FUNDS

CITY OF COVINGTON, KENTUCKY
SCHEDULE OF REVENUES, EXPENDITURES AND CHANGES IN FUND BALANCE
BUDGET AND ACTUAL (WITH VARIANCES)
POLICE AND FIRE INCENTIVE
Year Ended June 30, 2009
Variance
with Final
Original Final Actual Budget
Revenues
Intergovernmental $ 950,000 $ 950,000 $ 898,749 $ (51,251)
Expenditures
Police 453,500 453,500 429,111 24,389
Fire 496,500 496,500 469,015 27,485
Total Expenditures 950,000 950,000 898,126 51,874
Excess (Deficit) of Revenues Over
Expenditures - - 623 623
Fund Balance July 1, 2008 - - 1,804 1,804
Fund Balance June 30, 2009 $ - $ - $ 2,427 $ 2,427
68
Budgeted Amounts

CITY OF COVINGTON, KENTUCKY
SCHEDULE OF REVENUES, EXPENDITURES AND CHANGES IN FUND BALANCE
BUDGET AND ACTUAL (WITH VARIANCES)
NEWPORT STEEL UDAG
Year Ended June 30, 2009
Variance
Budgeted Amounts with Final
Original Final Actual Budget
Revenues
Investment Earnings $ 30,000 $ 30,000 $ 23,460 $ (6,540)
Miscellaneous 160,000 160,000 152,102 (7,898)
Total Revenues 190,000 190,000 175,562 (14,438)
Expenditures
Code Enforcement and
Economic Development 250,000 250,000 3,195 246,805
Excess (Deficit) of Revenues Over
Expenditures (60,000) (60,000) 172,367 232,367
Fund Balance July 1, 2008 60,000 60,000 2,368 (57,632)
Fund Balance June 30, 2009 $ - $ - $ 174,735 $ 174,735
69
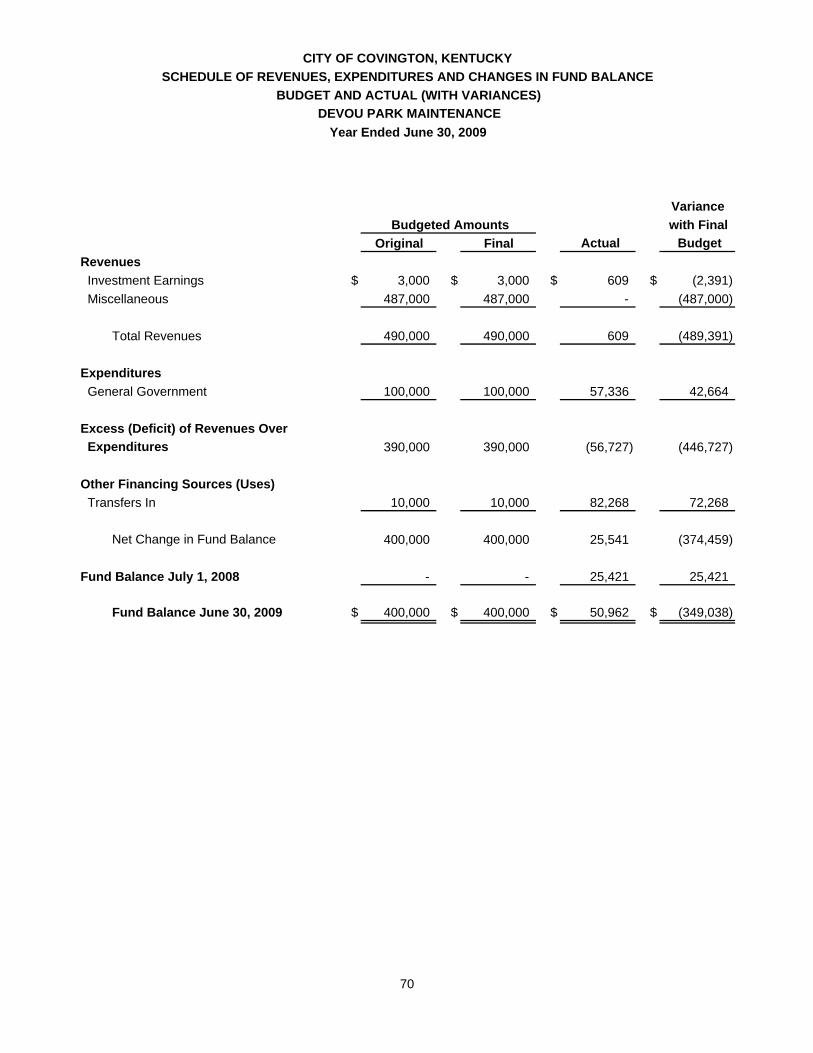
CITY OF COVINGTON, KENTUCKY
SCHEDULE OF REVENUES, EXPENDITURES AND CHANGES IN FUND BALANCE
BUDGET AND ACTUAL (WITH VARIANCES)
DEVOU PARK MAINTENANCE
Year Ended June 30, 2009
Variance
with Final
Original Final Actual Budget
Revenues
Investment Earnings $ 3,000 $ 3,000 $ 609 $ (2,391)
Miscellaneous 487,000 487,000 - (487,000)
Total Revenues 490,000 490,000 609 (489,391)
Expenditures
General Government 100,000 100,000 57,336 42,664
Excess (Deficit) of Revenues Over
Expenditures 390,000 390,000 (56,727) (446,727)
Other Financing Sources (Uses)
Transfers In 10,000 10,000 82,268 72,268
Net Change in Fund Balance 400,000 400,000 25,541 (374,459)
Fund Balance July 1, 2008 - - 25,421 25,421
Fund Balance June 30, 2009 $ 400,000 $ 400,000 $ 50,962 $ (349,038)
70
Budgeted Amounts
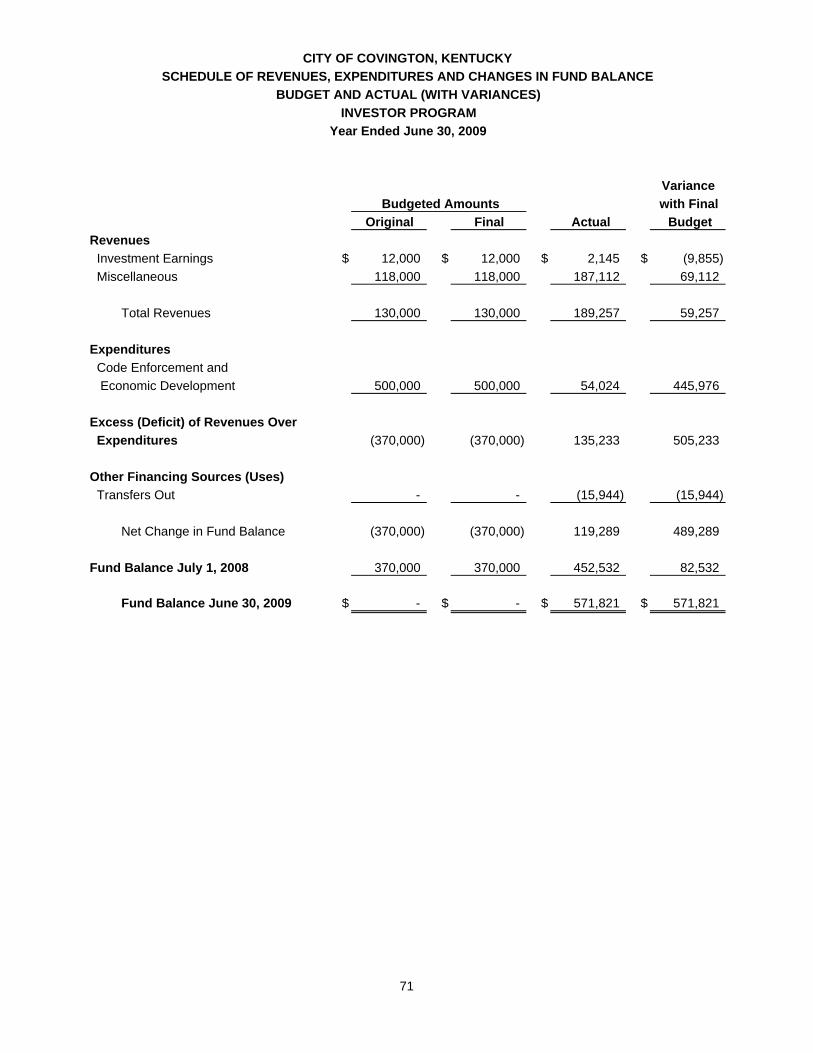
CITY OF COVINGTON, KENTUCKY
SCHEDULE OF REVENUES, EXPENDITURES AND CHANGES IN FUND BALANCE
BUDGET AND ACTUAL (WITH VARIANCES)
INVESTOR PROGRAM
Year Ended June 30, 2009
Variance
with Final
Original Final Actual Budget
Revenues
Investment Earnings $ 12,000 $ 12,000 $ 2,145 $ (9,855)
Miscellaneous 118,000 118,000 187,112 69,112
Total Revenues 130,000 130,000 189,257 59,257
Expenditures
Code Enforcement and
Economic Development 500,000 500,000 54,024 445,976
Excess (Deficit) of Revenues Over
Expenditures (370,000) (370,000) 135,233 505,233
Other Financing Sources (Uses)
Transfers Out - - (15,944) (15,944)
Net Change in Fund Balance (370,000) (370,000) 119,289 489,289
Fund Balance July 1, 2008 370,000 370,000 452,532 82,532
Fund Balance June 30, 2009 $ - $ - $ 571,821 $ 571,821
71
Budgeted Amounts

CITY OF COVINGTON, KENTUCKY
SCHEDULE OF REVENUES, EXPENDITURES AND CHANGES IN FUND BALANCE
BUDGET AND ACTUAL (WITH VARIANCES)
CITY HALL OPERATIONS
Year Ended June 30, 2009
Variance
with Final
Original Final Actual Budget
Revenues
Charges for Services $ 270,933 $ 270,933 $ 263,324 $ (7,609)
Investment Earnings - - 45 45
Total Revenues 270,933 270,933 263,369 (7,564)
Expenditures
General Government 306,857 306,857 259,740 47,117
Capital Outlay 16,495 16,495 - 16,495
Total Expenditures 323,352 323,352 259,740 63,612
Excess (Deficit) of Revenues Over
Expenditures (52,419) (52,419) 3,629 56,048
Other Financing Sources (Uses)
Transfers In 52,419 52,419 - (52,419)
Net Change in Fund Balance - - 3,629 3,629
Fund Balance July 1, 2008 - - - -
Fund Balance June 30, 2009 $ - $ - $ 3,629 $ 3,629
72
Budgeted Amounts

CITY OF COVINGTON, KENTUCKY
SCHEDULE OF REVENUES, EXPENDITURES AND CHANGES IN FUND BALANCE
BUDGET AND ACTUAL (WITH VARIANCES)
FEDERAL AND STATE GRANT FUND
Year Ended June 30, 2009
Variance
Budgeted Amounts with Final
Original Final Actual Budget
Revenues
Intergovernmental $ 250,000 $ 275,000 $ 413,768 $ 138,768
Expenditures
General Government - 488,000 415,143 72,857
Fire 250,000 162,000 1,653 160,347
Total Expenditures 250,000 650,000 416,796 233,204
Excess (Deficit) of Revenues Over
Expenditures - 375,000 (3,028) 371,972
Transfers In - - 3,095 3,095
Net Change in Fund Balance - (375,000) 67 375,067
Fund Balance July 1, 2008 - - - -
Fund Balance June 30, 2009 $ - $ (375,000) $ 67 $ 375,067
73

CITY OF COVINGTON, KENTUCKY
SCHEDULE OF REVENUES, EXPENDITURES AND CHANGES IN FUND BALANCE
BUDGET AND ACTUAL (WITH VARIANCES)
ARTS DISTRICT
Year Ended June 30, 2009
Variance
Budgeted Amounts with Final
Original Final Actual Budget
Expenditures
Debt Service
Principal $ 20,000 $ 20,000 $ 20,000 $ -
Interest and Other Charges 30,000 30,000 10,220 19,780
Total Expenditures 50,000 50,000 30,220 19,780
Excess (Deficit) of Revenues Over
Expenditures (50,000) (50,000) (30,220) 19,780
Other Financing Sources (Uses)
Transfers In 50,000 50,000 30,220 (19,780)
Net Change in Fund Balance - - - -
Fund Balance July 1, 2008 - - 10,010 10,010
Fund Balance June 30, 2009 $ - $ - $ 10,010 $ 10,010
74

CITY OF COVINGTON, KENTUCKY
SCHEDULE OF REVENUES, EXPENDITURES AND CHANGES IN FUND BALANCE
BUDGET AND ACTUAL (WITH VARIANCES)
501 MAIN STREET OPERATIONS
Year Ended June 30, 2009
Variance
with Final
Original Final Actual Budget
Revenues
Charges for Services $ 15,408 $ 15,408 $ 17,748 $ 2,340
Expenditures
General Government 40,808 40,808 26,993 13,815
Debt Service
Principal - - 19,394 (19,394)
Interest and Other Charges 72,000 72,000 47,717 24,283
Total Expenditures 112,808 112,808 94,104 18,704
Excess (Deficit) of Revenues Over
Expenditures (97,400) (97,400) (76,356) 21,044
Other Financing Sources (Uses)
Transfers In 97,400 97,400 76,356 (21,044)
Net Change in Fund Balance - - - -
Fund Balance July 1, 2008 - - - -
Fund Balance June 30, 2009 $ - $ - $ - $ -
75
Budgeted Amounts

CITY OF COVINGTON, KENTUCKY
SCHEDULE OF REVENUES, EXPENDITURES AND CHANGES IN FUND BALANCE
BUDGET AND ACTUAL (WITH VARIANCES)
POLICE FORFEITURE
Year Ended June 30, 2009
Variance
with Final
Original Final Actual Budget
Revenues
Intergovernmental $ 190,000 $ 190,000 $ 169,604 $ (20,396)
Investment Earnings 10,000 10,000 2,938 (7,062)
Total Revenues 200,000 200,000 172,542 (27,458)
Expenditures
Police 115,000 115,000 107,186 7,814
Capital Outlay 85,000 85,000 - 85,000
Total Expenditures 200,000 200,000 107,186 92,814
Excess (Deficit) of Revenues Over
Expenditures - - 65,356 65,356
Other Financing Sources (Uses)
Transfers In - - 369 369
Net Change in Fund Balance - - 65,725 65,725
Fund Balance July 1, 2008 - - 220,843 220,843
Fund Balance June 30, 2009 $ - $ - $ 286,568 $ 286,568
76
Budgeted Amounts

CITY OF COVINGTON, KENTUCKY
SCHEDULE OF REVENUES, EXPENDITURES AND CHANGES IN FUND BALANCE
BUDGET AND ACTUAL (WITH VARIANCES)
POLICE BLOCK GRANT
Year Ended June 30, 2009
Variance
with Final
Original Final Actual Budget
Revenues
Intergovernmental $ 40,000 $ 40,000 $ - $ (40,000)
Expenditures
Capital Outlay 40,000 40,000 - 40,000
Excess (Deficit) of Revenues Over
Expenditures - - - -
Other Financing Sources (Uses)
Transfers Out - - (370) (370)
Net Change in Fund Balance - - (370) (370)
Fund Balance July 1, 2008 - - 370 370
Fund Balance June 30, 2009 $ - $ - $ - $ -
77
Budgeted Amounts

CITY OF COVINGTON, KENTUCKY
SCHEDULE OF REVENUES, EXPENDITURES AND CHANGES IN FUND BALANCE
BUDGET AND ACTUAL (WITH VARIANCES)
CAD SYSTEM
Year Ended June 30, 2009
Variance
with Final
Original Final Actual Budget
Revenues
Taxes $ 637,000 $ 787,000 $ 785,551 $ (1,449)
Investment Earnings 2,000 2,000 1,038 (962)
Total Revenues 639,000 789,000 786,589 (2,411)
Excess (Deficit) of Revenues Over
Expenditures 639,000 789,000 786,589 (2,411)
Other Financing Sources (Uses)
Proceeds of Short Term Debt - - - -
Transfers Out (639,000) (789,000) (784,000) 5,000
Total other Financing Sources (639,000) (789,000) (784,000) 5,000
Net Change in Fund Balance - - 2,589 2,589
Fund Balance July 1, 2008 - - 212,382 212,382
Fund Balance June 30, 2009 $ - $ - $ 214,971 $ 214,971
78
Budgeted Amounts

CITY OF COVINGTON, KENTUCKY
SCHEDULE OF REVENUES, EXPENDITURES AND CHANGES IN FUND BALANCE
BUDGET AND ACTUAL (WITH VARIANCES)
RENAISSANCE GRANT FUND
Year Ended June 30, 2009
Variance
with Final
Original Final Actual Budget
Revenues
Intergovernmental $ 500,000 $ 500,000 $ 408,074 $ (91,926)
Expenditures
Code Enforcement and
Economic Development 100,000 100,000 150,435 (50,435)
Capital Outlay 400,000 400,000 322,115 77,885
Total Expenditures 500,000 500,000 472,550 27,450
Excess (Deficit) of Revenues Over
Expenditures - - (64,476) (64,476)
Other Financing Sources (Uses)
Transfers In - - 64,476 64,476
Net Change in Fund Balance - - - -
Fund Balance July 1, 2008 - - - -
Fund Balance June 30, 2009 $ - $ - $ - $ -
79
Budgeted Amounts

CITY OF COVINGTON, KENTUCKY
SCHEDULE OF REVENUES, EXPENDITURES AND CHANGES IN FUND BALANCE
BUDGET AND ACTUAL (WITH VARIANCES)
WORKING CAPITAL RESERVE
Year Ended June 30, 2009
Variance
with Final
Original Final Actual Budget
Other Financing Sources (Uses)
Transfers In $ 400,000 $ 400,000 $ 400,000 $ -
Net Change in Fund Balance 400,000 400,000 400,000 -
Fund Balance July 1, 2008 - - 1,370,264 1,370,264
Fund Balance June 30, 2009 $ 400,000 $ 400,000 $ 1,770,264 $ 1,370,264
80
Budgeted Amounts

CITY OF COVINGTON, KENTUCKY
SCHEDULE OF REVENUES, EXPENDITURES AND CHANGES IN FUND BALANCE
BUDGET AND ACTUAL (WITH VARIANCES)
PROPERTY ACQUISITIONS
Year Ended June 30, 2009
Variance
with Final
Original Final Actual Budget
Revenues
Charges for Services $ - $ - $ 9 $ 9
Expenditures
Debt Service
Principal - 475,000 304,929 170,071
Interest and Other Charges 24,000 25,000 15,943 9,057
Capital Outlay - - 75,419 (75,419)
Total Expenditures 24,000 500,000 396,291 103,709
Excess (Deficit) of Revenues Over
Expenditures (24,000) (500,000) (396,282) 103,718
Other Financing Sources (Uses)
Proceeds of Short Term Debt - 75,000 75,419 419
Proceeds From Sale of Land - - 304,929 304,929
Transfers In - 25,000 15,944 (9,056)
Total Other Financing Sources - 100,000 396,292 296,292
Net Change in Fund Balance (24,000) (400,000) 10 (400,010)
Fund Balance July 1, 2008 - - - -
Fund Balance June 30, 2009 $ (24,000) $ (400,000) $ 10 $ (400,010)
81
Budgeted Amounts

CITY OF COVINGTON, KENTUCKY
SCHEDULE OF REVENUES, EXPENDITURES AND CHANGES IN FUND BALANCE
BUDGET AND ACTUAL (WITH VARIANCES)
HOME CONSORTIUM FUND
Year Ended June 30, 2009
Variance
with Final
Original Final Actual Budget
Revenues
Intergovernmental $ 327,456 $ 327,456 $ 201,187 $ (126,269)
Expenditures
Code Enforcement and
Economic Development 254,786 254,786 201,187 53,599
Excess (Deficit) of Revenues Over
Expenditures 72,670 72,670 - (72,670)
Fund Balance July 1, 2008 - - - -
Fund Balance June 30, 2009 $ 72,670 $ 72,670 $ - $ -
82
Budgeted Amounts

CITY OF COVINGTON, KENTUCKY
SCHEDULE OF REVENUES, EXPENDITURES AND CHANGES IN FUND BALANCE
BUDGET AND ACTUAL (WITH VARIANCES)
CAPITAL IMPROVEMENT FUND
Year Ended June 30, 2009
Variance
with Final
Original Final Actual Budget
Revenues
Intergovernmental $ 738,051 $ 1,038,017 $ 521,792 $ (516,225)
Investment Earnings - - 27,047 27,047
Miscellaneous - - 61,503 61,503
Total Revenues 738,051 1,038,017 610,342 (427,675)
Expenditures
Debt Service
Principal 137,731 293,955 287,396 6,559
Interest and Other Charges 55,697 232,822 187,154 45,668
Capital Outlay 4,023,834 5,555,356 5,304,774 250,582
Total Expenditures 4,217,262 6,082,133 5,779,324 302,809
Excess (Deficit) of Revenues Over
Expenditures (3,479,211) (5,044,116) (5,168,982) (124,866)
Other Financing Sources (Uses)
Transfers In 550,000 722,105 790,581 68,476
Capital Lease Acquisitions 2,929,211 4,859,711 4,509,181 (350,530)
Transfers Out - - (64,476) (64,476)
Total Other Financing
Sources (Uses) 3,479,211 5,581,816 5,235,286 (346,530)
Net Change in Fund Balance - 537,700 66,304 (471,396)
Fund Balance July 1, 2008 - - 91,947 91,947
Fund Balance June 30, 2009 $ - $ 537,700 $ 158,251 $ (379,449)
83
Budgeted Amounts

CITY OF COVINGTON, KENTUCKY
SCHEDULE OF REVENUES, EXPENDITURES AND CHANGES IN FUND BALANCE
BUDGET AND ACTUAL (WITH VARIANCES)
KLC SERIES 2002
Year Ended June 30, 2009
Variance
with Final
Original Final Actual Budget
Expenditures
Debt Service
Principal $ 534,721 $ 534,721 $ 534,721 $ -
Interest and Other Charges 514,401 514,401 464,401 50,000
Total Expenditures 1,049,122 1,049,122 999,122 50,000
Excess (Deficit) of Revenues Over Expenditures (1,049,122) (1,049,122) (999,122) 50,000
Other Financing Sources (Uses)
Transfers In 1,049,122 1,049,122 999,122 (50,000)
Net Change in Fund Balance - - - -
Fund Balance July 1, 2008 - - - -
Fund Balance June 30, 2009 $ - $ - $ - $ -
84
Budgeted Amounts

CITY OF COVINGTON, KENTUCKY
SCHEDULE OF REVENUES, EXPENDITURES AND CHANGES IN FUND BALANCE
BUDGET AND ACTUAL (WITH VARIANCES)
2004 PENSION OBLIGATION BONDS
Year Ended June 30, 2009
Variance
with Final
Original Final Actual Budget
Revenues
Investment Earnings $ - $ - $ 960 $ 960
Expenditures
General Government 75,000 110,000 102,324 7,676
Debt Service
Principal 350,000 350,000 350,000 -
Interest and Other Charges 717,579 982,579 877,602 104,977
Total Expenditures 1,142,579 1,442,579 1,329,926 112,653
Deficit of Revenues Over Expenditures (1,142,579) (1,442,579) (1,328,966) 113,613
Other Financing Sources (Uses)
Transfers In 1,142,579 1,442,579 1,320,502 (122,077)
Net Change in Fund Balance - - (8,464) (8,464)
Fund Balance July 1, 2008 - - 99,155 99,155
Fund Balance June 30, 2009 $ - $ - $ 90,691 $ 90,691
85
Budgeted Amounts

CITY OF COVINGTON, KENTUCKYSCHEDULE OF REVENUES, EXPENDITURES AND CHANGES IN FUND BALANCE
BUDGET AND ACTUAL (WITH VARIANCES) 2005 REFUNDING BONDS Year Ended June 30, 2009
Variancewith Final
Original Final Actual Budget Revenues
Investment Earnings $ - $ - $ 90 $ 90
ExpendituresDebt Service
Principal 1,030,000 1,030,000 1,030,000 - Interest and Other Charges 180,585 180,585 155,585 25,000
Total Expenditures 1,210,585 1,210,585 1,185,585 25,000
Deficit of Revenues Over Expenditures (1,210,585) (1,210,585) (1,185,495) 25,090
Other Financing Sources (Uses)Transfers In 1,210,585 1,210,585 1,185,585 (25,000)
Net Change in Fund Balance - - 90 90
Fund Balance July 1, 2008 - - 10,516 10,516
Fund Balance June 30, 2009 $ - $ - $ 10,606 $ 10,606
86
Budgeted Amounts

CITY OF COVINGTON, KENTUCKY
SCHEDULE OF REVENUES, EXPENDITURES AND CHANGES IN FUND BALANCE
BUDGET AND ACTUAL (WITH VARIANCES)
SEWER MAINTENANCE FEES
Year Ended June 30, 2009
Variance
with Final
Original Final Actual Budget
Revenues
Investment Earnings $ 15,000 $ 15,000 $ 1,325 $ (13,675)
Expenditures
Principal 400,000 400,000 349,940 50,060
Excess (Deficit) of Revenues Over
Expenditures (385,000) (385,000) (348,615) 36,385
Fund Balance July 1, 2008 385,000 385,000 441,011 56,011
Fund Balance June 30, 2009 $ - $ - $ 92,396 $ 92,396
87
Budgeted Amounts

COMBINING FINANCIAL STATEMENTS
PROPRIETARY FUNDS

CITY OF COVINGTON, KENTUCKY
COMBINING STATEMENT OF NET ASSETS
INTERNAL SERVICE FUNDS
June 30, 2009
Internal Service Funds
Liability Insurance
Medical and Dental
Insurance Total
Assets
Current Assets
Cash and Cash Equivalents $ 1,188,521 $ 244,575 $ 1,433,096
Due from Other Funds 40,866 1,052,874 1,093,740
Total Assets 1,229,387 1,297,449 2,526,836
Liabilities
Current Liabilities
Accounts Payable 2,039 752 2,791
Estimated Liability for Claims - 1,287,680 1,287,680
Due to Other Funds 20,433 6,928 27,361
Total Liabilities 22,472 1,295,360 1,317,832
Net AssetsUnrestricted $ 1,206,915 $ 2,089 $ 1,209,004
88

CITY OF COVINGTON, KENTUCKY
COMBINING STATEMENT OF REVENUES, EXPENSES AND CHANGES IN FUND NET ASSETS
INTERNAL SERVICE FUNDS
Year Ended June 30, 2009
Internal Service Funds
Liability Insurance
Medical and Dental
Insurance Total
Operating Revenues
Insurance Premium Payments $ - $ 5,179,713 $ 5,179,713
Other Operating Revenues - 148,308 148,308
Total Operating Revenues - 5,328,021 5,328,021
Operating Expenses
Contractual Services 253,469 390,148 643,617
Claims and Judgments 711,895 5,048,819 5,760,714
Total Operating Expenses 965,364 5,438,967 6,404,331
Operating Loss (965,364) (110,946) (1,076,310)
Non-Operating Revenues
Investment Income 9,187 3,258 12,445
Loss Before Transfers (956,177) (107,688) (1,063,865)
Transfers In 683,682 - 683,682
Change in Net Assets (272,495) (107,688) (380,183)
Net Assets July 1, 2008 1,479,410 109,777 1,589,187
Net Assets June 30, 2009 $ 1,206,915 $ 2,089 $ 1,209,004
89

Liability Insurance
Medical and Dental
Insurance TotalCash Flows From Operating Activities
Cash Received from Other Funds $ 1,098,074 $ 5,075,127 $ 6,173,201
Cash Received from Other Activities - 148,308 148,308
Cash Paid for Claims (1,012,668) (5,214,943) (6,227,611)
Net Cash Used by Operating Activities 85,406 8,492 93,898
Cash Flows from Non-Capital Financing Activities
Transfer from Other Funds 683,682 - 683,682
Cash Flows from Investing Activities
Interest Income 9,187 3,258 12,445
Net Change in Cash 778,275 11,750 790,025
Cash and Cash Equivalents July 1, 2008 410,246 232,825 643,071
Cash and Cash Equivalents June 30, 2009 $ 1,188,521 $ 244,575 $ 1,433,096
Reconciliation of Operating Loss to Net
Cash (Used) Provided by Operating Activities
Operating (Loss) Income $ (965,364) $ (110,946) $ (1,076,310)
Change in Assets and Liabilities
Accounts Receivable - 210,968 210,968
Due from Other Funds 1,627,641 (322,482) 1,305,159
Accounts Payable (47,304) (1,625) (48,929)
Estimated Liability for Claims - 225,649 225,649
Due to Other Funds (529,567) 6,928 (522,639)
Net Cash Used by Operating Activities $ 85,406 $ 8,492 $ 93,898
Internal Service Funds
90
CITY OF COVINGTON, KENTUCKY
COMBINING STATEMENT OF CASH FLOWS
INTERNAL SERVICE FUNDS
Year Ended June 30, 2009

INDIVIDUAL FUND SCHEDULES
PROPRIETARY FUNDS

CITY OF COVINGTON, KENTUCKY
SCHEDULE OF REVENUES, EXPENSES AND CHANGES IN FUND NET ASSETS
BUDGET AND ACTUAL (WITH VARIANCES)
LIABILITY INSURANCE
Year Ended June 30, 2009
Variance
with Final
Original Final Actual Budget
Operating Revenues
Insurance Premium Payments $ - $ - $ - $ -
Other Operating Revenues - - - -
Total Operating Revenues - - - -
Operating Expenses
Contractual Services 160,000 260,000 253,469 6,531
Claims and Judgments 65,000 715,000 711,895 3,105
Total Operating Expenses 225,000 975,000 965,364 9,636
Operating Loss (225,000) (975,000) (965,364) 9,636
Non-Operating Revenues
Investment Income 25,000 25,000 9,187 (15,813)
Income (Loss) Before Transfers (200,000) (950,000) (956,177) (6,177)
Transfers In 200,000 600,000 683,682 83,682
Change in Net Assets - (350,000) (272,495) 77,505
Net Assets July 1, 2008 - 350,000 1,479,410 1,129,410
Net Assets June 30, 2009 $ - $ - $ 1,206,915 $ 1,206,915
91
Budgeted Amounts

CITY OF COVINGTON, KENTUCKY
SCHEDULE OF REVENUES, EXPENSES AND CHANGES IN FUND NET ASSETS
BUDGET AND ACTUAL (WITH VARIANCES)
MEDICAL AND DENTAL INSURANCE
Year Ended June 30, 2009
Variance
with Final
Original Final Actual Budget
Operating Revenues
Insurance Premium Payments $ 5,055,000 $ 5,555,000 $ 5,179,713 $ (375,287)
Other Operating Revenues 135,000 135,000 148,308 13,308
Total Operating Revenues 5,190,000 5,690,000 5,328,021 (361,979)
Operating Expenses
Contractual Services 348,551 448,551 390,148 58,403
Claims and Judgments 4,851,449 5,251,449 5,048,819 202,630
Total Operating Expenses 5,200,000 5,700,000 5,438,967 261,033
Operating Loss (10,000) (10,000) (110,946) (100,946)
Non-Operating Revenues
Investment Income 10,000 10,000 3,258 (6,742)
Income (Loss) Before Transfers - - (107,688) (107,688)
Transfers In - - - -
Change in Net Assets - - (107,688) (107,688)
Net Assets July 1, 2008 - - 109,777 109,777
Net Assets June 30, 2009 $ - $ - $ 2,089 $ 2,089
92
Budgeted Amounts

COMBINING FINANCIAL STATEMENTS
FIDUCIARY FUNDS

CITY OF COVINGTON, KENTUCKY
COMBINING STATEMENT OF FIDUCIARY NET ASSETS
FIDUCIARY FUNDS
June 30, 2009
Fiduciary Funds
Employees' Retirement
Police and Firemen's Pension Totals
Assets
Cash and Cash Equivalents $ 307,826 $ 1,179,534 $ 1,487,360
Investments - Mutual Funds 3,668,448 8,776,175 12,444,623
Notes Receivable - 2,582 2,582
Total Assets 3,976,274 9,958,291 13,934,565
Liabilities
Accounts Payable - 945 945
Due to Other Funds 108,353 708,526 816,879
Total Liabilities 108,353 709,471 817,824
Net AssetsHeld in Trust for Pension Benefits $ 3,867,921 $ 9,248,820 $ 13,116,741
93

CITY OF COVINGTON, KENTUCKY
COMBINING STATEMENT OF CHANGES IN FIDUCIARY NET ASSETS
FIDUCIARY FUNDS
Year Ended June 30, 2009
Fiduciary Funds
Employees' Retirement
Police and Firemen's Pension Totals
Additions
Contributions
Employee Contributions $ 8,485 $ - $ 8,485
Impounding Lot - 116,353 116,353
Total Revenues 8,485 116,353 124,838
Investment Earnings
Interest and Dividends 173,035 413,841 586,876
Net (Depreciation) in
Fair Value of Investments (1,212,446) (3,011,861) (4,224,307)
Total Investment Earnings (1,039,411) (2,598,020) (3,637,431)
Total Additions (1,030,926) (2,481,667) (3,512,593)
Deductions
Benefit Payments 656,304 1,681,680 2,337,984
Administration 17,339 45,466 62,805
Impounding Lot - 10,111 10,111
Total Deductions 673,643 1,737,257 2,410,900
Change in Net Assets (1,704,569) (4,218,924) (5,923,493)
Net Assets July 1, 2008 5,572,490 13,467,744 19,040,234
Net Assets June 30, 2009 $ 3,867,921 $ 9,248,820 $ 13,116,741
94

STATISTICAL SECTION (1)
(1) A statistical table presenting Revenue Bond Coverage – last ten fiscal years is not included since the City has no enterprise funds.
A statistical table presenting direct and overlapping debt is not included since no general obligation bonds are outstanding. A statistical table presenting special assessments billings and collections is not included since there are no special assessments.

Schedule 1City of CovingtonNet Assets by Component,Last Seven Fiscal Years(accrual basis of accounting)
2009 2008 2007 2006 2005 2004 2003
Governmental Activities / Primary GovernmentInvested in Capital Assets, net of Related Debt 36,577,167 41,334,965 39,709,313 40,851,867 41,483,876 4,519,630 (2,888,790) Restricted 193,693 550,682 888,123 1,307,719 1,593,846 1,943,252 1,943,882 Unrestricted 16,638,487 16,603,105 17,286,863 15,104,828 1,947,609 15,614,883 22,540,375
Total Governmental Activities Net Asset 53,409,347 58,488,752 57,884,299 57,264,414 45,025,331 22,077,765 21,595,467
Note: The city implemented GASB Statement 34 in fiscal year 2003
Fiscal Year
95

Schedule 2City of CovingtonChanges in Net AssetsLast Seven Fiscal Years(accrual basis of accounting)
2009 2008 2007 2006 2005 2004 2003
ExpensesGovernmental Activities:
General Government 12,149,528 7,807,872 6,975,709 7,781,587 9,381,965 3,939,011 4,822,043 Police 15,593,684 15,501,195 14,873,868 14,482,761 13,660,495 13,582,260 12,712,976 Fire 14,224,985 14,753,208 13,595,531 12,512,512 11,930,245 11,286,851 10,328,208 General Service 7,185,210 5,995,347 6,001,968 5,324,831 5,561,622 8,020,228 7,440,215 Recreation 2,740,960 2,426,639 2,350,546 2,325,250 2,575,568 1,045,289 787,164 Code Enforcement and
Economic Development 10,217,357 9,777,154 9,345,867 9,817,626 9,086,241 9,825,619 10,876,935 Parking Garage 701,986 747,677 734,401 727,419 803,715 809,425 743,982 Interest on Long-term Debt 2,052,549 1,935,242 1,872,816 1,919,888 1,437,434 1,171,229 1,605,271
Total Governmental Activities Expenses 64,866,259 58,944,334 55,750,706 54,891,874 54,437,285 49,679,912 49,316,794
Program RevenuesGovernmental Activities:
General Government 993,267 1,145,333 1,096,558 1,215,111 761,041 1,928,888 1,737,441 Police 406,557 382,318 331,579 372,192 - 344,287 516,097 Fire 1,077,448 1,084,825 1,073,548 912,526 987,802 546,276 510,848 General Service 1,859,171 1,464,056 1,170,789 1,226,952 1,092,970 1,154,023 1,373,968 Recreation - 90,465 39,525 Code Enforcement and
Economic Development 37,833 41,860 114,177 56,017 1,312,485 Parking Garage 1,143,276 1,120,916 1,041,332 1,059,369 1,252,755 Interest on Long-term Debt - 1,194,146 Operating Grants and Contributions 9,664,170 10,823,567 8,840,224 9,652,316 8,754,883 9,218,291 9,114,414 Capital Grants and Contributions 1,650,920 2,050,654 1,279,884 716,322 3,106,704 902,562 799,478
Total Governmental Activities Expenses 16,832,642 18,113,529 14,948,091 15,210,805 15,956,155 15,378,938 15,404,256
Total Net (expense) revenue (48,033,617) (40,830,805) (40,802,615) (39,681,069) (38,481,130) (34,300,974) (33,912,538)
General Revenues and Other changes in Net AssetsGovernmental Activities:
TaxesReal Property Taxes, Levied for General Purposes 6,024,885 4,680,355 5,590,772 5,913,401 4,399,593 4,945,540 5,094,960 Personal Property Taxes, Levied for General Purposes 653,748 601,109 553,057 589,401 496,286 474,360 679,089 Public Services Taxes 2,140,821 2,178,804 1,978,504 2,092,335 1,909,267 1,892,053 2,078,467 Taxes, Levied for Bank Deposits 53,161 67,789 59,042 62,232 62,323 102,802 74,272 Insurance Premium Taxes 5,430,628 4,860,194 5,242,337 5,324,223 5,240,743 4,909,972 4,746,726 Payroll Taxes 23,697,247 23,287,559 21,656,929 21,263,831 19,543,654 18,319,549 17,683,867 Net Profit Taxes 2,555,089 2,779,489 2,959,729 2,554,150 2,303,123 2,590,933 1,993,189 Other Taxes 790,752 647,217 552,641 490,889 358,751 376,845 351,664
Investment earnings 112,064 317,416 389,885 310,239 228,382 132,820 186,286 Fines and Forfeitures - 444,832 Licenses and Permits - 367,376 Commissions - - Special item - Gain/(Loss) on Sale of Capital Assets - - 214,010 576,242 - Miscellaneous 1,495,817 2,015,326 2,225,594 1,710,802 1,878,640 1,038,363 20,047,710 Transfers - (14,275,000) (345,200)
Total General Revenues and Transfers 42,954,212 41,435,258 41,422,500 40,887,745 22,957,970 34,783,237 52,591,030
Change in Net AssetsTotal Primary Government (5,079,405) 604,453 619,885 1,206,676 (15,523,160) 482,263 18,678,492
Note: The city implemented GASB Statement 34 in fiscal year 2003.
Fiscal Year
96

Schedule 3City of CovingtonFund Balances, Governmental Funds,Last Ten Fiscal Years( modified accrual basis of accounting)
2009 2008 2007 2006 2005 2004 2003 2002 2001 2000
General FundReserved 41,414 4,483 1,611 122,892$ 5,388$ -$ -$ 125,771$ 115,779$ 129,072$ Unreserved 730,555 735,839 675,320 550,513 229,739 291,457 920,556 1,204,885 1,208,499 938,012
Total general fund 771,969$ 740,322$ 676,931$ 673,405$ 235,127$ 291,457$ 920,556$ 1,330,656$ 1,324,278$ 1,067,084$
All Other Governmental FundsReserved -$ -$ -$ -$ -$ -$ -$ 39,342$ -$ -$ Unreserved, reported in:
Special revenue funds 4,821,080 4,296,812 3,713,572 810,353 1,207,276 2,578,865 3,439,783 3,037,818 4,466,029 5,429,314 Capital projects funds 158,251 91,947 469,730 - - Debt service funds 193,693 550,682 888,123 1,307,719 1,593,846 3,745,979 4,053,087 6,494,886 13,141,399 5,501,061
Total all other governmental funds 5,173,024$ 4,939,441$ 5,071,425$ 2,118,072$ 2,801,122$ 6,324,844$ 7,492,870$ 9,572,046$ 17,607,428$ 10,930,375$
Fiscal Year
97

Schedule 4City of CovingtonChanges in Fund Balance, Governmental Funds,Last Seven Fiscal Years(modified accrual basis of accounting)
2009 2008 2007 2006 2005 2004 2003Revenues
Taxes 14,707,297 13,682,151 13,554,260 13,466,713 12,762,470 12,395,102 12,104,042 Licenses and Permits 26,550,329 26,357,476 24,897,197 24,123,130 22,214,153 21,287,327 20,028,720 Intergovernmental 11,691,463 12,063,637 11,204,089 10,345,557 9,636,936 10,120,853 9,913,892 Charges for services 4,744,058 4,527,680 4,104,170 4,128,721 4,094,568 4,745,670 4,721,842 Fines and Forfeitures 712,072 669,260 711,786 603,286 444,832 478,752 447,020 Investment Earnings 99,619 270,519 330,536 278,531 223,704 123,538 186,286 Miscellaneous 1,557,868 2,382,312 2,342,372 1,734,234 4,109,294 1,539,153 2,656,223
Total Revenues 60,062,706 59,953,035 57,144,410 54,680,172 53,485,957 50,690,395 50,058,025
Expenditures
CurrentGeneral Government 3,783,523 3,554,133 3,092,518 3,537,750 3,365,074 3,366,630 3,558,293 Police 14,886,861 15,013,636 14,359,432 14,109,828 13,239,562 12,833,125 11,913,958 Fire 13,306,319 13,959,222 12,989,464 12,168,065 11,429,099 10,800,154 9,947,813 General Service 6,690,503 5,644,983 5,292,360 5,180,111 5,358,833 7,761,571 7,105,526 Recreation 2,533,103 2,347,048 2,309,959 2,289,413 2,372,300 717,870 737,049 Code Enforcement andEconomic Development 10,138,570 9,771,182 9,098,909 9,832,881 9,096,233 9,778,417 10,831,082 Parking Garage 701,986 747,677 734,401 727,419 803,715 809,425 743,982
Debt ServicePrincipal 3,516,517 2,918,585 2,727,985 2,763,879 5,553,494 7,665,518 12,325,046 Interest and Other Charges 2,054,516 1,829,031 1,701,223 1,965,386 1,509,839 1,464,763 1,605,271
Capital Outlay 6,715,050 4,159,916 3,257,621 2,701,215 6,722,898 3,082,026 6,247,041
Total Expenditures 64,326,948 59,945,413 55,563,872 55,275,947 59,451,047 58,279,499 65,015,061
Excess of revenuesOver (under)Expenditures (4,264,242) 7,622 1,580,538 (595,775) (5,965,090) (7,589,104) (14,957,036)
Other FinancingSources (Uses)
Bonds issued 12,806,241 4,996,000 - Capital lease proceeds 4,509,181 1,630,000 840,944 12,809,056 Transfers in 6,063,518 5,377,180 6,169,710 6,006,833 11,506,504 3,006,160 2,766,134 Transfer out (6,747,200) (5,881,142) (6,663,029) (6,252,032) (25,926,704) (3,051,160) (3,111,334) Proceeds from short tem debt 75,419 427,747 596,202 Miscellaneous (1,003)
Total other financing sources (uses) 3,900,918 (76,215) 1,136,681 351,003 (1,614,962) 5,791,944 12,463,856
Special ItemProceeds from Sale of Capital Asse 628,554 239,660
Net change in fund balances 265,230 (68,593) 2,956,879 (244,772) (7,580,052) (1,797,160) (2,493,180)
Debt service as a percentage ofnon capital expenditures 9.67% 8.51% 8.47% 9.00% 13.40% 16.54% 23.70%
Fiscal Year
Note: With the implementation of GASB statement 34 in fiscal year 2003, classification of revenue and expenditure by category were revised and not restated for earlier fiscal years
98

Schedule 5City of CovingtonOccupational License Fees - Payroll WithholdingLast Ten Fiscal Years
Total TotalFiscal Gross Withholding Total DirectYear Taxable Wages Fees Rate
2000 61,669,264,000 15,417,316 0.025%2001 65,562,528,000 16,390,632 0.025%2002 67,515,012,000 16,878,753 0.025%2003 70,735,468,000 17,683,867 0.025%2004 73,278,196,000 18,319,549 0.025%2005 78,174,616,000 19,543,654 0.025%2006 85,055,324,000 21,263,831 0.025%2007 86,627,716,000 21,656,929 0.025%2008 93,150,236,000 23,287,559 0.025%2009 94,788,988,000 23,697,247 0.025%
Notes: There has been no change in tax rate since adoption in 1966
99

Schedule 6City of CovingtonPrincipal Occupational Payroll Tax PayersCurrent Year and Nine Years Ago
A. C. Nielsen A. C. NielsenAtkins & Pearce Atkins & PearceClub Chef Commonwealth of KentuckyCommonwealth of Kentucky Covington Board of EducationCovington Board of Education Duro BagFidelity Investments Fidelity InvestmentsInternal Revenue Service Internal Revenue ServiceNo. Ky. Mental Health and Retardation Board No. Ky. Mental Health and Retardation BoardOmnicare Rosedale ManorSt. Elizabeth Hospital St. Elizabeth Hospital
Notes: Taxpayer information is listed alphabetically.
Source: City of Covington Finance Department
2009 2000Taxpayer
100

Schedule 7City of CovingtonAssessed Value and Estimated Actual Value of Taxable Property,Last Ten Fiscal Years
TotalTotal Taxable Direct
Fiscal Real Personal Tax-Exempt Assessed TaxYear Property Property Property Value Rate
2000 1,240,574 171,655 57,440 1,354,789 0.322 2001 1,318,915 190,967 59,908 1,449,974 0.322 2002 1,374,693 179,133 60,047 1,493,779 0.322 2003 1,554,730 179,132 57,688 1,676,174 0.299 2004 1,600,532 155,966 58,542 1,697,956 0.299 2005 1,617,670 160,191 57,720 1,720,141 0.299 2006 1,687,690 203,668 57,570 1,833,788 0.299 2007 1,828,664 195,876 58,296 1,966,244 0.284 2008 1,861,435 187,585 61,243 1,987,777 0.292 2009 1,897,368 217,242 59,898 2,054,712 0.299
Notes: Property in Covington is reassessed once every four years. City property was last reassessed in 2007. The next reassessment will occur in 2011. The reassessment is conductedby the Kenton County Property Value Administrator. The property is assessed at 100% of value.
Values are stated in thousands of dollars
Tax rates are per $100 of assessed value.
101

Schedule 8City of CovingtonDirect and Overlapping Property Tax Rates,Last Ten Fiscal Years(rate per $100 of assessed value)
City Covington KentonFiscal Direct Covington Kenton Schools CountyYear Rate Independent County County State Other Area Schools Area
2000 0.3223 0.870 0.478 0.1310 0.141 0.1077 1.5720 1.1800 2001 0.3223 0.890 0.477 0.1310 0.136 0.1100 1.5893 1.1763 2002 0.3223 0.865 0.492 0.1310 0.135 0.1120 1.5420 1.1690 2003 0.2990 0.894 0.548 0.1310 0.133 0.1150 1.5720 1.2260 2004 0.2990 0.925 0.558 0.1350 0.131 0.1320 1.6220 1.2550 2005 0.2990 0.942 0.556 0.1360 0.131 0.1350 1.6430 1.2570 2006 0.2990 0.922 0.556 0.1380 0.128 0.1410 1.6132 1.2472 2007 0.2842 0.961 0.564 0.1410 0.124 0.1488 1.6590 1.2620 2008 0.2924 0.961 0.564 0.1420 0.124 0.1488 1.6682 1.2712 2009 0.2995 0.989 0.558 0.1420 0.122 0.1530 1.7055 1.2745
Notes: Portions of the City of Covington are located in Kenton County Common School District and pay taxes to that entity instead of Covington Independent School District. Consequently both rates are shown.
The city's basic property tax may be increased up to the compensating rate plus 4% without being subject to a voter referendum. Thecompensating rate is defined as that rate which when applied to the current years assessment of property subject to taxation excludingnew property and personal property produces an amount of revenue equal to that produced in the preceding year.
School Districts Totals
102

Schedule 9City of CovingtonPrincipal Property Tax Payers,Current Year and Nine Years Ago
Percentage Percentageof Total City of Total City
Taxable Taxable Taxable TaxableAssessed Assessed Assessed Assessed
Taxpayer Value Rank Value Value Rank Value
CPX-Rivercenter Dev/Corp 140,183,400$ 1 7.38% 105,948,100$ 1 6.03%Fidelity Properties Inc 86,021,500 2 4.53% 61,406,500 2 3.49%Scott Street Land Co. Inc 14,960,900 3 0.79%OZRE Lodging I LLC 13,947,100 4 0.73%Atkins & Pearce Manu. 10,900,000 5 0.57% 12,432,500 3 0.71%J & S Co. Inc. 10,482,000 6 0.55% 10,649,000 4 0.61%Castilinni Company 6,812,500 7 0.36%Scottenstein Trust 6,565,000 8 0.35%Truss Realty 6,550,000 9 0.35% 7,758,500 7 0.44%Atria Highland Crossing 6,480,000 10 0.34% 10,100,000 5 0.58%J G Covington Hotel, LLC 9,600,000 6 0.55%Bluffs Apartments, LLC 7,575,000 8 0.43%Gibson Greeting Card 7,118,000 9 0.41%A.C.C.D. Co. Inc. 6,486,000 10 0.37%
Total 302,902,400$ 15.96% 239,073,600$ 13.62%
2009 2000
103

Schedule 10City of CovingtonProperty Tax Levies and Collections,Last Seven Fiscal Years
FiscalYear Taxes Levied Collections
Ended for the Percentage in Subsequent PercentageJune 30 Fiscal Year Amount of Levy Years Amount of Levy
2003 5,011,764$ 4,824,742$ 96.27% 174,198$ 4,998,940$ 99.74%2004 5,076,892 4,907,183 96.66% 149,125$ 5,056,308$ 99.59%2005 5,143,225 4,926,477 95.79% 180,789$ 5,107,266$ 99.30%2006 5,483,028 5,293,287 96.54% 132,740$ 5,426,027$ 98.96%2007 5,656,394 5,469,125 96.69% 95,227$ 5,564,352$ 98.37%2008 5,900,071 5,672,319 96.14% 91,391$ 5,763,710$ 97.69%2009 6,222,001 5,970,349 95.96% 5,970,349$ 95.96%
Note: Data was not available in the same format presented with the implementation of GASB Statement 44 prior to 2003.
Fiscal Year of the LevyCollected within the
Total Collections to Date
104

Schedule 11City of CovingtonRatios of Outstanding Debt by Type,Last Seven Fiscal Years(dollars in thousands, except per capita)
General Total Percentage Fiscal Obligation Capital Primary of Personal PerYear Bonds Leases Government Income (a) Capita (a)
2003 -$ 36,734$ 36,734$ 3.40% 847$ 2004 4,962 29,344 34,306 3.18% 791$ 2005 26,487 19,415 45,902 4.26% 1,058$ 2006 27,907 15,231 43,138 4.00% 995$ 2007 25,888 16,153 42,041 3.90% 970$ 2008 23,790 15,271 39,061 3.62% 901$ 2009 21,622 18,782 40,404 3.75% 932$
Note: Details of city's outstanding debt can be found in the notes to the financial statements. Data was not available in the same format presented with the implementation of GASB Stetement 44 prior to 2003
(a) See Schedule 12 for personal income and population data.
105

Schedule 12City of CovingtonRatios of General Bonded Debt Outstanding,Last Seven Fiscal Years(dollars in thousands, except per capita)
Percentage ofGeneral Actual Taxable
Fiscal Obligation Value of PerYear Bonds Property Capita
2003 -$ 0.00% -$ 2004 4,962 0.29% 114.41 2005 26,487 1.54% 643.46 2006 27,907 1.52% 596.86 2007 25,888 1.32% 596.91 2008 23,790 1.20% 548.54 2009 21,622 1.05% 498.55
Note: The City had no General Obligation Bonds prior to fiscal year 2003.
106
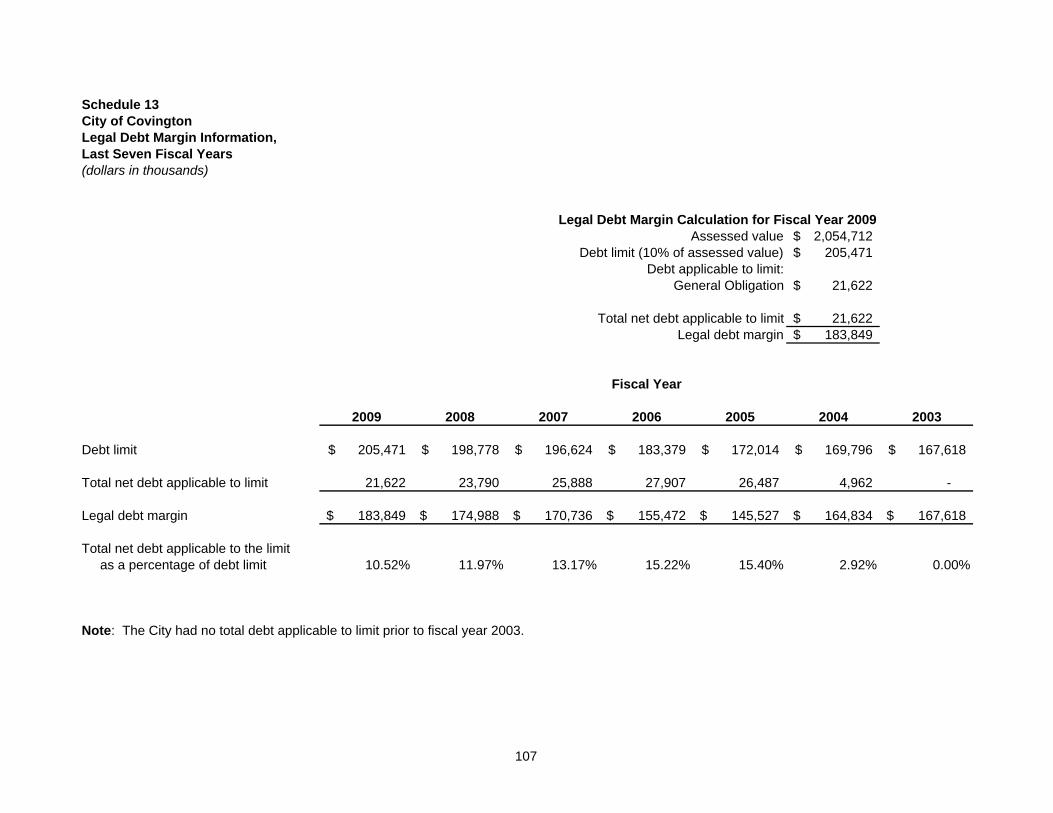
Schedule 13City of CovingtonLegal Debt Margin Information,Last Seven Fiscal Years(dollars in thousands)
2,054,712$ 205,471$
21,622$
21,622$ 183,849$
2009 2008 2007 2006 2005 2004 2003
Debt limit 205,471$ 198,778$ 196,624$ 183,379$ 172,014$ 169,796$ 167,618$
Total net debt applicable to limit 21,622 23,790 25,888 27,907 26,487 4,962 -
Legal debt margin 183,849$ 174,988$ 170,736$ 155,472$ 145,527$ 164,834$ 167,618$
Total net debt applicable to the limit as a percentage of debt limit 10.52% 11.97% 13.17% 15.22% 15.40% 2.92% 0.00%
Note: The City had no total debt applicable to limit prior to fiscal year 2003.
Fiscal Year
Assessed valueLegal Debt Margin Calculation for Fiscal Year 2009
Debt limit (10% of assessed value)Debt applicable to limit:
General Obligation
Total net debt applicable to limitLegal debt margin
107
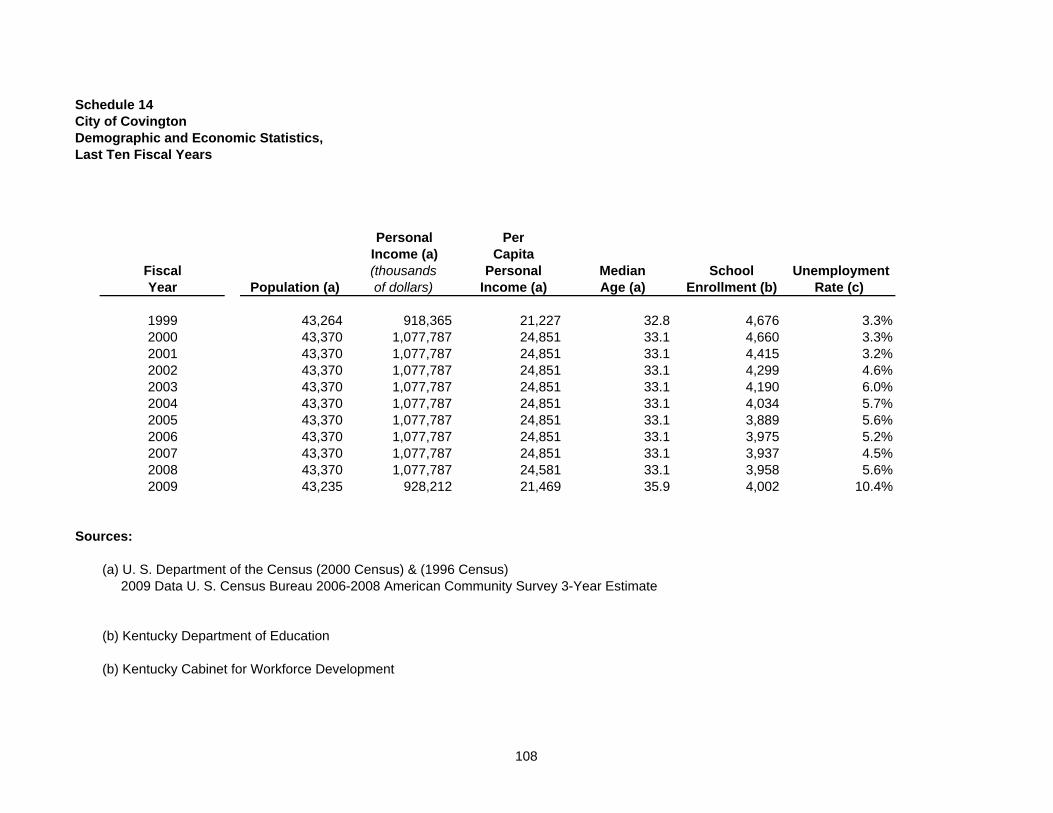
Schedule 14City of CovingtonDemographic and Economic Statistics,Last Ten Fiscal Years
Personal PerIncome (a) Capita
Fiscal (thousands Personal Median School UnemploymentYear Population (a) of dollars) Income (a) Age (a) Enrollment (b) Rate (c)
1999 43,264 918,365 21,227 32.8 4,676 3.3%2000 43,370 1,077,787 24,851 33.1 4,660 3.3%2001 43,370 1,077,787 24,851 33.1 4,415 3.2%2002 43,370 1,077,787 24,851 33.1 4,299 4.6%2003 43,370 1,077,787 24,851 33.1 4,190 6.0%2004 43,370 1,077,787 24,851 33.1 4,034 5.7%2005 43,370 1,077,787 24,851 33.1 3,889 5.6%2006 43,370 1,077,787 24,851 33.1 3,975 5.2%2007 43,370 1,077,787 24,851 33.1 3,937 4.5%2008 43,370 1,077,787 24,581 33.1 3,958 5.6%2009 43,235 928,212 21,469 35.9 4,002 10.4%
Sources:
(a) U. S. Department of the Census (2000 Census) & (1996 Census) 2009 Data U. S. Census Bureau 2006-2008 American Community Survey 3-Year Estimate
(b) Kentucky Department of Education
(b) Kentucky Cabinet for Workforce Development
108

Schedule 15City of CovingtonPrincipal Employers,Current Year
Percentageof Total City
Employer Employees Rank Employment
Internal Revenue Service 4,500 1 20.74%Fidelity Investments 3,900 2 17.97%Covington Board of Education 925 3 4.26%St. Elizabeth Hospital 800 4 3.69%A. C. Nielsen 400 5 1.84%State of Kentucky 360 6 1.66%Ommicare 325 7 1.50%Club Chef 300 8 1.38%No. KY MH-MR Board 280 9 1.29%Atkins & Pearce Mftg 225 10 1.04%
Total 12,015 55.37%
Note: Data is unavailable for nine years ago.
Source: City of Covington Finance Department
2009
109
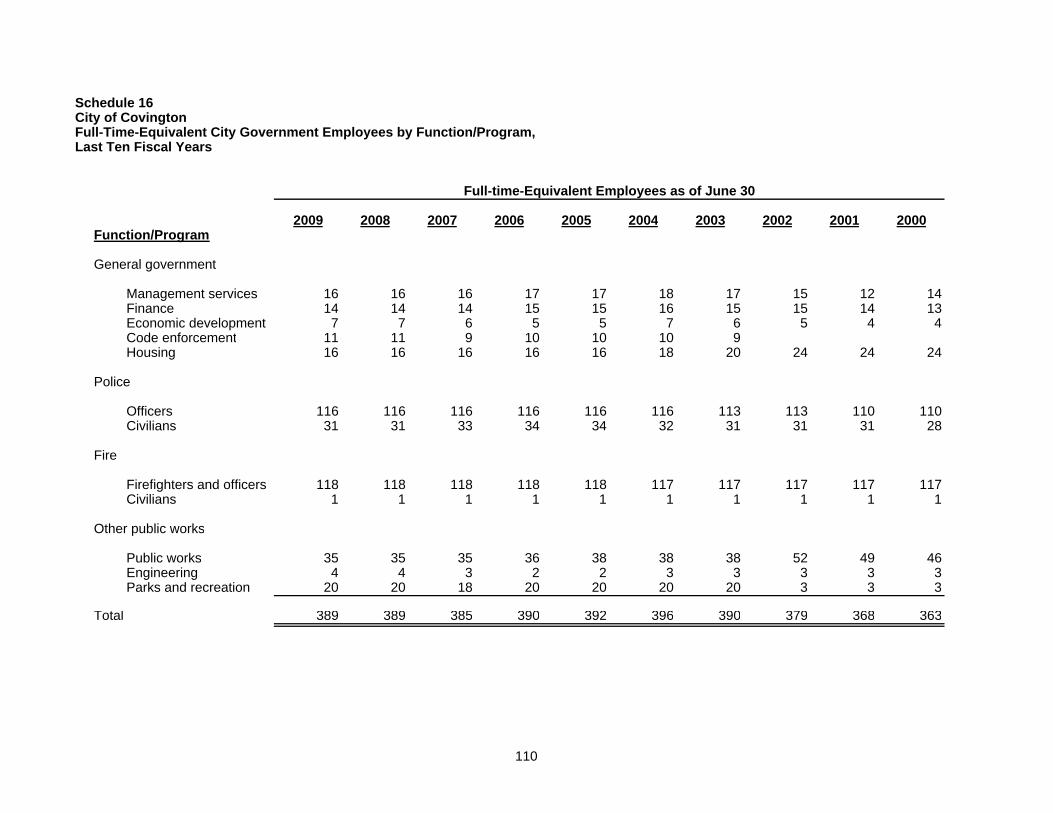
Schedule 16City of CovingtonFull-Time-Equivalent City Government Employees by Function/Program,Last Ten Fiscal Years
2009 2008 2007 2006 2005 2004 2003 2002 2001 2000Function/Program
General government
Management services 16 16 16 17 17 18 17 15 12 14Finance 14 14 14 15 15 16 15 15 14 13Economic development 7 7 6 5 5 7 6 5 4 4Code enforcement 11 11 9 10 10 10 9Housing 16 16 16 16 16 18 20 24 24 24
Police
Officers 116 116 116 116 116 116 113 113 110 110Civilians 31 31 33 34 34 32 31 31 31 28
Fire
Firefighters and officers 118 118 118 118 118 117 117 117 117 117Civilians 1 1 1 1 1 1 1 1 1 1
Other public works
Public works 35 35 35 36 38 38 38 52 49 46Engineering 4 4 3 2 2 3 3 3 3 3Parks and recreation 20 20 18 20 20 20 20 3 3 3
Total 389 389 385 390 392 396 390 379 368 363
Full-time-Equivalent Employees as of June 30
110

Schedule 17City of CovingtonOperating Indicators by Function/Program,Last Ten Fiscal Years
2009 2008 2007 2006 2005 2004 2003 2002 2001 2000Function/Program
Police
Physical arrests 5,248 5,321 5,762 5,819 5,342 5,017 5,167 4,942 5,177 6,426 Parking violations 15,873 14,230 14,863 15,622 14,721 13,016 13,775 15,494 14,216 13,842 Traffic violation 9,116 9,856 9,778 9,721 9,894 9,714 9,581 9,919 9,478 5,540
Fire
Fire responses 2,818 3,658 3,752 3,985 4,167 3,951 4,209 4,376 4,218 4,323 Ambulance runs 10,542 11,549 10,246 9,742 8,602 7,927 7,931 7,755 7,435 7,377 Inspections 2,212 2,440 2,540 2,576 2,521 2,696 2,618 3,291 2,348 2,023
Source: City of Covington Police and Fire Record Management System
Fiscal Year
111

Schedule 18City of CovingtonCapital Assets Statistics by Function/ProgramLast Ten Fiscal Years
2009 2008 2007 2006 2005 2004 2003 2002 2001 2000Function/Program
Police
Stations 1 1 1 1 1 1 1 1 1 1 Zone offices 4 4 4 4 4 5 5 5 5 5 Patrol units 83 83 83 83 83 83 83 83 83 83
Fire stations 5 5 5 5 5 5 5 5 5 5
Other public works
Streets (miles) 120 120 120 130 126 126 120 120 120 120 Streetlights 3,246 3,246 3,246 3,246 3,246 3,246 3,246 3,246 3,246 3,176
Parks and recreation
Acreage 850 850 850 850 850 850 850 850 850 822 Playgrounds 28 28 28 28 28 28 28 28 28 21 Baseball/softball diamonds 10 10 10 10 10 10 10 10 10 14 Soccer/football fields 5 5 5 5 5 5 5 5 5 - Swimming pools 4 4 4 4 4 4 4 4 4 4
Source: City of Covington Engineering Departmen
Fiscal Year
112

SINGLE AUDIT SECTION

Pass-Through Fund FundGrantor's Balance at Balance at
Federal Grantor/Program Title Number June 30, 2008 June 30, 2009
U.S. Department of HUD Direct Programs Section 8 Housing Choice Vouchers 14.871 (M) KY-133-VO-0054-0F04 $ - $ 5,770,696 (F) $ 5,770,696 (F) $ -
1,896,955 30,907 (NF) 369,021 (NF) 1,558,841
Community Development Block Grants/ 14.218 B-02-MC-21-0001 - 1,462,656 (F) 1,462,656 (F) - Entitlement Grants
- 714,344 (NF) 714,344 (NF) -
HOME Program 14.239 (M) M-02-MC-21-0200 103,863 338,100 (NF) 265,188 (NF) 176,775 M-03-MC-21-0200 - 1,106,412 (F) 1,106,412 (F) -
U.S. Department of HUD Direct Programs Highway Safety 20.205 - 36,139 (F) 36,139 (F) -
U.S. Environmental Protection Agency Direct Programs Brownfield Assessments and Cleanup (ARA Grant) 66.818 (M) - 259,327 (F) 259,327 (F) -
Total Federal Financial Assistance - 8,635,230 (F) 8,635,230 (F) - $ 2,000,818 $ 1,083,351 (NF) $ 1,348,553 (NF) $ 1,735,616
F - Federal FundsNF - Non-Federal FundsM - Major Program
Note to Schedule of Federal Awards Basis of Presentation - The accompanying Schedule of Federal Awards includes federal grant activity of the City and is presented on the accrual basis of accounting. The information in this schedule is presented in accordance with the requirements of OMB Circular A-133, therefore some amounts presented in this schedule may differ from amounts presented in or used in the preparation of the basic financial statements.
113
CITY OF COVINGTON, KENTUCKYSCHEDULE OF EXPENDITURES OF FEDERAL AWARDS
Revenues Expenditures
Year Ended June 30, 2009
NumberCFDA
Federal

114
INDEPENDENT AUDITORS' REPORT ON INTERNAL CONTROL OVER
FINANCIAL REPORTING AND ON COMPLIANCE AND OTHER MATTERS BASED ON AN AUDIT OF FINANCIAL STATEMENTS PERFORMED
IN ACCORDANCE WITH GOVERNMENT AUDITING STANDARDS Honorable Mayor Board of Commissioners City of Covington, Kentucky We have audited the financial statements of the governmental activities, the aggregate discretely presented component units, each major fund, and the aggregate remaining fund information of City of Covington, Kentucky as of and for the year ended June 30, 2009, which collectively comprise the City of Covington, Kentucky’s basic financial statements and have issued our report thereon dated November 24, 2009. We conducted our audit in accordance with auditing standards generally accepted in the United States of America and the standards applicable to financial audits contained in Government Auditing Standards, issued by the Comptroller General of the United States. Other auditors audited the financial statements of Devou Properties, Inc. as described in our report on the City of Covington, Kentucky’s financial statements. The financial statements of Devou Properties, Inc. were not audited in accordance with Government Auditing Standards. Internal Control Over Financial Reporting In planning and performing our audit, we considered the City of Covington, Kentucky's internal control over financial reporting as a basis for designing our auditing procedures for the purpose of expressing our opinions on the financial statements, but not for the purpose of expressing an opinion on the effectiveness of the City of Covington, Kentucky’s internal control over financial reporting. Accordingly, we do not express an opinion on the effectiveness of the City of Covington, Kentucky’s internal control over financial reporting. A control deficiency exists when the design or operation of a control does not allow management or employees, in the normal course of performing their assigned functions, to prevent or detect misstatements on a timely basis. A significant deficiency is a control deficiency, or combination of control deficiencies, that adversely affects the City of Covington, Kentucky’s ability to initiate, authorize, record, process, or report financial data reliably in accordance with generally accepted accounting principles such that there is more than a remote likelihood that a misstatement of the City of Covington, Kentucky’s financial statements that is more than inconsequential will not be prevented or detected by the City of Covington, Kentucky’s internal control. A material weakness is a significant deficiency, or combination of significant deficiencies, that results in more than a remote likelihood that a material misstatement of the financial statements will not be prevented or detected by the City of Covington, Kentucky’s internal control. Our consideration of internal control over financial reporting was for the limited purpose described in the first paragraph of this section and would not necessarily identify all deficiencies in internal control that might be significant deficiencies or material weaknesses. We did not identify any deficiencies in internal control over financial reporting that we consider to be material weaknesses, as defined above.

Honorable Mayor Board of Commissioners City of Covington, Kentucky Page Two
115
Compliance and Other Matters As part of obtaining reasonable assurance about whether the City of Covington, Kentucky's financial statements are free of material misstatement, we performed tests of its compliance with certain provisions of laws, regulations, contracts, and grant agreements, noncompliance with which could have a direct and material effect on the determination of financial statement amounts. However, providing an opinion on compliance with those provisions was not an objective of our audit, and accordingly, we do not express such an opinion. The results of our tests disclosed no instances of noncompliance or other matters that are required to be reported under Government Auditing Standards. We noted certain matters that we reported to management of The City of Covington, Kentucky, in a separate letter dated November 24, 2009. This report is intended solely for the information and use of the finance committee, management, others within the organization, the Mayor and Board of Commissioners and federal awarding agencies and pass-through entities and is not intended to be and should not be used by anyone other than these specified parties.
VonLehman & Company Inc. Fort Mitchell, Kentucky November 24, 2009
116
INDEPENDENT AUDITORS’ REPORT ON COMPLIANCE WITH REQUIREMENTS APPLICABLE TO EACH MAJOR
PROGRAM AND INTERNAL CONTROL OVER COMPLIANCE IN ACCORDANCE WITH OMB CIRCULAR A-133
Honorable Mayor Board of Commissioners City of Covington, Kentucky Compliance We have audited the compliance of the City of Covington, Kentucky with the types of compliance requirements described in the U.S. Office of Management and Budget (OMB) Circular A-133 Compliance Supplement that are applicable to each of its major federal programs for the year ended June 30, 2009. The City of Covington, Kentucky's major federal programs are identified in the summary of auditor's results section of the accompanying schedule of findings and questioned costs. Compliance with the requirements of laws, regulations, contracts and grants applicable to each of its major federal programs is the responsibility of the City of Covington, Kentucky's management. Our responsibility is to express an opinion on City of Covington, Kentucky's compliance based on our audit. We conducted our audit of compliance in accordance with auditing standards generally accepted in the United States of America; the standards applicable to financial audits contained in Government Auditing Standards, issued by the Comptroller General of the United States; and OMB Circular A-133, Audits of States, Local Governments, and Non-Profit Organizations. Those standards and OMB Circular A-133 require that we plan and perform the audit to obtain reasonable assurance about whether noncompliance with the types of compliance requirements referred to above that could have a direct and material effect on a major federal program occurred. An audit includes examining, on a test basis, evidence about the City of Covington, Kentucky's compliance with those requirements and performing such other procedures as we considered necessary in the circumstances. We believe that our audit provides a reasonable basis for our opinion. Our audit does not provide a legal determination on the City of Covington, Kentucky's compliance with those requirements. In our opinion, the City of Covington, Kentucky complied, in all material respects, with the requirements referred to above that are applicable to each of its major federal programs for the year ended June 30, 2009. Internal Control Over Compliance The management of the City of Covington, Kentucky is responsible for establishing and maintaining effective internal control over compliance with requirements of laws, regulations, contracts and grants applicable to federal programs. In planning and performing our audit, we considered the City of Covington, Kentucky's internal control over compliance with requirements that could have a direct and material effect on a major federal program in order to determine our auditing procedures for the purpose of expressing our opinion on compliance, but not for the purpose of expressing an opinion on the effectiveness of internal control over compliance. Accordingly, we do not express an opinion on the effectiveness of the City of Covington, Kentucky’s internal control over compliance.

Honorable Mayor Board of Commissioners City of Covington, Kentucky Page Two
117
A control deficiency in an entity’s internal control over compliance exists when the design or operation of a control does not allow management or employees in the normal course of performing their assigned functions, to prevent or detect noncompliance with a type of compliance requirement of a federal program on a timely basis. A significant deficiency is a control deficiency, or a combination of control deficiencies, that adversely affects the entity’s ability to administer a federal program such that there is more than a remote likelihood that noncompliance with a type of compliance requirement of a federal program that is more than inconsequential will not be prevented or detected by the entity’s internal control. We consider the deficiency in internal control over compliance described in the accompanying schedule of findings and questioned costs as item 2009-1 to be a significant deficiency. A material weakness is a significant deficiency, or combination of significant deficiencies, that results in more than a remote likelihood that material noncompliance with a type of compliance requirement of a federal program will not be prevented or detected by the entity’s internal control. We do not consider the deficiency described in the accompany schedule of findings and questioned costs to be a material weakness. The City of Covington’s response to the finding identified in our audit is described in the accompanying schedule of findings and questioned costs. We did not audit the City of Covington’s response and, accordingly, we express no opinion on it. This report is intended solely for the information and use of the finance committee, management, others within the organization, the Mayor and Board of Commissioners and federal awarding agencies and pass-through entities and is not intended to be and should not be used by anyone other than these specified parties.
VonLehman & Company Inc. Fort Mitchell, Kentucky November 24, 2009
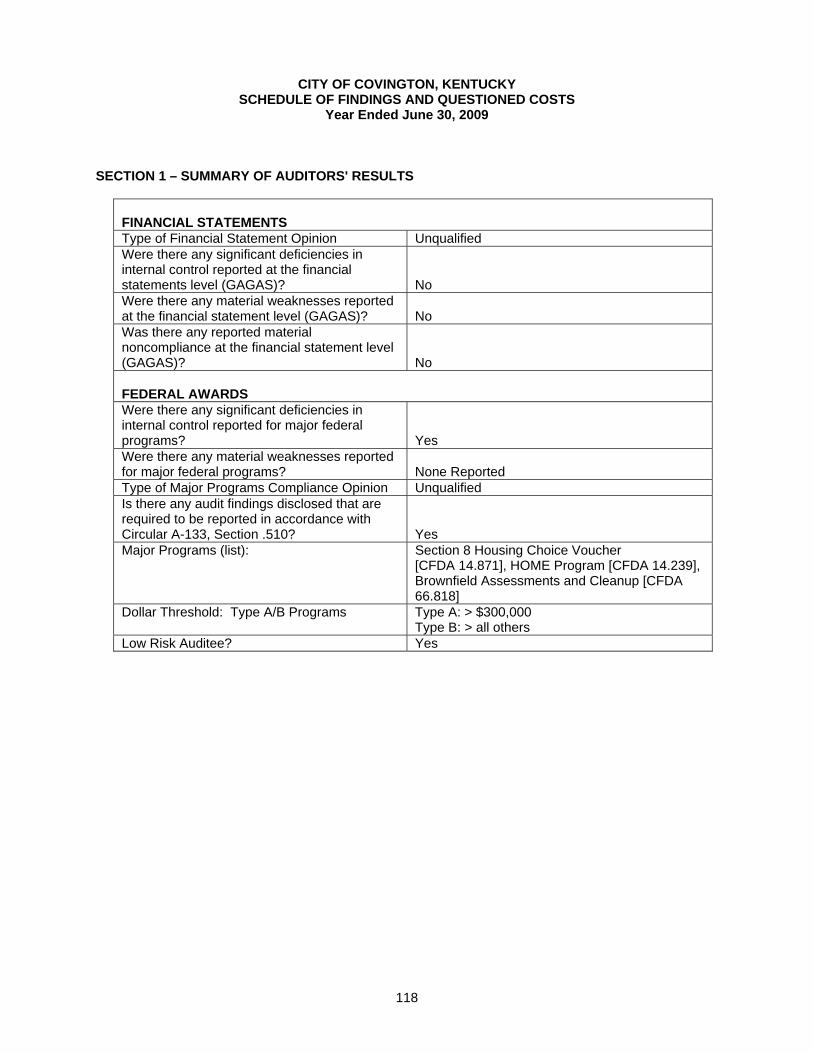
118
CITY OF COVINGTON, KENTUCKY SCHEDULE OF FINDINGS AND QUESTIONED COSTS
Year Ended June 30, 2009 SECTION 1 – SUMMARY OF AUDITORS' RESULTS
FINANCIAL STATEMENTS Type of Financial Statement Opinion Unqualified Were there any significant deficiencies in internal control reported at the financial statements level (GAGAS)?
No
Were there any material weaknesses reported at the financial statement level (GAGAS)?
No
Was there any reported material noncompliance at the financial statement level (GAGAS)?
No
FEDERAL AWARDS Were there any significant deficiencies in internal control reported for major federal programs?
Yes
Were there any material weaknesses reported for major federal programs?
None Reported
Type of Major Programs Compliance Opinion Unqualified Is there any audit findings disclosed that are required to be reported in accordance with Circular A-133, Section .510?
Yes
Major Programs (list): Section 8 Housing Choice Voucher [CFDA 14.871], HOME Program [CFDA 14.239], Brownfield Assessments and Cleanup [CFDA 66.818]
Dollar Threshold: Type A/B Programs Type A: > $300,000 Type B: > all others
Low Risk Auditee? Yes

119
CITY OF COVINGTON, KENTUCKY SCHEDULE OF FINDINGS AND QUESTIONED COSTS
Year Ended June 30, 2009 SECTION II – FINANCIAL STATEMENT FINDINGS
No matters to be reported.
SECTION III – FEDERAL AWARD FINDINGS AND QUESTIONED COSTS Internal Control Over Compliance
HOME Investment Partnership Program – CFDA No. 14.239; Grant No. M-03-MC-21-0200; Grant Period; Year Ended June 30, 2009. 2009-1 Condition: A haphazard sample of 40 loan files was selected. Our tests disclosed that 2 of the 40 files did not contain proper income and debt verifications. The total amount of the federal grant for the year was $1,106,412, and the outstanding balance of loans in the HOME program was $5,537,760 as of June 30, 2009. Criteria: Income and debt verification should be gathered to ensure participants are eligible and able to repay amounts within the terms of the program. Effect: $109,280 of the HOME Program loans are questioned for income and debt verification documentation not available for our examination. We consider this to be material to the program. Cause: The city’s standard policies and procedures were not followed. Recommendation: Appropriate written policies and procedures should be established and enforced to ensure proper income and debt verification documentation is obtained. Management’s Response: Internal review of compliance with standard policy and procedures will be implemented including checklists for required documentation.

120
CITY OF COVINGTON, KENTUCKY SCHEDULE OF STATUS OF PRIOR YEAR FINDINGS AND QUESTIONED COSTS
Year Ended June 30, 2009 PRIOR YEAR – FINANCIAL STATEMENT FINDINGS
No matters were reported.
PRIOR YEAR – FEDERAL AWARD FINDINGS AND QUESTIONED COSTS
Internal Control Over Compliance HOME Investment Partnership Program – CFDA No. 14.239; Grant No. M-03-MC-21-0200; Grant Period; Year Ended June 30, 2008.
2008-1
Condition: A haphazard sample of 40 loan files was selected. Our tests disclosed that 5 of the 40 files did not contain evidence of appropriate and timely on-site inspections. The total amount of the federal grant for the year was $655,755, and the outstanding balance of loans in the HOME program was $4,736,593 as of June 30, 2008.
Criteria: On-site inspections of HOME assisted rental housing must be performed to determine compliance with property standards and verify the information submitted by the owners.
Effect: $78,880 of the HOME Program loans are questioned for inspection documentation not available for our examination. We consider this to be material to the program.
Cause: The city’s standard policies and procedures were not followed.
Recommendation: Appropriate written policies and procedures should be established to ensure timely on-site inspections.
Management’s Response: Periodic internal review of compliance with standard policy and procedures will be implemented including checklists for required documentation. Community Development Block Grants/Entitlement Grants – CFDA No. 14.218; Grant No B-02-MC-21-0001; Grant Period; Year Ended June 30, 2008 Current Year Status: This condition appears to have been corrected.

121
CITY OF COVINGTON, KENTUCKY SCHEDULE OF STATUS OF PRIOR YEAR FINDINGS AND QUESTIONED COSTS
Year Ended June 30, 2009 2008-2
Condition: A haphazard sample of 40 loan files was selected. Our test disclosed that 4 of the 40 files did not contain proper department forms. The total amount of the federal grant for the year was $768,184, and the outstanding balance of the loans in the CDBG program was $5,123,866.
Criteria: For each loans over $200,000 that involves housing rehabilitation, housing construction, or other public construction, the prim recipient must submit Form HUD 60002.
Effect: $815,912 of the CDBG Program loans are questioned for HUD 60002 not available for our examination. We consider this to be material to the program.
Cause: The city’s standard policies and procedures were not followed.
Recommendation: Appropriate policies and procedures should be put into place to ensure HUD 60002 is completed for the appropriate loans.
Management’s Response: Periodic internal review of compliance with standard policy and procedures will be implemented including checklists for required documentation. Current Year Status: This condition appears to have been corrected.