2006 - grupocatalanaoccidente.com/media/files/g/grupo-cat... · - investment returns m. € 165 194...
TRANSCRIPT

1
2006 ANNUAL REPORT Grupo Catalana Occidente, S.A. and Subsidiaries

THE CATALANA OCCIDENTE CONSOLIDATED GROUP 3 YEAR’S SUMMARY AND KEY DATA 4 CONSOLIDATED DIRECTORS’ REPORT 6 BOARD OF DIRECTORS OF THE PARENT COMPANY 7 COMMERCIAL PERFORMANCE 8
Income 8 Portfolio Composition 8 Geographical Distribution 9 Sales Network – Agents 9
PROFIT FOR THE YEAR AND PROPOSED DISTRIBUTION 11
Profit for the year 11 Changes in Consolidated and Attributable Profit 11 Proposed Distribution of Profit 12 Shareholder Remuneration 12
PERFORMANCE OF THE BUSINESS BY AREAS OF ACTIVITY 13
Non-life insurance 13 Multirisk insurance 14 Auto insurance 15 Other 16 Reinsurance 18 Life, Pension Plans and Mutual Funds 19 General Expenses and Commissions 20 Agents’ Balances and Outstanding Premiums 20 Financial Result 21
BALANCE SHEET PERFORMANCE 22
Balance Sheet 22 Change in Equity 23 Technical Provisions and Coverage 23 Solvency Margin 24 Investments and Funds under Management 24 Investees 25
CORPORATE SOCIAL RESPONSABILITY 27
The group’s contribution to society 27 Customers 27 Group employees 28 Cultural and environmental policy 29 Technological development and investment in new technologies 29
INTERNAL CONTROL. Risk Control Systems 30 OUTLOOK FOR 2007: Strategy and Objectives. 31 STANDARDS AND LEGISLATION 32 STOCK MARKET DATA 34 AUDIT 35 CONSOLIDATED FINANCIAL STATEMENTS PREPARED IN ACCORDANCE WITH INTERNATIONAL FINANCIAL REPORTING STANDARDS
Consolidated Balance Sheets 36 Consolidated Income Statement 39 Segmental Consolidated Balance Sheets At 31 December 2006 40 Segmental Consolidated Income Statement 42 Statement of Recognised Income and Expense - Changes In Consolidated Equity 43 Consolidated Cash Flow Statement 44
NOTES TO THE CONSOLIDATED FINANCIAL STATEMENTS PREPARED IN ACCORDANCE WITH INTERNATIONAL FINANCIAL REPORTING STANDARDS AUDITOR’S REPORT ON CONSOLIDATED FINANCIAL STATEMENTS
3
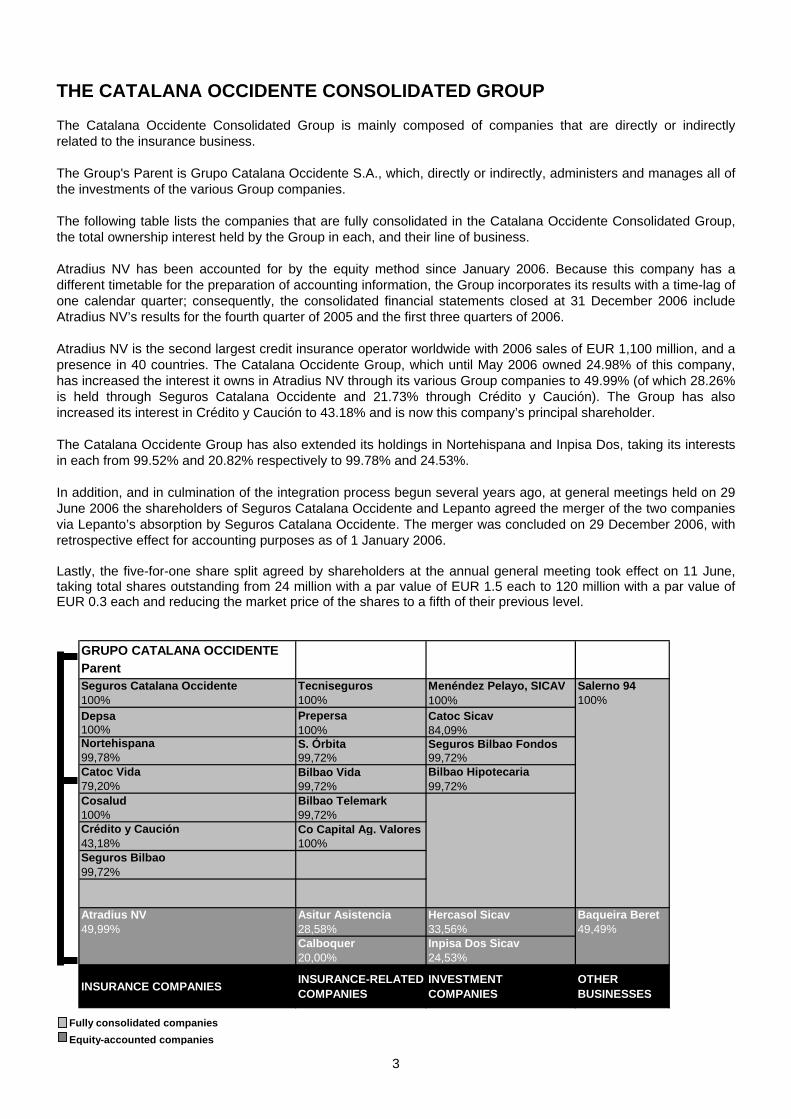
THE CATALANA OCCIDENTE CONSOLIDATED GROUP The Catalana Occidente Consolidated Group is mainly composed of companies that are directly or indirectly related to the insurance business. The Group's Parent is Grupo Catalana Occidente S.A., which, directly or indirectly, administers and manages all of the investments of the various Group companies. The following table lists the companies that are fully consolidated in the Catalana Occidente Consolidated Group, the total ownership interest held by the Group in each, and their line of business. Atradius NV has been accounted for by the equity method since January 2006. Because this company has a different timetable for the preparation of accounting information, the Group incorporates its results with a time-lag of one calendar quarter; consequently, the consolidated financial statements closed at 31 December 2006 include Atradius NV’s results for the fourth quarter of 2005 and the first three quarters of 2006. Atradius NV is the second largest credit insurance operator worldwide with 2006 sales of EUR 1,100 million, and a presence in 40 countries. The Catalana Occidente Group, which until May 2006 owned 24.98% of this company, has increased the interest it owns in Atradius NV through its various Group companies to 49.99% (of which 28.26% is held through Seguros Catalana Occidente and 21.73% through Crédito y Caución). The Group has also increased its interest in Crédito y Caución to 43.18% and is now this company’s principal shareholder. The Catalana Occidente Group has also extended its holdings in Nortehispana and Inpisa Dos, taking its interests in each from 99.52% and 20.82% respectively to 99.78% and 24.53%. In addition, and in culmination of the integration process begun several years ago, at general meetings held on 29 June 2006 the shareholders of Seguros Catalana Occidente and Lepanto agreed the merger of the two companies via Lepanto’s absorption by Seguros Catalana Occidente. The merger was concluded on 29 December 2006, with retrospective effect for accounting purposes as of 1 January 2006. Lastly, the five-for-one share split agreed by shareholders at the annual general meeting took effect on 11 June, taking total shares outstanding from 24 million with a par value of EUR 1.5 each to 120 million with a par value of EUR 0.3 each and reducing the market price of the shares to a fifth of their previous level.
GRUPO CATALANA OCCIDENTEParent Seguros Catalana Occidente Tecniseguros Menéndez Pelayo, SICAV Salerno 94100% 100% 100% 100%Depsa Prepersa Catoc Sicav100% 100% 84,09%Nortehispana S. Órbita Seguros Bilbao Fondos99,78% 99,72% 99,72%Catoc Vida Bilbao Vida Bilbao Hipotecaria79,20% 99,72% 99,72%Cosalud Bilbao Telemark100% 99,72%Crédito y Caución Co Capital Ag. Valores43,18% 100%Seguros Bilbao99,72%
Atradius NV Asitur Asistencia Hercasol Sicav Baqueira Beret49,99% 28,58% 33,56% 49,49%
Calboquer Inpisa Dos Sicav20,00% 24,53%
INSURANCE COMPANIES INSURANCE-RELATED COMPANIES
INVESTMENT COMPANIES
OTHER BUSINESSES
Fully consolidated companiesEquity-accounted companies

4
YEAR’S SUMMARY AND KEY DATA The Group had one of its best years ever in 2006. Consolidated profit and profit attributable to the Parent Company totalled EUR 250 million and EUR 191 million respectively, equating to advances of 42.2% and 39.1% on the already strong figures posted in 2005. Technical profit remained at a level similar to the prior year, thanks to a good business performance and excellent combined ratios in all non-life insurance lines. Equity-accounted investee Atradius NV was included in the scope of consolidation for the first time in 2006, with a consequent impact on the Group’s financial result that more than justified the decision to increase its interest in the associate. Total income rose to EUR 2,419 million, up 9.0%. Of this total, EUR 1.936 million corresponds to premiums billed, which were up 4.0%, EUR 138 million relates to pension plans and mutual funds, which advanced 43.0%, and EUR 345 million came from returns on investments, which showed a 31.6% increase. On the markets, 2006 was also a good year for Catalana Occidente. Having began the year at a price of EUR 14.72 (*), by the year-end the share had surged to EUR 27.45 per share — an annual rerating of EUR 12.73 per share, or return of 86.5%. The outlook and lines of action for 2007 remain generally the same as in prior years and, therefore, we continue working to boost internal growth, by developing our network of agents, to maintain current technical margins, which we consider to be extremely satisfactory, and to contain expenses by harnessing synergies between the various Group companies. Consequently, and given current trends on the financial markets, in 2007 we except to improve on the results we achieved in 2006, although, in a scenario of rising combined ratios, this will be largely dependant on our technical margins and ability to contain costs as synergies between the various Group companies are transformed into cost savings. (*) Price recalculated on the basis of 120,000,000 shares.

5
The table of key data above includes figures for 2004, 2005 and 2006 calculated on the basis of IFRSs. For the purposes of comparison with previous years, the table also includes historical data from 2002 to 2005 prepared according to Spanish GAAP. To prepare the information contained in this directors’ report, in accordance with the terms stated in the section on the application of International Accounting Standards, the standards approved at each of the 2004, 2005 and 2006 year-ends have been taken into account. This means that, for the data relating to the 2004 year-end, IFRSs 32 and 39 on the measurement of assets have not been taken into consideration.
% Change2002 2003 2004 2005 2004 2005 2006 04-05
INCOME- PREMIUMS M. € 1,298 1,300 1,730 1,862 1,730 1,862 1,936 4.0- PENS. PLAN AND MUTUAL FUND CONTRIBUTIONS M. € 24 31 60 97 60 97 138 43.0TOTAL PREMIUMS AND CONTRIBUTIONS M. € 1,322 1,331 1,790 1,959 1,790 1,959 2,074 5.9- INVESTMENT RETURNS M. € 165 194 238 229 253 261 345 31.6TOTAL INCOME M. € 1,487 1,525 2,028 2,188 2,043 2,220 2,419 9.0
EQUITY- SHARE CAPITAL M. € 36 36 36 36 36 36 36 -- EQUITY RESERVES AND VALUATION ADJUSTMENTS M. € 231 257 472 583 485 950 1,307 37.6TOTAL EQUITY M. € 267 293 508 619 521 986 1,343 36.2
TECHNICAL PROVISIONS M. € 2,970 3,159 4,447 4,746 4,399 4,613 4,864 5.4
TOTAL EQUITY ANDTECHNICAL PROVISIONS M. € 3,237 3,452 4,955 5,365 4,920 5,599 6,207 10.9
DISPOSABLEEQUITY M. € 681 750 863 1,057 979 1,246 1,667 33.8
E TOTAL FUNDS UNDER MANAGEMENT M. € 3,194 3,584 5,163 5,975 5,322 6,073 6,910 13.8
F CONSOLIDATED PROFIT M. € 41.0 76.4 113.9 145.4 127.5 175.5 249.5 42.2
NET PROFIT ATTRIBUTABLE TO MINORITY INTERESTS M. € 11.0 26.3 23.3 27.6 23.9 37.9 58.1 53.3TO PARENT COMPANY M. € 30.0 50.1 90.6 117.8 103.6 137.6 191.4 39.1
DATA PER SHAREPROFIT ATTRIBUTED TO PARENT € 0.25 0.42 0.76 0.98 0.86 1.15 1.59 39.1DIVIDEND PER SHARE € 0.20 0.20 0.20 0.29 0.22 0.29 0.40 37.0PAY-OUT % 77.6 48.9 29.7 29.7 25.9 25.5 25.2 -1.2
G
H
A
B
C
D
KEY DATA
IFRSsLOCAL SPANISH STANDARDS

6
GRUPO CATALANA OCCIDENTE, S.A. AND SUBSIDIARIES Consolidated Directors’ Report
7
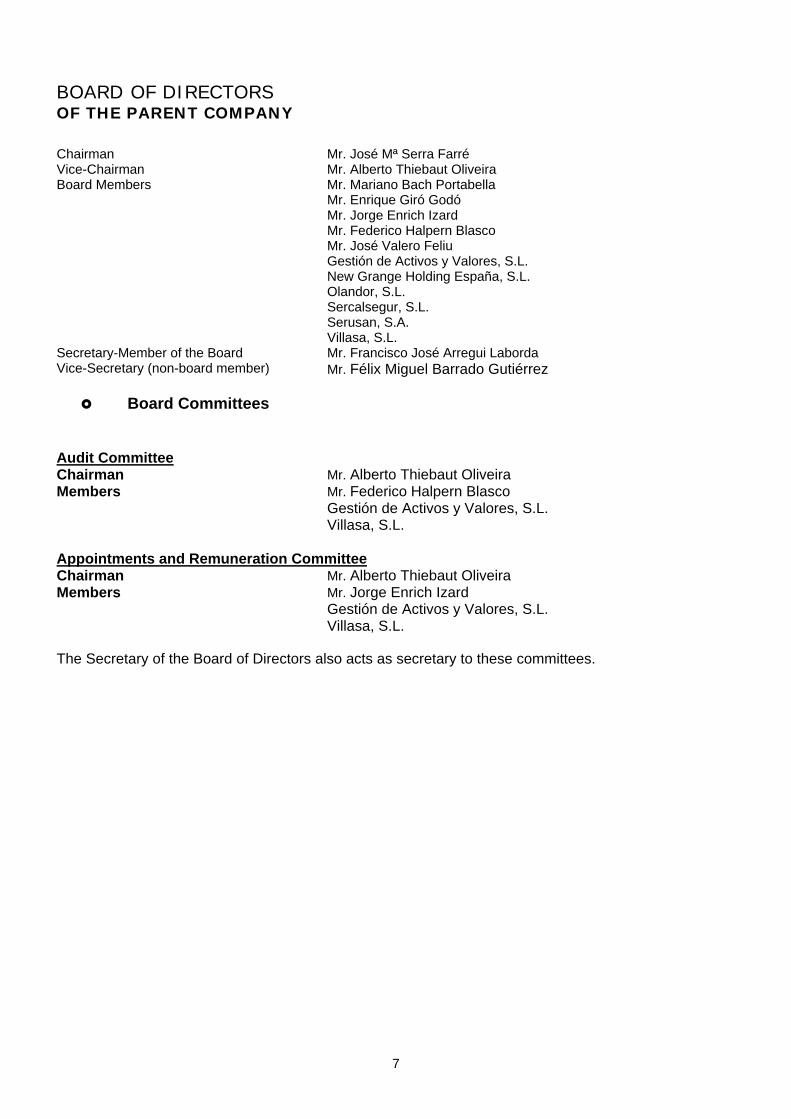
BOARD OF DIRECTORS OF THE PARENT COMPANY
Chairman Mr. José Mª Serra Farré Vice-Chairman Mr. Alberto Thiebaut Oliveira Board Members Mr. Mariano Bach Portabella Mr. Enrique Giró Godó Mr. Jorge Enrich Izard Mr. Federico Halpern Blasco Mr. José Valero Feliu Gestión de Activos y Valores, S.L. New Grange Holding España, S.L. Olandor, S.L. Sercalsegur, S.L. Serusan, S.A. Villasa, S.L. Secretary-Member of the Board Mr. Francisco José Arregui Laborda Vice-Secretary (non-board member) Mr. Félix Miguel Barrado Gutiérrez
Board Committees Audit Committee Chairman Mr. Alberto Thiebaut Oliveira Members Mr. Federico Halpern Blasco Gestión de Activos y Valores, S.L. Villasa, S.L. Appointments and Remuneration Committee Chairman Mr. Alberto Thiebaut Oliveira Members Mr. Jorge Enrich Izard Gestión de Activos y Valores, S.L. Villasa, S.L. The Secretary of the Board of Directors also acts as secretary to these committees.
8
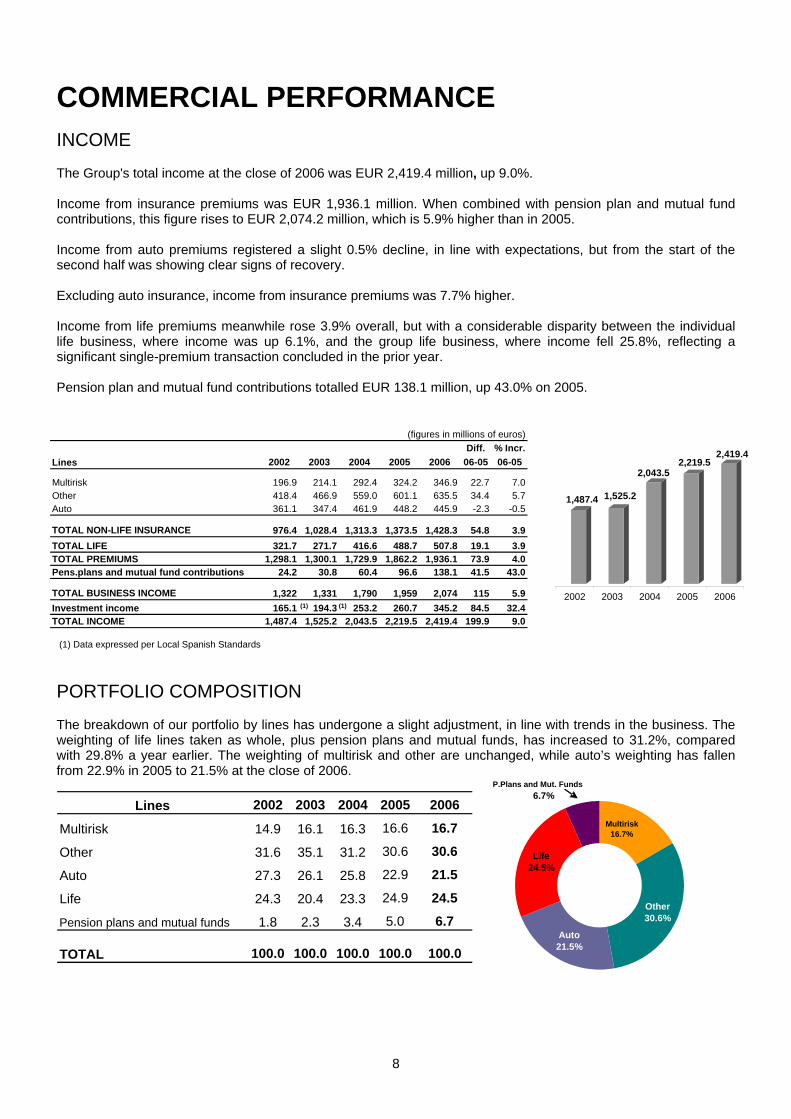
COMMERCIAL PERFORMANCE INCOME The Group's total income at the close of 2006 was EUR 2,419.4 million, up 9.0%. Income from insurance premiums was EUR 1,936.1 million. When combined with pension plan and mutual fund contributions, this figure rises to EUR 2,074.2 million, which is 5.9% higher than in 2005. Income from auto premiums registered a slight 0.5% decline, in line with expectations, but from the start of the second half was showing clear signs of recovery. Excluding auto insurance, income from insurance premiums was 7.7% higher. Income from life premiums meanwhile rose 3.9% overall, but with a considerable disparity between the individual life business, where income was up 6.1%, and the group life business, where income fell 25.8%, reflecting a significant single-premium transaction concluded in the prior year. Pension plan and mutual fund contributions totalled EUR 138.1 million, up 43.0% on 2005.
(1) Data expressed per Local Spanish Standards PORTFOLIO COMPOSITION The breakdown of our portfolio by lines has undergone a slight adjustment, in line with trends in the business. The weighting of life lines taken as whole, plus pension plans and mutual funds, has increased to 31.2%, compared with 29.8% a year earlier. The weighting of multirisk and other are unchanged, while auto’s weighting has fallen from 22.9% in 2005 to 21.5% at the close of 2006.
Lines 2002 2003 2004 2005 2006
Multirisk 14.9 16.1 16.3 16.6 16.7
Other 31.6 35.1 31.2 30.6 30.6
Auto 27.3 26.1 25.8 22.9 21.5
Life 24.3 20.4 23.3 24.9 24.5
Pension plans and mutual funds 1.8 2.3 3.4 5.0 6.7
TOTAL 100.0 100.0 100.0 100.0 100.0
Life24.5%
Multirisk16.7%
Other30.6%
Auto21.5%
P.Plans and Mut. Funds6.7%
Diff. % Incr.Lines 2002 2003 2004 2005 2006 06-05 06-05
Multirisk 196.9 214.1 292.4 324.2 346.9 22.7 7.0Other 418.4 466.9 559.0 601.1 635.5 34.4 5.7Auto 361.1 347.4 461.9 448.2 445.9 -2.3 -0.5
TOTAL NON-LIFE INSURANCE 976.4 1,028.4 1,313.3 1,373.5 1,428.3 54.8 3.9TOTAL LIFE 321.7 271.7 416.6 488.7 507.8 19.1 3.9TOTAL PREMIUMS 1,298.1 1,300.1 1,729.9 1,862.2 1,936.1 73.9 4.0Pens.plans and mutual fund contributions 24.2 30.8 60.4 96.6 138.1 41.5 43.0
TOTAL BUSINESS INCOME 1,322 1,331 1,790 1,959 2,074 115 5.9Investment income 165.1 194.3 253.2 260.7 345.2 84.5 32.4TOTAL INCOME 1,487.4 1,525.2 2,043.5 2,219.5 2,419.4 199.9 9.0
(figures in millions of euros)
(1) (1)
1,487.4 1,525.2
2,043.52,219.5
2,419.4
2002 2003 2004 2005 2006

9
GEOGRAPHICAL DISTRIBUTION The Catalana Occidente Group has a broad presence throughout Spain, with 1,037 offices at the close of 2006. In the course of 2006, Lepanto’s business was absorbed by Seguros Catalana Occidente. As a result both its agent sales network and the sales staff supervising the network have now been integrated into Seguros Catalana Occidente’s organisational structure. Accordingly, at the close of 2006, 14 former Lepanto offices that, because of their location, where deemed to duplicate those of Seguros Catalana Occidente were closed. The map below shows the distribution of the Group's offices across Spain, along with premiums billed and the percentage of volume business in Spain accounted for by each autonomous community. The Group has a particularly strong presence in the Mediterranean and Cantabrian coastal regions, reflecting, in the first case, the historical focus of the Group’s business development, and in the second, the greater volume of business generated in this region following the incorporation of Grupo de Seguros Bilbao
79 OfficesEUR 108.8 M.
5.2%
31 OfficesEUR 44,5M.
2.1%
15 OfficesEUR 26,6M.
1.3%
107 OfficesEUR 207,4 M.
10%
16 OfficesEUR 19,4 M.
0,9%
16 OfficesEUR 39,6 M.
1.9%
269 OfficesEUR 682,1 M.
32.9%
31 OfficesEUR 37,5M.
1,8%
50 OfficesEUR 47,9 M.
2.3%
59 OfficesEUR 68,4 M.
3.3%
53 OfficesEUR 228,6 M.
11%
12 OfficesEUR 16.8 M.
0,8%
111 OfficesEUR 204,7 M.
9.9%
114 OfficesSEUR 240,1 M.€
11.6%
45 OfficesEUR 68,9 M.€
3.3%
5 OfficesEUR 5 M.
0.1%
20 OfficesEUR 25.1 M.
1.2%
4 OfficesEUR 4.8 M.
0.2% SALES NETWORK – AGENTS The Catalana Occidente Group distributes its products mainly through highly qualified insurance agents who work exclusively with the Group. As in previous years, in 2006 initiatives were concentrated both on increasing the number of agents and improving productivity levels in sales activities. In addition, extensive employee training, the use of best sales practice across our network, product enhancements, competitive price/benefit ratios and systematic application of cutting-edge technologies all help ensure ongoing improvements in the productivity of our agents network every year. The Group also distributes its product and services through other agency or similar sales channels, including traditional agents and brokers. It also has a number of niche sales networks that are tailored to specific products, geographical areas or market segments.
EVOLUCIÓN COMERCIAL
10
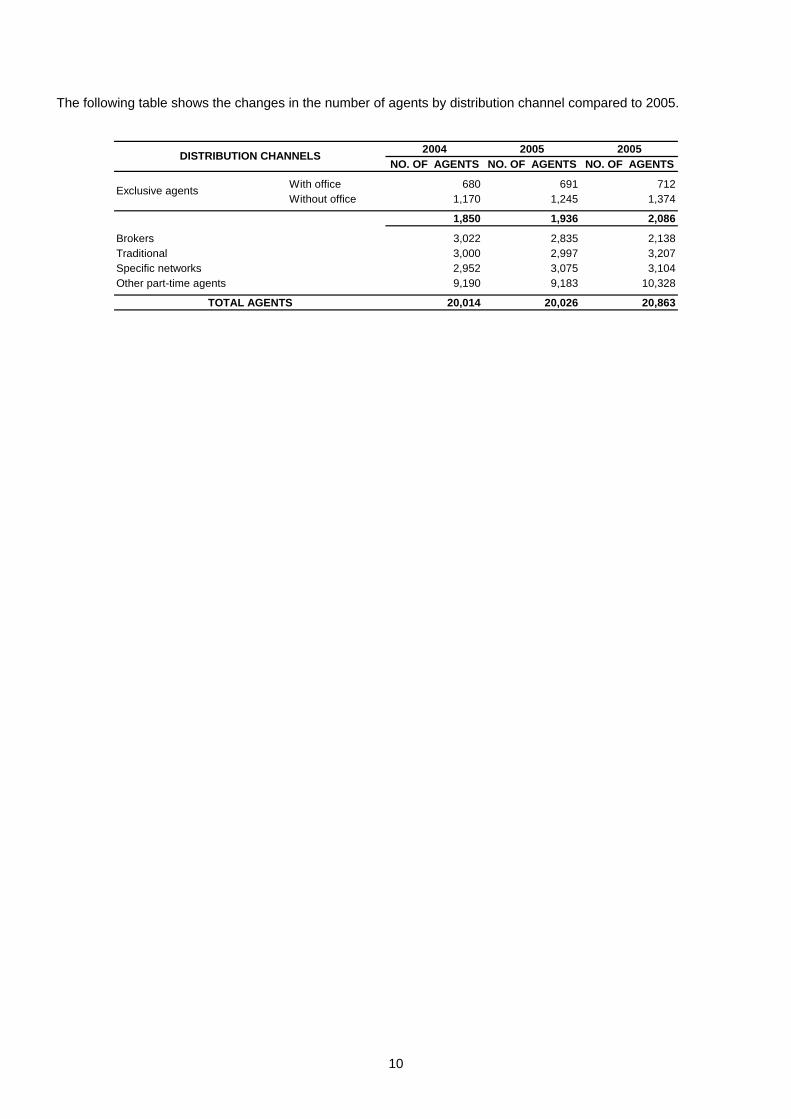
The following table shows the changes in the number of agents by distribution channel compared to 2005.
2004 2005 2005NO. OF AGENTS NO. OF AGENTS NO. OF AGENTS
With office 680 691 712Without office 1,170 1,245 1,374
1,850 1,936 2,086
Brokers 3,022 2,835 2,138Traditional 3,000 2,997 3,207Specific networks 2,952 3,075 3,104Other part-time agents 9,190 9,183 10,328
20,014 20,026 20,863
Exclusive agents
DISTRIBUTION CHANNELS
TOTAL AGENTS

11
INCOME STATEMENT 2004 2005 2006 % Incr.Premiums 1,729.9 1,862.2 1,936.2 4.0 Premiums acquired 1,720.7 1,853.8 1,915.0 3.3 Technical cost 1,394.6 1,427.1 1,482.1 3.9TECHNICAL RESULT 326.1 426.7 432.9 1.5As a % of premiums acquired 19.0% 23.0% 22.6%Expenses 239.9 256.2 264.1 3.1As a % of premiums acquired 13.9% 13.8% 13.8%TECHNICAL RESULT AFTER EXPENSES 86.2 170.5 168.8 -1.0As a % of premiums acquired 5.0% 9.2% 8.8%FINANCIAL RESULT (*) 75.0 62.4 135.5 117.3As a % of premiums acquired 4.2% 4.0% 7.1%PROFIT BEFORE TAXES 161.2 232.9 304.3 30.7As a % of premiums acquired 9.4% 12.6% 15.9%Corporation Tax 33.7 57.4 54.8 -4.4As a % of premiums acquired 2.0% 3.1% 2.9%PROFIT AFTER TAXES 127.5 175.5 249.5 42.2As a % of premiums acquired 7.4% 9.5% 13.0%ATTRIBUTABLE PROFIT 103.6 137.6 191.4 39.1 (*) Includes income and expenses from the non-technical account
(figures in millions of euros)
PROFIT FOR THE YEAR AND PROPOSED DISTRIBUTION PROFIT FOR THE YEAR The Catalana Occidente Consolidated Group recorded net profit of EUR 249.5 million in 2006, an advance of 42.2% on the EUR 175.5 million recognised in 2005. Profit attributable to the Parent amounted to EUR 191.4 million, up 39.1% on the 2005 figure of EUR 137.6 million. The significant earnings advances that the Group has posted for the second year running are underpinned by both good technical results, including excellent combined ratios, and strong financial results, in particular the contribution to earnings of investments in insurance companies incorporated within the scope of consolidation in the past few years. The following table shows the main items in the income statement for 2006, along with comparable data for the two previous years.
CHANGES IN CONSOLIDATED AND ATTRIBUTABLE PROFIT (*)
191.4
249.5
175.5
76.4
127.5
41.0
137.6
103.6
50.130.00
20406080
100120140160180200220240260280
2002 2003 2004 2005 2006
CONSOLIDATED PROFIT
ATTRIBUTED PROFIT
(*) Figures for 2002 and 2003 are calculated under Spanish GAAP. Figures for 2004, 2005 and 2006 are calculated on the basis of IFRSs.

12
PROPOSED DISTRIBUTION OF PROFIT The individual net profit of Grupo Catalana Occidente, S.A. was EUR 64.9 million. The following distribution will be proposed to shareholders at the Annual General Meeting: To dividends 48,000,000 To reserves 16,878,991
Total 64,878,991
SHAREHOLDER REMUNERATION In July and October 2006, and in February 2007, Grupo Catalana Occidente S.A. distributed interim dividends out of 2006 profit of EUR 0.076 per share. The total amount thus distributed was EUR 27,360,000. The Board of Directors has also resolved to distribute a further interim dividend of EUR 0.172 per share in May 2007, which will take the total distribution to EUR 20,640,000. At the Annual General Meeting, the Board of Directors intends to propose the distribution from 2006 earnings of a total dividend of EUR 0.4 per share, which is 37.0% more than the EUR 0.292 per share (*) distributed in the prior year. These dividends will be settled in full following distribution of the fourth interim dividend detailed above in May 2007. (*) Recalculated on the basis of 120 million shares.
% Incr.
July 2006 1st Interim dividend against 2006 profits 0.076 €
October 2006 2nd Interim dividend against 2006 profits 0.076 € 35.7%
February 2007 3rd Interim dividend against 2006 profits 0.076 €
May 2007 4th Interim dividend against 2006 profits 0.172 € 38.7%
TOTAL 0.400 € 37.0%
TOTAL DIVIDEND 48,000,000 €
Dividends Paid
13
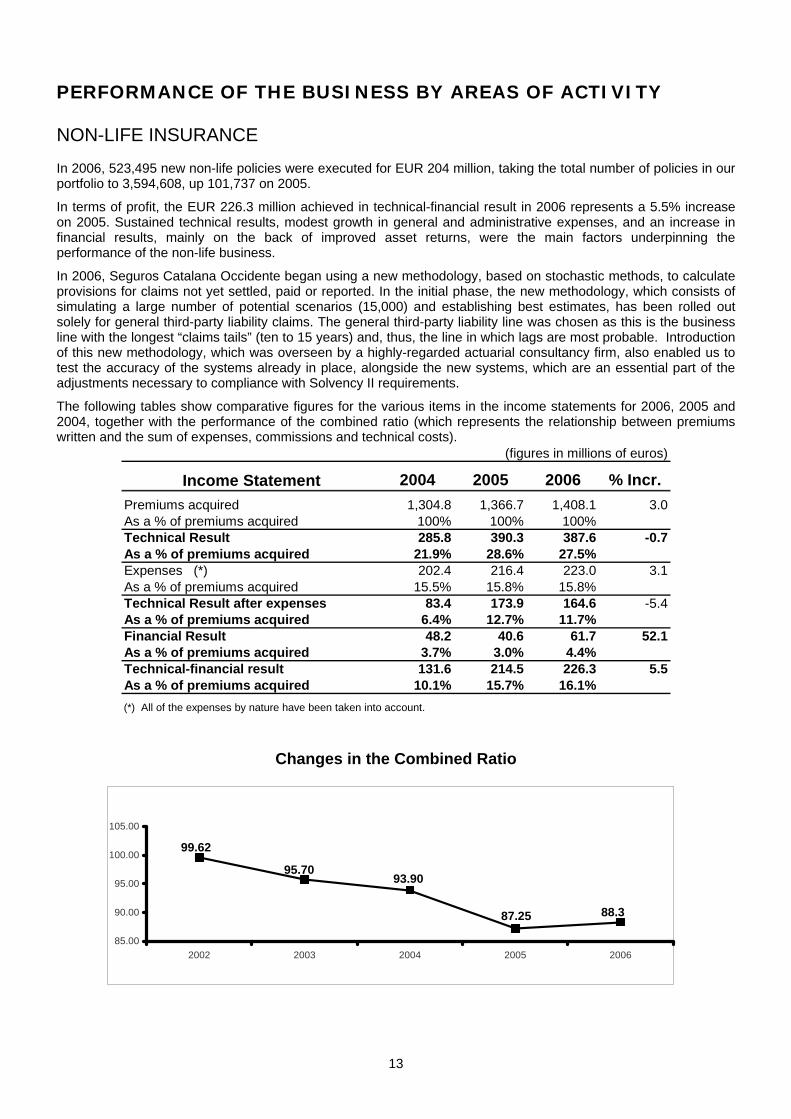
PERFORMANCE OF THE BUSINESS BY AREAS OF ACTIVITY NON-LIFE INSURANCE In 2006, 523,495 new non-life policies were executed for EUR 204 million, taking the total number of policies in our portfolio to 3,594,608, up 101,737 on 2005. In terms of profit, the EUR 226.3 million achieved in technical-financial result in 2006 represents a 5.5% increase on 2005. Sustained technical results, modest growth in general and administrative expenses, and an increase in financial results, mainly on the back of improved asset returns, were the main factors underpinning the performance of the non-life business. In 2006, Seguros Catalana Occidente began using a new methodology, based on stochastic methods, to calculate provisions for claims not yet settled, paid or reported. In the initial phase, the new methodology, which consists of simulating a large number of potential scenarios (15,000) and establishing best estimates, has been rolled out solely for general third-party liability claims. The general third-party liability line was chosen as this is the business line with the longest “claims tails” (ten to 15 years) and, thus, the line in which lags are most probable. Introduction of this new methodology, which was overseen by a highly-regarded actuarial consultancy firm, also enabled us to test the accuracy of the systems already in place, alongside the new systems, which are an essential part of the adjustments necessary to compliance with Solvency II requirements. The following tables show comparative figures for the various items in the income statements for 2006, 2005 and 2004, together with the performance of the combined ratio (which represents the relationship between premiums written and the sum of expenses, commissions and technical costs).
Income Statement 2004 2005 2006 % Incr.Premiums acquired 1,304.8 1,366.7 1,408.1 3.0As a % of premiums acquired 100% 100% 100%Technical Result 285.8 390.3 387.6 -0.7As a % of premiums acquired 21.9% 28.6% 27.5%Expenses (*) 202.4 216.4 223.0 3.1As a % of premiums acquired 15.5% 15.8% 15.8%Technical Result after expenses 83.4 173.9 164.6 -5.4As a % of premiums acquired 6.4% 12.7% 11.7%Financial Result 48.2 40.6 61.7 52.1As a % of premiums acquired 3.7% 3.0% 4.4%Technical-financial result 131.6 214.5 226.3 5.5As a % of premiums acquired 10.1% 15.7% 16.1%(*) All of the expenses by nature have been taken into account.
(figures in millions of euros)
Changes in the Combined Ratio
99.62
95.7093.90
87.25 88.3
85.00
90.00
95.00
100.00
105.00
2002 2003 2004 2005 2006

14
MULTIRISK INSURANCE The products includes in this business line are home/family, retail, shared buildings (communities), offices and SMEs Overall trends in these lines were very positive, reducing the combined ratio to 90.2% of premiums written, from 92.5% in 2005, which is a reduction of 2.3 percentage points. This movement in the combined ratio attests to solid and stable trends in the claims rate and in the costs associated with these products as a whole. The current level of our ratio (around 90%) puts us in the best possible position for growth in all these lines. Technical-financial result was EUR 44.5 million, up 46.9% on the 2005 figure of EUR 30.3 million. The following tables show the changes in the main figures for this group of lines.
2004 2005 2006 % Incr.
Policies sold 173,252 175,520 179,706 2.4Policies in the portfolio 1,298,319 1,329,562 1,359,586 2.3
Premiums sold € M. 44 47 52 9.9Premiums billed € M. 292 324 347 7.0
Claim counts 309,166 317,183 329,960 4.0Claim frequency (no.of claims per 100 policies) 24.1 24.1 24.5 1.7Average cost of claims Euros 468.2 528.8 516.5 -2.3
Total technical provisons € M. 251 276 292 5.8
% technical costs % 55.3 56.9 54.1 -4.8% commissions % 20.2 19.8 20.6 3.8% general expenses % 16.9 15.8 15.5 -2.0% Total = Combined ratio % 92.4 92.5 90.2 -2.5
Income Statement 2004 2005 2006 % Incr.Premiums acquired 284.4 313.4 336.3 7.3As a % of premiums acquired 100% 100% 100%Technical result 69.0 73.2 85.2 16.4As a % of premiums acquired 24.2% 23.4% 25.3%Expenses 47.3 49.6 52.1 5.0As a % of premiums acquired 16.6% 15.8% 15.5%Technical result after expenses 21.7 23.6 33.1 40.6As a % of premiums acquired 7.6% 7.5% 9.8%Financial result 7.6 6.7 11.4 69.2As a % of premiums acquired 2.7% 2.1% 3.4%Technical income - financial result 29.3 30.3 44.5 46.9As a % of premiums acquired 10.3% 9.6% 13.2%
(figures in millions of euros)

15
90.292.4392.66
99.199.3
75.00
80.00
85.00
90.00
95.00
100.00
105.00
2002 2003 2004 2005 2006
Changes in the Combined Ratio
AUTO INSURANCE The auto business' performance in the year was uneven, as mentioned earlier in this report. At the close of 2006, at EUR 446 million, sales in this line were a slight 0.5% down on the 2005 level. Despite this decline, sales trends were very positive, as the table below shows, with net increases in the number of premiums from March onwards. Albeit with a certain time lag, premiums billed also showed monthly advances from the second half, although in the full-year figures these advances are offset by the declines recorded in the first six months. The combined ratio rose to 94.5% — a 4.9 point uptick attributable to, firstly, the fact that overall premiums billed were practically the same as in the previous year, and, secondly, the fact that costs (claims and expenses) increased modestly, reflecting both inflation and an increased number of claims due to the increased number of vehicles insured. Technical-financial result was EUR 47 million, compared with EUR 64.9 million in 2005. The following tables show the changes in the main figures for this group of lines.
2004 2005 2006 % Incr.
Policies sold 159,453 187,206 212,492 13.5Policies in the portfolio 1,154,138 1,136,173 1,155,295 1.7
Premiums sold € M. 80 82 90 9.8Premiums billed € M. 462 448 446 -0.5
Claim counts 261,320 249,874 244,864 -2.0Claim frequency (no.of claims per 100 policies) 22.2 21.8 22.5 3.2Average cost of claims Euros 1,218.6 1,077.7 1,054.4 -2.2
Total technical provisons € M. 649 621 605 -2.6
% technical costs % 69.5 59.3 62.2 4.8% commissions % 12.0 12.2 13.2 8.4% general expenses % 17.0 18.1 19.1 5.4% Total = Combined ratio % 98.5 89.6 94.5 5.4
16
Changes in the Combined Ratio
94.589.6
98.5101.2
104.6
75.00
80.00
85.00
90.00
95.00
100.00
105.00
110.00
2002 2003 2004 2005 2006
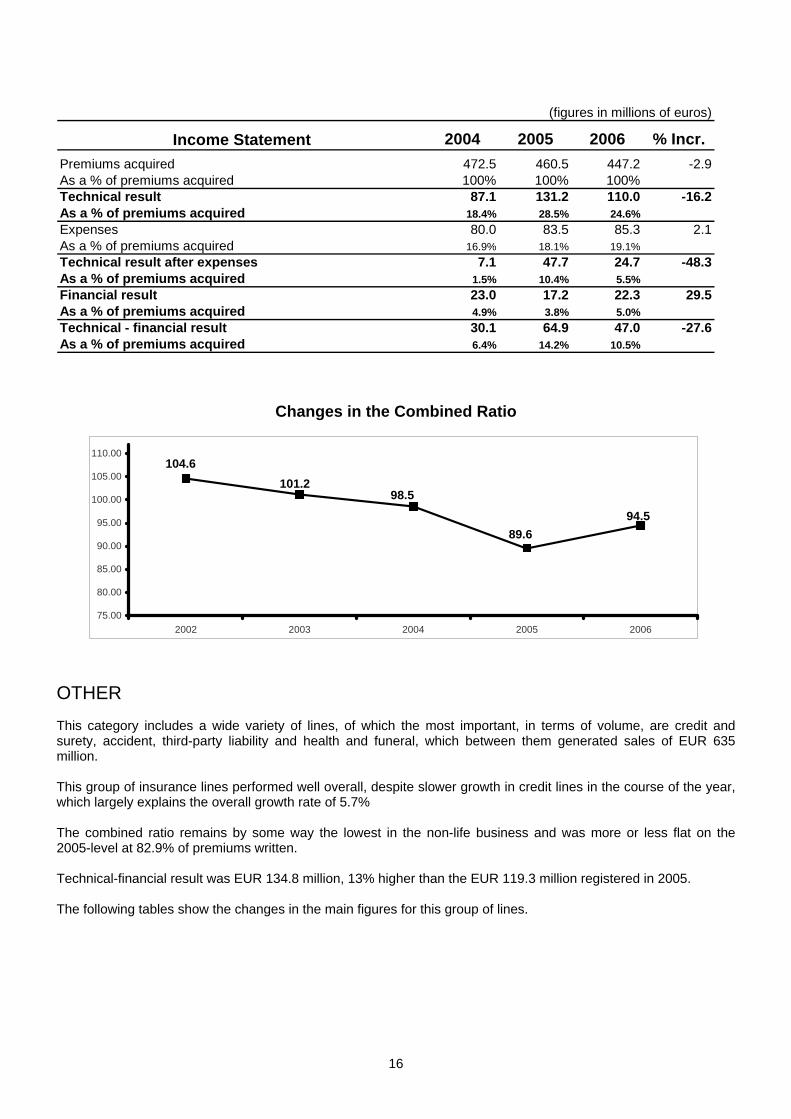
OTHER This category includes a wide variety of lines, of which the most important, in terms of volume, are credit and surety, accident, third-party liability and health and funeral, which between them generated sales of EUR 635 million. This group of insurance lines performed well overall, despite slower growth in credit lines in the course of the year, which largely explains the overall growth rate of 5.7% The combined ratio remains by some way the lowest in the non-life business and was more or less flat on the 2005-level at 82.9% of premiums written. Technical-financial result was EUR 134.8 million, 13% higher than the EUR 119.3 million registered in 2005. The following tables show the changes in the main figures for this group of lines.
Income Statement 2004 2005 2006 % Incr.Premiums acquired 472.5 460.5 447.2 -2.9As a % of premiums acquired 100% 100% 100%Technical result 87.1 131.2 110.0 -16.2As a % of premiums acquired 18.4% 28.5% 24.6%Expenses 80.0 83.5 85.3 2.1As a % of premiums acquired 16.9% 18.1% 19.1%Technical result after expenses 7.1 47.7 24.7 -48.3As a % of premiums acquired 1.5% 10.4% 5.5%Financial result 23.0 17.2 22.3 29.5As a % of premiums acquired 4.9% 3.8% 5.0%Technical - financial result 30.1 64.9 47.0 -27.6As a % of premiums acquired 6.4% 14.2% 10.5%
(figures in millions of euros)

17
2004 2005 2006 % Incr.
Policies sold 110,191 116,149 131,297 13.0Policies in the portfolio 999,007 1,027,136 1,079,727 5.1
Premiums sold € M. 53 58 62 7.0Premiums billed € M. 559 602 635 5.7
Claim counts 127,288 136,344 149,400 9.6Claim frequency (no.of claims per 100 policies) 13.1 13.5 14.2 5.2Average cost of claims Euros 2,161.8 2,235.7 2,172.6 -2.8
Total technical provisons € M. 862 750 820 9.3
% technical costs % 63.9 55.9 56.2 0.6% commissions % 12.4 12.8 13.0 1.7% general expenses % 13.7 14.0 13.7 -2.3% Total = Combined ratio % 90.0 82.7 82.9 0.3
Income Statement 2004 2005 2006 % Incr.Premiums acquired 547.9 593.0 624.6 5.3As a % of premiums acquired 100% 100% 100%Technical result 129.7 185.9 192.4 3.5As a % of premiums acquired 23.7% 31.4% 30.8%Expenses 75.1 83.2 85.6 2.9As a % of premiums acquired 13.7% 14.0% 13.7%Technical result after expenses 54.6 102.7 106.7 4.0As a % of premiums acquired 10.0% 17.3% 17.1%Financial result 17.6 16.6 28.1 69.3As a % of premiums acquired 3.2% 2.8% 4.5%Technical - financial result 72.2 119.3 134.8 13.0As a % of premiums acquired 13.2% 20.1% 21.6%
(figures in millions of euros)
Changes in the Combined Ratio
95.00
89.70 90.00
82.70 82.90
75.00
80.00
85.00
90.00
95.00
100.00
2001 2002 2003 2004 2005

18
REINSURANCE Outward reinsurance premiums totalled EUR 219.3 million, a slight 2.7% fall on 2005. This fall contrasts with a 4% increase in business recorded and is a testament to the policy of increasing business retention we have implemented in the last few years given the quality of our risk portfolio. The Group continues to maintain and, in some cases, to surpass, where possible, the rating of the reinsurance companies in the various reinsurers panels. In particular, Münchener, General Re and Swiss Re, which are the main lead insurers in our reinsurers panels, have A+, AAA and AA ratings, respectively. The other companies’ ratings are between AAA and A-. The following table shows the main figures relating to outward reinsurance.
Income 2004 2005 2006 % Incr.
Outward premiums € M. 226.1 225.4 219.3 -2.7
Increase in provision for unearned premiums € M. -6.2 -0.1 -4.2
Commissions € M. 69.2 67.4 70.4 4.5
Cost of outward reinsurance € M. 163.1 158.1 153.1 -3.2
Loss ratio % 121.0 121.1 128.9 6.4
Total cost of reinsurance € M. 42.1 37.0 24.2 -34.6

19
LIFE, PENSION PLANS AND MUTUAL FUNDS Turnover and Results All life products, irrespective of whether the financial risk is borne by the Group or by the policyholder, are included in this line. Because of their similar features to life products, pension plans and mutual funds are also included in this line.
Sales of this group of products were 10.2% higher overall, at EUR 646 million. Of this total, EUR 508 million was generated by premiums while EUR 1378 million came from contributions to pension plans and mutual funds. Technical-financial result was EUR 20.5 million, up 21.6% on 2005. The following table shows the main figures for the line.
2004 2005 2006 % Incr.
Policies sold, pension plans and mutual funds 95,391 103,142 109,919 6.6Policies in the portfolio 435,985 437,562 457,700 4.6
Premiums sold, pension plan and mutual fund contributions € M. 246 317 386 21.8Premiums billed € M. 417 488 508 4.1
Claim count 53,332 63,145 65,591 3.9
Volume of managed funds in:
Mathematical provisions and unpaid claims € M. 2,542.4 2,667.0 2,775.0 4.0 Pension plans and mutual funds € M. 285.8 361.0 474.0 31.3
Income Statement 2004 2005 2006 % Incr.Premiums acquired 415.9 486.9 506.9 4.1As a % of premiums acquired 100.0% 100.0% 100.0%Technical result 40.3 36.3 45.3 24.6As a % of premiums acquired 9.7% 7.5% 8.9%Expenses 37.4 39.7 41.0 3.2As a % of premiums acquired 9.0% 8.2% 8.1%Technical result after expenses 2.9 -3.4 4.3 -As a % of premiums acquired 0.7 -0.7 0.8Financial result 21.5 20.3 16.2 -20.0As a % of premiums acquired 5.2% 4.2% 3.2%Technical-financial result 24.4 16.9 20.5 21.6As a % of premiums acquired 5.9% 3.5% 4.0%
(figures in millions of euros)
20
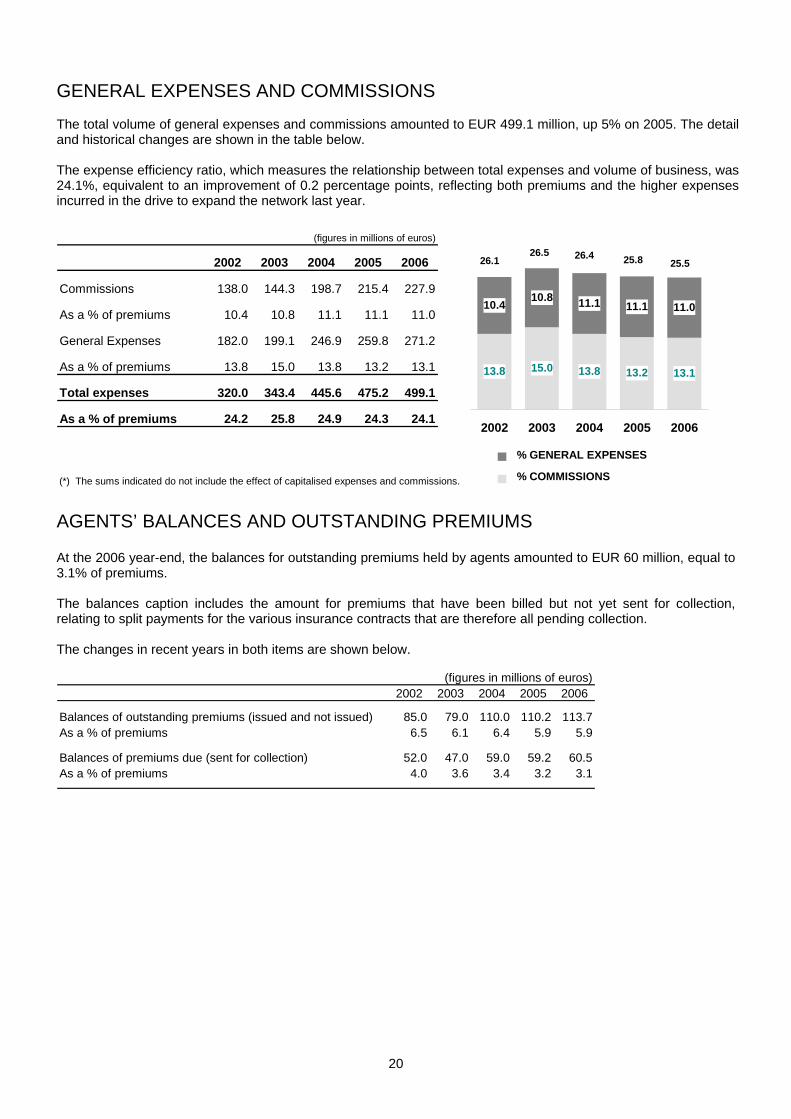
GENERAL EXPENSES AND COMMISSIONS The total volume of general expenses and commissions amounted to EUR 499.1 million, up 5% on 2005. The detail and historical changes are shown in the table below. The expense efficiency ratio, which measures the relationship between total expenses and volume of business, was 24.1%, equivalent to an improvement of 0.2 percentage points, reflecting both premiums and the higher expenses incurred in the drive to expand the network last year.
2002 2003 2004 2005 2006
Commissions 138.0 144.3 198.7 215.4 227.9
As a % of premiums 10.4 10.8 11.1 11.1 11.0
General Expenses 182.0 199.1 246.9 259.8 271.2
As a % of premiums 13.8 15.0 13.8 13.2 13.1
Total expenses 320.0 343.4 445.6 475.2 499.1
As a % of premiums 24.2 25.8 24.9 24.3 24.1
(*) The sums indicated do not include the effect of capitalised expenses and commissions.
(figures in millions of euros)
13.8 15.0 13.8 13.2
10.410.8 11.1 11.1 11.0
13.1
2002 2003 2004 2005 2006
26.126.5 26.4 25.8 25.5
% COMMISSIONS
% GENERAL EXPENSES
AGENTS’ BALANCES AND OUTSTANDING PREMIUMS At the 2006 year-end, the balances for outstanding premiums held by agents amounted to EUR 60 million, equal to 3.1% of premiums. The balances caption includes the amount for premiums that have been billed but not yet sent for collection, relating to split payments for the various insurance contracts that are therefore all pending collection. The changes in recent years in both items are shown below.
2002 2003 2004 2005 2006
Balances of outstanding premiums (issued and not issued) 85.0 79.0 110.0 110.2 113.7As a % of premiums 6.5 6.1 6.4 5.9 5.9
Balances of premiums due (sent for collection) 52.0 47.0 59.0 59.2 60.5As a % of premiums 4.0 3.6 3.4 3.2 3.1
(figures in millions of euros)
21
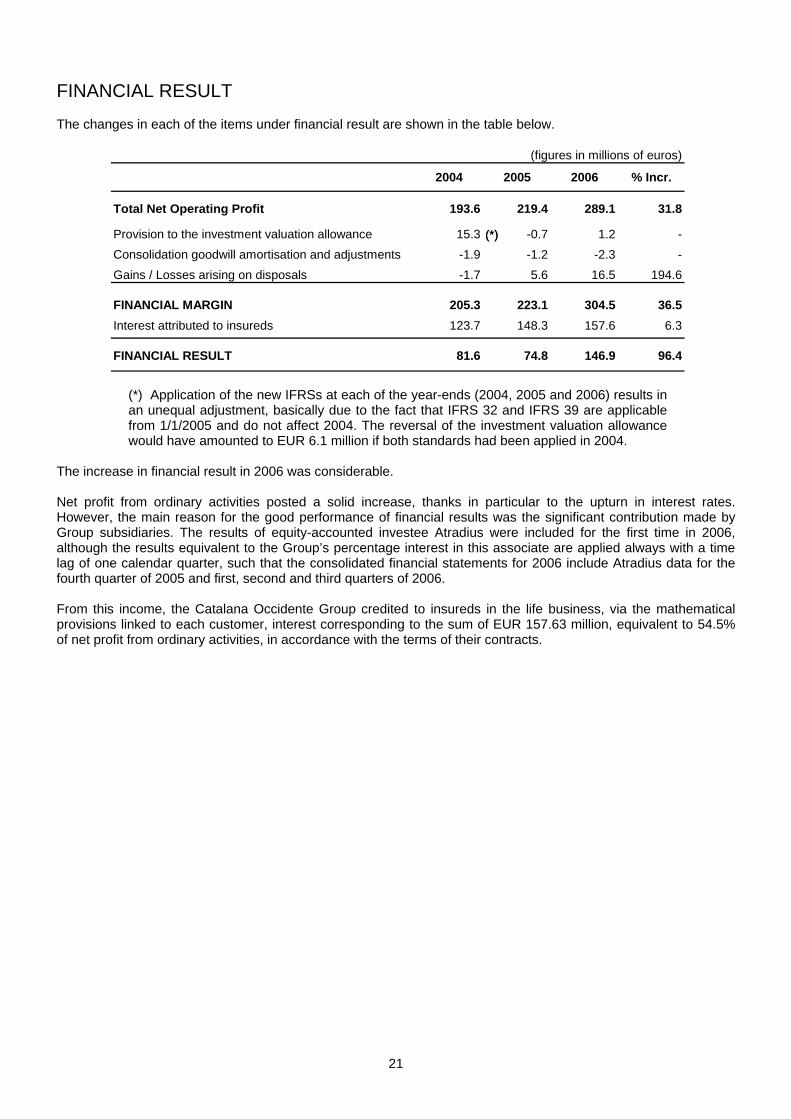
FINANCIAL RESULT The changes in each of the items under financial result are shown in the table below.
2004 2005 2006 % Incr.
Total Net Operating Profit 193.6 219.4 289.1 31.8
Provision to the investment valuation allowance 15.3 -0.7 1.2 -Consolidation goodwill amortisation and adjustments -1.9 -1.2 -2.3 -Gains / Losses arising on disposals -1.7 5.6 16.5 194.6
FINANCIAL MARGIN 205.3 223.1 304.5 36.5Interest attributed to insureds 123.7 148.3 157.6 6.3
FINANCIAL RESULT 81.6 74.8 146.9 96.4
(figures in millions of euros)
(*)(*)
(*) Application of the new IFRSs at each of the year-ends (2004, 2005 and 2006) results in an unequal adjustment, basically due to the fact that IFRS 32 and IFRS 39 are applicable from 1/1/2005 and do not affect 2004. The reversal of the investment valuation allowance would have amounted to EUR 6.1 million if both standards had been applied in 2004.
The increase in financial result in 2006 was considerable. Net profit from ordinary activities posted a solid increase, thanks in particular to the upturn in interest rates. However, the main reason for the good performance of financial results was the significant contribution made by Group subsidiaries. The results of equity-accounted investee Atradius were included for the first time in 2006, although the results equivalent to the Group’s percentage interest in this associate are applied always with a time lag of one calendar quarter, such that the consolidated financial statements for 2006 include Atradius data for the fourth quarter of 2005 and first, second and third quarters of 2006. From this income, the Catalana Occidente Group credited to insureds in the life business, via the mathematical provisions linked to each customer, interest corresponding to the sum of EUR 157.63 million, equivalent to 54.5% of net profit from ordinary activities, in accordance with the terms of their contracts.

22
BALANCE SHEET PERFORMANCE BALANCE SHEET Movement in the balance sheet and the main component asset and liability headings are summarised in the table below. To interpret this data correctly, it must be remembered that, in its application of IFRSs, the Catalana Occidente Consolidated Group has elected to continue recognising all property investments at amortised cost rather than at market value, and that this situation is reflected in the balance sheet below.
2004 2005 2006
Intangible Assets and Property, Plant and Equipment 371.6 376.4 393.1Investments 4,190.7 5,088.8 5,673.9Reinsurance Share of Technical Provisions 302.4 292.8 296.6Deferred Tax Assets 24.3 24.3 14.1Receivables 252.5 258.7 297.6Prepayments and Accrued Income and Other 118.4 115.5 106.6
T O T A L A S S E T S 5,259.9 6,156.5 6,781.9
Equity 521.2 985.6 1,343.2Technical Provisions 4,398.7 4,613.1 4,863.8Other Provisions 63.1 70.8 78.4Deposits received for outward reinsurance 57.7 56.1 52.3Deferred Tax Liabilities 2.6 188.1 194.0Payables 203.4 229.6 236.9Accrued Expenses and Deferred Income and Other 13.2 13.2 13.3T O T A L E Q U I T Y A N D L I A B I L I T I E S 5,259.9 6,156.5 6,781.9
(figures in millions of euros)
A S S E T S
E Q U I T Y A N D L I A B I L I T I E S
Balance Sheet

23
CHANGE IN EQUITY At the close of 2006, the Catalana Occidente Consolidated Group had equity of EUR 1,344.1 million, which was EUR 358.5 million more than at the close of 2005.
EQUITY at 31/12/2005 985.6
(+) Consolidated results for 2006 249.5
(+) Dividends paid -39.8
(+) Movement treasury shares +/- results -4.2
(+) Change in Valuation Adjustments (capital gains) 47.6
(+) Change in pension funds -4.2
(+) Changes valuation of holdings in subsidiaries 108.7
TOTAL movements for the year 357.6
TOTAL EQUITY at 31/12/2006 1,343.2
(figures in millions of euros)
TREASURY SHARES In 2006, the subsidiary Salerno 94 S.A. acquired 289,765 shares and sold 103,170 shares in Grupo Catalana Occidente, thereby increasing the volume of its investment by EUR 5,145,457 and consequently recording an addition to the restricted reserve under Article 79 of Consolidated Spanish Corporations Law for the same amount. At year-end the Group owned 1.60% of its own shares. In accordance with the new IFRSs, gains or losses on the disposal of treasury shares must be adjusted and may not be accounted for as an increase in profit or loss for the year, as appropriate, but must be recognised directly as an increase or decrease in Equity. TECHNICAL PROVISIONS AND COVERAGE International Financial Reporting Standards establish no specific criteria relating to technical provisions and their coverage. To ensure continuity with information published prior to application of IFRSs, the Catalana Occidente Consolidated Group has prepared the following information on technical provisions and coverage using methodologies established under Spanish GAAP but amounts drawn from the consolidated figures prepared under IFRSs. On this basis, the Group has assumed commitments with third parties, which are recognised under technical provisions and corrected for other receivables and payables, in the amount of EUR 4,634.3 million. Eligible asset totalled EUR 6,222.0 at the close of 2006. This amount represents the market value of the assets as determined in accordance with established measurement criteria. It may be deduced from the above that the Group’s assets exceed its liabilities by EUR 1,587.7 million, with the coverage surplus having thus increased by EUR 232.5 million relative to the prior-year level.

24
The status of coverage by technical provisions at the close of 2006 and the changes over the past few years are shown in the following table.
2004 2005 2006
Technical provisions to be materialised 4,161.0 4,377.2 4,635.0
Eligible assets 4,990.0 5,731.7 6,222.0
Coverage surplus 829.0 1,354.5 1,587.0
(figures in millions of euros)
SOLVENCY MARGIN As in the case of technical provisions detailed above, IFRSs also establish no specific criteria for calculating the minimum capital requirement necessary to the activities performed on the basis of risks assumed. Until the new Solvency II requirements are formalised and a new methodology for their calculation is available, the Group has applied the methodology established in the current private insurance regulations, using data prepared in accordance with IFRSs. The following table shows movement in the consolidated solvency margin over the past three years.
2004 2005 2006
Disposable equity 979.4 1,245.8 1,666.7
Minimum solvency margin 327.5 321.5 337.5
Surplus solvency margin 651.9 924.3 1,329.2
Disposable equity as a % of minimum requirement 299.1 387.5 493.8
(figures in millions of euros)
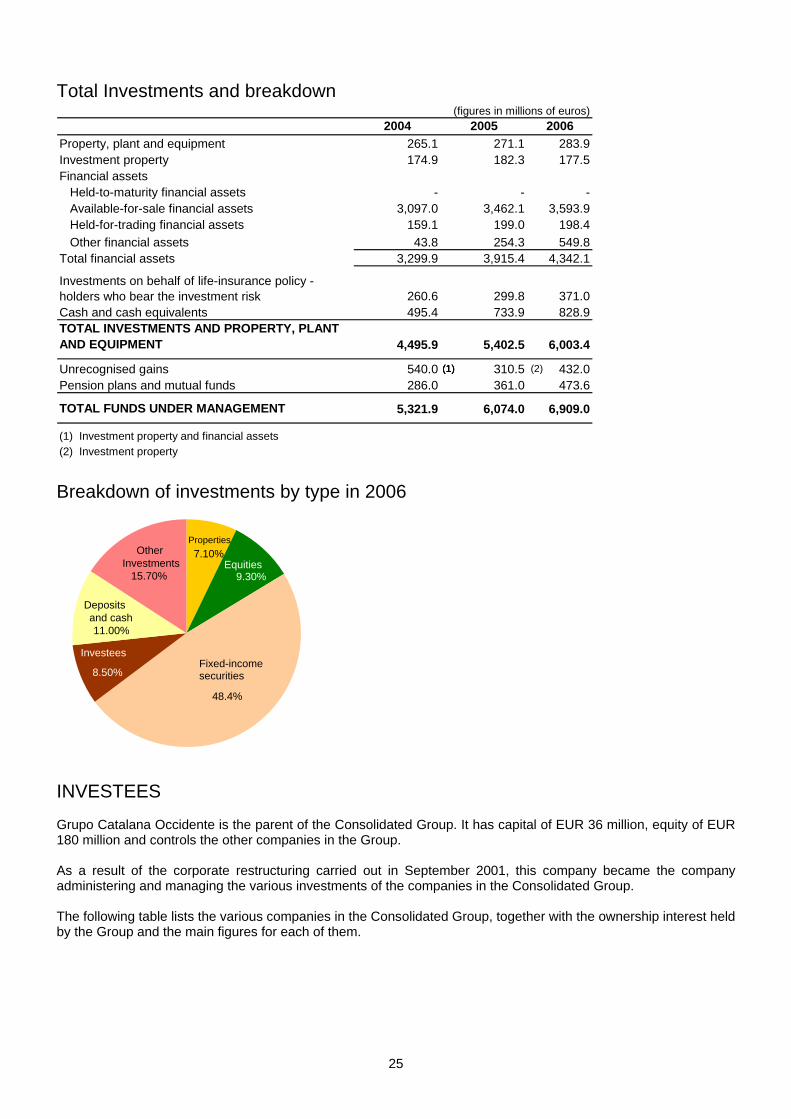
INVESTMENTS AND FUNDS UNDER MANAGEMENT Total investments made by the Group amounted to EUR 6.004 million, up 11.1% on 2005. Including investments corresponding to pension plans and mutual funds, and unrecognised capital gains on property, total funds under management come to EUR 6,910 million, up 13.8%. It should be taken into account that IFRS 32 and 29 on the measurement of assets were not applied in 2004. It must also be taken into account that the application of IAS 16 and IAS 40 on the measurement of investment property, also allows various options, from measuring properties at amortised cost, as under Spanish legislation, to measuring some or all of them at market value. In this first stage of application of IFRSs, the Group has chosen to measure properties at amortised cost as this is the most prudent option and because, under the above-mentioned IFRS, properties can always be restated to market value, but may not be accounted for at amortised cost once the values have been restated. At the 2004, 2005 and 2006 year-ends, unrecognised gains on properties amounted to EUR 258 million, EUR 310 million and EUR 432 million respectively.
25
Fixed-income securities
48.4%
Equities9.30%
Properties7.10% Other
Investments15.70%
Deposits and cash11.00%
Investees
8.50%
Total Investments and breakdown
2004 2005 2006Property, plant and equipment 265.1 271.1 283.9Investment property 174.9 182.3 177.5Financial assets Held-to-maturity financial assets - - - Available-for-sale financial assets 3,097.0 3,462.1 3,593.9 Held-for-trading financial assets 159.1 199.0 198.4 Other financial assets 43.8 254.3 549.8Total financial assets 3,299.9 3,915.4 4,342.1
Investments on behalf of life-insurance policy -holders who bear the investment risk 260.6 299.8 371.0Cash and cash equivalents 495.4 733.9 828.9TOTAL INVESTMENTS AND PROPERTY, PLANT AND EQUIPMENT 4,495.9 5,402.5 6,003.4
Unrecognised gains 540.0 310.5 432.0Pension plans and mutual funds 286.0 361.0 473.6
TOTAL FUNDS UNDER MANAGEMENT 5,321.9 6,074.0 6,909.0
(1) Investment property and financial assets(2) Investment property
(figures in millions of euros)
(1) (2)(1)(1)
Breakdown of investments by type in 2006
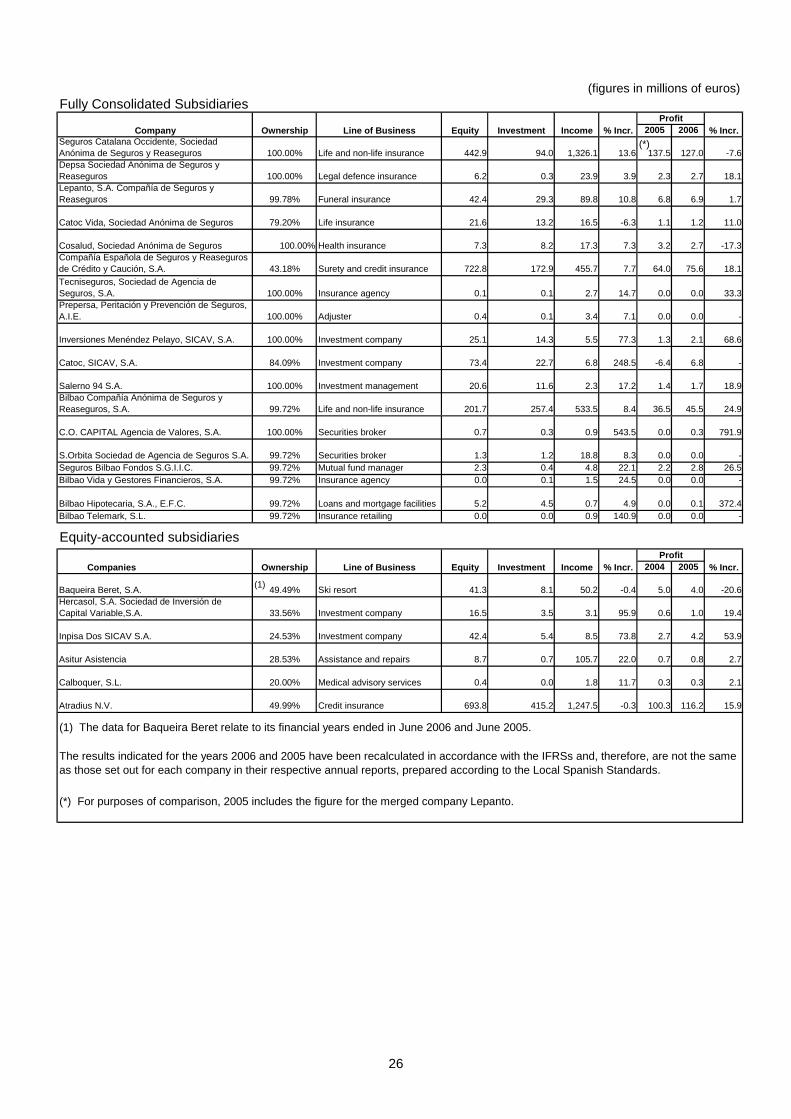
INVESTEES Grupo Catalana Occidente is the parent of the Consolidated Group. It has capital of EUR 36 million, equity of EUR 180 million and controls the other companies in the Group. As a result of the corporate restructuring carried out in September 2001, this company became the company administering and managing the various investments of the companies in the Consolidated Group. The following table lists the various companies in the Consolidated Group, together with the ownership interest held by the Group and the main figures for each of them.
26
2005 2006Seguros Catalana Occidente, Sociedad Anónima de Seguros y Reaseguros 100.00% Life and non-life insurance 442.9 94.0 1,326.1 13.6 137.5 127.0 -7.6Depsa Sociedad Anónima de Seguros y Reaseguros 100.00% Legal defence insurance 6.2 0.3 23.9 3.9 2.3 2.7 18.1Lepanto, S.A. Compañía de Seguros y Reaseguros 99.78% Funeral insurance 42.4 29.3 89.8 10.8 6.8 6.9 1.7
Catoc Vida, Sociedad Anónima de Seguros 79.20% Life insurance 21.6 13.2 16.5 -6.3 1.1 1.2 11.0
Cosalud, Sociedad Anónima de Seguros 100.00% Health insurance 7.3 8.2 17.3 7.3 3.2 2.7 -17.3Compañía Española de Seguros y Reaseguros de Crédito y Caución, S.A. 43.18% Surety and credit insurance 722.8 172.9 455.7 7.7 64.0 75.6 18.1Tecniseguros, Sociedad de Agencia de Seguros, S.A. 100.00% Insurance agency 0.1 0.1 2.7 14.7 0.0 0.0 33.3Prepersa, Peritación y Prevención de Seguros, A.I.E. 100.00% Adjuster 0.4 0.1 3.4 7.1 0.0 0.0 -
Inversiones Menéndez Pelayo, SICAV, S.A. 100.00% Investment company 25.1 14.3 5.5 77.3 1.3 2.1 68.6
Catoc, SICAV, S.A. 84.09% Investment company 73.4 22.7 6.8 248.5 -6.4 6.8 -
Salerno 94 S.A. 100.00% Investment management 20.6 11.6 2.3 17.2 1.4 1.7 18.9Bilbao Compañía Anónima de Seguros y Reaseguros, S.A. 99.72% Life and non-life insurance 201.7 257.4 533.5 8.4 36.5 45.5 24.9
C.O. CAPITAL Agencia de Valores, S.A. 100.00% Securities broker 0.7 0.3 0.9 543.5 0.0 0.3 791.9
S.Orbita Sociedad de Agencia de Seguros S.A. 99.72% Securities broker 1.3 1.2 18.8 8.3 0.0 0.0 -Seguros Bilbao Fondos S.G.I.I.C. 99.72% Mutual fund manager 2.3 0.4 4.8 22.1 2.2 2.8 26.5Bilbao Vida y Gestores Financieros, S.A. 99.72% Insurance agency 0.0 0.1 1.5 24.5 0.0 0.0 -
Bilbao Hipotecaria, S.A., E.F.C. 99.72% Loans and mortgage facilities 5.2 4.5 0.7 4.9 0.0 0.1 372.4Bilbao Telemark, S.L. 99.72% Insurance retailing 0.0 0.0 0.9 140.9 0.0 0.0 -
2004 2005
Baqueira Beret, S.A. 49.49% Ski resort 41.3 8.1 50.2 -0.4 5.0 4.0 -20.6Hercasol, S.A. Sociedad de Inversión de Capital Variable,S.A. 33.56% Investment company 16.5 3.5 3.1 95.9 0.6 1.0 19.4
Inpisa Dos SICAV S.A. 24.53% Investment company 42.4 5.4 8.5 73.8 2.7 4.2 53.9
Asitur Asistencia 28.53% Assistance and repairs 8.7 0.7 105.7 22.0 0.7 0.8 2.7
Calboquer, S.L. 20.00% Medical advisory services 0.4 0.0 1.8 11.7 0.3 0.3 2.1
Atradius N.V. 49.99% Credit insurance 693.8 415.2 1,247.5 -0.3 100.3 116.2 15.9
(figures in millions of euros)
The results indicated for the years 2006 and 2005 have been recalculated in accordance with the IFRSs and, therefore, are not the same as those set out for each company in their respective annual reports, prepared according to the Local Spanish Standards.
(*) For purposes of comparison, 2005 includes the figure for the merged company Lepanto.
Fully Consolidated SubsidiariesProfit
Equity Investment Income % Incr. % Incr.Line of Business Company
Equity-accounted subsidiaries
Ownership
Ownership Equity
(1) The data for Baqueira Beret relate to its financial years ended in June 2006 and June 2005.
% Incr.Investment Income % Incr.Profit
Companies Line of Business
(1)
(*)
27
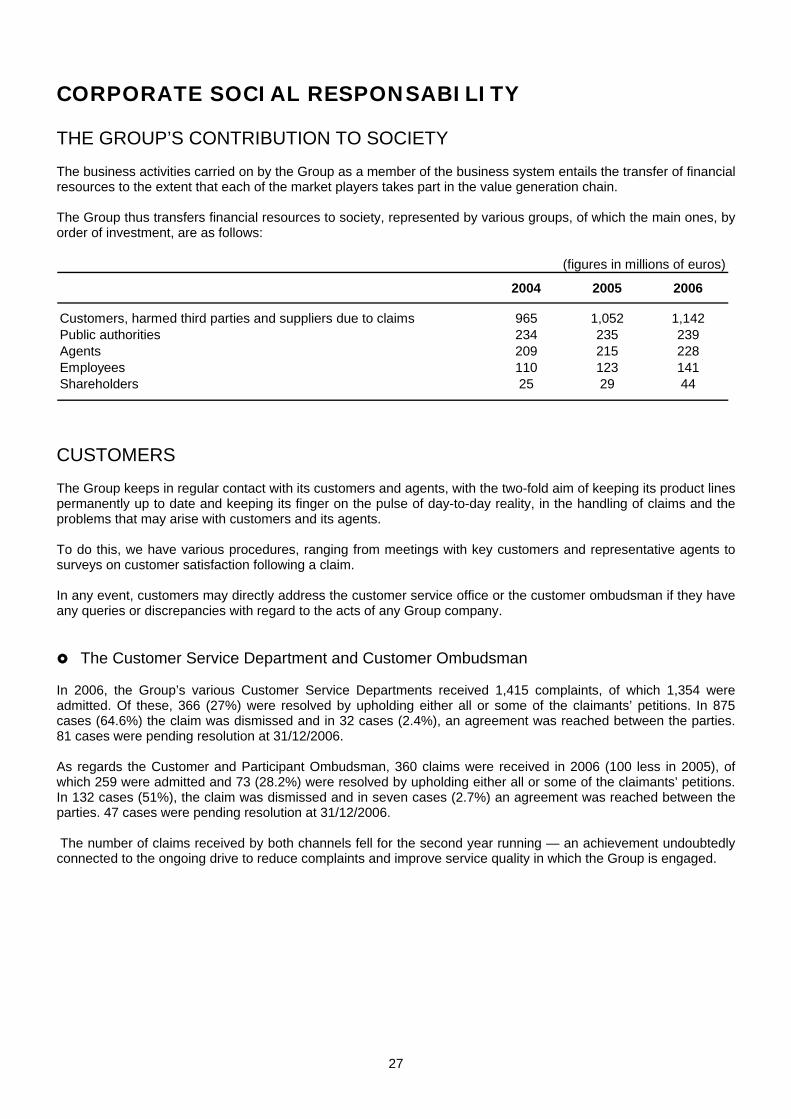
CORPORATE SOCIAL RESPONSABILITY THE GROUP’S CONTRIBUTION TO SOCIETY The business activities carried on by the Group as a member of the business system entails the transfer of financial resources to the extent that each of the market players takes part in the value generation chain. The Group thus transfers financial resources to society, represented by various groups, of which the main ones, by order of investment, are as follows:
2004 2005 2006
Customers, harmed third parties and suppliers due to claims 965 1,052 1,142Public authorities 234 235 239Agents 209 215 228Employees 110 123 141Shareholders 25 29 44
(figures in millions of euros)
CUSTOMERS The Group keeps in regular contact with its customers and agents, with the two-fold aim of keeping its product lines permanently up to date and keeping its finger on the pulse of day-to-day reality, in the handling of claims and the problems that may arise with customers and its agents. To do this, we have various procedures, ranging from meetings with key customers and representative agents to surveys on customer satisfaction following a claim. In any event, customers may directly address the customer service office or the customer ombudsman if they have any queries or discrepancies with regard to the acts of any Group company. The Customer Service Department and Customer Ombudsman
In 2006, the Group’s various Customer Service Departments received 1,415 complaints, of which 1,354 were admitted. Of these, 366 (27%) were resolved by upholding either all or some of the claimants’ petitions. In 875 cases (64.6%) the claim was dismissed and in 32 cases (2.4%), an agreement was reached between the parties. 81 cases were pending resolution at 31/12/2006. As regards the Customer and Participant Ombudsman, 360 claims were received in 2006 (100 less in 2005), of which 259 were admitted and 73 (28.2%) were resolved by upholding either all or some of the claimants’ petitions. In 132 cases (51%), the claim was dismissed and in seven cases (2.7%) an agreement was reached between the parties. 47 cases were pending resolution at 31/12/2006. The number of claims received by both channels fell for the second year running — an achievement undoubtedly connected to the ongoing drive to reduce complaints and improve service quality in which the Group is engaged.
28
GROUP EMPLOYEES Employees
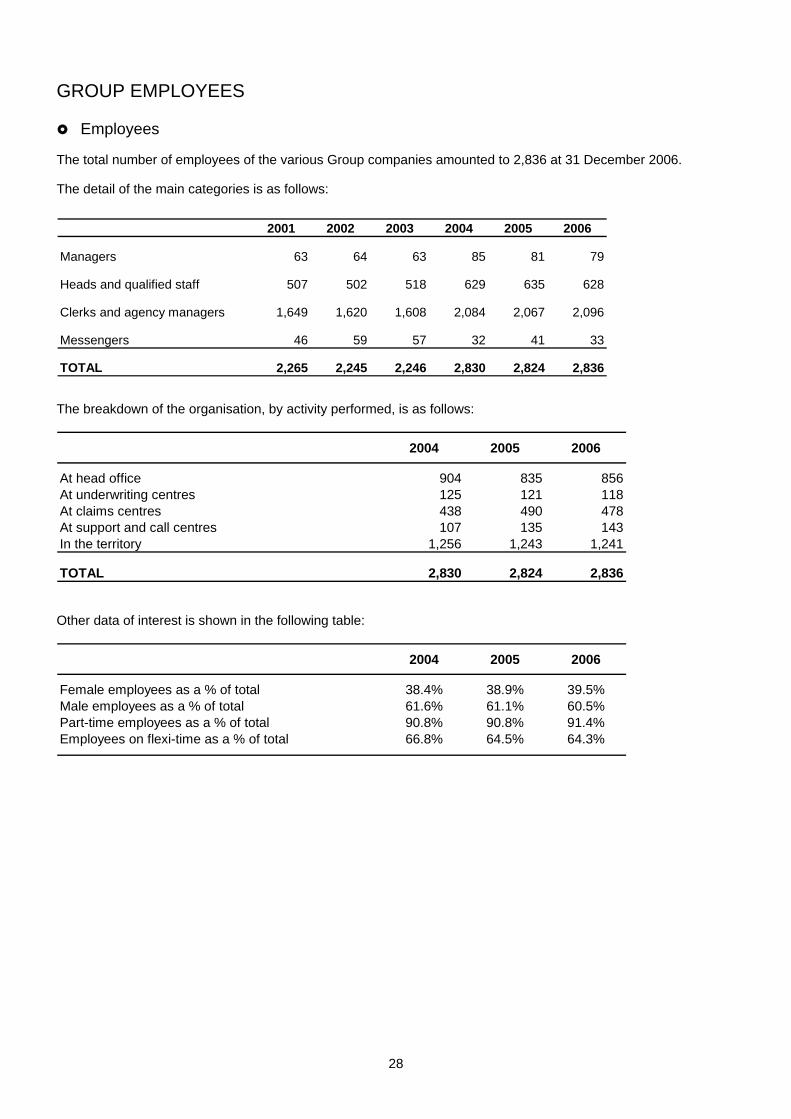
The total number of employees of the various Group companies amounted to 2,836 at 31 December 2006. The detail of the main categories is as follows:
The breakdown of the organisation, by activity performed, is as follows:
2004 2005 2006
At head office 904 835 856At underwriting centres 125 121 118At claims centres 438 490 478At support and call centres 107 135 143In the territory 1,256 1,243 1,241
TOTAL 2,830 2,824 2,836 Other data of interest is shown in the following table:
2004 2005 2006
Female employees as a % of total 38.4% 38.9% 39.5%Male employees as a % of total 61.6% 61.1% 60.5%Part-time employees as a % of total 90.8% 90.8% 91.4%Employees on flexi-time as a % of total 66.8% 64.5% 64.3%
2001 2002 2003 2004 2005 2006
Managers 63 64 63 85 81 79
Heads and qualified staff 507 502 518 629 635 628
Clerks and agency managers 1,649 1,620 1,608 2,084 2,067 2,096
Messengers 46 59 57 32 41 33
TOTAL 2,265 2,245 2,246 2,830 2,824 2,836
29
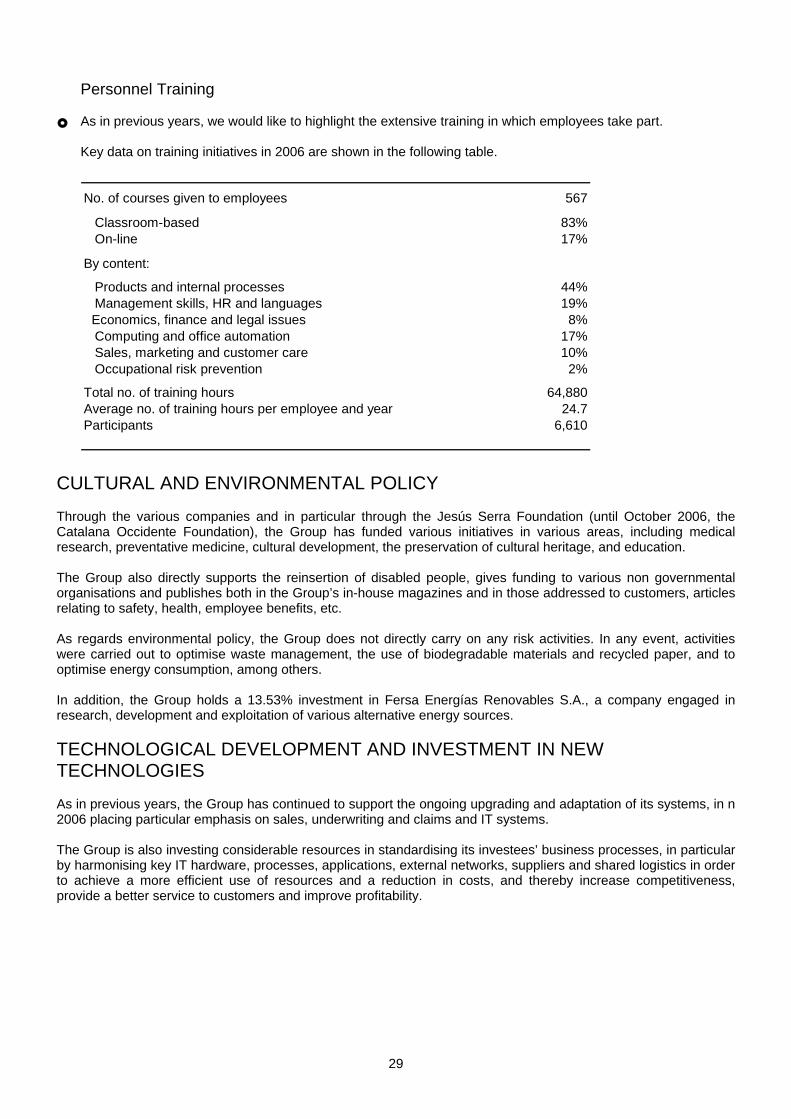
Personnel Training As in previous years, we would like to highlight the extensive training in which employees take part. Key data on training initiatives in 2006 are shown in the following table.
No. of courses given to employees 567
Classroom-based 83% On-line 17%
By content:
Products and internal processes 44% Management skills, HR and languages 19% Economics, finance and legal issues 8% Computing and office automation 17% Sales, marketing and customer care 10% Occupational risk prevention 2%
Total no. of training hours 64,880Average no. of training hours per employee and year 24.7Participants 6,610
CULTURAL AND ENVIRONMENTAL POLICY Through the various companies and in particular through the Jesús Serra Foundation (until October 2006, the Catalana Occidente Foundation), the Group has funded various initiatives in various areas, including medical research, preventative medicine, cultural development, the preservation of cultural heritage, and education. The Group also directly supports the reinsertion of disabled people, gives funding to various non governmental organisations and publishes both in the Group’s in-house magazines and in those addressed to customers, articles relating to safety, health, employee benefits, etc. As regards environmental policy, the Group does not directly carry on any risk activities. In any event, activities were carried out to optimise waste management, the use of biodegradable materials and recycled paper, and to optimise energy consumption, among others. In addition, the Group holds a 13.53% investment in Fersa Energías Renovables S.A., a company engaged in research, development and exploitation of various alternative energy sources. TECHNOLOGICAL DEVELOPMENT AND INVESTMENT IN NEW TECHNOLOGIES As in previous years, the Group has continued to support the ongoing upgrading and adaptation of its systems, in n 2006 placing particular emphasis on sales, underwriting and claims and IT systems. The Group is also investing considerable resources in standardising its investees’ business processes, in particular by harmonising key IT hardware, processes, applications, external networks, suppliers and shared logistics in order to achieve a more efficient use of resources and a reduction in costs, and thereby increase competitiveness, provide a better service to customers and improve profitability.

30
INTERNAL CONTROL. Risk Control Systems The Group has an internal control system that focuses on control of the various risks involved in the business. It consists of the following: • A set of rules and procedures applicable to the entire organisation. • Internal control procedures, with appropriate authorisation levels and the required segregation of functions,
established for the various management areas, • The performance of various external audits. • External consulting support for areas requiring such support. • A structured information system. • An internal audit unit which periodically performs audits according to the risk levels. This system enables appropriate RISK CONTROL to be performed reasonably, and is aimed at covering the SOLVENCY II considerations and, therefore, has been divided into the following three risk groups: Technical Risks and risks inherent to the insurance business
These are generated in policy underwriting, claims management based on deviations in costs or frequencies, changes in the provision for future obligations generated by the coverage offered and deviations in management costs. The actions undertaken to monitor and control these risk principally include: • Implementing appropriate technical standards for policy underwriting purposes. • Analysing products to determine the sufficiency of premiums or technical provisions. • Contracting the necessary reinsurance cover, pursuant to a policy that allows for an increase in retained
business, subject to size and solvency considerations. For outward reinsurance, only companies with a high solvency level and the required financial and management capacities are used.
• Policy and initiatives relating to returns on policies.
Financial Risks • Assets in the various portfolios managed are classified according to their characteristics (required return, risk,
liquidity, etc). • Analysis of ALM in relation to the obligations acquired with the insureds. • Analysis and monitoring of credit risk (investments below investment grade require express approval) and
tracking concentration risk on managed portfolios. • Direct supervision by the risk department.
Operational Risks
This is a different type of risk, divided into five broad groups, described separately: • General risks. This encompasses legal, technological and strategic risks. These risks are mitigated with the
support of the systems in the areas in question and the assistance of external consultants. • IT risks. Each year, a general audit of the IT area is performed by an external consultancy specialised in
preventing unauthorised access. The Group has a Business Continuity Plan and a backup centre. To test the efficiency of the plan and the centre, a simulation exercise was performed in the course of 2006.
• Human resources risks. There are emergency and building evacuation plans and occupational risk audits are carried out periodically.
• Commercial risks. These include the risks associated with commercial practices and sales systems. Controls are performed by the various sales managers, the Control Department and the Internal Audit department.
• Errors and misstatements. This item includes errors and misstatements, as well as internal and external fraud. Controls are performed by the Group’s various operational managers, and in particular by the Control and Internal Audit departments.
31
OUTLOOK FOR 2007: Strategy and Objectives. The Catalana Occidente Group has a formal, participatory planning system which culminates in the distribution of the Group’s Strategic Plan and annual guidelines for all the members of the organisation, which sets in motion a process for the creation of Action Plans and Budgets. The above Annual Guidelines focus on the objectives which, for 2007, we believe to be a priority for achieving our strategy in the medium and long term which, evidently, would not vary from those set in the last few years, apart from the intensity with which they will be carried out, the level of effectiveness forecast and the costs associated with the whole process. In this respect, the lines of action relating to the Guidelines for 2007 concentrate on the following issues:
1.- Consolidating in 2007 the improvement in net policy capture and increase in net agents achieved in 2006. 2.- Reviewing and adapting our offering to customers’ and agents’ demands and, in particular, promoting sales
in the Auto and Projected Life Premiums. 3.- Controlling the performance of Technical Margin by combining the objectives concerning the profitability of
products with those concerning the competitiveness of our offering. We will be paying particular attention to the improvement in the financial results of each product line.
4.- Lastly, continuing to contain expenses, by matching the management of resources with the objectives set, with a clear and determined support for the creation of the network and improving efficiency, promoting savings plans and taking advantage of synergies among the various Group companies.

32
STANDARDS AND LEGISLATION INTERNATIONAL ACCOUNTING STANDARDS A description is provided below of the International Accounting Standards taken into account in the preparation of this financial information. SCOPE OF CONSOLIDATION IAS 28, Accounting for investments in associates. Significant influence is presumed to exist and, therefore, companies in which between 20% and 50% of the voting rights are directly or indirectly held, are consolidated using the equity method. As local regulations set this limit at 3% in the case of listed companies, companies that fall within the 3% to 20% band are excluded from consolidation, i.e. the following companies: Mackerel SICAV, BBVA Catalana Cartera SICAV and Fersa Energías Renovables S.A. INCOME STATEMENT AND BALANCE SHEET IFRS 3 (previously IAS 22) - Business Combinations: This standard establishes that Consolidation Goodwill is not subject to periodical amortisation but to impairment analysis processes (or evaluation of the decline in value of the investment). Local Spanish standards stipulate that goodwill must be amortised within a period of 5, 10 or 20 years. The goodwill arising on the acquisition of Lepanto and Seguros Bilbao is amortised over 10 years and the goodwill in Baloise, over five years. No decline has been detected in the value of the above investments and, therefore, the amounts amortised in 2004 and 2005 under local standards have been adjusted with a credit to income in each year. IFRS 4 - Insurance Contracts Introductory paragraph 4 and paragraph 14 stipulate that technical provisions for future claims and, specifically, the current Equalisation Provision, may not be recognised. The Group has reversed any existing provisions at year-end, following deduction of income tax, giving rise to greater equity. No effects arising from the reclassification of life products as financial products have been detected, or any shortfalls in mathematical provisions as a result of liability adequacy tests. Under paragraph 30, unrealised gains on financial assets allocated to life policies are attributable to the insureds at the same proportion as the income effectively realised on such policies is allocated. According to this accounting policy, known as Shadow Accounting, the insureds’ related Shares in Future Profits have been allocated as the balancing entry for the Equity arising from gains on financial assets. IAS 12 - Corporation tax. The net tax effect of the changes arising from the accounting of the other IASs, particularly the effect on equity, must be recognised. IAS 18 - Revenues. The origination fees for the creation of mortgage loans have been recalculated. IAS 19 - Employee benefits. The employee retirement commitments have been restated. IAS 32 - Financial instruments: Disclosure and presentation: Under this IAS, the cost of treasury shares must be deducted from capital instead of being classified as an Investment. In addition, any gains on the disposal of treasury shares must be eliminated in the consolidation processes. IAS 36 - Impairment of assets: The allowances for bad debts and outstanding premiums have been restated. IAS 37 - Provisions, contingent liabilities and contingent assets: The provisions for liabilities and charges have been restated. IAS 39 - Financial Instruments: Recognition and Measurement: Under this IAS, certain assets and liabilities may be measured at market value in certain portfolios defined for that purpose. Although it also allows assets with a defined maturity to be recognised at amortised historical cost, this standard is very stringent with respect to the principle concerning the holding period for the assets classified in this type of portfolios. Therefore, the Group has chosen to classify practically all of its investment securities as marked-to-market securities, thereby giving rise to a substantial amount of gains which, upon first-time application of IASs, net of taxes, are recognised in equity. IAS 16 - Property, Plant and Equipment and IAS 40 - Investment Property. Under these IASs, properties may be, but need not be, measured at market value, which would have resulted in the emergence of gains totalling EUR 310.5 million for accounting purposes. These standards provide for a separate reporting treatment for properties for

33
own use, which are broken down under Property, Plant and Equipment, and for properties leased to third parties, which are reported as investment property. CHANGES MADE TO IFRSs Various amendments and reinterpretations were made to the previously published IFRSs in 2006, of which the most important are as follows: IAS 19: Amendment of criteria used to recognise employee benefits IAS 39: Recognition and measurement of financial instruments IFSR 4: Interpretation of Insurance Contract (Crédito) IFSR 7: Disclosures. Replaces IAS 32. APPLICATION DATES All of the International Standards except IAS 32, IAS 39 and IFRS 4 are applicable from the opening balance sheet for 2004, i.e. from 1 January 2004. IAS 32, IAS 39 and IFRS 4 are applicable from the opening balance sheet for 2005, i.e. from 1 January 2005. Optionally, companies are authorised to apply them from 1 January 2004 provided that the companies themselves and their auditors guarantee the accuracy of the adjustments resulting from their application in 2004. INTERNATIONAL STANDARDS: WHAT THE INITIALS MEAN The standards published until June 2003 are called IASs (International Accounting Standards) in English and NICs in Spanish (Normas Internacionales de Contabilidad). Those published since that date are called IFRSs (International Financial Reporting Standards) in English and NIIFs in Spanish (Normas Internacionales de Información Financiera). SOLVENCY MARGIN AND COVERAGE OF PROVISIONS To date, IFRSs have provided neither a quantified solvency level for insurance companies nor criteria for the coverage of technical provisions The Group has elected to calculate both its solvency margin and coverage of technical provisions using the methodology established under Spanish GAAP, calculating certain financial balances in accordance with the criteria established under IFRSs.

34
STOCK MARKET DATA
SHARE PRICE (euros per share)Start of year 14.72 1/01/2006Low 14.72 1/01/2006High 27.85 28/12/2006Year-end 27.45 31/12/2006Average 22.02 2006
STOCK MARKET RATIOSPER (price at 31/12/2006 / attributable earnings per share) 17.2 31/12/2006Yield (2006 dividend / price, %) 1.5% 31/12/2006Renturn (Dividends 2006 / average trading price) 1.9% 2006Pay-Out (2005 dividend / 2005 attributable profit, %) 25.2% 2006
PROFITABILITY RATIOSROE (2006 attributable profit / 2006 average equity, %) 23.6% 2006ROE (2006 attributable profit / equity at 12/2006, %) 21.2% 31/12/2006
OTHER DATA (in euros)No. of shares 120,000,000 31/12/2006Par value per share 0.3 31/12/2006Daily average trading volume (no. of shares) 118,820 01/01/2006 - 31/12/2006Daily average trading volume (thousands of euros) 2,550,475 01/01/2006 - 31/12/2006Dividend per share 0.4 31/12/2006
14.72 euros(73.6 euros)
8.80 euros(44.00 euros)
4.93 euros (24.65 euros)
3.99 euros (19.95 euros)
27.45 euros
Comparative performance of the market price of Grupo Catalana Occidente with the IBEX 35 and the Dow Jones Europe Stoxx Insurance indexes
CATALANA OCCIDENTEIBEX 35DOW JONES EUROPE STOXX INSURANCE
31/12/2002 31/12/200431/12/2003 31/12/2005Base 100 at 31/12/2001
31/12/2006
35
AUDIT At the Annual General Meeting of the Consolidated Group’s Parent held on 25 May 2006, shareholders resolved to renew the appointment of DELOITTE, S.L. as auditors of the individual Company and of the Consolidated Group, for 2006. This firm also audits the subsidiaries Seguros Catalana Occidente, Sociedad Anónima de Seguros y Reaseguros and Bilbao, Compañía Sociedad Anónima de Seguros y Reaseguros, S.A., this latter company, under a resolution of its Annual General Meeting held on 8 June 2005, for an initial period of three years. DQ Auditores S.L. audits the other subsidiaries which were fully consolidated, and those relating to the pension funds, for an initial period of three years, running from 2005, with the exception of Compañía Española de Seguros y Reaseguros de Crédito y Caución, S.A., which is audited by PricewaterhouseCoopers Auditores, S.L., and Inversiones Menéndez y Pelayo, SICAV, S.A., which is audited by Audihispana Auditores Consultores, S.A.

36
GRUPO CATALANA OCCIDENTE, S.A. AND SUBSIDIARIES Consolidated Financial Statements for the year ended 31 December 2006, prepared in accordance with International Financial Reporting Standards
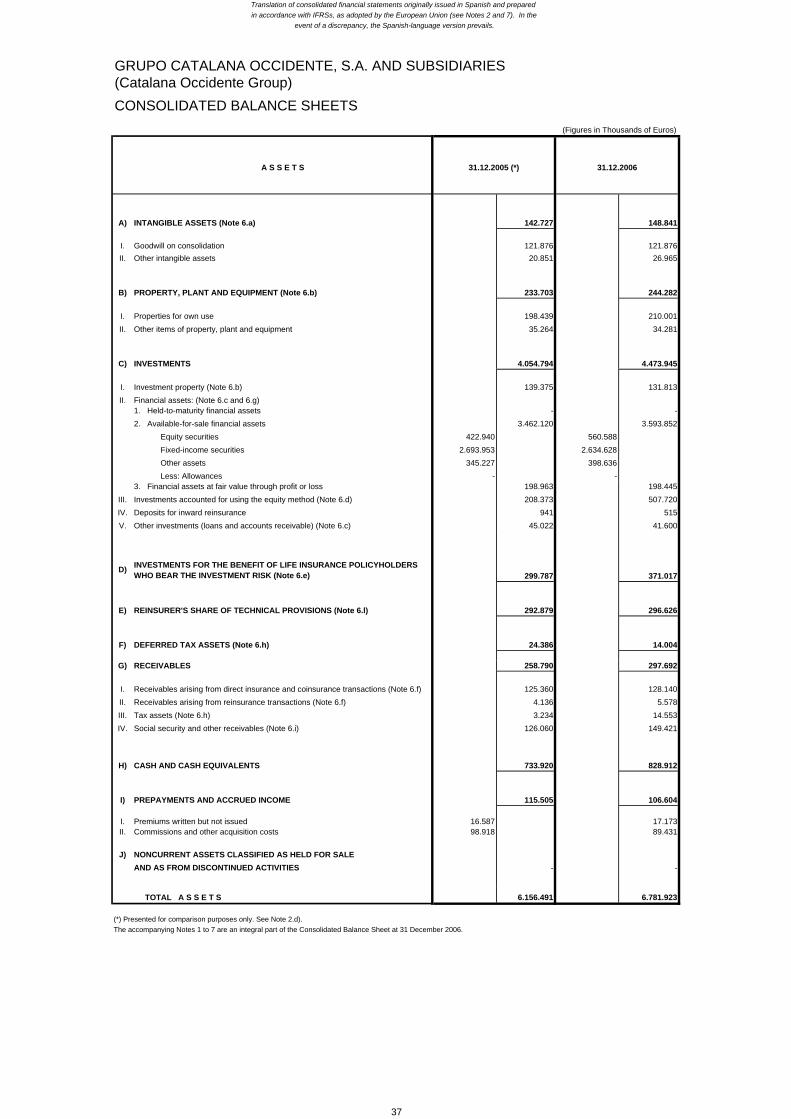
GRUPO CATALANA OCCIDENTE, S.A. AND SUBSIDIARIES (Catalana Occidente Group)CONSOLIDATED BALANCE SHEETS
A S S E T S 31.12.2005 (*) 31.12.2006
A) INTANGIBLE ASSETS (Note 6.a) 142.727 148.841
I. Goodwill on consolidation 121.876 121.876II. Other intangible assets 20.851 26.965
B) PROPERTY, PLANT AND EQUIPMENT (Note 6.b) 233.703 244.282
I. Properties for own use 198.439 210.001II. Other items of property, plant and equipment 35.264 34.281
C) INVESTMENTS 4.054.794 4.473.945
I. Investment property (Note 6.b) 139.375 131.813II. Financial assets: (Note 6.c and 6.g)
1. Held-to-maturity financial assets - -2. Available-for-sale financial assets 3.462.120 3.593.852 Equity securities 422.940 560.588 Fixed-income securities 2.693.953 2.634.628 Other assets 345.227 398.636 Less: Allowances - -3. Financial assets at fair value through profit or loss 198.963 198.445
III. Investments accounted for using the equity method (Note 6.d) 208.373 507.720IV. Deposits for inward reinsurance 941 515V. Other investments (loans and accounts receivable) (Note 6.c) 45.022 41.600
D) INVESTMENTS FOR THE BENEFIT OF LIFE INSURANCE POLICYHOLDERS WHO BEAR THE INVESTMENT RISK (Note 6.e) 299.787 371.017
E) REINSURER'S SHARE OF TECHNICAL PROVISIONS (Note 6.l) 292.879 296.626
F) DEFERRED TAX ASSETS (Note 6.h) 24.386 14.004
G) RECEIVABLES 258.790 297.692
I. Receivables arising from direct insurance and coinsurance transactions (Note 6.f) 125.360 128.140II. Receivables arising from reinsurance transactions (Note 6.f) 4.136 5.578III. Tax assets (Note 6.h) 3.234 14.553IV. Social security and other receivables (Note 6.i) 126.060 149.421
H) CASH AND CASH EQUIVALENTS 733.920 828.912
I) PREPAYMENTS AND ACCRUED INCOME 115.505 106.604
I. Premiums written but not issued 16.587 17.173II. Commissions and other acquisition costs 98.918 89.431
J) NONCURRENT ASSETS CLASSIFIED AS HELD FOR SALEAND AS FROM DISCONTINUED ACTIVITIES - -
TOTAL A S S E T S 6.156.491 6.781.923
(*) Presented for comparison purposes only. See Note 2.d).The accompanying Notes 1 to 7 are an integral part of the Consolidated Balance Sheet at 31 December 2006.
Translation of consolidated financial statements originally issued in Spanish and prepared in accordance with IFRSs, as adopted by the European Union (see Notes 2 and 7). In the
event of a discrepancy, the Spanish-language version prevails.
(Figures in Thousands of Euros)
37

GRUPO CATALANA OCCIDENTE, S.A. AND SUBSIDIARIES (Catalana Occidente Group)CONSOLIDATED BALANCE SHEETS
E Q U I T Y A N D L I A B I L I T I E S 31.12.2005 (*) 31.12.2006
A) EQUITY 985.591 1.343.218
I. Share capital paid in 36.000 36.000
II. Reserves 357.085 473.603
III. Less : Treasury shares 7.089 12.234
IV. Reserves for valuation adjustments and exchange differences 197.637 236.412
V. Reserves for pensions -4.202
VI. Retained earnings
1. Unallocated prior years' earnings
2. Profit for the year attributable to the Parent 137.591 191.389
a) Consolidated profit 175.503 249.515
b) Profit attributable to minority interests 37.912 58.126
3. Less: Interim dividends 18.240
Equity attributable to the Parent's shareholders (Note 6.j) 721.224 902.728
Minority Interests (Note 6.k) 264.367 440.490
C) TECHNICAL PROVISIONS (Note 6.l) 4.313.283 4.492.762
I. Unearned premiums and unexpired risks provisions 536.038 553.906
II. Life insurance provisions (Note 6.n) 2.622.525 2.723.055
III. Claims provisions 1.137.656 1.196.682
IV. Provisions for policyholder dividends and return premiums 6.508 7.096
V. Other technical provisions 10.556 12.023
TECHNICAL PROVISIONS FOR LIFE INSURANCE POLICIES WHERE RISK IS BORNE BY POLICYHOLDERS (Note 6.e) 299.787 371.017
E) PROVISIONS FOR LIABILITIES AND CHARGES (Note 6.m) 70.788 78.427
F) DEPOSITS RECEIVED FOR OUTWARD REINSURANCE AND RETROCESSIONS 56.057 52.282
G) DEFERRED TAX LIABILITIES (Note 6.h) 188.172 194.026
H) PAYABLES 229.595 236.881
I. Payables arising from direct insurance and coinsurance transactions (Note 6.f) 39.040 40.584
II. Payables arising from reinsurance transactions (Note 6.f) 15.498 9.820
III. Tax liabilities (Note 6.h) 50.895 58.610
IV. Other liabilities (Note 6.i) 124.162 127.867
I) ACCRUED EXPENSES AND DEFERRED INCOME 13.218 13.310
J) LIABILITIES ASSOCIATED WITH NONCURRENT ASSETS CLASSIFIED
AS HELD FOR SALE AND AS FROM DISCONTINUED ACTIVITIES - -
TOTAL E Q U I T Y A N D L I A B I L I T I E S 6.156.491 6.781.923
(*) Presented for comparison purposes only. See Note 2.d).The accompanying Notes 1 to 7 are an integral part of the Consolidated Balance Sheet at 31 December 2006.
Translation of consolidated financial statements originally issued in Spanish and prepared in accordance with IFRSs, as adopted by the European Union (see Notes 2 and 7). In the
event of a discrepancy, the Spanish-language version prevails.
D)
(Figures in Thousands of Euros)
38
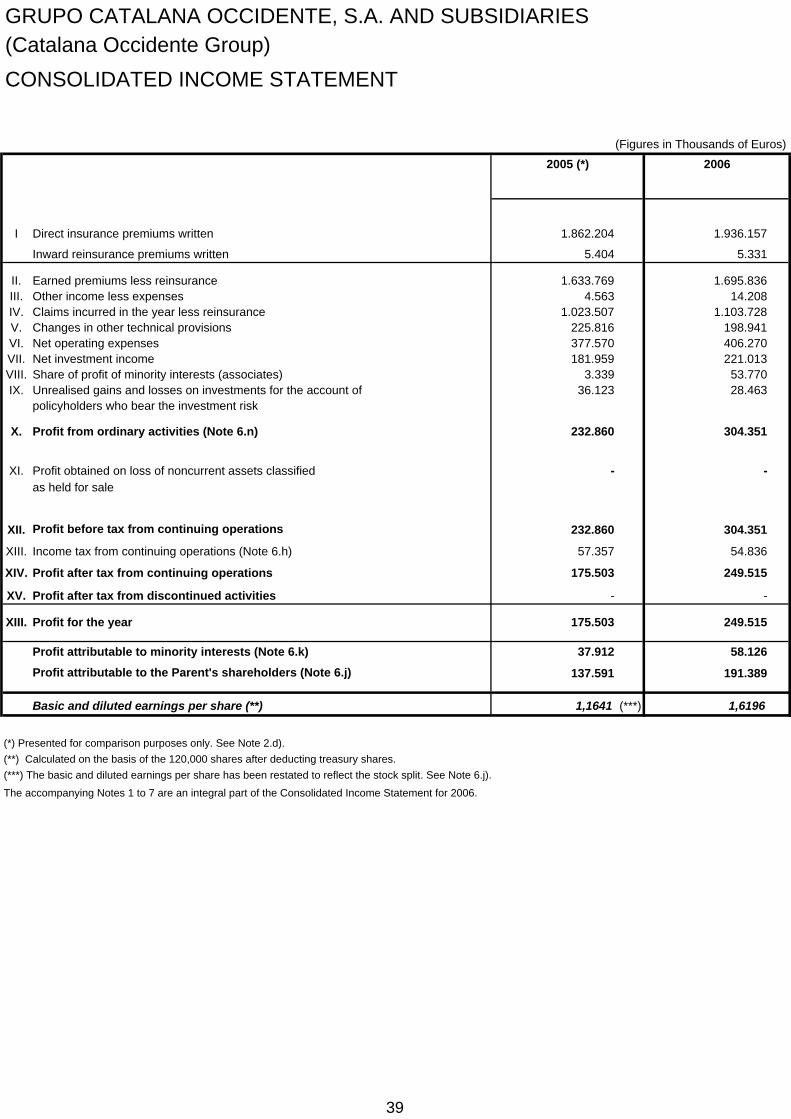
GRUPO CATALANA OCCIDENTE, S.A. AND SUBSIDIARIES (Catalana Occidente Group)CONSOLIDATED INCOME STATEMENT
(Figures in Thousands of Euros)
I Direct insurance premiums written 1.862.204 1.936.157
Inward reinsurance premiums written 5.404 5.331
II. Earned premiums less reinsurance 1.633.769 1.695.836III. Other income less expenses 4.563 14.208IV. Claims incurred in the year less reinsurance 1.023.507 1.103.728V. Changes in other technical provisions 225.816 198.941VI. Net operating expenses 377.570 406.270VII. Net investment income 181.959 221.013VIII. Share of profit of minority interests (associates) 3.339 53.770IX. Unrealised gains and losses on investments for the account of 36.123 28.463
policyholders who bear the investment risk
X. Profit from ordinary activities (Note 6.n) 232.860 304.351
XI. Profit obtained on loss of noncurrent assets classified - -as held for sale
XII. Profit before tax from continuing operations 232.860 304.351
XIII. Income tax from continuing operations (Note 6.h) 57.357 54.836
XIV. Profit after tax from continuing operations 175.503 249.515
XV. Profit after tax from discontinued activities - -
XIII. Profit for the year 175.503 249.515
Profit attributable to minority interests (Note 6.k) 37.912 58.126
Profit attributable to the Parent's shareholders (Note 6.j) 137.591 191.389
Basic and diluted earnings per share (**) 1,1641 (***) 1,6196
(*) Presented for comparison purposes only. See Note 2.d).(**) Calculated on the basis of the 120,000 shares after deducting treasury shares.(***) The basic and diluted earnings per share has been restated to reflect the stock split. See Note 6.j).
The accompanying Notes 1 to 7 are an integral part of the Consolidated Income Statement for 2006.
20062005 (*)
39
(Figures in Thousands of Euros)
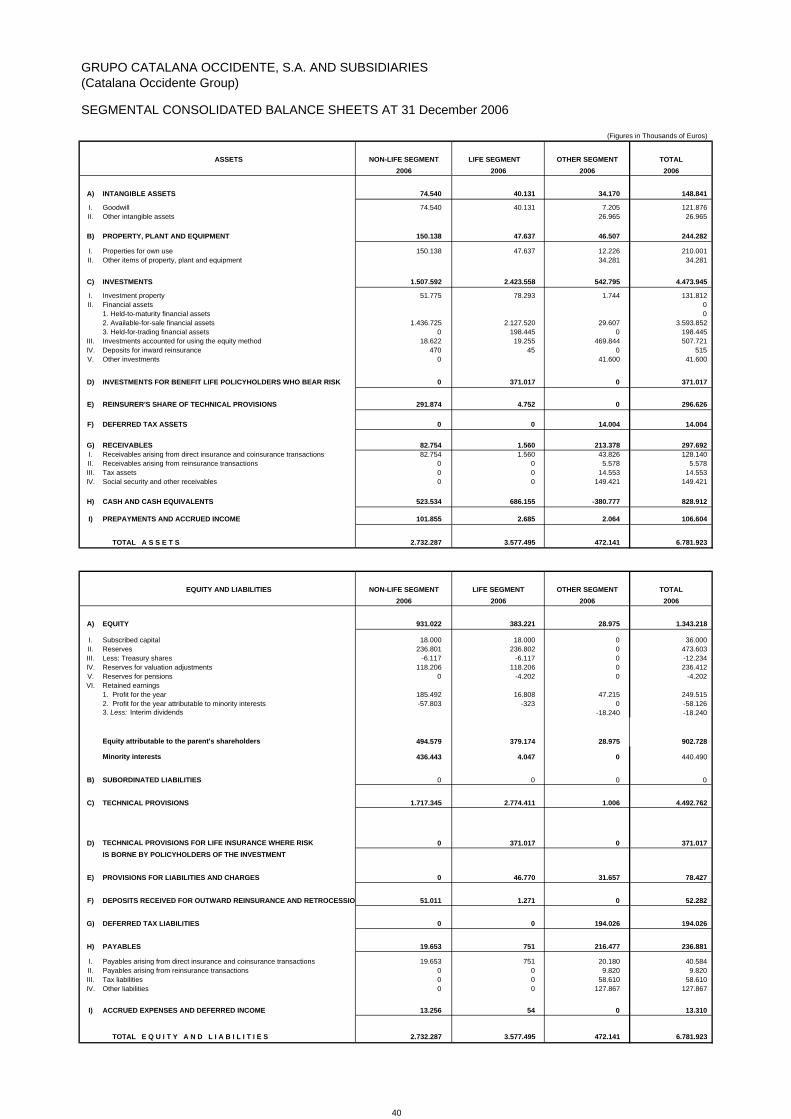
ASSETS LIFE SEGMENT
A) INTANGIBLE ASSETS 74.540 40.131 34.170 148.841
I. Goodwill 74.540 40.131 7.205 121.876II. Other intangible assets 26.965 26.965
B) PROPERTY, PLANT AND EQUIPMENT 150.138 47.637 46.507 244.282
I. Properties for own use 150.138 47.637 12.226 210.001II. Other items of property, plant and equipment 34.281 34.281
C) INVESTMENTS 1.507.592 2.423.558 542.795 4.473.945
I. Investment property 51.775 78.293 1.744 131.812II. Financial assets 0
1. Held-to-maturity financial assets 02. Available-for-sale financial assets 1.436.725 2.127.520 29.607 3.593.8523. Held-for-trading financial assets 0 198.445 0 198.445
III. Investments accounted for using the equity method 18.622 19.255 469.844 507.721IV. Deposits for inward reinsurance 470 45 0 515V. Other investments 0 41.600 41.600
D) INVESTMENTS FOR BENEFIT LIFE POLICYHOLDERS WHO BEAR RISK 0 371.017 0 371.017
E) REINSURER'S SHARE OF TECHNICAL PROVISIONS 291.874 4.752 0 296.626
F) DEFERRED TAX ASSETS 0 0 14.004 14.004
G) RECEIVABLES 82.754 1.560 213.378 297.692I. Receivables arising from direct insurance and coinsurance transactions 82.754 1.560 43.826 128.140II. Receivables arising from reinsurance transactions 0 0 5.578 5.578III. Tax assets 0 0 14.553 14.553IV. Social security and other receivables 0 0 149.421 149.421
H) CASH AND CASH EQUIVALENTS 523.534 686.155 -380.777 828.912
I) PREPAYMENTS AND ACCRUED INCOME 101.855 2.685 2.064 106.604
TOTAL A S S E T S 2.732.287 3.577.495 472.141 6.781.923
EQUITY AND LIABILITIES
A) EQUITY 931.022 383.221 28.975 1.343.218
I. Subscribed capital 18.000 18.000 0 36.000II. Reserves 236.801 236.802 0 473.603III. Less: Treasury shares -6.117 -6.117 0 -12.234IV. Reserves for valuation adjustments 118.206 118.206 0 236.412V. Reserves for pensions 0 -4.202 0 -4.202VI. Retained earnings
1. Profit for the year 185.492 16.808 47.215 249.5152. Profit for the year attributable to minority interests -57.803 -323 0 -58.1263. Less: Interim dividends -18.240 -18.240
Equity attributable to the parent's shareholders 494.579 379.174 28.975 902.728
Minority interests 436.443 4.047 0 440.490
B) SUBORDINATED LIABILITIES 0 0 0 0
C) TECHNICAL PROVISIONS 1.717.345 2.774.411 1.006 4.492.762
D) TECHNICAL PROVISIONS FOR LIFE INSURANCE WHERE RISK 0 371.017 0 371.017IS BORNE BY POLICYHOLDERS OF THE INVESTMENT
E) PROVISIONS FOR LIABILITIES AND CHARGES 0 46.770 31.657 78.427
F) DEPOSITS RECEIVED FOR OUTWARD REINSURANCE AND RETROCESSIO 51.011 1.271 0 52.282
G) DEFERRED TAX LIABILITIES 0 0 194.026 194.026
H) PAYABLES 19.653 751 216.477 236.881
I. Payables arising from direct insurance and coinsurance transactions 19.653 751 20.180 40.584II. Payables arising from reinsurance transactions 0 0 9.820 9.820III. Tax liabilities 0 0 58.610 58.610IV. Other liabilities 0 0 127.867 127.867
I) ACCRUED EXPENSES AND DEFERRED INCOME 13.256 54 0 13.310
TOTAL E Q U I T Y A N D L I A B I L I T I E S 2.732.287 3.577.495 472.141 6.781.923
NON-LIFE SEGMENT OTHER SEGMENT
2006TOTAL
2006 2006LIFE SEGMENT
2006
2006
TOTAL
GRUPO CATALANA OCCIDENTE, S.A. AND SUBSIDIARIES (Catalana Occidente Group)
SEGMENTAL CONSOLIDATED BALANCE SHEETS AT 31 December 2006
NON-LIFE SEGMENT OTHER SEGMENT
2006 20062006
40

(Figures in Thousands of Euros)
ASSETS LIFE SEGMENT
A) INTANGIBLE ASSETS 74.550 40.130 28.047 142.727
I. Goodwill 74.550 40.130 7.196 121.876II. Other intangible assets - - 20.851 20.851
B) PROPERTY, PLANT AND EQUIPMENT 135.680 48.733 49.290 233.703
I. Properties for own use 135.680 48.733 14.026 198.439II. Other items of property, plant and equipment - - 35.264 35.264
C) INVESTMENTS 1.496.056 2.356.557 202.181 4.054.794
I. Investment property 55.023 80.206 4.146 139.375II. Financial assets
1. Held-to-maturity financial assets - - - -2. Available-for-sale financial assets 1.421.804 2.040.316 - 3.462.1203. Held-for-trading financial assets - 198.963 - 198.963
III. Investments accounted for using the equity method 18.339 17.045 172.989 208.373IV. Deposits for inward reinsurance 890 51 - 941V. Other investments - 19.976 25.046 45.022
D) INV. FOR BENEFIT OF LIFE POLICYHOLDERS WHO BEAR RISK - 299.787 - 299.787
F) REINSURER'S SHARE OF TECHNICAL PROVISIONS 287.505 5.374 - 292.879
G) DEFERRED TAX ASSETS - - 24.386 24.386
H) RECEIVABLES 117.793 - 140.997 258.790I. Receivables arising from direct insurance and coinsurance transactions 117.793 - 7.567 125.360II. Receivables arising from reinsurance transactions - 4.136 4.136III. Tax assets - - 3.234 3.234IV. Social security and other receivables - - 126.060 126.060
I) CASH AND CASH EQUIVALENTS 184.136 569.514 -19.730 733.920
J) ACCRUED EXPENSES AND DEFERRED INCOME 110.663 2.535 2.307 115.505
TOTAL A S S E T S 2.406.383 3.322.630 427.478 6.156.491
EQUITY AND LIABILITIES
A) EQUITY 676.004 308.446 1.141 985.591
I. Subscribed capital 18.000 18.000 - 36.000II. Reserves 178.542 178.543 - 357.085III. Less: Treasury shares -3.545 -3.544 - -7.089IV. Reserves for valuation adjustments 98.819 98.818 - 197.637VI. Retained earnings
1. Profit for the year 161.652 12.710 1.141 175.5032. Profit for the year attributable to minority interests -37.612 -300 - -37.9123. Less: Interim dividends - - - -
Equity attributable to the parent's shareholders 415.856 304.227 1.141 721.224
Minority interests 260.148 4.219 - 264.367
B) SUBORDINATED LIABILITIES - - - -
C) TECHNICAL PROVISIONS 1.646.706 2.666.577 - 4.313.283
D) TECHNICAL PROVISIONS FOR LIFE INSURANCE WHERE RISK - 299.787 - 299.787IS BORNE BY POLICYHOLDERS OF THE INVESTMENT
E) PROVISIONS FOR LIABILITIES AND CHARGES - 46.099 24.689 70.788
F) DEPOSITS RECEIVED FOR OUTWARD REINSURANCE AND RETROCESSI 54.395 1.662 - 56.057
G) DEFERRED TAX LIABILITIES - - 188.172 188.172
H) PAYABLES 16.447 - 213.148 229.595
I. Payables arising from direct insurance and coinsurance transactions 16.447 - 22.593 39.040II. Payables arising from reinsurance transactions - - 15.498 15.498III. Tax liabilities - - 50.895 50.895IV. Other liabilities - - 124.162 124.162
I) ACCRUED EXPENSES AND DEFERRED INCOME 12.831 59 328 13.218
TOTAL E Q U I T Y A N D L I A B I L I T I E S 2.406.383 3.322.630 427.478 6.156.491
NON-LIFE SEGMENT OTHER SEGMENT
2005 20052005
GRUPO CATALANA OCCIDENTE, S.A. AND SUBSIDIARIES (Catalana Occidente Group)
SEGMENTAL CONSOLIDATED BALANCE SHEETS AT 31 December 2005
NON-LIFE SEGMENT OTHER SEGMENT
2005TOTAL
2005 2005LIFE SEGMENT
2005
2005
TOTAL
41

GRUPO CATALANA OCCIDENTE, S.A. AND SUBSIDIARIES (Catalana Occidente Group)
SEGMENTAL CONSOLIDATED INCOME STATEMENT
(Figures in Thousands of Euros)
Direct insurance premiums written 1.373.507 1.428.324Inward reinsurance premiums written 5.201 5.153
Earned premiums less reinsurance 1.151.624 1.193.522Other technical income less expenses 19.895 26.665Claims incurred in the year less reinsurance 671.847 706.694Changes in other technical provisions 373 1.557Net operating expenses 324.393 345.861Non-life technical result 174.906 166.075
Net investment income 38.541 58.614Share of profit of minority interests 1.035 1.576Non-life financial margin 39.576 60.190
Non-life technical-financial result 214.482 226.265
Non-life result 214.482 226.265
Direct insurance premiums written 488.697 507.833
Inward reinsurance premiums written 203 178
Earned premiums less reinsurance 482.145 502.314Other technical income less expenses -2.882 406Claims incurred in the year less reinsurance 351.660 397.034Changes in other technical provisions 225.443 197.384Net operating expenses 53.177 60.409Net investment income 129.498 143.356Share of profit of minority interests 2.261 791Unrealised gains and losses on investments 36.123 28.463
Life technical-financial result 16.865 20.503
Life result 16.865 20.503
Income from other activities 6.619 3.654Expenses from other activities 19.069 16.517Net investment income 13.920 19.043Share of profit of minority interests 43 51.403
Operating profit from other activities 1.513 57.583
Profit from other activities 1.513 57.583
Profit before tax 232.860 304.351Income tax 57.357 54.836
Profit for the year 175.503 249.515
Profit attributable to minority interests 37.912 58.126
Profit attributable to the parent's shareholders 137.591 191.389
(*) Presented for comparison purposes only in all applicable headings. See Note 2.d).The accompanying Notes 1 to 7 are an integral part of the Consolidated Income Statement for 2006.
2006
OTHER ACTIVITIES
NON-LIFE INSURANCE
LIFE INSURANCE
2005 (*)
42

GRUPO CATALANA OCCIDENTE, S.A. AND SUBSIDIARIES (Catalana Occidente Group)
STATEMENT OF RECOGNISED INCOME AND EXPENSE - CHANGES IN CONSOLIDATED EQUITY
Reserves
Parent's Reserves at Reserves at Reserve Other reservesShare
capital paid in
Revaluation reserves
Legal Reserve voluntary reserves
fully consolidated companies
equity-accounted companies
for treasury shares
due to changes in accounting policies
Total Reserves(Treasury Shares)
Profit for the year attributable to the
parent
Recognised Income and
ExpenseInterim dividends
for the yearMinority interests Total Equity
Balances restated at 1 January 2005 (IAS 39, IAS 32 and IFRS 4) 36.000 1.594 39.795 7.212 23.392 230.770 9.864 7.166 63.568 383.361 -7.166 115.666 - - 115.666 - 230.607 758.468
0Reclassification of reserves at the Group's Parent - - - - 75.859 -75.859 - - - - - - - - 0 - - -Distribution of voluntary reserves - - - - -29.280 - - - - -29.280 - - - - 0 - - -29.280Net trading results on treasury shares - - - - - - - - 799 799 - - - - 0 - - 799Changes in treasury shares - - - - 77 - - -77 - - 77 - - - 0 - - 77Changes in valuation adjustments - - - - - - - - - - - 81.971 - - 81.971 - - 81.971Net profit for 2005 - - - - - - - - - - - - - 137.591 137.591 - 37.912 175.503Allocation of minority interests' share in equity - - - - - - - - - - - - - - 0 - -16.072 -16.072Other changes in minority interests under IFRSs - - - - - - - - - - - - - - 0 - 11.920 11.920Adjustments due to changes in scope of consolidation and measurement of equity-accounted investments - - - - - -
3.087- -
3.087- - - - 0 - - 3.087
Adjustments due to changes in scope of consolidation and other - - - - - -882 - - - -882 - - - - 0 - - -882
Balances at 31 December 2005 36.000 1.594 39.795 7.212 70.048 154.029 12.951 7.089 64.367 357.085 -7.089 197.637 - 137.591 335.228 - 264.367 985.591
Distribution of 2005 profit - - - - 3.383 96.108 2.673 - 20.547 122.711 - - - -137.591 -137.591 14.880 - -
Interim dividends (paid) - - - - 0 - - - - - -33.120 - -33.120
Distribution of voluntary reserves - - - - -6.720 - - - - -6.720 - - - - - - - -6.720
Net trading results on treasury shares - - - - - - - - 883 883 - - - - - - - 883
Changes in treasury shares - - - - -5.145 - - 5.145 - 0 -5.145 - - - - - - -5.145
Reclassifications between reserves - - - - - - - - 4.291 4.291 - -4.291 - - -4.291 - - -Changes in valuation adjustments - - - - - - - - - - - 33.881 - - 33.881 - 3.991 37.872Increase in valuation adjustments (capital gains) due to changes in tax rates
- - - - - - - - - - - 6.029 - - 6.029 - 509 6.538
Increase in valuation adjustments (capital gains) due to equity-accounted investments
- - - - - - - - - - - 3.156 - - 3.156 - - 3.156
Changes in pension reserves - - - - - - - - - - - - -913 - - - - -913
Changes in pension reserves (equity-accounted investments)- - - - - - - - - - - - -3.289 - - - - -3.289
Changes in the scope of consolidation and measurement of equity-accounted investments - - - - - - 4.219 - - 4.219 - - - - - - - 4.219Changes in scope of consolidation and other - - - - - -14.491 - - 5.625 -8.866 - - - - - - 113.497 104.631
Net profit for 2006 - - - - - - - - - - - - - 191.389 191.389 - 58.126 249.515
Balances at 31 December 2006 36.000 1.594 39.795 7.212 61.566 235.646 19.843 12.234 95.713 473.603 -12.234 236.412 -4.202 0 232.210 -18.240 382.364 1.343.218
(Figures in Thousands of Euros)
Recognised Income and Expense
The accompanying Notes 1 to 7 are an integral part of the Consolidated Statement of Changes in Equity at 31 December 2006.
Equity valuation adjustments and
Exchange differences
Pension reserve - Net actuarial
gain/loss
Share premium and Differences
due to adjustment of share capital
to Euros
43

GRUPO CATALANA OCCIDENTE, S.A. AND SUBSIDIARIES (Catalana Occidente Group)CONSOLIDATED CASH FLOW STATEMENT
Cash flows from operating activitiesIncreases Decreases Increases Decreases
Insurance activities
Premiums received 1.862.204 - 1.936.157 -Benefits and expenses paid - 1.092.109 - 1.186.236Commissions and other remuneration paid to agents - 215.385 - 227.910Cash paid to and on behalf of employees - 136.846 - 135.323Cash paid for other operating expenses - 68.138 - 86.643
Remittances received from coinsurers 1.109 - - -Remittances made to coinsurers - 135 - -
Remittances received from reinsurers 182.798 - 186.590 -Remittances made to reinsurers - 225.367 - 219.312Remittances made to cedents - 6.550 - 1.132Remittances received from cedents 5.404 - 5.331 -
Other operating activities
Income from other activities 6.618 - 3.654 -Cash paid to and on behalf of employees - - - 5.901Expenses for other activities - 19.069 - 10.616
Corporation tax payment or refund 3.136 23.941 - 54.836
Increase / Decrease in operating assets 13.467 - - 37.461
Increase / Decrease in operating liabilities 12.882 - 7.287 -
2.087.618 1.787.540 2.139.019 1.965.370
Net cash flows from operating activities 300.078 173.649
Cash flows from investing activities
Acquisition of property, plant and equipmen - 17.150 - 21.024Disposals of property, plant and equipment 1.189 - 150 -
Acquisition of properties - 12.925 - 2.395Investment in construction works and projects - 3.252 - 9.198Disposals of properties 3.293 - 3.662 -
Investment property income 18.548 - 19.807 -Interest received 172.662 - 237.693 -Dividends received 10.582 - 19.644 -Other finance income 2.521 - 2.671 -Net proceeds on disposal of financial assets 2.622 - 23.447 -Investment property expenditure - 5.959 - 6.387Interest paid - - - -Other finance costs - 15.133 - 19.461
Investment in group companies, associates and investees - 56.394 - 279.307Other financial assets 228.738 362.413 1.678.373 1.688.226Dividends received from group companies, associates and investees 2.199 - 1.734 -Unusual proceeds on disposal of financial assets 3.849 - - -
446.203 473.226 1.987.181 2.025.998
Net cash flows from investing activities -27.023 - -38.817
Cash flows from financing activities
Dividends paid to shareholders - 34.508 - 39.840Trading in treasury shares - - - -
34.508 39.840
Net cash flows from financing activities - 34.508 - 39.840
Changes in cash and cash equivalents in the yea 238.547 94.992
CHANGES IN CASH AND CASH EQUIVALENTS IN THE YEAR
Cash and cash equivalents at beginning of yea 495.373 733.920
Cash and cash equivalents at end of year 733.920 828.912
Changes in cash and cash equivalents in the yea 238.547 94.992
(*) Presented for comparison purposes only in all applicable headings. See Note 2.d).The accompanying Notes 1 to 7 are an integral part of the consolidated Cash Flow Statement at 31 December 2006.
20062005 (*)
(Figures in Thousands of Euros)
44
45
GRUPO CATALANA OCCIDENTE, S.A.
AND SUBSIDIARIES
Notes to the Consolidated Financial Statements for the year ended 31 December 2006, prepared in accordance with International Financial Reporting Standards
Translation of a report originally issued in Spanish based on our work performed in accordance with generally accepted auditing standards in Spain and of consolidated financial statements originally issued in Spanish and prepared in accordance with IFRSs, as adopted by the European Union (see Notes 2 and 7). In the event of a discrepancy, the Spanish-language version prevails.

46
Translation of consolidated financial statements originally issued in Spanish and prepared in accordance with IFRSs, as adopted by the European Union (see Notes 2 and 7). In the event of a discrepancy, the Spanish-language version prevails.
Grupo Catalana Occidente, S.A. and Subsidiaries (Catalana Occidente Group) Notes to the Consolidated Financial Statements for the Year Ended 31 December 2006
In accordance with prevailing legislation on the content of the consolidated financial statements, these notes complete, extend and comment on the consolidated balance sheet, income statement, statement of recognised income and expense – changes in consolidated equity and the cash flow statement (hereinafter the "consolidated financial statements') and together form a set that is intended to provide a true and fair view of the assets and financial position of Catalana Occidente Group at 31 December 2006, and of the result of its activities, and the changes in its recognised income and expenses and cash flows that have taken place in the year ended on that date at consolidated level.
1. General information on the Parent and its activi ties
a) Incorporation, term and domicile
Grupo Catalana Occidente, Sociedad Anónima (“the Parent Company”) was incorporated for an indefinite period on 18 July 1864, in Spain, initially under the name “La Catalana, Sociedad de Seguros contra Incendios a Prima Fija” and changed its name to Catalana Occidente, Sociedad Anónima de Seguros y Reaseguros in 1988, which was changed to its current name in 2001, following the change in its corporate activities after the transfer of all its insurance and reinsurance business to the subsidiary Seguros Catalana Occidente, Sociedad Anónima de Seguros y Reaseguros, through a non-cash contribution of the line of business comprising all the assets and liabilities assigned to the business transferred and all its personnel.
The Parent Company has its registered office at Avenida Alcalde Barnils 63, Sant Cugat del Vallès, Barcelona, Spain).
b) Corporate purpose, legal framework and lines of insurance in which the Company operates
The Company’s corporate purpose is to purchase, subscribe, hold, administer, swap and sell all manner of domestic and foreign securities and shares, for its own account and without engaging in brokerage activities, for the purpose of directing, administering and managing such securities and shares.
The Parent carries on these activities, especially in relation to securities of companies engaging in insurance and reinsurance activities and operations and other operations subject to private insurance regulations, provided that the applicable legal requirements have been met. The Parent is not directly engaged in insurance business activities, which are undertaken by the investees qualified to do so by virtue of the relevant administrative permit. The Directorate General for Insurance and Pension Funds (“DGSFP”) has responsibility for performing the functions assigned by current legislation to the Ministry of Economy and Finance in the areas of private insurance and reinsurance, insurance agency and brokerage services, capitalisation and pension funds.
The Parent directs and manages its investment in the share capital of other companies through the arrangement of the appropriate human and material resources. If and when permitted by its investment in the share capital of these companies, the Parent manages and controls them through its membership in their managing bodies or the supply of management and administration services to such companies.
The Group operates in the following lines of insurance through its insurance companies: Life, Accident, Sickness, Health, Auto, Marine, Lake and River Transportation (hull), Aircraft, Freight, Fire and Natural Disasters, Other damage to property (combined Agricultural Insurance, Theft and other), liability (in automobile, aircraft, marine, inland transportation, arising from nuclear or other risks), Credit, Surety, various monetary Losses, Legal Defence, Assistance and Funeral. The Group also manages the pension funds "Catalana Occidente, Fondo de

47
Pensiones", “Catalana Occidente RV, Fondo de Pensiones”,”Catalana Occidente RF1, Fondo de Pensiones”, “Catalana Occidente Empleo 1, Fondo de Pensiones”, “Catalana Occidente Empleo 2, Fondo de Pensiones” “Cat Previsió, Fondo de Pensiones”, “Seguros Bilbao, Fondo de Pensiones” and “Grupo Seguros Bilbao Empleados, Fondo de Pensiones”. The subsidiaries Seguros Catalana Occidente, Sociedad Anónima de Seguros y Reaseguros and Bilbao Compañía Anónima de Seguros y Reaseguros, S.A. are the sole founding shareholders and protectors of "Catalana Occidente Previsión, Entidad de Previsión Social Voluntaria en el País Vasco" and “Bilbao, Entidad de Previsión Social Voluntaria”, respectively. The total funds managed by all the above companies amounted to EUR 366,310 thousand at 31 December 2006 (EUR 294,676 thousand at 31 December 2005). Gross income accrued for management fees for the various funds totalled EUR 4,886 thousand in 2006 (EUR 3,856 thousand in 2005), which are recognised in the income statement in the segments ‘Life – Other technical income less expenses’ and ‘Other activities – Income from other activities” less the associated marketing costs.
In view of the business activity carried on by the Group, it has no environmental liability, expenses, assets, provisions or contingencies that might be material with respect to the Group’s equity, financial position or results. Therefore, no specific disclosures relating to environmental issues are included in these notes to consolidated financial statements.
c) Group structure and distribution systems
The subsidiaries Depsa, Sociedad Anónima de Seguros y Reaseguros, Lepanto, S.A. Compañía de Seguros y Reaseguros, Nortehispana, de Seguros y Reaseguros S. A., Bilbao Compañía Anónima de Seguros y Reaseguros, S.A. and Compañía Española de Seguros y Reaseguros de Crédito y Caución, S.A. have their own organisational network and structure which is independent from that of the rest of the Group’s insurance companies (see Appendix I).
From an organisational standpoint, the rest of the companies composing the Catalana Occidente Group (hereinafter the ‘Group’) have a structure involving centralised functions and decentralised operations, with the following Service Centres: two Underwriting Centres (Barcelona and Madrid), six Claims Processing Centres (two in Barcelona and one in Valencia, Madrid, Malaga and Santander), and an Accounts Administration Centre and a Call Centre, both located at the head office in Sant Cugat.
The Group has a territorial network composed of 1,037 branches and sales offices covering the whole of Spain.
The Catalana Occidente Group distributes its products through its extensive territorial network, which consists mainly of professional, full-time agents working exclusively on behalf of the Group, with the aim of providing personal, localised and high-quality advice to customers. The Group also uses insurance brokers, part-time agents, and other specialist distribution networks. At 31 December 2006, the Group had a total of 20,863 agents.
With regards to the brokerage channel, following the entry into force of Law no. 26/2006 on private insurance and reinsurance brokerage on 29 July 2006, and in application of the Second Additional Provision, all agency agreements in force are for all intents and purposes deemed to be exclusive insurance agency agreements.
In the second half of 2006, the Group drew up new brokerage agreements, including an exclusive agency agreement, a related parties agency agreement and a letter of terms and condition for brokers, and the corresponding appendices, as required depending on the type of agreement. Accordingly, Tecniseguros, Sociedad de Agencia de Seguros, S.A., which controls the Group's network of life consultants, became the exclusive agent of Catoc Vida, S.A. de Seguros, with exclusive authorisation to market the insurance products and services of Cosalud, S.A. de Seguros. Pursuant to a distribution network usage agreement concluded between Catoc Vida, S.A. de Seguros and Seguros Catalana Occidente, S.A. de Seguros y Reaseguros, Tecniseguros is authorised to market the products of Seguros Catalana Occidente. Likewise, Bilbao Compañía Anónima de Seguros y Reaseguros, S.A. works with S. Órbita, Sociedad Agencia de Seguros, S.A. on an exclusive agency basis, having adapted its agreement with the former to the new models drawn up by the Group.
d) Other information
All of the Parent's shares are listed on the Stock Exchange Networking System (Continuous Market). The five-for-one share split approved by shareholders at the Annual General Meeting took effect on 11 July, taking total shares outstanding from 24 million with a par value of EUR 1.5 each to 120 million with a par value of EUR 0.3 each. At 31 December 2006, the shares were trading at EUR 27.45 per share.
48
2. Basis of presentation
a) Accounting standards: International Financial Re porting Standards (IFRSs)
The Group’s consolidated financial statements for the year ended 31 December 2006, which were prepared by the Board of Directors of the Parent of the Group on 29 March 2007, have been drawn up and presented in accordance with the International Financial Reporting Standards adopted by the European Union via EC Regulations, pursuant to Regulation (EC) no. 1606/2002 of the European Parliament and of the Council dated 19 July 2002.
The International Financial Reporting Standards (hereinafter IFRSs) are the Standards and Interpretations adopted by the International Accounting Standards Committee (IASC). These Standards comprise:
� The International Financial Reporting Standards (IFRS),
� The International Accounting Standards (IAS), and
� The Interpretations issued by the International Financial Reporting Interpretations Committee (IFRIC) or the previous interpretations (SIC) adopted by the former Standing Interpretations Committee.
The consolidated financial statements for the Group were prepared using the accounting records maintained by the Parent and all other companies forming part of the Group. A number of adjustments and restatements have been made in order to harmonise the accounting principles and criteria used by consolidated companies with those of the Catalana Occidente Group.
The financial statements of individual companies of the Catalana Occidente Group and of each of the remaining companies included in the scope of consolidation for 2006 continue to be prepared in accordance with Spanish GAAP and will be submitted for approval by the respective Annual General Meetings within the statutory periods. The Parent’s Board of Directors considers that they will be ratified without any significant changes.
The consolidated financial statements for 2005 prepared in accordance with IFRS were approved at the Group’s Annual General Meeting on 25 May 2006.
b) Responsibility for the information
The information in these financial statements is the responsibility of the Group’s directors, who have checked with due care that the various controls put in place to ensure the quality of the financial and accounting information, both for the Parent and the Group companies, have operated efficiently.
In the preparation of the consolidated financial statements, on occasions opinions and estimates issued by the senior executives of the Parent and of the consolidated companies and subsequently ratified by the directors, have been used. These estimates relate, inter alia, to the fair value of certain assets and liabilities, impairment losses, the useful life of property, plant and equipment and intangible assets, the measurement of goodwill arising on consolidation, the actuarial assumptions used in the calculation of post-employment commitments, the assumptions used in the calculation of the liability adequacy test, the assumptions used to recognise a portion of the unrealised gains on the portfolio of financial assets designated as ‘available for sale’ or ‘at fair value through profit or loss’ as an increase in the balance of the life insurance provisions, and the assets, liabilities and income of companies carried by the equity method.
These estimates affect both the values recognised in the balance sheet and income statement and those appearing in the statement of recognised income and expense. Although they were made on the basis of the best information available, future events may make it necessary to revise these estimates (upwards or downwards) in coming years. Any such revisions would be applied prospectively, with the effects of the changed estimates being recognised in the consolidated financial statements.
c) New standards, revised standards and amendments adopted in 2006
All changes to accounting policies have been made in accordance with the transitory provisions of the relevant standards. All standards adopted by the Group require retrospective application.

49
In accordance with their entry into force (1 January 2006), the Group had adopted the following IFRSs and amendments thereto to its activities:
• Amendments to IAS 39 –Financial Instruments: recognition and measurement and to IFRS 4 – Insurance contracts: Financial guarantee contracts
A financial guarantee contract is a contract that requires the issuer to make specified payments to reimburse the holder for a loss it incurs because a specified debtor fails to make payment when due, under either the original or modified terms and conditions attached to a debt instrument. The Group issues contracts of this kind in the form of credit insurance policies, essentially through its subsidiary Compañía Española de Seguros y Reaseguros de Crédito y Caución, S.A. and its associate Atradius NV.
Since the Group expressly stated in the consolidated financial statements for 2005 that is considered these contracts equivalent to insurance contracts and has applied its accounting principles to such contracts since the first-time adoption of IFRS, the senior executives have decided to continue applying IFRS 4 to such contracts, pursuant to the election provided for in the standard. Accordingly, the amendment was without impact on the Group’s financial statements..
• Amendment to IAS 19 – Employee benefits
The Group has elected to apply these amendments, which allow the option of recognising actuarial gains and losses in full in the period in which they occur, outside profit or loss, in a statement of recognised income and expense.
With regards to the previous treatment of actuarial gains and losses, the Group applied the exemption provided for in IFRS 1 on its transition balance sheet, recognising all actuarial gains and losses accumulated at the transition date for all plans and policies written applicable to them, electing not to defer the actuarial gains and losses that may arise in future (the brokerage method). On the basis of this treatment, that is, without deferment, application of the amendments was without material impact on the consolidated financial statements.
In addition, the Group decided to adopt IFRS 7: Financial Instruments - Disclosures in advance, as of 1 January 2006. This standard establishes the requirement to disclose the information needed to assess the significance of financial instruments for an entity's financial position and performance and also the nature and extent of the risks arising from financial instruments to which the Group was exposed at 31 December 2006. This information is provided in Note 4.
The Group opted against advance application of all other standards approved by the European Union for application before 1 January 2007, including the amendments to IAS 1, the international standard regulating the presentation of financial statements and the information that must be disclosed on the Group’s capital (essentially, information relating to the capital management objectives, policies and procedures applied by the Group).
The senior executives of the Parent and consolidated Group companies are of the opinion that the decision not to adopt these standards in advance will be without material impact on the Group's consolidated financial statements.
d) Comparative information
The consolidated financial statements for 2006 are presented for comparison purposes with the consolidated financial statements for 2005, as required under IAS 1 – Presentation of Financial Statements.
e) Consolidation principles
The Group’s scope of consolidation was defined pursuant to the provisions of IAS 27 – Consolidated and Separate Financial Statements and IAS 28 – Investments in Associates (see Appendixes I and II).
In accordance with the consolidation methods applicable in each case, these consolidated financial statements for 2006 include all the Group companies, as provided for in Article 42 of the Spanish Commercial Code. The Parent is not required to prepare consolidated financial statements with a scope greater than that of these consolidated financial statements, as, in turn, it is included in a group headed by CO Sociedad de Gestión y Participación, which prepares its consolidated financial statements separately.

50
e.1) Subsidiaries
Subsidiaries are defined as entities over which, regardless or their legal form, the Group exercises control, i.e. the power to govern the financial and operating policies of these entities so as to obtain benefits from their activities. Control is presumed to exist when the Group owns, directly or indirectly through other subsidiaries, more than half of the voting power of another entity unless, in exceptional circumstances, it can be clearly demonstrated that such ownership does not constitute control.
Appendix I to these notes to the consolidated financial statements contains significant information on these companies.
In the case of the ownership interest held in Compañía Española de Seguros y Reaseguros de Crédito y Caución S.A., the Group exercises effective control thereon through a 43.18% interest, being the principal shareholder in this company at 31 December 2006.
Exceptionally, the subsidiary Valles y Montañas, S.A. –more than 50% of the voting rights of which are directly or indirectly held by the Group– was not included in the scope of consolidation given its immaterial effect. Valles y Montañas, S.A. was incorporated in 1962 and has its registered office in Puerto de Navacerrada, Cercedilla, Madrid. At 31 December 2006, its share capital amounted to EUR 5 thousand and the fair value of this investment, which is classified under “Available-for-sale financial assets – equity securities”, amounted to EUR 5 thousand at the same date.
In addition, the Group has excluded from consolidation the ownership interests it holds in certain mutual funds, at percentages above 50%, since control is intended to be temporary only.
The financial statements of the subsidiaries are fully consolidated with those of the Group, by aggregating assets, liabilities, net equity, and income and expenses of a similar nature, which are recognised in the individual financial statements after harmonisation and restatement to comply with IFRS. The carrying amount of direct and indirect interests in the equity of subsidiaries is offset against the portion of the net equity of subsidiaries that each represents. All other material balances and transactions between consolidated companies are eliminated on consolidation. In addition, third-party ownership interests in the Group’s equity are presented in the sub-heading ‘Minority Interests’ in the consolidated balance sheet and profit for the year is presented in the sub-heading ‘Profit Attributable to Minority Interests’ in the consolidated income statement.
The individual financial statements of the Parent and the subsidiaries used for the preparation of the consolidated financial statements are prepared at the same date of presentation.
The results of subsidiaries acquired during the year are included in the consolidated income statement from the date of acquisition to year-end. The results of subsidiaries that leave the Group’s control in the course of the year are included up until the date on which they cease to be a subsidiary.
Note 5 provides information on the most significant acquisitions, mergers and disposals concluded in 2006.
e.2) Associates
Associates are entities, other than subsidiaries, over which the Group has significant influence, i.e. the power to participate in the financial and operating policy decisions of the investee but not to exercise full or joint control over such policy.
In general, it is presumed that the Group exercises significant influence if it holds, directly or indirectly, 20% or more of the voting power of the investee, unless it can be clearly demonstrated that such influence does not exist.
Appendix II provides information on these entities.
Exceptionally, the following entities (in which the Group directly or indirectly holds more than 20% of their voting power) were not included in the scope of consolidation since they are immaterial to the true and fair view of the consolidated financial statements, and they were classified in the portfolio ‘Available-for-Sale Financial Assets – Equity Securities’ at fair value:

51
Thousands of Euros
Balances at 31 December 2006
Group’s Consolidated Balance Sheet Name
% of voting power
Year of Incorporation
Registered Office Acquisition
cost Fair value
(*) Valuation
adjustments Share capital
Dividends paid in 2006
SIRESA BARCELONINA, S.A. 25.00% 1997 c/ Córcega, 225, Barcelona 786 977 191 781 138
SIRESA CAROLUS MAGNUS, S.A. 25.00% 1998 c/ Córcega, 225,
Barcelona 650 736 86 650 82
SIRESA CULLEREDO, S.A. 25.00% 1997 c/ Córcega, 225, Barcelona 228 189 -39 228 -
SIRESA TARRAGONINA, S.A. 25.00% 1997 c/ Córcega, 225, Barcelona 90 126 36 74 22
SIRESA DUODECIMA CERVANTINA, S.A. 25.00% 1998 c/ Córcega, 225,
Barcelona 600 601 1 600 -
SIRESA EUROPEA, S.A. 25.00% 1999 c/ Córcega, 225, Barcelona 195 265 70 195 53
SIRESA GIRONINA, S.A. 25.00% 1999 c/ Córcega, 225, Barcelona 258 261 3 197 36
SIRESA GRANADINA, S.A. 25.00% 2002 c/ Córcega, 225, Barcelona 451 534 83 451 75
SIRESA NOROESTE, S.A. 25.00% 2002 c/ Córcega, 225, Barcelona 554 474 -80 398 64
SIRESA NORTE, S.A. 25.00% 2004 c/ Córcega, 225, Barcelona 500 500 - 500 -
SIRESA UNIVERSITAS, S.A. 27.78% 2005 c/ Córcega, 225, Barcelona 725 725 - 725 -
SIRESA STUDIUM, S.A. 25.00% 2006 c/ Córcega, 225, Barcelona 150 150 - 150 -
(*) The fair value is determined on the basis of the financial statements of these companies as of 30 September 2006.
Relative to the previous year, there were no material changes in the interests detailed in the above table in 2006.
In the consolidated financial statements, associates are accounted for using the equity method, whereby the investment is initially recognised at cost and, subsequently, adjusted on the basis of the changes in the Group’s share of net assets of the entity. The Group’s profit for the year includes its share of the profit or loss of the investee, less the treasury shares that may be held by each investee, after deduction of dividends and other appropriations. In the case of transactions with associates, the corresponding gains and losses are eliminated pro rata to the Group’s interest in the associate’s capital.
The Group’s share in discontinued activities is recognised separately in the consolidated income statement while its share in the changes that the associates have recognised directly in equity are also recognised directly in the Group's net equity, with the detail being recorded in the statement of changes in equity.
The most recent available financial statements of the associate are used in applying the equity method. When the financial statements of an associate used in applying the equity method are prepared at a different reporting date from that of the Group, the relevant adjustments have been made for the effects of significant transactions or events that have occurred between both dates. This is the case of the financial statements used for the purposes of Baqueira Beret, S.A. and its subsidiaries. In the case of Atradius NV, whose financial statements have the same reporting date as the Group, the Group has recognised its share in the profit’s of its associate with a three-month time-lag. The consolidated financial statements for 2006 therefore include the results obtained by this associate in the period running from 1 October 2005 to 31 September 2006. For all other associates, the difference between the reporting dates of the Group and those of the associate is in no case more than three months.
If an associate uses accounting policies other than those used by the Group, the appropriate adjustments are made to conform the associate’s accounting policies to those of the Group when the associate’s financial statements are used by the Group in applying the equity method.
If there is any indication of any impairment loss in the investment in the associate, the impairment loss is deducted in the first place from the goodwill that may still be included in the investment.
52
Note 5 details the most significant investments in new associates concluded in 2006, increases in the Group’s interests in the capital of companies already classified as associates at the start of the year, and information on the sale of ownership interests.
f) Offsetting
Asset and liability balances must be offset and, therefore, the net amount thereof is presented in the consolidated balance sheet when, and only when, they arise from transactions in which, contractually or by law, offsetting is permitted and the Company intends to settle them on a net basis, or to realise the asset and settle the liability simultaneously.
Certain income and expense items in the consolidated income statement are presented at the net amount and the relevant breakdowns are provided in the notes to these consolidated financial statements.
g) Segment reporting
IAS 14 – Segment Reporting lays down the principles governing the preparation of financial information by business segment and by geographical segment.
Segmental information is structured on the basis of the control, monitoring and internal management of the insurance activities and the Group's results, and is prepared for all insurance lines and sub-lines in which the Group is active, taking the Group’s structure and organisation into account.
The Group has defined as its primary business segments Life insurance, Non-life insurance and Other activities. Secondary segments have also been defined, based on the location of the insured and existing management centres in the different autonomous regions of Spain.
The Life insurance segment encompasses all insurance contracts guaranteeing coverage of a risk that may affect the insured’s’ existence, physical integrity or health. Conversely, the Non-life insurance segment groups together all insurance contracts other than life insurance contracts, and may be broken down into the following sub-segments: multirisk, auto, credit and surety, and other. These two key segments are subject to different risks and returns. The Other activities segment is used to group together all operations other than, or not related to, the insurance business.
Each of the insurance companies directly or indirectly owned by the Group may be classified as single-line or multi-line companies, operating in one or both of the two main segments, on the basis of the definition of lines of insurance provided by the Directorate-General of Insurance and Pension Funds (DGSFP). See Note 1 for details of the specific lines in which the Group is authorised to operate.
The accounting policies for segment reporting are the same as those adopted to prepare and present the Group’s consolidated financial statements including all the accounting policies relating specifically to the segmental financial information.
Both the segmental assets and liabilities and income and expenses were determined prior to the elimination of the intra-group balances and transactions on consolidation, except to the extent that these balances or transactions had taken place between companies within the same segment. This is the prevailing scenario in the Group, with all intra-group transactions being carried out at current market prices.
The methods of recognition of assets and liabilities, and income and expenses in the Group’s primary and secondary segments are as follows:
Allocation of assets and liabilities to principal segments
Segment assets are those which relate to the Group’s insurance and insurance-related operations and are employed by a segment for the purpose of providing its services, including those which are directly attributable to the segment or can be allocated to the segment on a reasonable basis.
Segment assets include investments accounted for by the equity method according to the allocations assigned to these investments in the "Investment Book” of each subsidiary that has full ownership of and rights over the said investment. The profit or loss from such investments is included in the ordinary profit of the segment in question.

53
Segment liabilities include the Group’s share of the liabilities arising from the segment’s activities that are directly attributable to the segment or can be allocated to the segment on a reasonable basis.
Allocation of assets and liabilities to principal segments and sub segments
Technical income and expenses deriving from insurance operators are allocated directly to either the life or non-life segment, and in the case of the later segment, to one of the various sub segments, according to the nature of the activities from which they derive.
Financial income and expenses are allocated to the Life and Non-life segments according to the prior allocation of the assets that generated the income or expense in question, which is detailed in the “Investment Book” of each insurance company. A single financial instrument may be assigned to more than one segment at the same time. Where the portfolios assigned to the Life, Non-Life and Other activities segments include interests in other non-insurance subsidiaries, the individual income statement of the subsidiary in question has been consolidated in the segment in question on a line-by-line basis, in accordance with the allocation recorded in the “investment Book”. The Group’s share in the results of associates, which is recognised separately in the income statement, has been assigned to the different segments on the basis of the percentage of the investment assigned to the investment portfolio of the segment in question. Income and expense deriving from equity securities, and from other financial instruments not directly related to the insurance business, are assigned to the Other activities segment.
The aforesaid financial income and expense are allocated between the various Non-life sub-segments mainly on the basis of the technical provisions established for each of the lines in question.
The Other activities segment includes income and expense that, although deriving from activities carried out in the Life and Non-life segments, should not be included in the aforesaid technical lines.
All other non technical-financial income and expense directly or indirectly related to the different segments have been assigned to the corresponding segment directly, in accordance with the segment that generated them or some other reasonable basis for distribution. In the latter case, a cost allocation method based on functional activities has been used, and for this purpose the activities and tasks performed in each business process are identified and the resources used or generated in connection with such activities are assigned to each activity. As a result, in the attached income statement a portion of general and administrative expenses are allocated to other income less expenses, net investment income, and claims incurred in the year less reinsurance, with the remainder being recognised under net operating expenses.
The Group’s consolidated financial statements include appendixes containing consolidated segmental financial information detailing the various income and expense items and segment assets and liabilities, as well as those which have been excluded or have not been allocated, irrespective of the obligation established by the insurance companies included in the Group’s scope of consolidation to provide accounting and statistical information, based on Spanish GAAP, to the DGSFP.

54
3. Significant accounting principles and policies a nd measurement bases used
The main principles, accounting policies and measurement bases used in preparing the Group’s consolidated financial statements were as follows:
a) Intangible assets
All identifiable non-monetary assets without physical substance either arising as a result of an acquisition from a third party or generated internally by a Group company are considered to be intangible assets. Intangible assets are recognised if, and only if, they are identifiable, there are future economic benefits associated with the assets and control over the intangible asset in question, their cost can be estimated reasonably by the Group, and it is probable that the future economic benefits attributed thereto will flow to the Group.
If a potential intangible asset does not meet the strict definition of an intangible asset, the amount arising from its acquisition or internal generation by the Group is recognised as an expense in the year in which it is incurred.
Intangible assets are initially measured by the Group at acquisition or production cost and are subsequently measured at cost less any accumulated amortisation, where applicable, and any accumulated impairment losses, as appropriate. To determine whether its intangible assets are impaired, the Group applies IAS 36 – Impairment of Assets.
The Group assesses whether the useful life of an intangible asset is finite or indefinite and, if finite, the length of that useful life.
a.1) Goodwill on consolidation
The “Goodwill on consolidation” line reflects positive consolidation differences arising on the acquisition of interests in subsidiaries due to the difference between the acquisition cost of the business combination and the share acquired of the net fair value of the identifiable assets, liabilities or contingent liabilities that cannot be assigned to equity or specific intangible assets.
Future losses or any other costs expected to be incurred as a result of the combination are not liabilities incurred or assumed by the acquirer in exchange for control over the acquiree and, therefore, are not included as part of the cost of the combination.
Goodwill acquired since 1 January 2004 is recognised at acquisition cost, while goodwill acquired before this date is recognised at the net book value at 31 December 2003 determined pursuant to the previous Spanish GAAP. In both cases, goodwill acquired through a business combination is not amortised, but is tested for impairment annually, or more frequently if events or changes in circumstances so advise.
In accordance with IAS 36 – Impairment of Assets, for the purpose of identifying possible impairment losses, the Group's senior executives analyse and assess the estimates and forecasts made available by the various subsidiaries in order to determine whether the projected income and cash flows of these companies attributable to the Group support the carrying amount of the goodwill recognised. These estimates and projections are based on the following methodology, parameters and assumptions:
─ goodwill is allocated to each goodwill-generating subsidiary, representing a cash-generating unit separate from other possible units or segments,
─ the recoverable amount of each unit is determined by reference to its value in use taking into
account the most prudent projections of profit from ordinary activities after tax for the following ten years, and also a residual value of the investments determined by reference to price-earnings ratios (PER) generally accepted in the Spanish insurance industry. The projections of profit from ordinary activities are a reflection of past experience and they are consistent with external sources of information, and a steady growth rate was considered from the fifth year.
─ the discount rate applied to the projections was determined taking into account the
opportunity cost established by the Group’s Parent.
55
In the event of impairment, the decrease in the value of goodwill is recognised in the income statement for the year in which the impairment occurs, and cannot be reversed in subsequent years.
Goodwill attached to associates is included, purely for presentation purposes, in the carrying amount of the investment. To identify possible impairments, the Group:
─ calculates the present value of the portion of the future cash flows the investee is expected to
generate that is attributable to the Group, taking all future cash flows projected to derive from the investee’s ordinary operations plus the amounts ultimately realised on the sale, or disposal by other means, of the investment or asset in question into account.
─ discounts the projected future cash flows it expects to receive by way of dividends and on the ultimate sale or disposal by other means of the investment.
In the case of the goodwill associated with its associate Atradius (see Note 6.d), the Group is in the process of assigning the surplus paid for the capital of this company mainly on the basis of unrealised capital gains and the intangible assets pending valuation that derive from this investment.
a.2) Other intangible assets
The specific accounting policies applied to all other main intangible assets are as follows:
Portfolio acquisition costs
The balance of this balance sheet line corresponds basically to the difference between the price paid for a portfolio assignment and the related carrying amount. This item also includes, as a totally residual amount, the amounts paid upon acquisition of a group of policies from various agents.
These portfolio acquisition costs are measured in the same way as goodwill on consolidation, since the Group expects the intangible assets in question to contribute to the generation of future income indefinitely.
Computer software:
This balance sheet line consists primarily of amortisable expense associated with the development of IT systems and electronic communication channels.
Software licences acquired from third parties are recognised at the amount paid to acquire ownership or usage rights, plus costs incurred in installing and implementing the software in question, provided that it is expected to be used over several years and are recorded as computer software applications acquired in their entirety from third parties. Also included in this line are the costs of third parties involved in developing software for the Group, Where such applications are developed internally, the Group capitalises neither the labour costs of the team developing the applications nor the corresponding portion of its indirect costs. All costs incurred in the research phase of internal projects are also recognised as expenses in the year in which they arise.
Recurring costs incurred as a result of modifications or updates of computer software or systems, system overhauls and maintenance costs are recognised as an expense in the year in which they are incurred.
All computer software is systematically amortised over the period it is used, on the basis of a maximum useful life of four to five years.
b) Property, plant and equipment
The Group records under this balance sheet heading all properties for own use, properties occupied by Group companies and properties under construction or development for future use as investment property that are fully owned by the Group. Upon completion of construction or development, the latter assets are reclassified as investment property.
This heading also includes transportation equipment, furniture and fixtures and computer hardware, among others.

56
These assets are recognised at acquisition or construction cost, less accumulated depreciation and, where applicable, accumulated impairment losses, but never at less than their residual value. The costs of extensions and improvements made to the properties held by the Group subsequent to the initial recognition thereof are capitalised to other items of property, plant and equipment provided that they lead to increased capacity, floor area or returns, or to a lengthening of the useful life of the assets. Conversely, upkeep and maintenance expenses are charged to the income statement as incurred.
If the payments relating to an investment property are deferred, its cost is the cash price equivalent. The difference between the cash price equivalent and the total payment is recognised as an interest expense over the deferred period.
In general, the Group applies the straight-line systematic depreciation method to the acquisition cost, excluding the residual value, over the following estimated useful lives:
Items of Property, Plant and Equipment Estimated Useful Life
Properties 33 to 77
Improvements to owned buildings 10 years
Transport equipment 6 to 7 years
Computer hardware 4 to 5 years
Other items of property, plant and equipment 5 to 10 years
The residual values and remaining useful lives of these assets are reviewed at each balance sheet date and adjusted as appropriate. The recognised carrying amount of an asset is immediately reduced in line with its recoverable amount if the carrying amount is greater than the estimated recoverable value. Gains and losses realised are calculated by comparing the amounts obtained with the recognised carrying amounts.
c) Investments
c.1) Investment properties (for use by third parties)
Properties held for capital appreciation or to generate rental income over the long term and that are not occupied by Group companies are classified as investment properties.
Also included in this line are land held for an undetermined future use and buildings that are currently vacant.
Certain properties comprise a portion that is held to earn rentals and another portion that is held for own use. If these portions could be sold separately, the Group also accounts for the portions separately. Otherwise, the property is classified as investment property only if an insignificant portion thereof is held for own use.
Investment properties are land and buildings that are fully owned by the Group and are recognised at acquisition or construction cost, less accumulated depreciation and, where applicable, accumulated impairment losses, but never at less than their residual value. The acquisition cost consists of the purchase price and any directly attributable expenditure (associated transaction costs). In the case of investment properties constructed by the Group, the acquisition cost is the property’s cost at the date when the construction or development is complete.
The treatment of the costs of extension, modernisation or improvements and the methods of calculation of impairment, depreciation systems and useful lives established for investment properties are similar to those used for properties for own use (see Note 3.b above).
The fair value of both investment properties and properties for own use which is indicated in Note 6.b was determined on the basis of valuations by independent values. In order for this fair value to reflect market conditions at the balance sheet date, the Group makes the relevant recalculation, if the valuation date differs by more than 12 months from the measurement date, in accordance with the parameters established in the valuation.

57
c.2) Financial assets
Recognition
Financial assets are generally recognised on the date of settlement/delivery.
In accordance with IAS 39 - Financial Instruments: Recognition and Measurement, the Group designates financial instruments as either financial assets at fair value through profit or loss, available for sale financial assets, or loans and receivables at the time of either acquisition or generation.
Classification of financial assets
Note 6.c to these consolidated financial statements shows the balances of financial assets outstanding at 31 December 2006 and 2005, together with their specific nature, classified as follows:
− Financial assets at fair value through profit or loss:
They are financial assets that meet any of the following conditions:
� they are classified as held for trading since they are intended to be sold in the short term.
� they are classified into financial schemes or portfolios that are allocated to insurance transactions (insurance contracts for which the flows arising from the financial assets are sufficiently coincident in time and quantity with the obligations stemming from a group of consistent policies).
The Group allocates to this portfolio all financial instruments with an associated or embedded derivative, as well as investments in bonds, whether or not quoted on an active market, part of its long-term deposits and all non-mortgage loans corresponding to financed externalisation premiums.
The Group estimates the value of financial instruments not quoted on an active market or for which no firm market value is available from the counterparty by discounting the cash flows the financial assets in question are expected to generate, using the market yield curve (see following section).
− Loans and receivables:
Loans and receivables are non-derivative financial assets with fixed or determinable payments that are not quoted in an active market.
The Group classifies the majority of its mortgage loans, non-mortgage loans and policy advances, as well as other financial assets without published price quotations, in this category.
- Available-for-sale financial assets:
This category includes all financial assets that are not classified in the other portfolios.
As a general rule, the Group includes in this category all equity instruments, the part of its portfolio of quoted and unquoted bonds that is not specifically set aside to cover commitments to insureds, as well as all interests in investment funds, part of its long-term deposits and other financial assets with published price quotations.
Investments in associates are accounted for specifically under the sub-heading ‘Equity-Accounted Investments’. Likewise, receivables deriving from the deposits required in the inward reinsurance business are included under the specific balance sheet sub-heading “Deposits for inward reinsurance”. Other receivables — specifically receivables arising from direct insurance, reinsurance and coinsurance transactions, tax assets, social security and other receivables — are recognised in the balance sheet according to their nature.
In 2006 and 2005, no financial instruments were classified as ‘Held-to-maturity investments’, nor were any significant reclassifications made with respect to the initial allocation.
58
Recognition and measurement of financial assets
Upon initial recognition, the Group measures a financial asset at fair value, adjusted (in the case of a financial asset not recognised at fair value through profit or loss) for the transaction costs that are directly attributable to the purchase or issue thereof.
After initial recognition, the Group measures financial assets, including derivatives that are assets, at fair value, without any deduction for transaction costs that it may incur on sale, except for certain loans and receivables which are measured at amortised cost using the effective interest rate method.
The fair value of a financial instrument on a given date is taken to be the amount for which it may be bought or sold by knowledgeable, willing buyers and sellers in an arm’s length transaction. The most objective and common reference for the fair value of a financial instrument is the price that would be determined on the basis of the quoted prices published in the active market. When such reference exists, it is used to measure the financial asset. However, in certain cases the price quotations provided by the various counterparties who would be willing to exchange a certain financial asset are also considered.
In the absence of an active market for a financial instrument, the Group determines fair value using generally accepted measurement techniques. In this case, mathematical measurement models are used that have been sufficiently tested by the international financial community, taking into account the specific characteristics of the instrument to be measured and the various types of risk associated therewith. These mathematical models can be directly used by the Group or by the counterparty who acted as seller.
Instruments measured at amortised cost are measured taking into account the effective interest rate method. Amortised cost is taken to be the amount at which the financial instrument was initially measured, minus principal repayments, plus or minus, as appropriate, the cumulative gradual amortisation or allocation, using the effective interest rate method, of any difference between that initial amount and the redemption value upon maturity, minus any reduction for impairment or uncollectibility.
All financial assets except for those recognised at fair value through profit or loss are subject to impairment testing.
Impairment of financial assets
At each balance sheet date, the Group assesses whether there is objective evidence that a financial asset or a group of financial assets is impaired, taking into account events that either individually or in conjunction with others provide such evidence.
As a general rule, the Group considers evidence of impairment a prolonged period (in excess of six months) in which the market value of equity and debt securities, taken individually, remains at less than 80% of cost or amortised cost. It also considers evidence of impairment situations where the unrealised loss on a given security is irreversible. In such situations, unrealised losses of between 10% and 20% of cost are analysed individually.
For debt and similar securities, the Group also considers evidence of impairment a drop in their rating to BBB- or lower as well as situations where interest payments are delayed by more than three months.
In those situations where, based on the aforesaid criteria, evidence of impairment may exist, the Group analyses the situation to quantify, in each case, the extent of the loss to be recognised, using the following methods to determine the amount of the impairment:
− Financial assets recognised at amortised cost:
The amount of the loss is measured as the difference between the asset's carrying amount and the present value of estimated future cash flows discounted at the financial asset's original effective interest rate. The carrying amount of the asset is reduced through use of an allowance account, while the amount of the loss is recognised in profit or loss.
If, in subsequent periods, the amount of the impairment loss decreases, the previously recognised impairment loss shall be reversed in the income statement.
This category of assets includes receivables held by the Group with certain insureds and/or policyholders in connection with uncollected premiums and unissued premiums. In this case the

59
impairment is determined on the basis of the last three years’ cancellation experience, with greater weighting being given to more recent years, and taking into account the months elapsed from the theoretical collection date and each reporting date, as well as the line of insurance in question.
Receivables on the recovery of claims are capitalised when realisation is sufficiently guaranteed.
− Available-for-sale financial assets:
When a significant decline in the fair value of an available-for-sale financial asset occurs, the cumulative loss that had been recognised directly in equity is removed from equity and recognised in profit or loss even though the financial asset has not been derecognised.
Impairment losses recognised in profit or loss for an investment in an equity instrument classified as available for sale (equity securities) are not reversed through profit or loss. However, reversals associated with debt instruments are recognised in profit or loss.
Recognition of changes arising in the measurement of financial assets and financial liabilities
A gain or loss arising from a change in the fair value of a financial asset that does not form part of a hedging transaction, is recognised as follows:
− A gain or loss on a financial asset at fair value through profit or loss is recognised in the income statement for the year in the “Unrealised gains and losses on investments” line of the Life Insurance segmental income statement.
− A gain or loss on an available-for-sale asset is recognised directly in equity, in the “Valuation adjustments” line until the financial asset is derecognised, except for impairment losses and exchange gains or losses. The gain or loss previously recognised in equity is recognised in the income statement for the year upon derecognition of the asset.
However, interest calculated using the effective interest rate method is recognised in the income statement for the year (see point l) of this Note). Dividends on an equity instrument classified as available for sale are recognised in the income statement for the year when the right for the Group to receive payment has been established.
When a financial asset recognised at amortised cost is derecognised or impaired, or the effective interest rate method is applied to it, the resulting income and expenses are recognised through profit and loss.
c.3) Investments held for the benefit of policyhol ders
Investments held for the benefit of policyholders who bear the investment risk are measured at cost upon subscription or purchase thereof. This cost price is subsequently adjusted on the basis of its realisable value. Any revaluation or impairment of these assets is recognised with a credit or charge to the Life Insurance Segment’s income statement on a net basis, under the sub-heading “Unrealised gains and losses on investments”.
All equity, debt and other instruments that are quoted on an official market are classified as at fair value through profit and loss and assigned to this portfolio. Only financial assets without published price quotations (treasury bills, short-term bank deposits) and other assets used in trading are assigned to the portfolio of loans and receivables.
For presentation purposes, all investments and balances assigned to this business segment are recognised in the "Investments for the benefit of life insurance policyholders who bear the investment risk" line of the balance sheet, such that they offset the liabilities recorded for these contracts, which are recognised in the "Technical provisions for life insurance policies where risk is assumed by policyholders" line.
d) Financial liabilities
A financial liability is a contractual obligation requiring the Group to deliver cash or another financial asset to another entity or to exchange financial assets or financial liabilities with another entity on terms that are potentially unfavourable.
60
Since financial liabilities do not include obligations incumbent on the Group on the balance sheet date that derive from or are associated with insurance contracts, financial liabilities constitute an insignificant item on the Group’s balance sheet.
After initial recognition, in general the Group measures all its financial liabilities at amortised cost using the effective interest rate method.
When a financial liability recognised at amortised cost is derecognised or impaired, or the effective interest rate method is applied to it, the resulting income and expenses are recognised through profit and loss.
e) Cash and cash equivalents
This balance sheet item consists of liquid assets, including cash, sight deposits, and cash equivalents.
Cash equivalents consist of highly liquid, short-term investments that can be easily converted into given cash amounts, are exposed to insignificant foreign currency risk and fall due within three months.
f) Non current assets and liabilities held for sale
Assets held for sale are generally recognised at the lower of their carrying amount or fair value, less the estimated sale costs, the latter being understood to mean all marginal costs directly attributable to their disposal, excluding, where applicable, the financial costs and corporation tax.
Non current assets classified as held for sale are not amortised.
Impairment losses are recognised in the income statement. Should the loss be reversed, the reversal is recognised in income for am amount equal to the impairment loss previously recognised.
g) Foreign currency transactions
Transactions in foreign currency (other than the euro, the Group’s functional currency) carried out by the consolidated companies are initially recognised in their respective financial statements at their equivalent euro value calculated at the exchange rates prevailing at the date of the transaction. Subsequently, at each balance sheet date:
− monetary items in foreign currency are translated to euros at the rates prevailing on the balance sheet date,
− non-monetary items in foreign currency which are carried at historical cost are translated to euros at the exchange rates prevailing at the date of the transaction, and
− non-monetary items in foreign currency which are carried at fair value are translated to euros at the exchange rates prevailing on the date on which such fair value is determined.
Exchange differences arising on translation of the foreign currency balances to euros are generally recognised in the income statement. Nevertheless:
− exchange differences arising on non-monetary items whose fair value is adjusted against equity are recognised in equity under ‘Valuation adjustments - exchange differences’.
− exchange differences arising on non-monetary items whose gains and losses are recognised in profit for the year, are also recognised in profit for the year.
h) Corporation tax
The period corporation tax expense is computed on the basis of accounting profit before taxes, determined in accordance with Spanish GAAP, adjusted by permanent differences with regard to taxable profit, i.e. differences between taxable profit and accounting profit before tax that do not reverse in subsequent periods, and those arising from application of the new IFRSs in respect of which, likewise, no reversal will take place.

61
When the differences in value are recognised in equity, the related income tax is also recognised against equity.
Both temporary differences arising from differences between the carrying amount and the tax base of an asset or liability and, where the assets are capitalised tax assets arising from tax credits and rebates and tax losses give rise to deferred tax assets or liabilities, which are measured at the tax rates that are expected to apply in the period when the asset is realised or the liability is settled.
On 29 November 2006, Law 35/2006 on personal income tax and the partial amendment of the laws governing corporation tax, the taxation of non-residents and wealth tax was published. This new Law, which entered into force on 1 January 2007, modifies, inter alia, the rate of corporation tax, which shall henceforth be 32.5% for tax periods beginning on or after 1 January 2007 and 30% for tax periods beginning on or after 1 January 2008.
The Group recognises deferred tax liabilities for all taxable temporary differences. Deferred tax assets are recognised only to the extent that it is considered highly probable that the consolidated companies will have sufficient taxable profits in the future against which the deferred tax asset can be utilised.
The deferred tax assets and liabilities recognised in the Group’s consolidated balance sheet at 31 December 2006 have been restated to take account of the new tax rates and the period within which the Group expects to recover or offset the aforesaid assets and liabilities. Differences between the previous and the new rates have been recognised in income except when the change related to items previously recognised in equity (this exception will apply to the settlement of the deferred taxes deriving from realised capital gains, net of capital losses and the assignment to policyholders of financial assets classified as “available-for-sale".
A deferred tax liability is recognised for taxable temporary differences arising from investments in Group companies (that are not consolidated for tax purposes) and associates, except when the Group is able to control the reversal of the temporary differences and it is probable that such differences do not reverse in the foreseeable future.
i) Insurance and reinsurance assets and liabilities
The Group applies the requirements established in IFRS 4 – Insurance Contracts to all the insurance assets and liabilities recognised in its consolidated financial statements that derive from insurance contracts, as defined in this standard.
Classification of the portfolio of contracts
The Group assesses and classifies its direct Life and Non-life portfolio of contracts (including inward reinsurance) and of outward reinsurance taking into account the Implementation Guidance accompanying IFRS 4 and the guidelines issued, other than for statutory purposes, by the DGSFP on 22 December 2004, through the Framework Document on the Accounting System for Insurance Companies in relation to IFRS 4. All contracts are classified as ‘insurance contracts’, including the financial guarantee contracts issued by the Group in the form of insurance contracts, in accordance with the exception provided for in the amendment published on 27 January 2006.
The Group does not unbundle any deposit components associated with insurance contracts, since such unbundling is voluntary in nature. Also, it is considered that the surrender options issued to the insurance policyholders either have a fair value of zero or, alternatively, that their value forms part of the insurance liability.
Measurement of insurance and reinsurance assets and liabilities
IFRS 4 imposes restrictions on permitted changes to accounting policies for insurance contracts. Pursuant to this standard, the Group has maintained the accounting policies established for insurance contract assets and liabilities that it had applied under Spanish GAAP to insurance contracts, except for the following adjustments, which are mandatory for all insurance providers:
− It is eliminating the equalisation reserve that insurance companies were required to recognise under Spanish GAAP, as provided for in the Private Insurance Regulations (ROSSP).

62
In the Group's case, the largest equalisation reserve is that required for the credit insurance line through Compañía Española de Seguros y Reaseguros de Crédito y Caución, S.A. Given the highly cyclical component of the credit insurance line, the aim of the equalisation provision is to reach technical stability, thereby avoiding the unfavourable random deviations in the claims figure. Particularly, in the individual financial statements of this company, prepared under Spanish GAAP, the period equalisation provision may not be less than 75% of the technical profit of the credit insurance line and it is made until it reaches the limit of 134% of the average of the premiums written (minus outward reinsurance plus retrocessions) during the previous five years).
Group subsidiary Atraduis NV, whose Parent has its registered office in the Netherlands, is not required to established an equalisation reserve, even though it is also active in credit insurance.
− It performs the liability adequacy test provided for in IFRS 4, with a view to guaranteeing the adequacy of its contractual liabilities. To this end, the Group compares the carrying amount of technical provisions, less any deferred acquisition costs or any intangible assets related to the insurance contracts under assessment, against the amount determined as a result of considering current estimates, using market interest rates, of all cash flows under the insurance contracts, and of related cash flows, such as those resulting from embedded options and guarantees.
In the above calculation the Group offsets the deficiencies with the surpluses, considering the various types of insurance included in the life line as a single level of aggregation, for each subsidiary engaged in the insurance business separately considered.
Since the liabilities were adequate at the transition date, on the basis of the calculations made at 31 December 2006 and 2005, it was not necessary to increase the amount of insurance liabilities recognised as of these dates.
For the purpose of partially avoiding the mismatches caused by the use of different measurement bases for financial assets, which are classified mainly under the available-for-sale portfolio, and insurance liabilities, the Group recognises as an increase in the sub-heading ‘Life Insurance Provisions’ the portion of the unrealised gains arising from the above assets, which are expected to be allocated to the insured’s as they materialise or through the application of an assumed interest rate higher than the market interest rate.
The main accounting policies applied by the Group in connection with the technical provisions are summarised below.
Unearned premiums and unexpired risks provisions
The unearned premiums provision is the proportion of premiums written in the year to be allocated to the period from each year-end to the expiry of the policy period. The Group’s insurance companies calculated this provision for each line of insurance on a policy-by-policy basis, by reference to the premium rates, net, where appropriate, of the loading for contingencies, i.e., commissions and other acquisition costs are not deducted.
The unexpired risks provision is intended to complement the unearned premiums provision to the extent that the amount of this provision is not sufficient to reflect the measurement of all risks and expenses to be covered in relation to the coverage period not closed at year-end. This provision is calculated and established, as needed, in accordance with the calculation stipulated in the ROSSP regulations, considering the technical income by year of occurrence for the closing year jointly with the previous year or the three previous years, subject to the line of insurance in question.
For the auto line, the provision for unexpired risks is calculated taking all risks covered by the products marketed by the various insurance subsidiaries into account.
Life insurance provisions
This reserve comprises the unearned premiums provision for insurance policies with a coverage period equal to or shorter than a year and, mainly for other lines of insurance, the mathematical provision. Mathematical provisions, which represent the excess of the current actuarial value of the future obligations of insurance subsidiaries over the value of the premiums payable by policyholders, are calculated on a policy-by-policy basis under an individual capitalisation method, by reference to the inventory premium accrued in the year, in accordance with the Technical Bases of each line of insurance adjusted, as appropriate, for the mortality tables approved by current Spanish legislation.

63
Mainly in combined life insurance and retirement insurance (a line in which no new policies are being issued at present), the Group also assesses the options available to insureds who, upon expiration of their policy, may choose between capital or annuity, where the interest rate is fixed when the policy is taken out. Likewise, for those types of insurance that guarantee an interest rate higher than that specified under Article 33.1 of the ROSSP (three or six months), that is, essentially for Universal Life type insurance contracts, the Group calculates the mathematical provision by reference to the highest applicable interest rate published each year by the DGSFP, rather than the guaranteed interest rate.
Claims provisions
These provisions include the total amount of obligations outstanding as a result of claims incurred at year-end. The Group calculates this provision as the difference between the total estimated or certain cost of claims not reported, settled or paid and the aggregate amounts already paid on account of such claims.
In the case of life claims, this provision is calculated on a case-by-case basis for claims not yet settled or paid and on the basis of the experience, as indicated in the Regulations, of claims not yet reported.
For Non-life claims not yet settled or paid, thee total amount is calculated on the basis of a detailed analysis of each case (drawing on the best information available at the year-end), except in the case of the general civil liability business of subsidiary Seguros Catalana Occidente, S.A. de Seguros y Reaseguros.
On 29 January 2007, Seguros Catalana Occidente, S.A. de Seguros y Reaseguros informed the DGSFP that it had begun using global statistical methods to calculate the provision for general civil liability claims not yet settled, paid or reported for accounting purposes as of 31 December 2006. This provision has been calculated using the best estimate provided by actuarial calculations based on both deterministic and stochastic models generally accepted in the industry. For the purposes of the tax deductibility of this claims provision calculated using statistical methods, Seguros Catalana Occidente, S.A. de Seguros y Reaseguros has made the relevant calculations, following the requirements established in the Third Additional Provision of the ROSSP.
In accordance with Article 43 of the ROSSP, for a minimum period of five years, Seguros Catalana Occidente, S.A. de Seguros y Reaseguros is required to use statistical methods alongside case-by-case claims assessment methods and to establish the provision on the basis of the higher amount indicated by the results of the two methods. The increase in the provision for claims not yet settled or paid, following application of this new calculation method, was EUR 13,434 thousand.
For Non-life claims not yet reported, except in the case of general civil liability, which is commented above, the provision is calculated on the basis of the experience of each Group subsidiary, by reference to average costs and claims not yet reported over the past three years..
For both the Life and Non-life segments and irrespective of the valuation method used, the Group includes both internal and external claims management and processing expenses, regardless of origin, whether incurred or to be incurred, until full claim settlement and payment. This estimate is calculated in accordance with Article 42 of the ROSSP, taking into account the ratio existing between claims-related internal expenses and claims paid, applied to the claims provision of each line, after the expense reclassifications according to nature and application explained in note 2.g)
Pursuant to Spanish legislation currently in force, the Group does not discount the claims provision.
Provisions for policyholder dividends and return premiums
These provisions include the earnings accrued to insured’s or beneficiaries that are not yet allocated at the year-end. It does not reflect the effect of assigning part of the unrealised capital gains on the investment portfolio for the benefit of policyholders, which is included together with the “Life insurance provisions”.
Provisions for life insurance policies where risk is assumed by policyholders
The provisions for insurance policies where the investment risk is borne by policyholders are determined by reference to the benchmark indexes or assets used to determine the economic value of the policyholder’s rights. See Note 4.c.3,
64
Other technical provisions – Funeral insurance
This provision is recognised on the basis of the actuarial approach to the transaction, pursuant to the Technical Basis of the insurance contracts.
It should also be taken into account that the “Accrued expenses and deferred income" heading on the assets side of the balance sheet consists essentially of commissions and other acquisition costs relating to premiums written that are to be allocated in the period between each year-end and the expiry of the policy cover, with costs recognised in income corresponding to those actually incurred in the period, subject to the limit established in the Technical Basis.
Likewise, the Accrued expenses and deferred income" heading on the liabilities side of the balance sheet includes commissions and other acquisition costs relating to outward reinsurance that are to be allocated in subsequent periods in line with the cover period of the ceded policies.
Commissions and acquisition costs directly related to new premiums written are never capitalised, and are recognised in income in the year in which they are incurred. .
j) Treasury shares
The negative balance of the heading ‘Equity – Treasury Shares’ in the consolidated balance sheet relates to the Group’s shares held exclusively by the subsidiary Salerno 94. These shares are carried at acquisition cost. The related adjustments and the gains and losses arising from disposal of treasury shares are credited or charged, as appropriate, to the sub-heading under equity called ‘Other reserves for changes in accounting policies – gains/losses on treasury shares’.
A comparative summary of the transactions carried out with the Group’s own shares in 2006 is provided in Note 6.j).
k) Provisions for liabilities and charges
The Group’s consolidated financial statements include all the material provisions with respect to which it is considered that it is more likely than not that the obligation will have to be settled. Contingent liabilities are not recognised in the consolidated financial statements.
Provisions, which are quantified on the basis of the best information available on the consequences of the event giving rise to them and are reviewed and adjusted at the end of each year, are used to cater for the specific risks for which they were originally recognised. Provisions are fully or partially reversed when such risks cease to exist or are reduced.
Provisions for pensions and similar obligations
The Group companies with the most representative obligations are Seguros Catalana Occidente, Sociedad Anónima de Seguros y Reaseguros, Bilbao Compañía Anónima de Seguros y Reaseguros, S.A. and Compañía Española de Seguros y Reaseguros de Crédito y Caución, S.A.
These companies have pension obligations covered by defined-contribution and defined-benefit plans, which are in turn covered by externalised policies, pension plans and internal provisions. Also, certain enhancements were made to the collective bargaining agreement for the insurance industry.
A defined-contribution pension plan is a pension plan whereby the Group pays fixed contributions to an independent entity and has no legal or implicit obligation to make further contributions if the fund has insufficient assets to pay all employees the benefits due in relation to their services in current and subsequent periods.
A defined-benefit pension plan is a pension plan where the amount of the pension benefits that employees will receive on retirement is fixed according to various factors, including age, length of service and salary. The Group and, in certain cases, participating employees fund the defined-benefits plan and the Group has a legal or implicit obligation to make further contributions if the fund has insufficient assets to pay all employees the benefits due in relation to their services in current and subsequent periods.

65
The liability recognised in the balance sheet for defined-benefit pension plans is the present value of the defined-benefits obligations at the balance sheet date, less the fair value of plan assets that satisfy certain requirements, and adjustments to take into account unrecognised actuarial gains and loses and past cost of service. Assets arising as a result of overfunding of defined-benefit plans are recognised only in so far as the surplus can be used to generate future profits.
The Group’s actuaries calculate defined-benefit obligations on an annual basis using the “projected calculation unit" method. The present value of defined-benefit obligations is calculated by discounting estimated future cash outflows using the yield on corporate bonds with a high credit rating that are denominated in euros (the currency in which the benefits will be paid) and have a residual term to maturity similar to those of the obligations in question.
The premiums paid on the insurance contracts and the contributions made to pension plans are recognised as expenses in the consolidated income statement in the year in which they are incurred at each group subsidiary.
As of 1 January 2006, and pursuant to the election provided for in the amendments to IAS 19 – Employee Benefits, the Group recognises all actuarial gains and losses on all defined benefit plans and policies written outside profit and loss. These actuarial gains and losses are calculated according to the value of the obligations and the fair value of pension plan assets. To this end, the aforesaid gains and losses are recognised in the statement of recognised income and expense – changes in consolidated equity under the heading "Pension reserves – actuarial gains and losses.
Prior to this date, actuarial gains and losses were recognised through profit and loss.
Other provisions
The provision for third-party liability and expenses basically includes payables for the payments assumed to be made by the Group under the terms of the agreements entered into with insurance companies, and the estimated amounts needed to meet liabilities, whether probable or certain, such as current lawsuits, severance pay, adjustments payable to employees and other obligations.
Under current Spanish labour legislation, the subsidiaries are required to pay termination benefits to employees terminated without just cause. Any such indemnities are recognised as an expense when the decision is made to dismiss an employee. There are no redundancy plans making it necessary to make a provision in this connection.
l) Recognition of income and expenses
The Group recognises income and expenses on an accrual basis, i.e. when the actual flow of the related goods and services occurs, regardless of when the resulting monetary or financial flow arises.
The main principles used by the Group to recognise income and expenses are summarised below.
l.1) Income from premiums written
The Group recognises in income in the year the premiums written during the year less cancellations and return premiums, adjusted for changes in premiums written but not issued, which arise from contracts completed or renewed during the year, in relation to which premiums the insurer’s collection right accrues during such period.
Life premiums and renewable annual Life contracts are recognised in income throughout the life of the contracts, on a pro rata temporis basis. These premiums are accrued via the establishment of provisions for unearned premiums. Life premiums are long-term contracts, whether single or regular premium policies, and are recognised when the insurer’s collection right comes into effect.
The Group’s income through surcharges for part-payment of premiums are recognised as an increase in finance income and accrued over the collection period of the bills generating these surcharges.
Premiums for outward reinsurance are recognised on the basis of reinsurance contracts written and in accordance with the same criteria used for direct insurance.
66
l.2) Interest income and expense and similar items
In general, these items are recognised using the effective interest method, irrespective of the monetary or financial flow deriving from the financial assets. Dividends received from other companies are recognised as income as the consolidated companies’ right to receive them arises.
l.3) Claims paid and changes in provisions
Claims incurred comprise both the claims paid during the year and the changes arising in claims-related provisions and the allocable portion of general expenses to be allocated to the claims function.
l.4) Commissions
Income and expenses corresponding to commissions are recognised in income over the period in which the associated service is provided, except for commissions associated with a specific, individual act, which are recognised at the time they arise.
4. Risk management
Global risk management is a key part of the business of all insurance groups. At Grupo Catalana Occidente the primary objective of global risk management is to provide a reasonable degree of certainty as to the efficiency and effectiveness of the Group’s activities, the accuracy of its financial information, and its compliance with applicable law and regulations.
In line with the development of risk management systems in the financial and insurance sectors, and in particular the introduction of the new Basel II solvency requirements, the Group is developing risk analysis systems underpinned not only by the internal organisational and control system but also, where needed, by external support.
The risks to which the Group is exposed as a consequence of its activities fall into three broad groups: technical risk, i.e. the risks inherent in insurance activities, financial risk and operational risk.
─ Technical risks, or the risks inherent to insurance, include all risks specific to insurance activities. To mitigate this risk, it should be noted, the Group has developed a diversification policy whereby business is split between general insurance lines and life insurance.
More specifically, these risks break down into underwriting risk, the risk of premium inadequacy, and the risk of reserve insufficiency, and arise, for the most part, when policies are written, in claims management (due to errors in calculating claim costs and rates), in changes in the provision for future obligations generated by the cover provided, and in discrepancies in the calculation of management expenses.
Measures taken by the Group to monitor and control these risks include the following:
• Implementation of technical standards appropriate to policy underwriting,
• Product analysis, for the purpose of determining the adequacy of premiums and technical provisions,
• Analysis of policy returns and results, taking the measures needed to prevent high claims rates, and,
• Use of reinsurance cover, as needed to cover deviations from the expected claims rate, adopting a policy that allows for increased retained business, insofar as scale of operations and solvency allow. To this end, for outward reinsurance, only market leading reinsurers, with ratings guaranteeing solvency, financial and management capacity and continuity of business and necessary services, are used.
─ Financial risks are risks of a financial nature, and include market risk, interest rate risk, credit risk, liquidity risk, and the risks associated with asset and liability management (matching).
67
The Group assigns its financial assets to the various portfolios of managed assets according to specific characteristics including required return, risk and liquidity.
To this end, the Asset and Liability Management Department analyses the flows deriving from these financial assets and those expected from or associated with its commitments with insureds, using an ALM tool that enables it to comply with DGSFP regulations in the transactions to which these management techniques are applied. The information reports generated by this Department are regularly analysed by the financial investment committees. In addition, the Group is in the process of improving the models it uses with a view to producing more sophisticated measurements.
Credit risk is also regularly analysed and monitored. Any investments below a given level set by the Group (investment grade) require express approval.
All the above analyses and controls are supervised and monitored by the Risk Department, which takes the actions needed to satisfy the requirements being introduced under Spanish and EU legislation in the field of investment risk management and control.
─ Operational risk includes various types of general and business risk that can be broken down into risks associated with the general business environment (legal risk, regulatory risk, IT risk, strategic risk and reputation risk), IT risk, human resources management risk, sales-related risks, and the risk of fraud, human error and inappropriate valuations.
To mitigate these general business risks, the Group has in-house systems for each area that could potentially be affected and, where required, seeks the assistance of external consultants. With regards to the quality of customer services, the Group has a Customer Support Department and a Customer Ombudsman to receive, process and resolve complaints pursuant to regulations introduced by the Group in line with prevailing legislation.
IT-related risks are mitigated and handled differently. Firstly, the Group performs specific reviews of individual aspects, such as compliance with data protection law and the prevention of unauthorised access. For risks associated with physical loss or damage, it has developed a business continuity plan, that has involved establishing a back-up centre to ensure rapid recovery in the event of IT system disaster or serious malfunction. Simulation exercises are performed each year and have revealed system recovery times to be adequate.
In respect of human resources risks, the Group complies with legislation on the prevention of workplace risks. In addition, it is taking specific action to ensure the suitability of workstations to each individual employee, and workplace health in general, in particular by monitoring employees’ health on an ongoing basis.
Sales-related risks arise mainly as a consequence of the commercial practices and sales systems used by the Group. These are controlled by the Commercial Division, the Control Department and Internal Audit. Customer satisfaction is also monitored by the Commercial Division.
Lastly, the risks of fraud, human error and inaccurate valuations are monitored on a decentralised basis by the management of each department affected using appropriate control systems.
The risk assessment, measurement and monitoring tools and techniques used by the Group are considered adequate and conform to risk management standards and best practice in the insurance sector. Thus, in 2006, there were no significant risk incidents of any of the above types, with all risk control systems functioning effectively.
68
5. Acquisitions, mergers and sales of interests in subsidiaries and associates
Compañía Española de Crédito y Caución
At an extraordinary universal meeting held on 16 February 2006, shareholders of Compañía Española de Crédito y Caución agreed the assignment of 49,578 shares held as treasury stock to existing shareholders in proportion to their respective holdings. They also voted to increase the company's capital by EUR 6,519 thousand via the issue of shares with an issue premium of EUR 211.96 per share. With the former shareholders having waived their preferential subscription rights, Grupo Catalana Occidente became the majority shareholder of Crédito y Caución with a interest in its capital of 43.18% at 31 December 2006. Consorcio de Compensación de Seguros is the second largest shareholder with an ownership interest of 41.18%.
The total paid to acquire the aforesaid shares was 127,153 thousand and the effect on the consolidated financial statements closed at 31 December 2006 was a global reduction in the reserves of consolidated companies of EUR 14,918 thousand, and in increase in minority increases of EUR 119,565 thousand.
Atradius NV
At 31 December 2005, Seguros Catalana Occidente, S.A. de Seguros y Reaseguros and Compañía Española de Seguros y Reaseguros de Crédito y Caución, S.A. owned 12.96% and 12.02%, respectively, of Atradius NV.
The agreements signed in December 2005 by virtue of which the above two companies acquired additional interests in Atradius NV of 15.30% and 9.72% respectively took effect in the course of 2006 such that at the year-end, the Group owned 50% of Atradius NV. The unit price paid in these acquisitions was EUR 17.33 per share, equating to a total outlay of EUR 245,440 thousand, from which a total of EUR 3,200 corresponding to the distribution of the share issue premium agreed at the General Meeting of Atradius shareholders held on 16 May 2006 has been deducted. See Note 6, point d).
In addition, on 16 February 2006 Group companies Seguros Catalana Occidente and Crédito y Caución, executed an agreement whereby the former sells to the latter its entire interest in Atradius NV, also at the price of EUR 17.33 per share. This acquisition, which may take place in one or more phases, remained pending execution at 31 December 2006, since it is conditional upon the grant of the relevant administrative approvals, the approval of shareholders at the General Meeting of Atradius NV, and the conclusion of the corresponding share sale agreement.
Lepanto S.A. Compañía de Seguros y Reaseguros
In 2006, as a result of the resolutions adopted by the sole shareholders of Seguros Catalana Occidente and Lepanto, Sociedad Anónima, Compañía de Seguros y Reaseguros (hereinafter Lepanto) in exercise of the powers vested in the corresponding Extraordinary General Meetings held on 29 June 2006, the two companies were merged via the absorption of Lepanto, through the block transfer of its assets to Seguros Catalana Occidente. The merger was taken to public deed on 29 December 2006 and has been recorded in the Mercantile Register.
Following the above events, the absorbed campy (Lepanto) was wound up without liquidation. The activities of the absorbed company were deemed to have been preformed by the absorbing company (Seguros Catalana Occidente) as of 1 January 2006, which therefore represents, for accounts purpose, the effective date of the merger. Since the share capital of the absorbed company belonged to Seguros Catalana Occidente, the merger was concluded pursuant to Article 250 of the Revised Text of Spanish Companies Law.
The rationale of the merger, which formed part of a wider Group restructure, was to streamline the corporate structure — an objective necessitating the concentration of subsidiaries into a single legal entity — and rein in costs, whilst at the same time strengthening equity and harnessing restructuring synergies.
The merger described above conformed to the principles established in the Corporate Restructuring Plan approved by the Parent’s Board of Directors on 26 April 2001 and was ratified by the Board on 27 October 2005.

69
Other subsidiaries and associates
The Group's ownership interests in associates quoted on official securities markets changed in the course of 2006.
The Parent and its subsidiaries served the notices required under Article 86 of the consolidated Spanish Corporations Law in relation to their investees directly or indirectly owned more than 10%, and also those stipulated in Article 53 of Securities Market Law 24/1988.
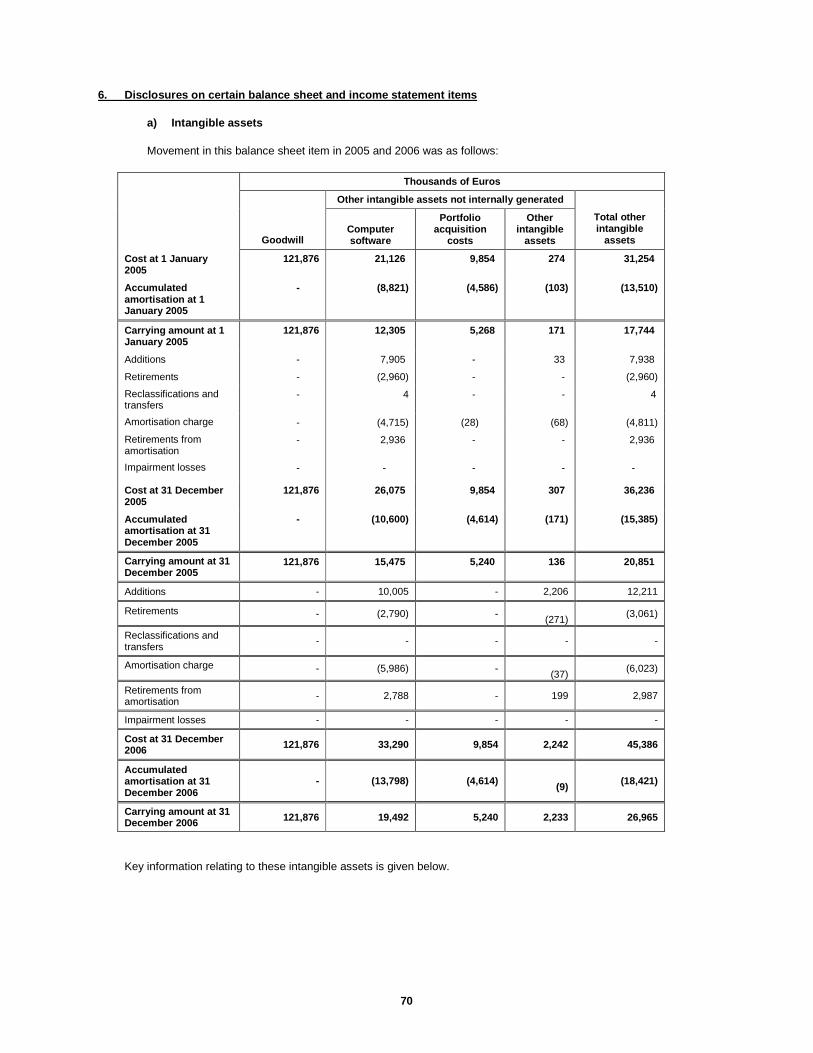
70
6. Disclosures on certain balance sheet and income statement items
a) Intangible assets
Movement in this balance sheet item in 2005 and 2006 was as follows:
Thousands of Euros
Other intangible assets not internally generated
Goodwill Computer software
Portfolio acquisition
costs
Other intangible
assets
Total other intangible
assets
Cost at 1 January 2005
121,876 21,126 9,854 274 31,254
Accumulated amortisation at 1 January 2005
- (8,821) (4,586) (103) (13,510)
Carrying amount at 1 January 2005
121,876 12,305 5,268 171 17,744
Additions - 7,905 - 33 7,938
Retirements - (2,960) - - (2,960)
Reclassifications and transfers
- 4 - - 4
Amortisation charge - (4,715) (28) (68) (4,811)
Retirements from amortisation
- 2,936 - - 2,936
Impairment losses - - - - -
Cost at 31 December 2005
121,876 26,075 9,854 307 36,236
Accumulated amortisation at 31 December 2005
- (10,600) (4,614) (171) (15,385)
Carrying amount at 31 December 2005
121,876 15,475 5,240 136 20,851
Additions - 10,005 - 2,206 12,211
Retirements - (2,790) - (271)
(3,061)
Reclassifications and transfers
- - - - -
Amortisation charge - (5,986) - (37)
(6,023)
Retirements from amortisation
- 2,788 - 199 2,987
Impairment losses - - - - -
Cost at 31 December 2006 121,876 33,290 9,854 2,242 45,386
Accumulated amortisation at 31 December 2006
- (13,798) (4,614) (9) (18,421)
Carrying amount at 31 December 2006 121,876 19,492 5,240 2,233 26,965
Key information relating to these intangible assets is given below.
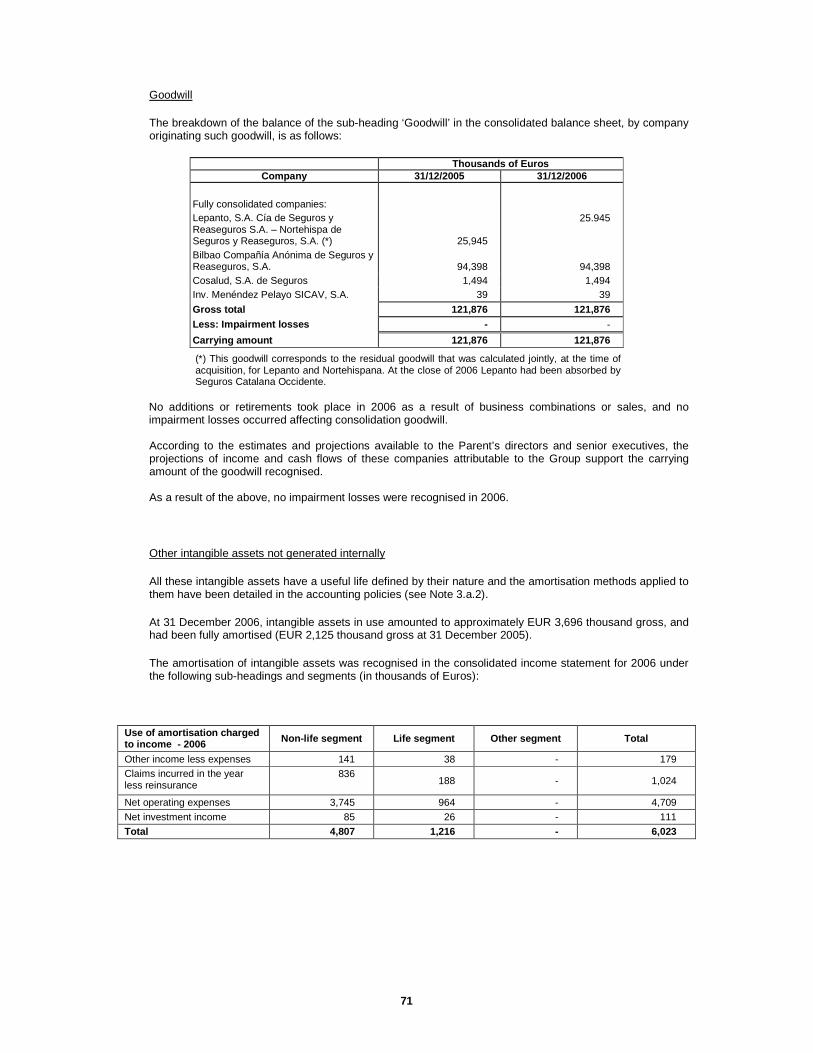
71
Goodwill
The breakdown of the balance of the sub-heading ‘Goodwill’ in the consolidated balance sheet, by company originating such goodwill, is as follows:
Thousands of Euros Company 31/12/2005 31/12/2006
Fully consolidated companies: Lepanto, S.A. Cía de Seguros y Reaseguros S.A. – Nortehispa de Seguros y Reaseguros, S.A. (*) 25,945
25.945
Bilbao Compañía Anónima de Seguros y Reaseguros, S.A. 94,398 94,398 Cosalud, S.A. de Seguros 1,494 1,494 Inv. Menéndez Pelayo SICAV, S.A. 39 39
Gross total 121,876 121,876 Less: Impairment losses - -
Carrying amount 121,876 121,876
(*) This goodwill corresponds to the residual goodwill that was calculated jointly, at the time of acquisition, for Lepanto and Nortehispana. At the close of 2006 Lepanto had been absorbed by Seguros Catalana Occidente.
No additions or retirements took place in 2006 as a result of business combinations or sales, and no impairment losses occurred affecting consolidation goodwill. According to the estimates and projections available to the Parent’s directors and senior executives, the projections of income and cash flows of these companies attributable to the Group support the carrying amount of the goodwill recognised. As a result of the above, no impairment losses were recognised in 2006.
Other intangible assets not generated internally
All these intangible assets have a useful life defined by their nature and the amortisation methods applied to them have been detailed in the accounting policies (see Note 3.a.2).
At 31 December 2006, intangible assets in use amounted to approximately EUR 3,696 thousand gross, and had been fully amortised (EUR 2,125 thousand gross at 31 December 2005).
The amortisation of intangible assets was recognised in the consolidated income statement for 2006 under the following sub-headings and segments (in thousands of Euros):
Use of amortisation charged to income - 2006 Non-life segment Life segment Other segment Total
Other income less expenses 141 38 - 179 Claims incurred in the year less reinsurance
836
188 - 1,024
Net operating expenses 3,745 964 - 4,709 Net investment income 85 26 - 111
Total 4,807 1,216 - 6,023
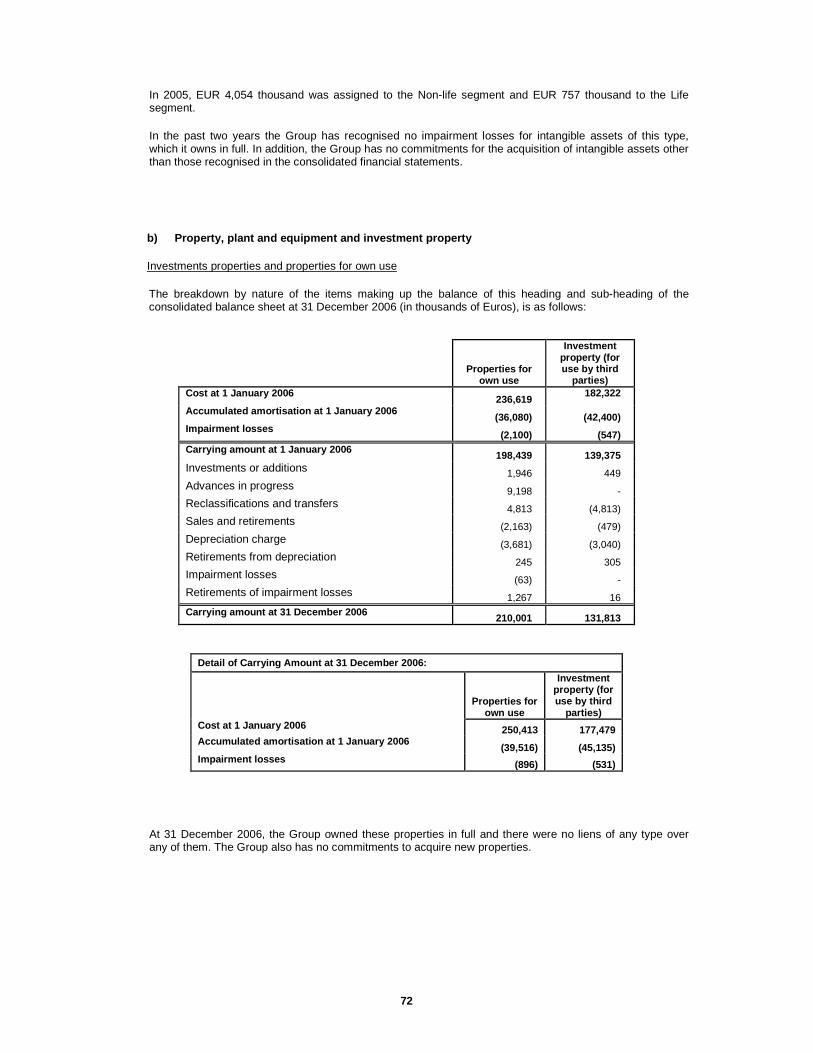
72
In 2005, EUR 4,054 thousand was assigned to the Non-life segment and EUR 757 thousand to the Life segment.
In the past two years the Group has recognised no impairment losses for intangible assets of this type, which it owns in full. In addition, the Group has no commitments for the acquisition of intangible assets other than those recognised in the consolidated financial statements.
b) Property, plant and equipment and investment proper ty
Investments properties and properties for own use
The breakdown by nature of the items making up the balance of this heading and sub-heading of the consolidated balance sheet at 31 December 2006 (in thousands of Euros), is as follows:
Properties for own use
Investment property (for use by third
parties) Cost at 1 January 2006
236,619 182,322
Accumulated amortisation at 1 January 2006 (36,080) (42,400)
Impairment losses (2,100) (547)
Carrying amount at 1 January 2006 198,439 139,375
Investments or additions 1,946 449 Advances in progress 9,198 - Reclassifications and transfers 4,813 (4,813) Sales and retirements (2,163) (479) Depreciation charge (3,681) (3,040) Retirements from depreciation 245 305 Impairment losses (63) - Retirements of impairment losses 1,267 16 Carrying amount at 31 December 2006
210,001 131,813
Detail of Carrying Amount at 31 December 2006:
Properties for own use
Investment property (for use by third
parties) Cost at 1 January 2006 250,413 177,479 Accumulated amortisation at 1 January 2006
(39,516) (45,135) Impairment losses (896) (531)
At 31 December 2006, the Group owned these properties in full and there were no liens of any type over any of them. The Group also has no commitments to acquire new properties.

73
Movement in and the detail of this heading in 2005 were as follows (in thousands of Euros):
Properties for
own use
Investment property (for use by third parties)
Cost at 1 January 2005 230,364 174,800
Accumulated amortisation at 1 January 2005 (32,715) (39,345)
Impairment losses (1,307) (478)
Carrying amount at 1 January 2005 196,342 134,977
Investments or additions 619 12,306
Advances in progress 3,252 -
Reclassifications and transfers 4,244 (4,244)
Sales and retirements (1,860) (539)
Depreciation charge (3,365) (3,209)
Retirements from depreciation - 153
Impairment losses (793) (115)
Retirements of impairment losses - 46
Carrying amount at 31 December 2005 198,439 139,375
Detail of Carrying Amount at 31 December 2005:
Properties for
own use
Investment property (for use by third parties)
Cost at 1 January 2005 236,619 182,322
Accumulated amortisation at 1 January 2005 (36,080) (42,400)
Impairment losses (2,100) (547)
No reclassifications or transfers between properties classified as investment properties and properties for own use, or vice versa, were made in 2006, except for an amount of EUR 4,813 thousand corresponding to properties previously used by third parties that are now used by the Group. Properties for own use located abroad amounted to EUR 2,225 thousand at 31 December 2006 (EUR 2,452 thousand at 31 December 2005). Also, at that date there were properties under construction involving recognised expenditure at 31 December 2006 amounting to EUR 14,640 thousand. These properties are classified together with the rest of properties for own use at the various reporting dates. In 2006 rental income from investment properties owned by the consolidated companies amounted to EUR 19,808 thousand (EUR 16,297 thousand in 2005) while all operating expenses related thereto amounted to EUR 7,372 thousand (EUR 4,563 thousand approximately at the close of the previous year), repair and maintenance costs included. Additionally, the Group incurred a cost of EUR 3,433 thousand in 2006 (EUR 1,978 thousand in 2005). in connection with direct operating expenses related to investment properties that did not yield any rental income in either year.

74
Such income and expenses were recognised at their carrying amount under the sub-heading ‘Net Investment Income’ in the consolidated income statement under the following lines:
Net investment income -2006
Non-life segment
Life segment
Other activities segment
Total
Rental income 6,627 12,595 585 19,807 Leased investment property expenses (1,370) (5,687) (317) (7,374) o/w depreciation charges (517) (2,244) (32) (2,793) o/w changes in impairment losses 16 - - 16
Non-leased investment property expenses (1,040) (888) (385) (2,313) o/w depreciation charges (1,133) (84) (353) (1,570) o/w changes in impairment losses 1,204 - - 1,204
Net total 4,217 6,020 (117) 10,120 In 2005, net income from investments in property came to EUR 1,822 thousand for the Non-life segment, EUR 7,804 thousand for the Life segment and EUR 130 thousand for Other activities. In 2006, the Group obtained capital gains of EUR 2,280 thousand on the sale of properties for own use and EUR 574 thousand on the sale of properties used by third parties, and capital losses of EUR 2 thousand. These amounts are recognised in the income statement under the heading "Net investment income”.
In 1996, pursuant to the provisions of Royal Decree-Law 7/1996, of 7 June, and Provincial Law 6/1996, of 21 November, the consolidated companies Grupo Catalana Occidente, S.A., Seguros Catalana Occidente, S.A., Bilbao Compañía Anónima de Seguros y Reaseguros, S.A. and Compañía Española de Seguros y Reaseguros de Crédito y Caución, S.A. revalued the cost of their land and properties by a total of EUR 53,445 thousand, of which EUR 41,025 thousand relate to the first company, EUR 2,677 thousand to the second, EUR 4,019 thousand to the third, and EUR 5,724 thousand to the fourth.
The market value at 31 December 2006 of the properties used by the Group and of its investment properties is as follows (in thousands of Euros):
Market Value at 31/12/2006
Non-life segment
Life segment
Other activities segment Total
Properties for own use 230,717 81,514 18,899 331,130 Investment properties for use by third parties 155,859 282,812 4,003 442,674
Total 386,576 364,326 22,902 773,804
At the close of 2005, the market values of the properties assigned to the Non-life, Life and Other Activities segments were EUR 329,111 thousand, EUR 295,686 thousand and EUR 23,489 thousand respectively.
At 31 December 2006, the external valuations provided by independent appraisers had been performed a maximum of three years earlier and updated as of the balance sheet close on the basis of property market developments.
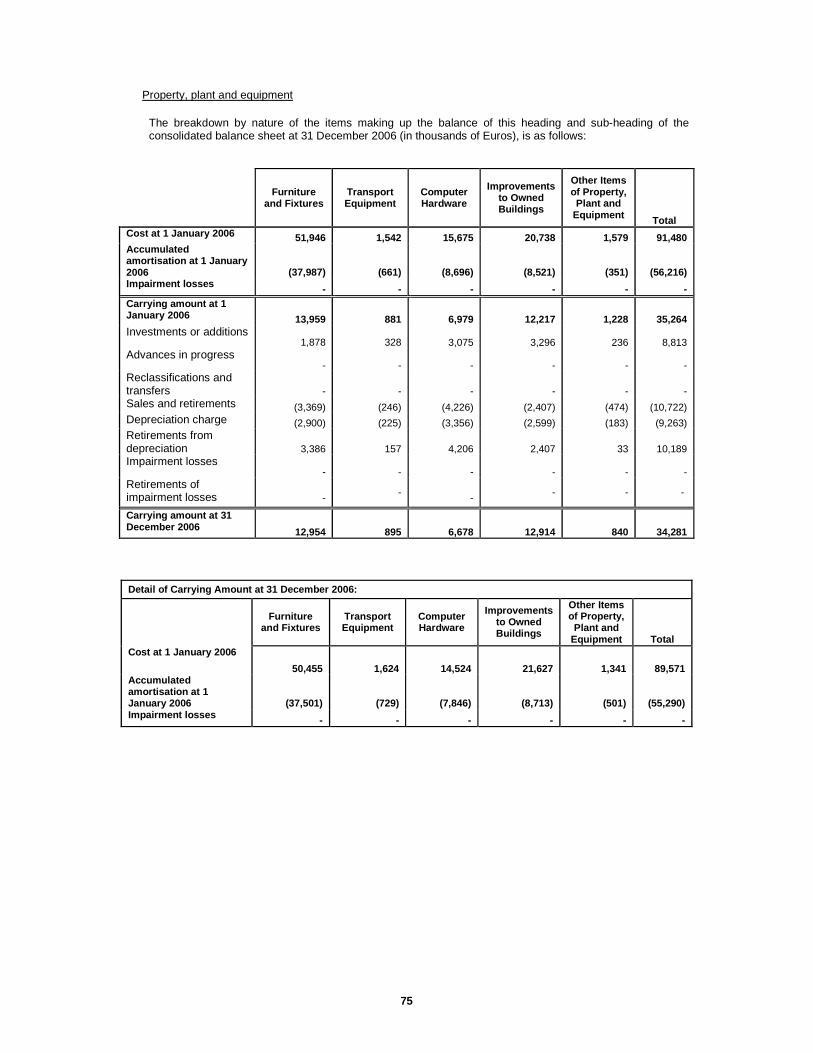
75
Property, plant and equipment
The breakdown by nature of the items making up the balance of this heading and sub-heading of the consolidated balance sheet at 31 December 2006 (in thousands of Euros), is as follows:
Furniture and Fixtures
Transport Equipment
Computer Hardware
Improvements to Owned Buildings
Other Items of Property, Plant and
Equipment Total Cost at 1 January 2006 51,946 1,542 15,675 20,738 1,579 91,480 Accumulated amortisation at 1 January 2006 (37,987) (661) (8,696) (8,521) (351) (56,216) Impairment losses - - - - - - Carrying amount at 1 January 2006 13,959 881 6,979 12,217 1,228 35,264 Investments or additions
1,878
328 3,075 3,296 236 8,813 Advances in progress
- -
- - - - Reclassifications and transfers
- -
- - - -
Sales and retirements (3,369) (246) (4,226) (2,407) (474) (10,722) Depreciation charge (2,900) (225) (3,356) (2,599) (183) (9,263) Retirements from depreciation
3,386
157 4,206 2,407 33 10,189
Impairment losses - -
- - - -
Retirements of impairment losses
- -
- - - -
Carrying amount at 31 December 2006 12,954 895 6,678 12,914 840 34,281
Detail of Carrying Amount at 31 December 2006:
Furniture
and Fixtures Transport Equipment
Computer Hardware
Improvements to Owned Buildings
Other Items of Property,
Plant and Equipment Total
Cost at 1 January 2006
50,455 1,624 14,524 21,627 1,341 89,571 Accumulated amortisation at 1 January 2006 (37,501) (729) (7,846) (8,713) (501) ( 55,290) Impairment losses - - - - - -

76
Movement in and the detail of this heading in 2005 were as follows (in thousand of Euros):
Furniture and
Fixtures Transport Equipment
Computer Hardware
Improvements to Owned Buildings
Other Items of Property,
Plant and Equipment
Total
Cost at 1 January 2005 51,894 1,738 15,241 18,150 1,277 88,300
Accumulated amortisation at 1 January 2005
(36,603) (787) (7,891) (7,066) (318) (52,665)
Impairment losses - - - - - -
Carrying amount at 1 January 2005 15,291 951 7,350 11,084 959 35,635
Investments or additions
3,349 271 3,207 1,899 485 9,211
Advances in progress - - - - - -
Reclassifications and transfers
(1,602) - (4) 1,602 (183) (187)
Sales and retirements (1,695) (467) (2,769) (913) - (5,844)
Depreciation charge (2,285) (231) (2,287) (2,168) (33) (7,004)
Retirements from depreciation
901 357 1,482 713 - 3,453
Impairment losses - - - - - -
Retirements of impairment losses
- - - - - -
Carrying amount at 31 December 2005
13,959 881 6,979 12,217 1,228 35,264
Detail of Carrying Amount at 31 December 2005:
Furniture and
Fixtures Transport Equipment
Computer Hardware
Improvements to Owned Buildings
Other Items of Property,
Plant and Equipment
Total
Cost at 1 January 2006 51,946 1,542 15,675 20,738 1 ,579 91,480
Accumulated amortisation at 1 January 2006
(37,987) (661) (8,696) (8,521) (351) (56,216)
Impairment losses - - - - - -
At 31 December 2006, there were other items of property, plant and equipment amounting to approximately EUR 29,114 thousand gross, which had been fully depreciated, (EUR 26,548 thousand at 31 December 2005).
In 2006, no impairment losses in respect of these assets, which the Group owns in full, were recognised in the income statement. The Group also has no commitments to acquire new property, plant and equipment other than those recognised in the consolidated financial statements.

77
c) Financial assets
The detail at 31 December 2006, of financial assets, excluding equity-accounted financial assets and deposits for inward reinsurance, is as follows (in thousands of Euros):
Financial assets classified by type of portfolio and nature Available-for-
Sale
At Fair Value Through Profit or
Loss Loans and
Receivables Total at
31/12/2006 Equity securities 560,588 - - 560,588
Fixed-income securities 2,634,628 84,862 - 2,719,490
Other financial assets with published price quotations
379,861 83,135 - 462,996
Mortgage loans 7,393 - 20,575 27,968
Non-mortgage loans and loan advances 3,822 30,448 15,201 49,471
Other financial assets without published price quotations
7,560 - 5,824 13,384
Gross total 3,593,852 198,445 41,600 3,833,897
Impairment loss - - - -
Net total 3,593,852 198,445 41,600 3,833,897
The same information at 31 December 2005 is as follows (in thousands of Euro):
Financial assets classified by type of portfolio and nature Available-for-
Sale
At Fair Value Through Profit or
Loss Loans and
Receivables Total at
31/12/2006
Equity securities 422,940 - - 422,940
Fixed-income securities 2,693,953 89,064 - 2,783,017
Other financial assets with published price quotations
337,102 72,199 - 409,301
Mortgage loans 8,125 - 20,388 28,513
Non-mortgage loans and loan advances - 37,700 14,752 52,452
Other financial assets without published price quotations
- - 9,882 9,882
Gross total 3,462,120 198,963 45,022 3,706,105
Impairment loss - - - -
Net total 3,462,120 198,963 45,022 3,706,105
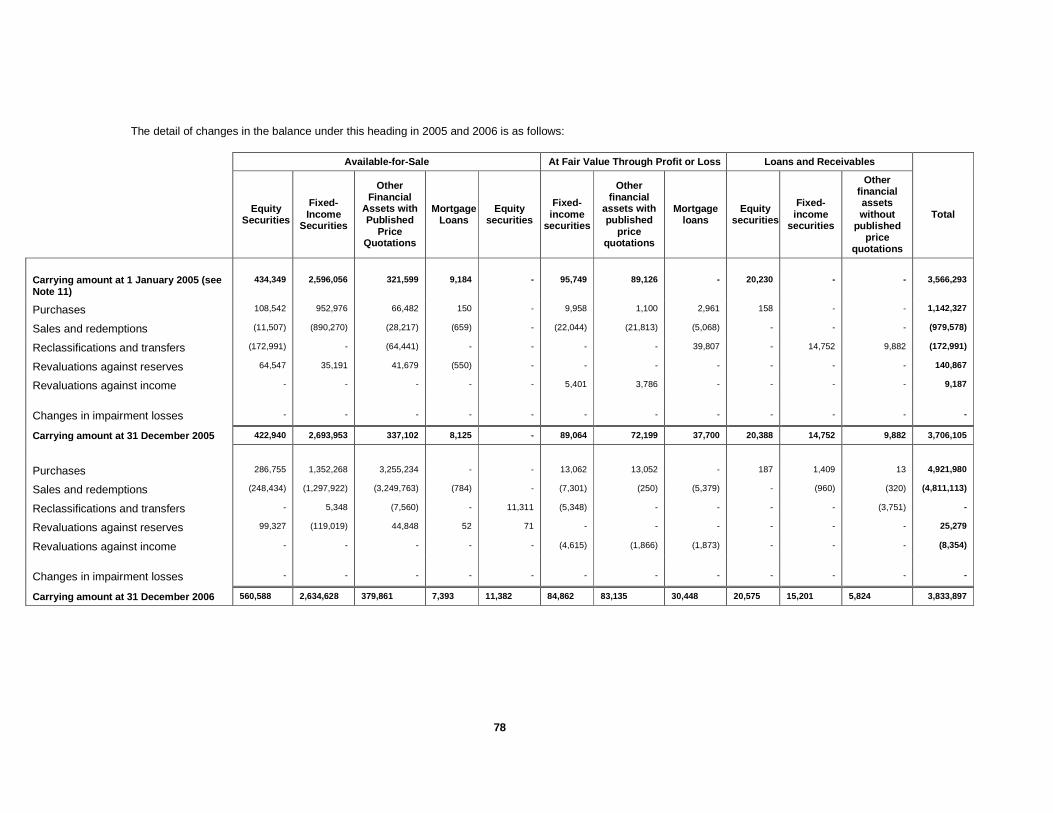
78
The detail of changes in the balance under this heading in 2005 and 2006 is as follows:
Available-for-Sale At Fair Value Through Profit or Loss Loans and Receivables
Equity
Securities
Fixed-Income
Securities
Other Financial
Assets with Published
Price Quotations
Mortgage Loans
Equity securities
Fixed-income
securities
Other financial
assets with published
price quotations
Mortgage loans
Equity securities
Fixed-income
securities
Other financial assets without
published price
quotations
Total
Carrying amount at 1 January 2005 (see Note 11)
434,349 2,596,056 321,599 9,184 - 95,749 89,126 - 20,230 - - 3,566,293
Purchases 108,542 952,976 66,482 150 - 9,958 1,100 2,961 158 - - 1,142,327
Sales and redemptions (11,507) (890,270) (28,217) (659) - (22,044) (21,813) (5,068) - - - (979,578)
Reclassifications and transfers (172,991) - (64,441) - - - - 39,807 - 14,752 9,882 (172,991)
Revaluations against reserves 64,547 35,191 41,679 (550) - - - - - - - 140,867
Revaluations against income - - - - - 5,401 3,786 - - - - 9,187
Changes in impairment losses - - - - - - - - - - - -
Carrying amount at 31 December 2005 422,940 2,693,953 337,102 8,125 - 89,064 72,199 37,700 20,388 14,752 9,882 3,706,105
Purchases 286,755 1,352,268 3,255,234 - - 13,062 13,052 - 187 1,409 13 4,921,980
Sales and redemptions (248,434) (1,297,922) (3,249,763) (784) - (7,301) (250) (5,379) - (960) (320) (4,811,113)
Reclassifications and transfers - 5,348 (7,560) - 11,311 (5,348) - - - - (3,751) -
Revaluations against reserves 99,327 (119,019) 44,848 52 71 - - - - - - 25,279
Revaluations against income - - - - - (4,615) (1,866) (1,873) - - - (8,354)
Changes in impairment losses - - - - - - - - - - - -
Carrying amount at 31 December 2006 560,588 2,634,628 379,861 7,393 11,382 84,862 83,135 30,448 20,575 15,201 5,824 3,833,897

79
Most of the revaluations recognised with a credit to reserves and to the income statement, net of the related tax effect and of the allocation to minority interests, arose from financial instruments quoted on organised markets or, if not quoted, for which a sufficiently reliable market valuation is available to the Group.
In 2006 the Group derecognised from equity EUR 30,397 thousand and EUR 7,500 thousand relating to unrealised gains and losses in the ‘Available-for-Sale’ portfolio. These amounts were recognised in the consolidated income statement for the period following their realisation. In 2005, the equivalent amounts recognised were EUR 15,252 thousand and EUR 8,772 thousand respectively.
Derecognitions from the “At fair value through profit and loss" portfolio correspond essentially to maturities of financed premiums, which are included under the heading "non-mortgage loans", and accruals of the implied yield on fixed-income securities.
Equity securities
The breakdown of the balances of this sub-heading at 31 December 2006 and 2005, is as follows:
Thousands of Euros Available-for-Sale 31/12/2005 31/12/2006
Shares of listed Spanish companies 281,219 386,756 Shares of unlisted Spanish companies 25,186 29,561 Shares of listed foreign companies 116,535 144,271 Total 422,940 560,588
The fair value of shares in unlisted Spanish companies is determined using valuation methods generally accepted in the financial sector.
Dividends accruing to the Group in 2006 amounted to EUR 17,853 thousand (EUR 10,143 thousand in 2005). In 2006, the Group also obtained income from the recovery of tax withheld at source in the amount of EUR 101 thousand.
Fixed-income securities
The breakdown of the balances included under this sub-heading is as follows:
Thousands of Euros 31/12/2005 31/12/2006
Available-for-Sale
At Fair Value through Profit
or Loss Available-for-
Sale
At Fair Value through Profit
or Loss Spanish government debt securities, debentures and bonds 884,680 20,541 732,944 25,936 Foreign debt securities 65,402 10,105 395,915 10,489 Securities issued by financial institutions and other private entities
1,673,140 58,418 1,483,999 48,437 Other fixed-income securities 70,731 - 21,770 -
Total 2,693,953 89,064 2,634,628 84,862
80
The average internal rate of return on the portfolio at 31 December 2006, is 5.17%, with an estimated average term of approximately five years (compared with 5.87% and six years at 31 December 2005).
Income accrued on these fixed-income securities, which is separate to their fair value and basically consists of interests and net accruals of positive and negative premiums, is recognised in the incomes statement under "Net investment income” and in 2006 amounted to EUR 105,561 thousand.
The maturities of the securities included in this sub-heading, classified by portfolio at 31 December 2005, and taking into account their fair value, are as follows:

81
Thousands of Euros
31/12/2005 31/12/2006
Year of Maturity
Available-for-Sale
At Fair Value through Profit
or Loss Total Available-for-Sale
At Fair Value through
Profit or Loss Total
2006 271,235 8,770 280,005 - - - 2007 161,878 1,864 163,742 194,505 1,816 196,321 2008 151,878 4,519 156,397 178,599 4,035 182,634 2009 366,920 4,394 371,314 403,096 3,958 407,054 2010 199,493 16,747 216,240 197,743 15,556 213,299 2011 116,167 11,205 127,372 139,847 15,660 155,507 2012 141,430 6,266 147,696 137,062 7,793 144,855 2013 202,447 9,636 212,083 195,959 8,703 204,662 2014 105,382 - 105,382 105,468 567 106,035 2015 156,783 2,351 159,134 134,878 2,250 137,128 2016 42,462 - 42,462 99,451 278 99,729 2017 86,568 - 86,568 99,459 270 99,729 2018 51,004 - 51,004 93,944 1,584 95,528 2019 45,351 - 45,351 46,810 428 47,238 2020 67,447 - 67,447 69,945 - 69,945 2021 11,396 - 11,396 31,148 - 31,148 2022 14,718 - 14,718 13,593 - 13,593 2023 35,471 - 35,471 57,282 - 57,282 2024 2,000 - 2,000 - - - 2025 24,554 - 24,554 19,004 - 19,004 2026 4,530 - 4,530 4,350 - 4,350 2027 5,589 - 5,589 5,458 - 5,458 2028 70,917 - 70,917 70,519 - 70,519 2029 207,471 - 207,471 192,163 - 192,163 2030 1,026 - 1,026 - - - 2031 - - - - - - 2032 14,229 - 14,229 13,119 - 13,119 2033 3,707 - 3,707 3,691 - 3,691 2034 - - - - - - 2035 17,598 - 17,598 14,411 - 14,411 2036 - - - - - - 2037 - - - - - - 2038 - - - - - - 2039 55,080 - 55,080 57,685 - 57,685 2040 - - - - - - 2041 - 511 511 - 484 484 2042 31,554 9,087 40,641 27,732 8,559 36,291 2043 17,049 13,714 30,763 17,199 12,921 30,120 2044 - - - - - - 2045 9,030 - 9,030 10,508 - 10,508
2046 1,589 - 1,589 - - -
Total 2,693,953 89,064 2,783,017 2,634,628 84,862 2 ,719,490

82
Other financial assets with published price quotations
The detail by type of the investments classified under this sub-heading is as follows:
Thousands of Euros 31/12/2005 31/12/2006
Available-for-Sale
At Fair Value through Profit
or Loss Available-for-
Sale
At Fair Value through
Profit or Loss Shares in Spanish money-market mutual funds 5,393 -
10,605
-
Shares in Spanish securities mutual funds Shares in Spanish securities mutual funds 192,259 -
238,199
-
Shares in foreign securities mutual funds 37,093 -
25,000
-
Shares in real estate investment trusts 18,961 -
20,189
-
Long-term deposits 73,206 72,199 85,756 83,135 Other financial assets with published price quotations 10,190 -
112
-
Total 337,102 72,199 379,861 83,135
The foregoing long-term deposits basically relate to euro deposits, trust deposits and structured deposits held with credit institutions. The counterparties for these deposits are the following institutions:
Thousands of Euros Thousands of Euros
31/12/2005 31/12/2006
Available-for-Sale
Available-for-Sale
Available-for-Sale
Available-for-Sale
Landesbank Baden Württemberg 5,889 - 6,024 -
Santander London 24,971 - 25,096 -
UBS 10,286 - 11,598 -
La Caixa 421 - 423 -
BBVA 2,452 1,636 6,200 3,321
BSCH London 23,305 - 23,086 -
Societé Paris 5,882 - - -
JP Morgan - 70,563 - 79,814
Atlanteo - - - -
Nord Landesbank - - - -
Landesbank Sachsen - - - -
Brazilan State - - 6,770 -
Other deposits - - 6,559 -
Total long-term deposits 73,206 72,199 85,756 83,13 5
The maturity of these deposits is as follows:

83
Thousands of Euros
31/12/2005 31/12/2006
Year of maturity
Available-for-Sale
At Fair Value
through Profit or
Loss
Total
Available-for-Sale
At Fair Value
through Profit or
Loss
Total
2007 1,125 - 1,125 11,851 - 11,851
2008 2,452 - 2,452 8,400 - 8,400
2009 - - - 423 - 423
2010 - - - 1,000 - 1,000
2011 5,882 - 5,882 - - -
2015 - 2,690 2,690 - 2,448 2,448
2016 - - - - 1,900 1,900
2027 21,252 - 21,252 21,280 - 21,280
2028 36,606 - 36,606 36,778 - 36,778
2033 5,889 - 5,889 6,024 - 6,024
2040 - 352 352 - 322 322
2041 - 199 199 - 193 193
2042 - 53,140 53,140 - 61,227 61,227
2043 - 12,532 12,532 - 13,716 13,716
2044 - 3,286 3,286 - 3,329 3,329
Total 73,206 72,199 145,405 85,756 83,135 168,891
The net assets of the mutual funds managed by Seguros Bilbao Fondos, S.A., S.G.I.I.C., and the interest held by Bilbao Compañía Anónima de Seguros y Reaseguros, S.A. in each fund at 31 December 2006 and 2005 5 (a portion of which relates to investments held for the benefit of policyholders (see Notes 2.e.1 and 6.e)), are as follows:
2005 2006
Bilbao Compañía Anónima de Seguros y Reaseguros, S.A.
Bilbao Compañía Anónima de Seguros y Reaseguros, S.A.
Assets Managed by Seguros Bilbao
Fondos, S.A., S.G.I.I.C. at 31/12/2005
(Thousands of Euros)
Percentage of Ownership (%)
Equity (Thousands
of Euros)
Assets Managed by Seguros Bilbao Fondos, S.A., S.G.I.I.C. at 31/12/2006
(Thousands of Euros)
Percentage of Ownership (%)
Equity (Thousands
of Euros)
Fonbilbao Mixto, FI 3,669 67.88% 2,491 5,839 60.31% 3,522 Fonbilbao Acciones, FI 137,084 92.34% 126,583 179,778 93.64% 168,344 Fonbilbao Eurobolsa, FI 51,011 91.79% 46,823 62,447 91.73% 57,283 Fonbilbao Fondtesoro, FI (*) 20,318 60.78% 12,349 - - - Fonbilbao Renta Fija, FI (**) 3,864 96.94% 3,746 19,698 75.60% 14,892 Fonbilbao Global 30, FI 4,482 98.45% 4,413 4,989 95.57% 4,768 Fonbilbao Global 50, FI 13,059 96.84% 12,646 13,928 97.11% 13,525 Fonbilbao Internacional FI 34,377 92.44% 31,778 35,701 92.52% 33,031
Fonbilbao Dinero, FI (***) 10,041 73.28% 7,358 11,164 74.02% 8,264
Total 277,905 89.31% 248,187 333,544 91.03% 303,628 (*) Absorbed by Fonbilbao Renta Fija, FI on 28 November 2006
(**) Formerly Fonbilbao Global 10, FI
(***) Formerly Fonbilbao, FI

84
Loans and receivables
The detail of the balances making up this sub-heading at 31 December 2006 is as follows:
Thousands of Euros 31/12/2006
Available-for-Sale
At Fair Value through Profit
or Loss Loans and
Receivables Mortgage loans 7,393 - 20,575 Non-mortgage loans and loan advances:
• Loans to policyholders – financed premiums - 30,448 -
• Loan advances - - 13,533
• Loans to agencies - - 1,668
• Other non-mortgage loans 3,822 - - Other financial assets without published price quotations 7,560 - 5,824
Total 18,775 30,448 41,600
The detail at the end of the previous year was as follows:
Thousands of Euros 31/12/2005
Available-for-Sale
At Fair Value through Profit
or Loss Loans and
Receivables Mortgage loans 8,125 - 20,388
Non-mortgage loans and loan advances:
• Loans to policyholders – financed premiums - 37,700
• Loan advances - - 13,308
• Loans to agencies - - 338
• Other non-mortgage loans - - 1,106
Other financial assets without published price quotations - - 9,882
Total 8,125 37,700 45,022
The mortgage loans allocated to the ‘Available-for-Sale’ portfolio relate basically to an emphyteutic annuity bearing floating interest and maturing in 2014, which is measured using the discounted cash flows method.
The financed premiums allocated to the ‘At Fair Value through Profit or Loss’ portfolio relate to the premiums in the Group-Life business that the Group financed to third-party policyholders as part of the externalisation of pension obligations that took place in 2002. Most of these loans mature in 2011, and bear interest at 5.35% on average.
The short-term deposits and the investments in treasury bills and repurchase agreements are shown in the consolidated balance sheet under the heading ‘Cash and Cash Equivalents’.
The maturities of the mortgage loans held by the Group at amortised cost are as follows:
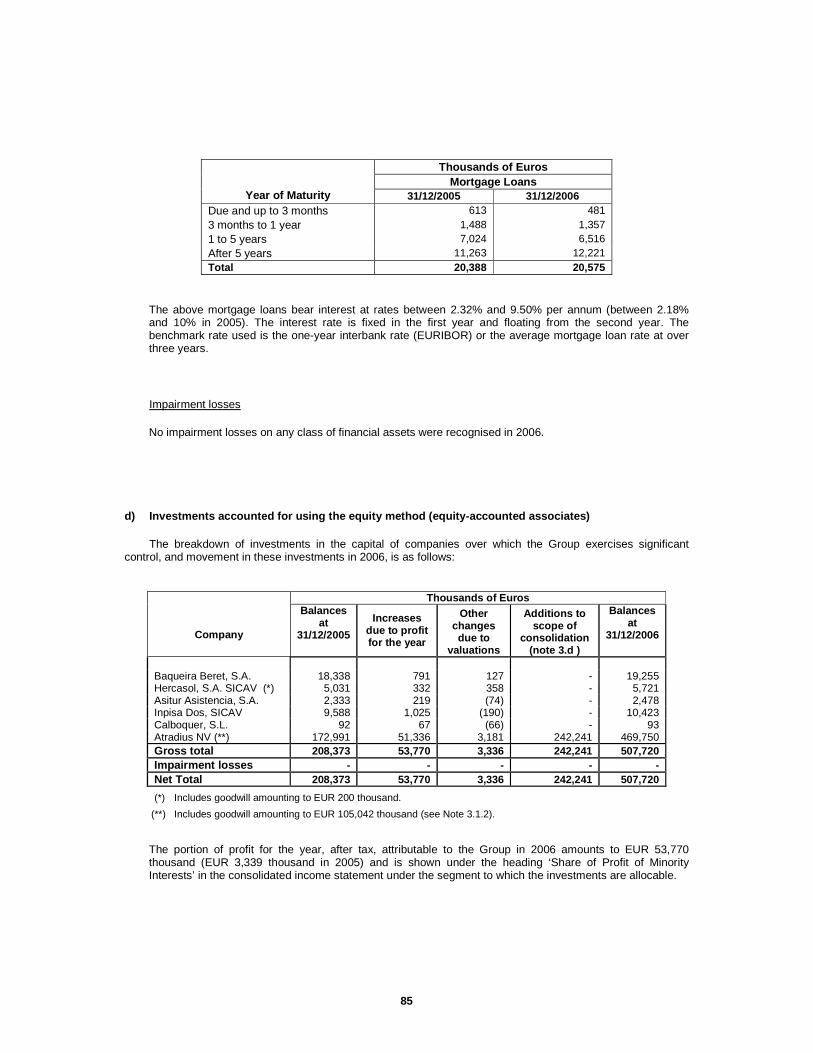
85
Thousands of Euros Mortgage Loans
Year of Maturity 31/12/2005 31/12/2006 Due and up to 3 months 613 481 3 months to 1 year 1,488 1,357 1 to 5 years 7,024 6,516 After 5 years 11,263 12,221 Total 20,388 20,575
The above mortgage loans bear interest at rates between 2.32% and 9.50% per annum (between 2.18% and 10% in 2005). The interest rate is fixed in the first year and floating from the second year. The benchmark rate used is the one-year interbank rate (EURIBOR) or the average mortgage loan rate at over three years.
Impairment losses
No impairment losses on any class of financial assets were recognised in 2006.
d) Investments accounted for using the equity metho d (equity-accounted associates)
The breakdown of investments in the capital of companies over which the Group exercises significant control, and movement in these investments in 2006, is as follows:
Thousands of Euros
Company
Balances at
31/12/2005
Increases due to profit for the year
Other changes due to
valuations
Additions to scope of
consolidation (note 3.d )
Balances at
31/12/2006
Baqueira Beret, S.A. 18,338 791 127 - 19,255 Hercasol, S.A. SICAV (*) 5,031 332 358 - 5,721 Asitur Asistencia, S.A. 2,333 219 (74) - 2,478 Inpisa Dos, SICAV 9,588 1,025 (190) - 10,423 Calboquer, S.L. 92 67 (66) - 93 Atradius NV (**) 172,991 51,336 3,181 242,241 469,750 Gross total 208,373 53,770 3,336 242,241 507,720 Impairment losses - - - - - Net Total 208,373 53,770 3,336 242,241 507,720
(*) Includes goodwill amounting to EUR 200 thousand.
(**) Includes goodwill amounting to EUR 105,042 thousand (see Note 3.1.2).
The portion of profit for the year, after tax, attributable to the Group in 2006 amounts to EUR 53,770 thousand (EUR 3,339 thousand in 2005) and is shown under the heading ‘Share of Profit of Minority Interests’ in the consolidated income statement under the segment to which the investments are allocable.
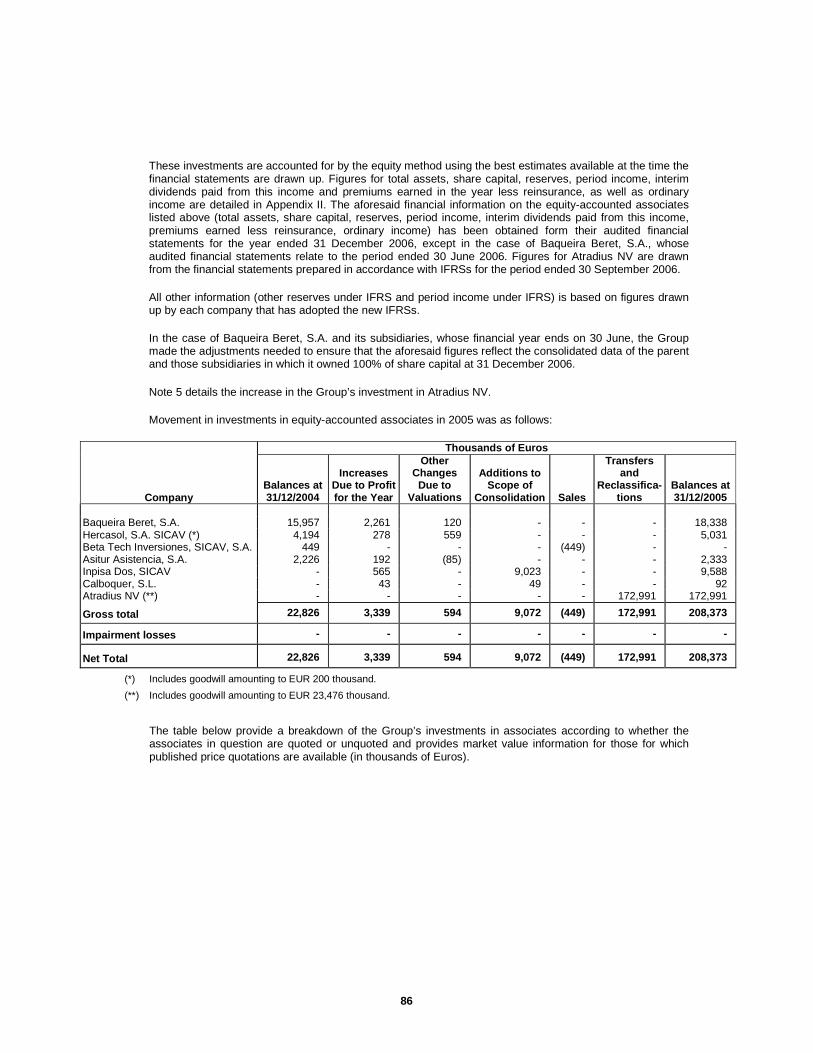
86
These investments are accounted for by the equity method using the best estimates available at the time the financial statements are drawn up. Figures for total assets, share capital, reserves, period income, interim dividends paid from this income and premiums earned in the year less reinsurance, as well as ordinary income are detailed in Appendix II. The aforesaid financial information on the equity-accounted associates listed above (total assets, share capital, reserves, period income, interim dividends paid from this income, premiums earned less reinsurance, ordinary income) has been obtained form their audited financial statements for the year ended 31 December 2006, except in the case of Baqueira Beret, S.A., whose audited financial statements relate to the period ended 30 June 2006. Figures for Atradius NV are drawn from the financial statements prepared in accordance with IFRSs for the period ended 30 September 2006.
All other information (other reserves under IFRS and period income under IFRS) is based on figures drawn up by each company that has adopted the new IFRSs.
In the case of Baqueira Beret, S.A. and its subsidiaries, whose financial year ends on 30 June, the Group made the adjustments needed to ensure that the aforesaid figures reflect the consolidated data of the parent and those subsidiaries in which it owned 100% of share capital at 31 December 2006.
Note 5 details the increase in the Group’s investment in Atradius NV.
Movement in investments in equity-accounted associates in 2005 was as follows:
Thousands of Euros
Company Balances at 31/12/2004
Increases Due to Profit for the Year
Other Changes Due to
Valuations
Additions to Scope of
Consolidation Sales
Transfers and
Reclassifica-tions
Balances at 31/12/2005
Baqueira Beret, S.A. 15,957 2,261 120 - - - 18,338 Hercasol, S.A. SICAV (*) 4,194 278 559 - - - 5,031 Beta Tech Inversiones, SICAV, S.A. 449 - - - (449) - - Asitur Asistencia, S.A. 2,226 192 (85) - - - 2,333 Inpisa Dos, SICAV - 565 - 9,023 - - 9,588 Calboquer, S.L. - 43 - 49 - - 92 Atradius NV (**) - - - - - 172,991 172,991
Gross total 22,826 3,339 594 9,072 (449) 172,991 208,373
Impairment losses - - - - - - -
Net Total 22,826 3,339 594 9,072 (449) 172,991 208,373
(*) Includes goodwill amounting to EUR 200 thousand.
(**) Includes goodwill amounting to EUR 23,476 thousand.
The table below provide a breakdown of the Group’s investments in associates according to whether the associates in question are quoted or unquoted and provides market value information for those for which published price quotations are available (in thousands of Euros).
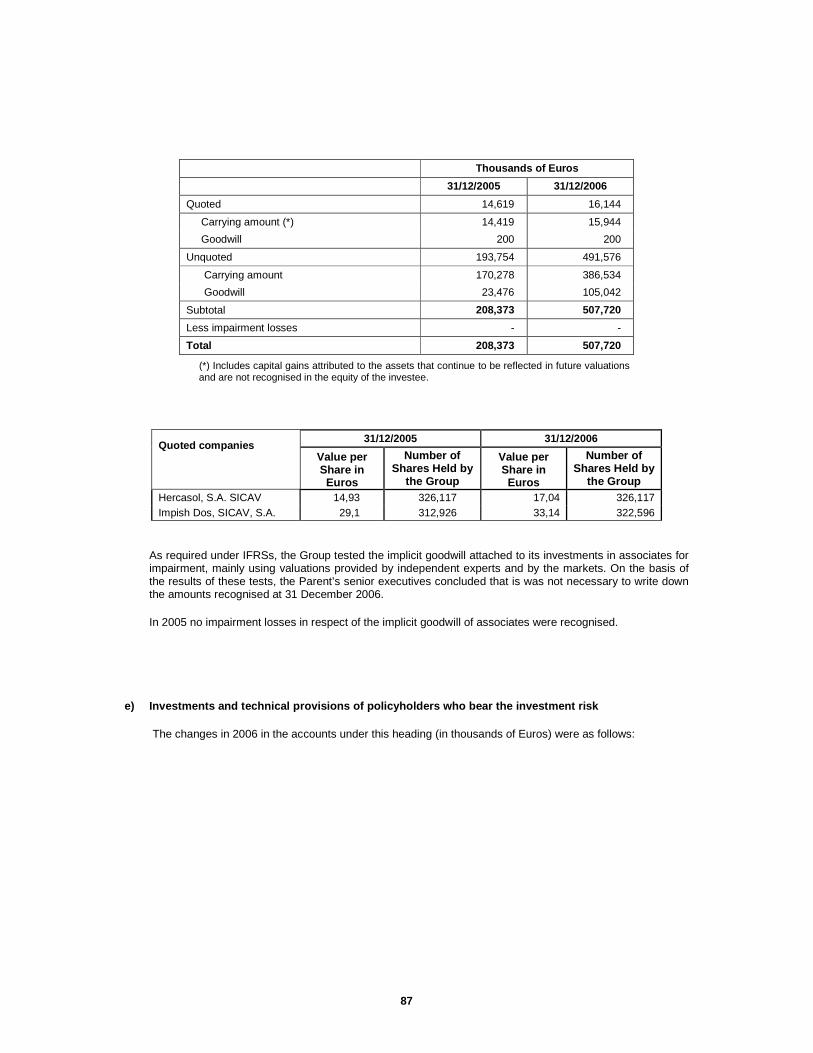
87
Thousands of Euros
31/12/2005 31/12/2006
Quoted 14,619 16,144
Carrying amount (*) 14,419 15,944
Goodwill 200 200
Unquoted 193,754 491,576
Carrying amount 170,278 386,534
Goodwill 23,476 105,042
Subtotal 208,373 507,720
Less impairment losses - -
Total 208,373 507,720
(*) Includes capital gains attributed to the assets that continue to be reflected in future valuations and are not recognised in the equity of the investee.
31/12/2005 31/12/2006 Quoted companies
Value per Share in Euros
Number of Shares Held by
the Group
Value per Share in Euros
Number of Shares Held by
the Group
Hercasol, S.A. SICAV 14,93 326,117 17,04 326,117 Impish Dos, SICAV, S.A. 29,1 312,926 33,14 322,596
As required under IFRSs, the Group tested the implicit goodwill attached to its investments in associates for impairment, mainly using valuations provided by independent experts and by the markets. On the basis of the results of these tests, the Parent’s senior executives concluded that is was not necessary to write down the amounts recognised at 31 December 2006.
In 2005 no impairment losses in respect of the implicit goodwill of associates were recognised.
e) Investments and technical provisions of policyho lders who bear the investment risk
The changes in 2006 in the accounts under this heading (in thousands of Euros) were as follows:

88
At Fair Value through Profit or Loss Loans and Receivables
Equity Securities
Fixed-Income
Securities
Other Financial Assets
with Published
Price Quotations
Financial Assets without
Published Price
Quotations
Other Assigned Balances Total
Carrying amount at 1 January 2006 (see Note 11)
86,333 107,454 82,489 22,869 642 (*) 299,787
Purchases 17,581 31,277 15,731 2,787,528 70 2,852,187
Sales and redemptions (10,427) (25,856) (11,138) (2,769,935) (419) (2,817,775)
Positive revaluations against profit
─ Listed 23,587 740 - - - 24,327
─ Unlisted – published price - - 15,983 - - 15,983
─ Unlisted – valuation techniques - - - - - -
Negative revaluations against profit
─ Listed - (19) - - - (19)
─ Unlisted – published price - - (3,473) - - (3,473)
─ Unlisted – valuation techniques - - - - - -
Changes in impairment losses - - - - - -
Carrying amount at 31 December 2006 117,074 113,596 99,592 40,462 293 371,017
(*) Basically due to the fact that the amount of the management fees payable to the Group exceeded the amounts held in current accounts at that date.
Movement in 2005 was as follows (in thousands of Euros):
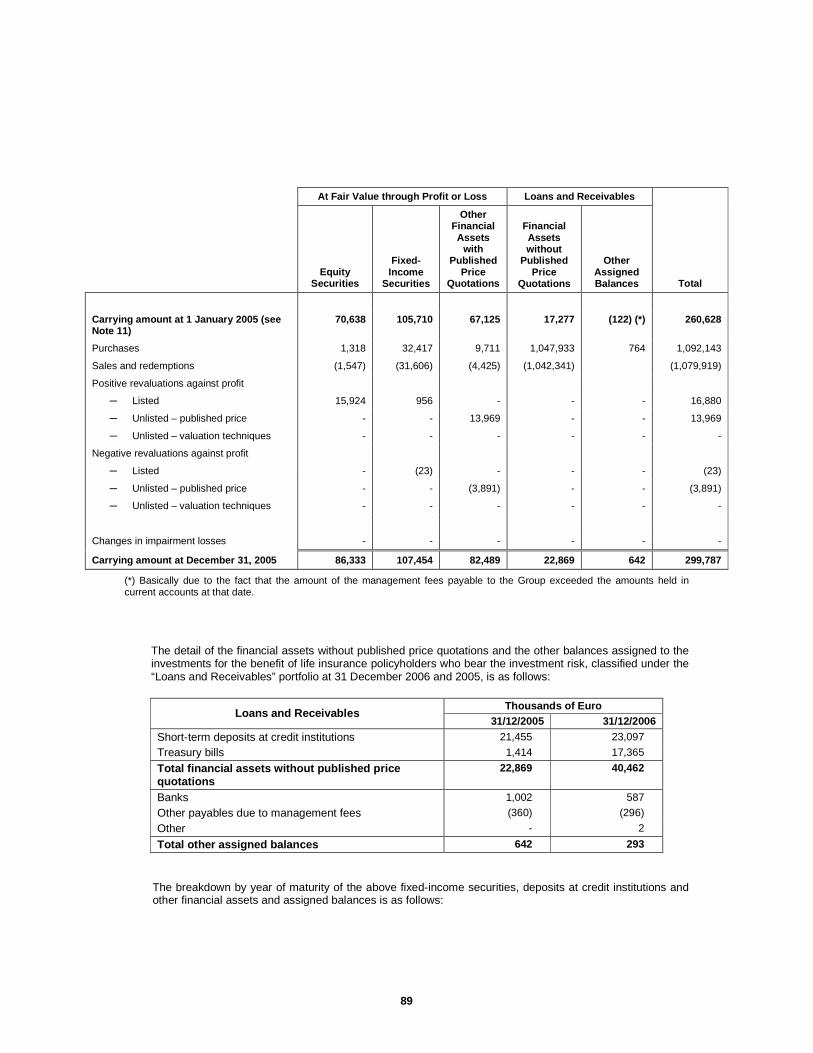
89
At Fair Value through Profit or Loss Loans and Receivables
Equity Securities
Fixed-Income
Securities
Other Financial Assets
with Published
Price Quotations
Financial Assets without
Published Price
Quotations
Other Assigned Balances Total
Carrying amount at 1 January 2005 (see Note 11)
70,638 105,710 67,125 17,277 (122) (*) 260,628
Purchases 1,318 32,417 9,711 1,047,933 764 1,092,143
Sales and redemptions (1,547) (31,606) (4,425) (1,042,341) (1,079,919)
Positive revaluations against profit
─ Listed 15,924 956 - - - 16,880
─ Unlisted – published price - - 13,969 - - 13,969
─ Unlisted – valuation techniques - - - - - -
Negative revaluations against profit
─ Listed - (23) - - - (23)
─ Unlisted – published price - - (3,891) - - (3,891)
─ Unlisted – valuation techniques - - - - - -
Changes in impairment losses - - - - - -
Carrying amount at December 31, 2005 86,333 107,454 82,489 22,869 642 299,787
(*) Basically due to the fact that the amount of the management fees payable to the Group exceeded the amounts held in current accounts at that date.
The detail of the financial assets without published price quotations and the other balances assigned to the investments for the benefit of life insurance policyholders who bear the investment risk, classified under the “Loans and Receivables” portfolio at 31 December 2006 and 2005, is as follows:
Thousands of Euro Loans and Receivables
31/12/2005 31/12/2006
Short-term deposits at credit institutions 21,455 23,097
Treasury bills 1,414 17,365
Total financial assets without published price quotations
22,869 40,462
Banks 1,002 587
Other payables due to management fees (360) (296)
Other - 2
Total other assigned balances 642 293
The breakdown by year of maturity of the above fixed-income securities, deposits at credit institutions and other financial assets and assigned balances is as follows:
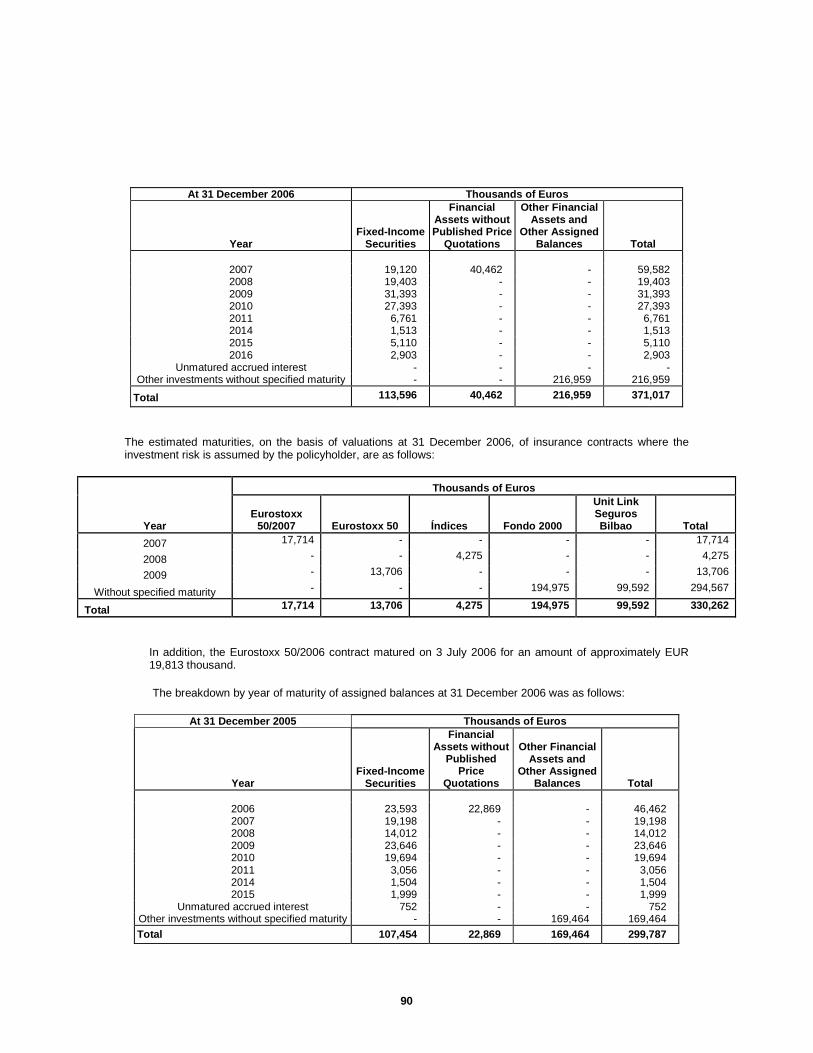
90
At 31 December 2006 Thousands of Euros
Year Fixed-Income
Securities
Financial Assets without Published Price
Quotations
Other Financial Assets and
Other Assigned Balances Total
2007 19,120 40,462 - 59,582 2008 19,403 - - 19,403 2009 31,393 - - 31,393 2010 27,393 - - 27,393 2011 6,761 - - 6,761 2014 1,513 - - 1,513 2015 5,110 - - 5,110 2016 2,903 - - 2,903
Unmatured accrued interest - - - - Other investments without specified maturity - - 216,959 216,959
Total 113,596 40,462 216,959 371,017
The estimated maturities, on the basis of valuations at 31 December 2006, of insurance contracts where the investment risk is assumed by the policyholder, are as follows:
Thousands of Euros
Year Eurostoxx
50/2007 Eurostoxx 50 Índices Fondo 2000
Unit Link Seguros Bilbao Total
2007 17,714 - - - - 17,714
2008 - - 4,275 - - 4,275
2009 - 13,706 - - - 13,706
Without specified maturity - - - 194,975 99,592 294,567
Total 17,714 13,706 4,275 194,975 99,592 330,262
In addition, the Eurostoxx 50/2006 contract matured on 3 July 2006 for an amount of approximately EUR 19,813 thousand.
The breakdown by year of maturity of assigned balances at 31 December 2006 was as follows:
At 31 December 2005 Thousands of Euros
Year Fixed-Income
Securities
Financial Assets without
Published Price
Quotations
Other Financial Assets and
Other Assigned Balances Total
2006 23,593 22,869 - 46,462 2007 19,198 - - 19,198 2008 14,012 - - 14,012 2009 23,646 - - 23,646 2010 19,694 - - 19,694 2011 3,056 - - 3,056 2014 1,504 - - 1,504 2015 1,999 - - 1,999
Unmatured accrued interest 752 - - 752 Other investments without specified maturity - - 169,464 169,464
Total 107,454 22,869 169,464 299,787
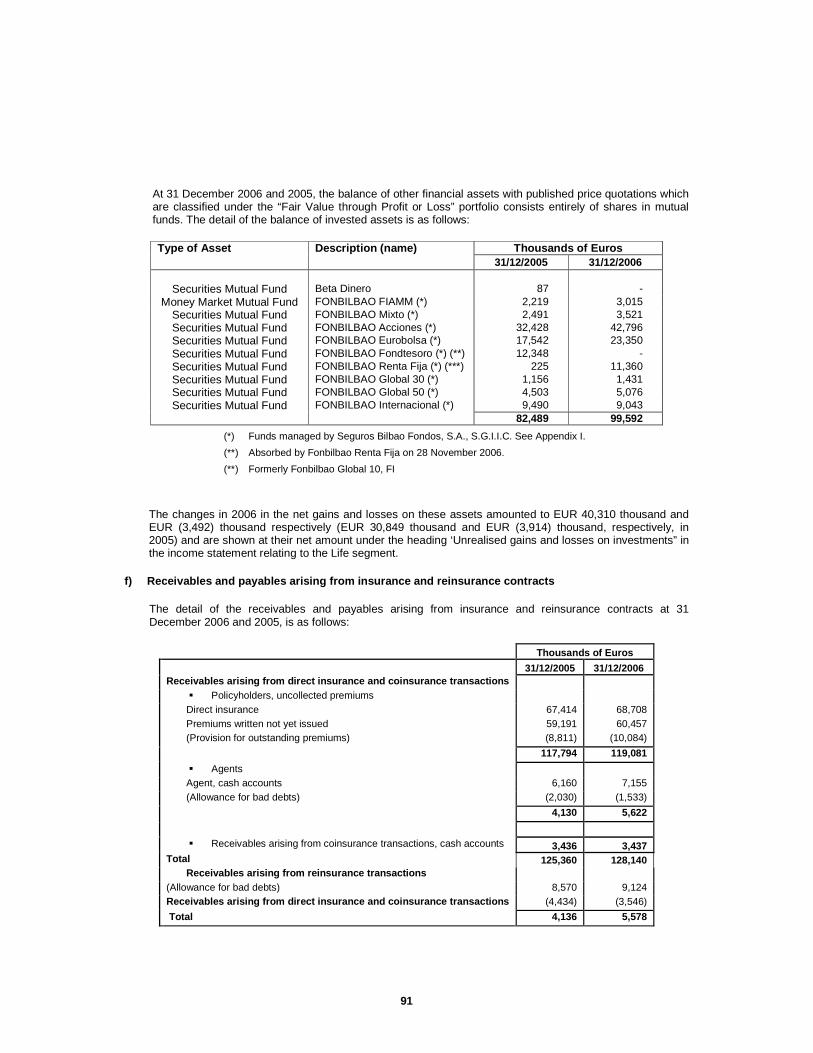
91
At 31 December 2006 and 2005, the balance of other financial assets with published price quotations which are classified under the “Fair Value through Profit or Loss” portfolio consists entirely of shares in mutual funds. The detail of the balance of invested assets is as follows:
Thousands of Euros Type of Asset Description (name) 31/12/2005 31/12/2006
Securities Mutual Fund Beta Dinero 87 -
Money Market Mutual Fund FONBILBAO FIAMM (*) 2,219 3,015 Securities Mutual Fund FONBILBAO Mixto (*) 2,491 3,521 Securities Mutual Fund FONBILBAO Acciones (*) 32,428 42,796 Securities Mutual Fund FONBILBAO Eurobolsa (*) 17,542 23,350 Securities Mutual Fund FONBILBAO Fondtesoro (*) (**) 12,348 - Securities Mutual Fund FONBILBAO Renta Fija (*) (***) 225 11,360 Securities Mutual Fund FONBILBAO Global 30 (*) 1,156 1,431 Securities Mutual Fund FONBILBAO Global 50 (*) 4,503 5,076 Securities Mutual Fund FONBILBAO Internacional (*) 9,490 9,043
82,489 99,592
(*) Funds managed by Seguros Bilbao Fondos, S.A., S.G.I.I.C. See Appendix I.
(**) Absorbed by Fonbilbao Renta Fija on 28 November 2006.
(**) Formerly Fonbilbao Global 10, FI
The changes in 2006 in the net gains and losses on these assets amounted to EUR 40,310 thousand and EUR (3,492) thousand respectively (EUR 30,849 thousand and EUR (3,914) thousand, respectively, in 2005) and are shown at their net amount under the heading ‘Unrealised gains and losses on investments” in the income statement relating to the Life segment.
f) Receivables and payables arising from insurance and reinsurance contracts
The detail of the receivables and payables arising from insurance and reinsurance contracts at 31 December 2006 and 2005, is as follows:
Thousands of Euros 31/12/2005 31/12/2006 Receivables arising from direct insurance and coins urance transactions
� Policyholders, uncollected premiums Direct insurance 67,414 68,708 Premiums written not yet issued 59,191 60,457 (Provision for outstanding premiums) (8,811) (10,084)
117,794 119,081
� Agents Agent, cash accounts 6,160 7,155 (Allowance for bad debts) (2,030) (1,533)
4,130 5,622
� Receivables arising from coinsurance transactions, cash accounts 3,436 3,437
Total 125,360 128,140 Receivables arising from reinsurance transactions
(Allowance for bad debts) 8,570 9,124 Receivables arising from direct insurance and coins urance transactions (4,434) (3,546)
Total 4,136 5,578

92
Thousands of Euros 31/12/2005 31/12/2006 Payables arising from direct insurance and coinsura nce transactions With policyholders 5,703 6,527 With agents 15,559 17,133 Conditional debt 16,447 15,449 Payables arising from coinsurance transactions 1,331 1,475
39,040 40,584
Payables arising from reinsurance transactions 15,4 98 9,820
Total 54,538 50,404
The changes in and detail of the impairment losses recognised in 2006 and 2005 are shown in the following table, with the various changes under ‘Earned Premiums Less Reinsurance’ and “Net Operating Expenses’ being recognised in the income statement applicable to each segment.
Provision for Outstanding Premiums
Allowance for Agents’ Bad
Debts
Allowance for Reinsurance Bad Debts
Balances at 1 January 2005 (7,593) (2,958) (4,726) Provisions with a charge to profit (1,218) - - Amounts released with a credit to profit - 928 292 Balances at 31 December 2005 (8,811) (2,030) (4,434)
Provisions with a charge to profit (1,273) - - Amounts released with a credit to profit - 497 888 Balances at 31 December 2006 (10,084) (1,533) (3,546)
g) Foreign currency transactions
The equivalent value in euros of the total assets and liabilities held by the Group at 31 December 2006 and 2005, and the breakdown of the main foreign currency balances, taking into account the nature of the items, is as follows:
Equivalent value in euros at 31/12/2005
Equivalent value in euros at 31/12/2006
Assets Assets
Balances held In:
Financial instruments – available-
for-sale portfolio
Cash and cash
equivalents Liabilities
Financial instruments – available-
for-sale portfolio
Cash and cash
equivalents
Liabilities
US dollars 28,278 419 - 33,542 (6) - Pounds sterling 1,404 1,132 - 1,581 - - Japanese yen 2,532 828 - 4,784 259 - Swiss francs 8,275 1,278 - 16,211 1,355 - Swedish crowns 664 - - 220 - - Other currencies 339 - - - - -
Total 41,492 3,657 - 56,338 1,607 -
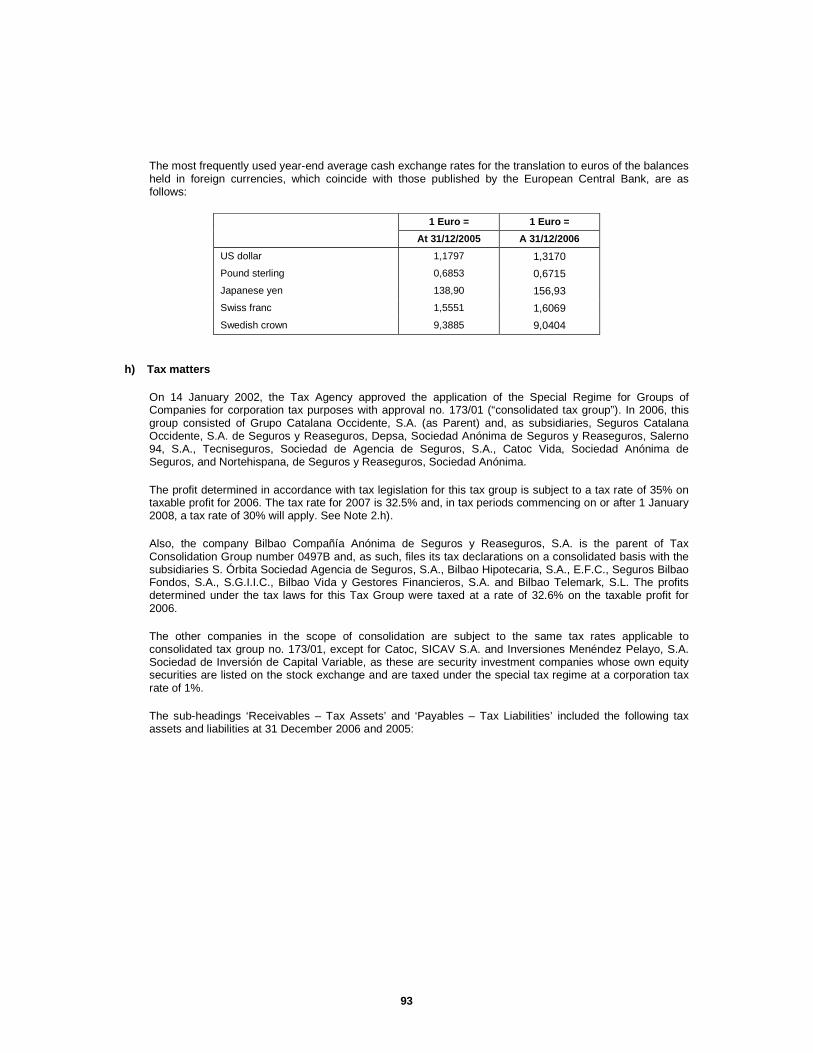
93
The most frequently used year-end average cash exchange rates for the translation to euros of the balances held in foreign currencies, which coincide with those published by the European Central Bank, are as follows:
1 Euro = 1 Euro =
At 31/12/2005 A 31/12/2006
US dollar 1,1797 1,3170
Pound sterling 0,6853 0,6715
Japanese yen 138,90 156,93
Swiss franc 1,5551 1,6069
Swedish crown 9,3885 9,0404
h) Tax matters
On 14 January 2002, the Tax Agency approved the application of the Special Regime for Groups of Companies for corporation tax purposes with approval no. 173/01 (“consolidated tax group”). In 2006, this group consisted of Grupo Catalana Occidente, S.A. (as Parent) and, as subsidiaries, Seguros Catalana Occidente, S.A. de Seguros y Reaseguros, Depsa, Sociedad Anónima de Seguros y Reaseguros, Salerno 94, S.A., Tecniseguros, Sociedad de Agencia de Seguros, S.A., Catoc Vida, Sociedad Anónima de Seguros, and Nortehispana, de Seguros y Reaseguros, Sociedad Anónima.
The profit determined in accordance with tax legislation for this tax group is subject to a tax rate of 35% on taxable profit for 2006. The tax rate for 2007 is 32.5% and, in tax periods commencing on or after 1 January 2008, a tax rate of 30% will apply. See Note 2.h).
Also, the company Bilbao Compañía Anónima de Seguros y Reaseguros, S.A. is the parent of Tax Consolidation Group number 0497B and, as such, files its tax declarations on a consolidated basis with the subsidiaries S. Órbita Sociedad Agencia de Seguros, S.A., Bilbao Hipotecaria, S.A., E.F.C., Seguros Bilbao Fondos, S.A., S.G.I.I.C., Bilbao Vida y Gestores Financieros, S.A. and Bilbao Telemark, S.L. The profits determined under the tax laws for this Tax Group were taxed at a rate of 32.6% on the taxable profit for 2006.
The other companies in the scope of consolidation are subject to the same tax rates applicable to consolidated tax group no. 173/01, except for Catoc, SICAV S.A. and Inversiones Menéndez Pelayo, S.A. Sociedad de Inversión de Capital Variable, as these are security investment companies whose own equity securities are listed on the stock exchange and are taxed under the special tax regime at a corporation tax rate of 1%.
The sub-headings ‘Receivables – Tax Assets’ and ‘Payables – Tax Liabilities’ included the following tax assets and liabilities at 31 December 2006 and 2005:

94
Thousands of Euros 31/12/2005 31/12/2006 Receivables Tax receivables:
• Consolidated tax group assessment 833 12,634
• Other tax receivables of other tax groups or individual companies
1,214 884
Other items 1,187 1,035
Total tax assets 3,234 14,553
Payables
Taxes payable:
• Other tax payables of other tax groups or individual companies
24,241 27,759
• Other payables (withholdings, VAT,…)
5,996
Tax on insurance premiums 7,498 7,361
Insurance Settlements Consortium and other regulatory bodies
16,620 14,936
Social Security agencies 2,536 2,558
Total tax liabilities 50,895 58,610
In addition, at 31 December 2006, the Group had deferred tax assets totalling EUR 14,004 thousand and deferred tax liabilities totalling EUR 194,026 thousand, recognised under ‘Deferred Tax Assets’ and ‘Deferred Tax Liabilities’. The ‘Deferred Tax Assets’ include EUR 2,648 thousand relating to deductions pending application. The Group has re-estimated these deferred tax asset and liabilities to take account of the new tax rate in force at the time of their offset or recovery.
At 31 December 2005, deferred tax assets totalled EUR 24,386 thousand and deferred tax liabilities came to EUR 188,172 thousand, and included EUR 6,496 thousand and EUR 4,856 thousand relating to the receivable resulting from the capitalisation of the tax loss carryforwards and to unused tax credits. All deferred tax assets and liabilities were calculated at the tax rate of 35%.
Reconciliation of the accounting profit to the tax profit
The detail by company of the corporation tax expense as shown in the accompanying consolidated income statement for 2006 and 2005 in the amounts of EUR 54,836 and EUR 57,357 thousand respectively, is as follows:
Thousands of Euros 2005 2006 Companies in the consolidated tax Group Grupo Catalana Occidente, S.A. 112 (709) Seguros Catalana Occidente, S.A. de Seguros y Reaseguros
(2,698) 3,705
Depsa, S.A. de Seguros y Reaseguros 1,279 1,433 Salerno 94, S.A. 523 581 Tecniseguros, Sociedad de Agencia de Seguros, S.A. 1 2 Catoc Vida, Sociedad Anónima de Seguros 576 653 Cosalud, S.A. de Seguros 1,712 1,398 Lepanto S.A., Compañía de Seguros y Reaseguros 1,888 - Nortehispana, de Seguros y Reaseguros, S.A. 3,644 3,708 Catalana Occidente Capital, Agencia de Valores, S.A. 20 178

95
Other consolidated companies: Bilbao Compañía Anónima de Seguros y Reaseguros, S.A. and subsidiaries (tax groupl)
15,153 19,851
Catoc, SICAV S.A. 35 68 Inversiones Menéndez Pelayo, SICAV S.A. 11 22 Compañía Española de Seguros y Reaseguros de Crédito y Caución and subsidiaries
24,506 25,783
Adjustments due to application of IFRSs 10,595 (1,837)
Consolidated Group corporation tax 57,357 54,836
The adjustments due to application of IFRSs in 2006 includes income of EUR 11,927 thousand corresponding to the net settlement of the Group’s deferred tax assets and liabilities not related to items recognised in the statement of recognised income and expense. Group subsidiaries also recognised in income the effect of the tax change on the deferred tax assets and liabilities recognised under Spanish GAAP. This normalisation entailed a credit of EUR 522 thousand.
Deferred tax assets and liabilities that under IFRSs are credited or charged directly to the statement of recognised income and expense (essentially valuation adjustments to financial instruments classified as available-for-sale) have been re-estimated and recognised in equity, without impact on the consolidated incomes statement for 2006, for an approximate amount of EUR 6,538 thousand (of which Err 6,029 thousand attributable to the Parent).
The positive adjustment to corporation tax recognised by the subsidiary Seguros Catalana Occidente, S.A. de Seguros y Reaseguros in 2005 mainly relates to the tax credits taken at the consolidated tax Group level.
In 2005, Seguros Catalana Occidente, S.A did not offset all its taxable profit for the year against the available tax losses it had pending application in order to take the intra-group double taxation credit relating to the dividends obtained in 2006 by the Catalana Occidente Group form this subsidiary in the in the amount of EUR 53,063 thousand.
In 2006, Seguros Catalana Occidente, S.A offset all tax losses pending application from pervious years arising from the losses sustained when it was called Multinacional Aseguradora, Sociedad Anónima de Seguros y Reaseguros and prior to the portfolio transfer mentioned in Note 1.
For tax purposes, the detail of the tax losses available for offset by Seguros Catalana Occidente, S.A and the estimate of the tax losses to be offset in the annual corporation tax return for 2006 is as follows:
Thousands of Euros Tax losses before consolidation
Year Deadline for Offset 31/12/2005
Change in Final Tax
Assessment for 2004
Change in 2005 31/12/2006
1999 2014 38,158 (5,770) (32,388) - 2000 2015 25,065 - (25,065) -
63,223 (5,770) (57,453) -

96
In 2005, tax losses in the amount of EUR 46,530 thousand were offset prior to presentation of the final tax return for that year.
The reconciliation between the corporation tax expense resulting from applying the statutory tax rate in force in Spain to the taxable profit obtained by the various companies forming the consolidated tax group and by the other subsidiaries in 2005, and the recognised corporation tax expense, is as follows:
2006 in Thousands of Euros
Consolidated Tax Group
Seguros Bilbao Tax
Group Crédito y Caución
Security Investment Companies
Consolidated Group Total
Pre-tax profit under Spanish GAAP 204,094 64,086 73,580 9,040 350,800
Corporation tax at applicable tax rate (35%, 32.6% and 1%) 35% 32,6% 35% 1% Effect of permanent differences: Investment valuation allowance and other balances (17,704) - - - (17,704) Dividend deductions and eliminations (63,749) - - - (63,749) Other 3,245 942 2,454 - 6,641
Preliminary taxable profit 125,886 65,028 76,034 9,040 275,988 Offset tax losses (41,262) - - - (41,262) Taxable profit 84,624 65,028 76,034 9,040 234,726 Tax rate applicable to taxable profit 29,619 21,199 26,612 90 77,520 Tax credits for: Double taxation (18,647) (984) (133) - (19,764) Investments (860) (58) (456) - (1,374) Other 2,214 (306) (240) - 1,668
Normalisation tax rate 2005 (855) - - - (855)
Change in tax rates (Spanish GAAP) (522) - - - (522)
Expense for the year under Spanish GAAP 10,949 19,851 25,783 90 56,673
Due to differences between Spanish GAAP and IFRSs 58 857 (2,748) (4) (1,837)
Corporation tax expense for the year recognised aga inst the
2005 income statement 11,007 20,708 23,035 86 54,836
The detail of the main items giving rise to differences between Spanish GAAP and IFRSs in 2006 (in thousands of Euros) is as follows:
2006
Consolidated Tax Group
Seguros Bilbao Tax
Group Crédito y Caución
Security Investment Companies
Consolidated Group Total
Reversal of investment valuation allowance and valuation adjustments recognised in income (956) 8 477 (4) (475)
Equalisation provision 1,454 632 10,699 - 12,785 Amortised goodwill – portfolio acquisition costs (282) 480 - - 198 Amortisation of capital gains allocated to investment properties and properties for own use (49) (263) (489) - (801)
Normalisation of tax rate (401) (11,526) - (11,927)
Other differences 292 - (1,909) - (1,617)
Total 58 857 (2,748) (4) (1,837)
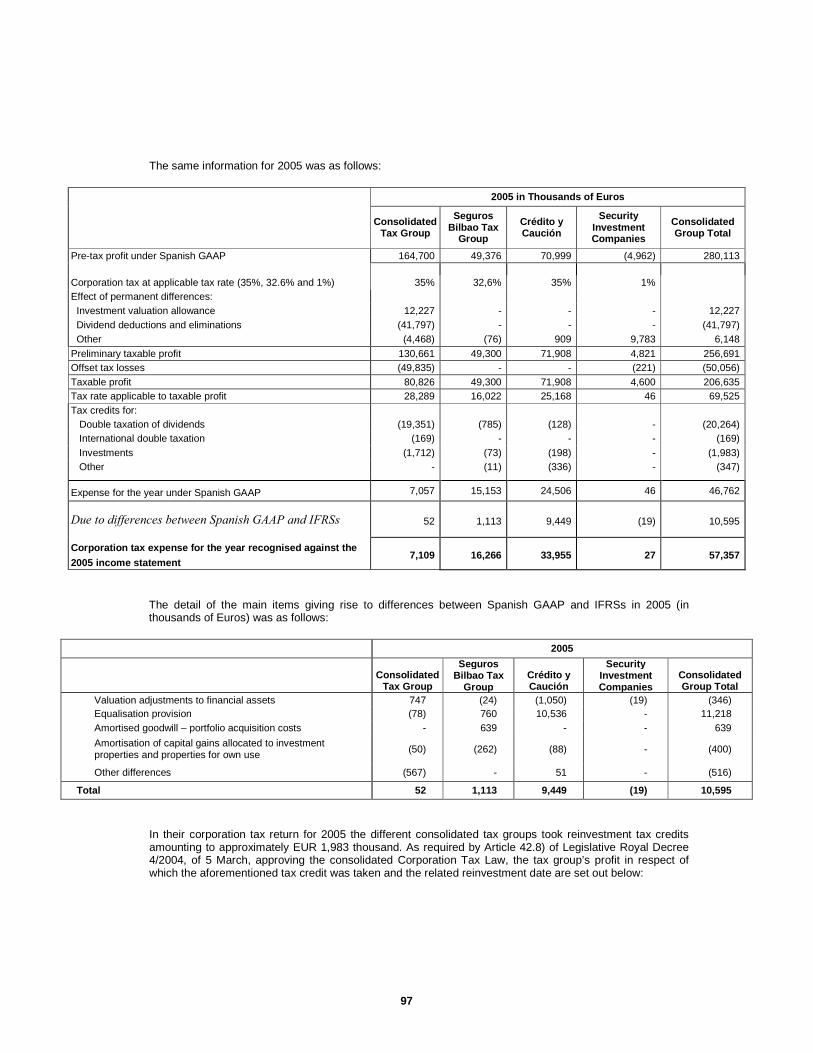
97
The same information for 2005 was as follows:
2005 in Thousands of Euros
Consolidated
Tax Group
Seguros Bilbao Tax
Group
Crédito y Caución
Security Investment Companies
Consolidated Group Total
Pre-tax profit under Spanish GAAP 164,700 49,376 70,999 (4,962) 280,113
Corporation tax at applicable tax rate (35%, 32.6% and 1%) 35% 32,6% 35% 1% Effect of permanent differences: Investment valuation allowance 12,227 - - - 12,227 Dividend deductions and eliminations (41,797) - - - (41,797) Other (4,468) (76) 909 9,783 6,148 Preliminary taxable profit 130,661 49,300 71,908 4,821 256,691 Offset tax losses (49,835) - - (221) (50,056) Taxable profit 80,826 49,300 71,908 4,600 206,635 Tax rate applicable to taxable profit 28,289 16,022 25,168 46 69,525 Tax credits for: Double taxation of dividends (19,351) (785) (128) - (20,264) International double taxation (169) - - - (169) Investments (1,712) (73) (198) - (1,983) Other - (11) (336) - (347) Expense for the year under Spanish GAAP 7,057 15,153 24,506 46 46,762
Due to differences between Spanish GAAP and IFRSs 52 1,113 9,449 (19) 10,595
Corporation tax expense for the year recognised aga inst the
2005 income statement 7,109 16,266 33,955 27 57,357
The detail of the main items giving rise to differences between Spanish GAAP and IFRSs in 2005 (in thousands of Euros) was as follows:
2005
Consolidated Tax Group
Seguros Bilbao Tax
Group Crédito y Caución
Security Investment Companies
Consolidated Group Total
Valuation adjustments to financial assets 747 (24) (1,050) (19) (346) Equalisation provision (78) 760 10,536 - 11,218 Amortised goodwill – portfolio acquisition costs - 639 - - 639
Amortisation of capital gains allocated to investment properties and properties for own use (50) (262) (88) - (400)
Other differences (567) - 51 - (516)
Total 52 1,113 9,449 (19) 10,595
In their corporation tax return for 2005 the different consolidated tax groups took reinvestment tax credits amounting to approximately EUR 1,983 thousand. As required by Article 42.8) of Legislative Royal Decree 4/2004, of 5 March, approving the consolidated Corporation Tax Law, the tax group’s profit in respect of which the aforementioned tax credit was taken and the related reinvestment date are set out below:
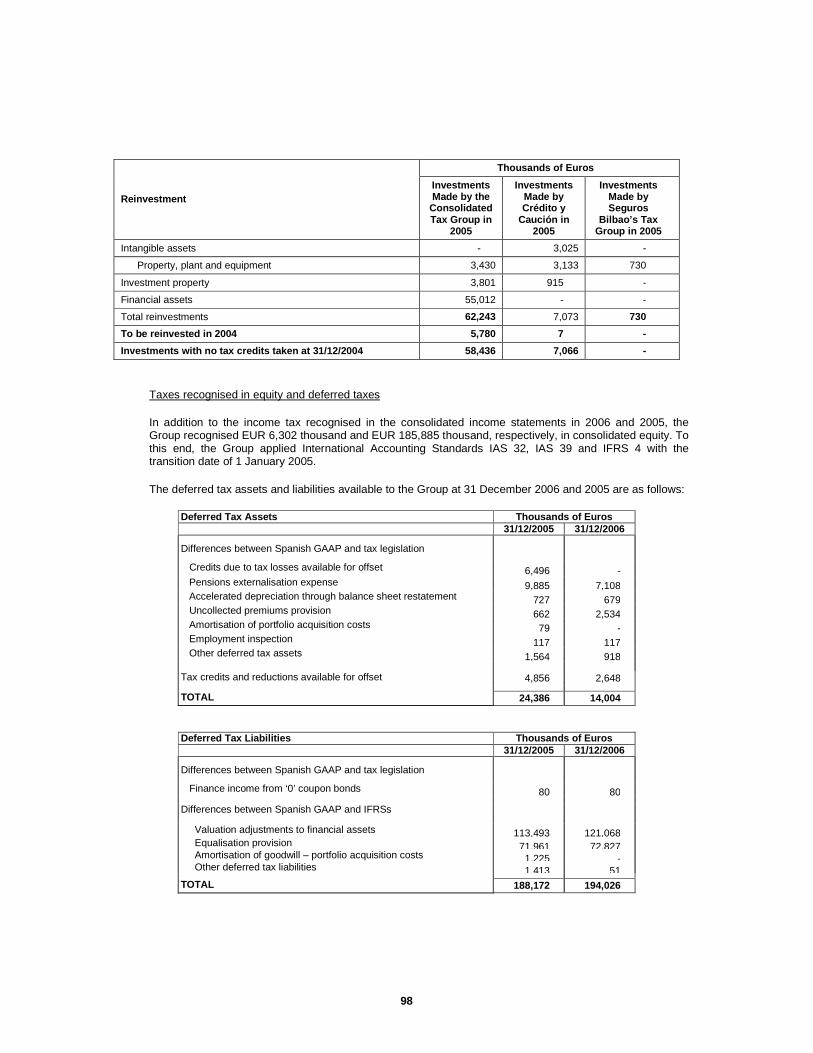
98
Thousands of Euros
Reinvestment Investments Made by the
Consolidated Tax Group in
2005
Investments Made by Crédito y
Caución in 2005
Investments Made by Seguros
Bilbao’s Tax Group in 2005
Intangible assets - 3,025 -
Property, plant and equipment 3,430 3,133 730
Investment property 3,801 915 -
Financial assets 55,012 - -
Total reinvestments 62,243 7,073 730
To be reinvested in 2004 5,780 7 -
Investments with no tax credits taken at 31/12/2004 58,436 7,066 -
Taxes recognised in equity and deferred taxes
In addition to the income tax recognised in the consolidated income statements in 2006 and 2005, the Group recognised EUR 6,302 thousand and EUR 185,885 thousand, respectively, in consolidated equity. To this end, the Group applied International Accounting Standards IAS 32, IAS 39 and IFRS 4 with the transition date of 1 January 2005.
The deferred tax assets and liabilities available to the Group at 31 December 2006 and 2005 are as follows:
Deferred Tax Assets Thousands of Euros 31/12/2005 31/12/2006
Differences between Spanish GAAP and tax legislation
Credits due to tax losses available for offset 6,496 - Pensions externalisation expense 9,885 7,108 Accelerated depreciation through balance sheet restatement 727 679 Uncollected premiums provision 662 2,534 Amortisation of portfolio acquisition costs 79 - Employment inspection 117 117 Other deferred tax assets 1,564 918 Tax credits and reductions available for offset 4,856 2,648 TOTAL 24,386 14,004
Deferred Tax Liabilities Thousands of Euros 31/12/2005 31/12/2006
Differences between Spanish GAAP and tax legislation
Finance income from ‘0’ coupon bonds 80 80 Differences between Spanish GAAP and IFRSs
Valuation adjustments to financial assets 113,493 121,068 Equalisation provision 71,961 72,827 Amortisation of goodwill – portfolio acquisition costs 1,225 - Other deferred tax liabilities 1,413 51 TOTAL 188,172 194,026

99
The main deferred tax assets and liabilities existing at 31 December 2006 already reflect the effect of the re-estimates necessitated by the change in tax rates. The following recovery and offset periods were assumed in these calculations:
- For unrealised capital gains on financial instruments classified as available-for-sale, it is assumed that the gain will be realised pro rata temporis in 2007, 2008 and subsequent years. On this basis, the deferred tax assets have been re-estimated assuming a tax rate of 32.5%, with a charge against reserves for “valuation adjustments and exchange differences” in the statement of recognised income and expense in the amount of EUR 6,029 thousand.
- For deferred tax assets generated by application of the equalisation reserve, it is assumed that the tax will be offset in 2008 and subsequent years. Accordingly, the credit has been re-estimated assuming a tax rate of 30%. The impact of this adjustment was a reduction in the corporate tax expense for 2006 of EUR 11,927 thousand.
At 31 December 2006, no tax credits generated prior to taxation under the consolidated tax group regime remained pending application. In the year in question, the subsidiary Seguros Catalana Occidente, S.A. de Seguros y Reaseguros capitalised EUR 2,648 thousand corresponding to credits generated in 2006 that were not applied by its consolidated tax group.
The nature and amount of the tax incentives taken in 2006 and 2005 in the preparation of the corporation tax calculation, as well as those not yet used for tax purposes, at 31 December of each year, are as follows:
Thousands of Euros
Tax Credits
Not Yet Taken at
Not Yet Taken at
Not Yet Taken at Year Item Deadline for
Offset 31/12/2004 Taken in 2005 31/12/2005 Taken in 2006 31/12/2006 1998 Tax credit for double taxation 2005 2 2 - - 1999 Tax credit for double taxation 2006 8 - 8 - 2000 Tax credit for double taxation 2007 4 - 4 - 2001 Double taxation 2008 109 - 109 - 2001 Tax credit for reinvestment 2011 1,200 - 1,200 1,200 2002 Tax credit for reinvestment 2012 3,535 - 3,535 3,535 2005 Tax credit for double taxation 2015
Intra-group at 50% - 1,026 - - Intra-group at 100% - 19,452 - - International - 169 - -
2005 Tax credit for externalisation 2015 - 96 - - 2005 Tax credit for reinvestment 2015 - 971 - - 2005 Donations to foundations 2015 - 129 - - 2005 Tax credit for R&D activities 2015 - 200 - - 2005 Other tax credits 2015 - 15 - - 2006 Tax credit for double taxation 2016
Intra-group at 50% 1,442 Intra-group at 100% 13,418 2,648 International 150 Tax credit for externalisation 2016 80 Tax credit for reinvestment 2016 115 Donations to foundations 2016 184 Tax credit for R&D activities 2016 860
Total 4,858 22,060 4,856 20,984 2,648

100
Years open for review by the tax authorities
Under current legislation, tax settlements cannot be considered to be final until the tax returns filed have been inspected by the tax authorities, or until the four-year statute-of-limitations period has expired.
The Parent has the year 2002 onwards open for review by the tax inspection authorities for corporation tax and 2003 through 2006 for all other applicable taxes. The rest of the consolidated companies have, in general, the last four years open for review by the tax inspection authorities for the main applicable taxes.
In July 2004 the tax authorities commenced an inspection at Catoc, SICAV, S.A. for corporation tax and for years 1999 through 2001. The inspection assessment of the partial review was issued in November 2005 for an amount of EUR 9,784 thousand. In this assessment, as part of the inspection activities carried out in the industry, the inspection authorities took the view that the subsidiary did not meet the requirements for eligibility set forth in the tax regime for Collective Investment Institutions and, therefore, the applicable corporation tax rate would be 35% instead of 1%. In line with the practice of other companies in the industry, the subsidiary filed an economic-administrative appeal. Since this appeal is still pending resolution, at 31 December 2006 and 2005, provisions for the tax calculation arising from the assessment and the related penalty are maintained under the ‘Provisions for liabilities and charges’ heading of the consolidated balance sheet.
In addition, in May 2005, the tax authorities commenced a partial inspection relating to Value Added Tax for the period between the second and fourth quarters (inclusive) of the company Prepersa, Peritación de Seguros y Prevención AIE. This inspection was completed in early 2007 and did not give rise to any material liabilities for the Group.
The varying interpretations which can be made of tax regulations and the results of any inspections carried out in the future by the tax authorities in relation to the years open for review might give rise to contingent tax liabilities that cannot be presently objectively quantified. However, in the opinion of the Group’s tax advisors and of its directors, the possibility that any material liabilities may arise in relation to this item in addition to those already recorded is remote.
i) Other receivables and payables
The detail of these sub-headings in the consolidated balance sheet at 31 December 2006 and 2005 is as follows:
Thousands of Euros Social Security and Other Receivables 31/12/2005 31/12/2006
Estimated outstanding recoveries (*) 105,248 135,641 Receivables under agreements 1,272 1,147 Doubtful agents’ balances and other doubtful balances 577 556 Management fees and other fees receivable 997 655 Personnel 900 568 Claims payments and advance payments 1,153 935 Receivables for leases 275 328 Sundry receivables 15,638 9,591 Total 126,060 149,421

101
Thousands of Euros Other Payables: 31/12/2005 31/12/2006
Outstanding recoveries (*) 34,812 37,313 Deposits received 2,304 2,361 Research and Development project loan 1,418 2,955 Deferred expenses 44,307 36,919 Invoices outstanding 3,687 35,654 Sundry payables 37,634 12,665 Total 124,162 127,867
(*) Pursuant to Article 43 of ROSSP and Article 7 of Ministerial Order EHA/339/2007 dated 16 February 2007, recoveries may be capitalised by institutions operating in the credit and surety insurance business, using statistical methods, provided that they meet certain requirements and that the calculations made be regularly submitted to independent expert assessment.
Compañía Española de Seguros y Reaseguros Crédito y Caución, S.A. records estimated recoveries under a statistical method developed to this end, which analyzes the past performance of settlements of all reported claims, including concluded claims, and provides an estimate of future performance, in order to make actual use thereof, making a reasonable estimate of expected recoveries through the appropriate projections.
The detail of expenses recognised in 2006 but due to be settled in subsequent years is as follows (in thousand of Euros):
Accrued expenses by item 31/12/2006 Personnel expenses 18,966 Administrative expenses 9,923 Supplies and external services 6,202 Other expenses 1,828
Total 36,919
j) Equity attributed to the Parent’s shareholders
As part of its consolidated financial statements, the Group publishes a statement of recognised income and expense and changes in consolidated equity that shows, inter alia:
─ Profit for the year,
─ All items of period income and expense that, under IFRS, are recognised directly in equity,
─ Total period income and expense (sum of the above two items), showing separately the total amount attributable to the Parent’s shareholders and to minority interests,
─ The effect of the changes in accounting policies and the correction of errors on each component of equity.
In 2006, the Parent of the Group made no material changes to its accounting policies and detected no errors in prior years' accounts.
Share capital

102
The Parent’s share capital amounts to EUR 36,000 thousand, consisting of 120,000,000 fully subscribed and paid book-entry shares of EUR 0.30 par value each, with equal rights, although the Parent may issue shares without voting rights.
At the General Meeting of the Parent’s Shareholders held on 25 May 2006, shareholders voted to split all shares outstanding at a ratio of five new shares for one existing share, via a reduction in the par value of all shares from EUR 1.50 to EUR 0.30, so changing the total number of shares from 24,000,000 to the current 120,000,000, without altering the value of share capital, which remains EUR 36,000 thousand.
The share split was taken to public deed on 13 June 2006, recorded in the Trade and Companies Register on 27 June 2006, and took effect on 10 July 2006.
The Parent’s shareholders owning 10% or more of share capital at 31 December 2006 were as follows:
Percentage of
Ownership Corporación Catalana Occidente, S.A. 26.14% La Previsión 96, S.A. 25.00%
The ownership interests of the foregoing shareholders is unchanged relative to 2005.
Inoc, S.A., which owns the entire share capital of the companies listed in the preceding table, has a 51.14% indirect interest in the Parent at 31 December 2006, and belongs to a group headed by CO Sociedad de Gestión y Participación, S.A.
Reserves
The statement of recognised income and expense that forms part of these financial statements give details of the balance of reserves, incorporating accumulated gains, at the start of 2006 and at 31 December 2006, as well as changes in the year and a reconciliation between the opening balance and closing balance for 2006 for all items taken to equity and all types of reserves, reporting all changes in the said balances separately.
The detail of the reserves at 31 December 2006 and 31 December 2005 is as follows:
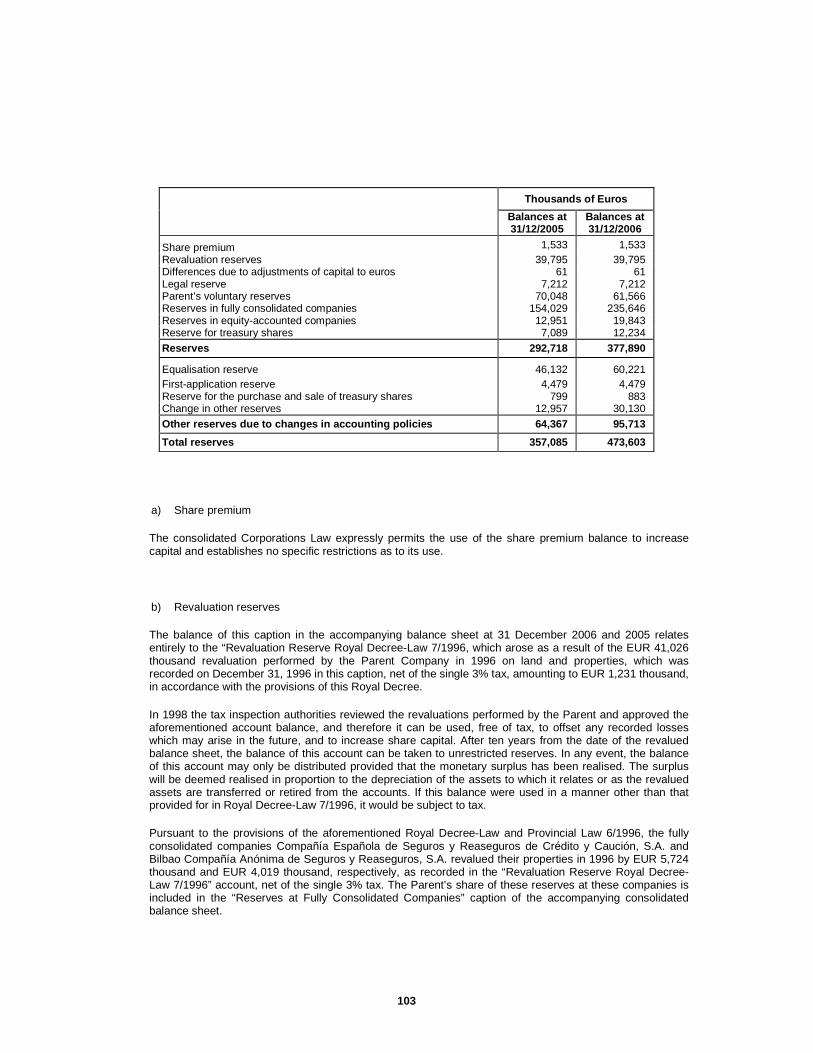
103
Thousands of Euros
Balances at 31/12/2005
Balances at 31/12/2006
Share premium 1,533 1,533 Revaluation reserves 39,795 39,795 Differences due to adjustments of capital to euros 61 61 Legal reserve 7,212 7,212 Parent’s voluntary reserves 70,048 61,566 Reserves in fully consolidated companies 154,029 235,646 Reserves in equity-accounted companies 12,951 19,843 Reserve for treasury shares 7,089 12,234
Reserves 292,718 377,890
Equalisation reserve 46,132 60,221 First-application reserve 4,479 4,479 Reserve for the purchase and sale of treasury shares 799 883 Change in other reserves 12,957 30,130
Other reserves due to changes in accounting policie s 64,367 95,713
Total reserves 357,085 473,603
a) Share premium
The consolidated Corporations Law expressly permits the use of the share premium balance to increase capital and establishes no specific restrictions as to its use.
b) Revaluation reserves
The balance of this caption in the accompanying balance sheet at 31 December 2006 and 2005 relates entirely to the “Revaluation Reserve Royal Decree-Law 7/1996, which arose as a result of the EUR 41,026 thousand revaluation performed by the Parent Company in 1996 on land and properties, which was recorded on December 31, 1996 in this caption, net of the single 3% tax, amounting to EUR 1,231 thousand, in accordance with the provisions of this Royal Decree.
In 1998 the tax inspection authorities reviewed the revaluations performed by the Parent and approved the aforementioned account balance, and therefore it can be used, free of tax, to offset any recorded losses which may arise in the future, and to increase share capital. After ten years from the date of the revalued balance sheet, the balance of this account can be taken to unrestricted reserves. In any event, the balance of this account may only be distributed provided that the monetary surplus has been realised. The surplus will be deemed realised in proportion to the depreciation of the assets to which it relates or as the revalued assets are transferred or retired from the accounts. If this balance were used in a manner other than that provided for in Royal Decree-Law 7/1996, it would be subject to tax.
Pursuant to the provisions of the aforementioned Royal Decree-Law and Provincial Law 6/1996, the fully consolidated companies Compañía Española de Seguros y Reaseguros de Crédito y Caución, S.A. and Bilbao Compañía Anónima de Seguros y Reaseguros, S.A. revalued their properties in 1996 by EUR 5,724 thousand and EUR 4,019 thousand, respectively, as recorded in the “Revaluation Reserve Royal Decree-Law 7/1996” account, net of the single 3% tax. The Parent’s share of these reserves at these companies is included in the “Reserves at Fully Consolidated Companies” caption of the accompanying consolidated balance sheet.

104
c) Differences due to adjustment of share capital to euros
The balance of this reserve arose from the capital reduction carried out in 2001 as a result of the redenomination of share capital into euros. The use of this reserve is subject to the same restrictions as the legal reserve.
d) Legal reserve
Under the consolidated Corporations Law, 10% of profit for each year must be transferred to the legal reserve until the balance of this reserve reaches at least 20% of share capital. The legal reserve can be used to increase capital provided that the remaining reserve balance does not fall below 10% of the increased share capital amount. Otherwise, until the legal reserve exceeds 20% of share capital, it can only be used to offset losses, provided that sufficient other reserves are not available for this purpose. At 31 December 2006 and 2005, the balance of this reserve represents 20% of share capital.
e) Parent’s voluntary reserves
The detail at 31 December 2006 and 2005 (in thousands of euros) was as follows:
Balances at 31/12/2005
Balances at 31/12/2006
Voluntary reserves 59,944 51,462 Merger reserve 9,799 9,799 Other reserves 305 305
Total 70,048 61,566
The balances of these reserves are unrestricted. The merger reserve arose as a result of the absorption of Occidente, Cía. de Seguros y Reaseguros in 1988.
In 2006 four dividends totalling EUR 39,840 thousand were paid, of which EUR 6,720 were paid out of voluntary reserves.
f) Reserves at consolidated companies
The breakdown by company of the balances of this account in the consolidated balance sheet at 31 December 2006 and 2005, net of the effect of the consolidation adjustments, is as follows:

105
Thousands of Euros 31/12/2005 31/12/2006 Fully consolidated companies: Seguros Catalana Occidente, Sociedad Anónima de Seguros y Reaseguros (*) 15,490 115,845 Bilbao Compañía Anónima de Seguros y Reaseguros, S.A. 21,213 9,301 Catoc Vida, S.A. de Seguros 761 1618 Cosalud, S.A. de Seguros 8,006 1,723 Nortehispana, S.A. Cía de Seguros y Reaseguros 26,291 30,104 Depsa, S.A. de Seguros y Reaseguros 9,398 6,753 Compañía Española de Seguros y Reaseguros de Crédito y Caución, S.A. 47,446 47,282 Tecniseguros, Sociedad de Agencia de Seguros, S.A. 50 52 Prepersa, de Peritación de Seguros y Prevención, A.I.E. 298 298 Salerno 94, S.A. 6,353 7,911 Catoc, SICAV, S.A. 17,229 11,888 Inversiones Menéndez Pelayo, SICAV, S.A. 1,494 2,833 C.O. Capital AG. Valores - 38
154,029 235,646 Equity-accounted companies: Baqueira Beret, S.A. 8,643 11,101 Inpisa Dos SICAV, S.A. 2,233 2,455 Hercasol SICAV, S.A. 620 857 Asitur Asistencia, S.A. 1,418 1,535 Calboquer, S.L. 37 62 Atradius AG - 3,833 12,951 19,843
(*) In 2005 the Group reclassified EUR 75,859 thousand, reducing the consolidated reserves of the subsidiary Seguros Catalana Occidente, S.A. de Seguros y Reaseguro, and increasing the Parent’s reserves, as a result of the itemised allocation thereof at 31 December 2005.
g) Reserves for treasury shares
This reserve was recorded pursuant to Article 79 of the consolidated Corporations Law, and it is a restricted reserve, equal to the capitalised value of the Parent’s shares held by Salerno 94, S.A. at year-end. This reserve will become unrestricted when the circumstances which gave rise to it no longer exist.
Reserves due to valuation adjustments and exchange differences
a) Available-for-sale assets and others
This heading basically encompasses the net amount of the changes in the fair value of financial assets classified as available-for-sale which, as stated in Note 4.c.2, must be classified as an integral part of the Group’s consolidated equity. These changes are recognised in the consolidated income statement when the assets giving rise to them are sold.
The changes in the balance under this heading in 2006 and 2005 were as follows:

106
Thousands of Euros Opening balance at 1 January 2005 115,666 Net additions due to the generation of unrealised net gains – available-for-sale portfolio 110,434
Net additions due to the generation of unrealised net gains – equity-accounted investments 1,970
Retirements due to the disposal of financial assets (6,480) Retirements due to allocation to the provision for the share in deferred profit (24,341)
Other changes 388 Closing balance at 31 December 2005 197,637 Net additions due to the generation of unrealised net gains – available-for-sale portfolio 14,142
Net additions due to the generation of unrealised net gains – equity-accounted investments 517
Additions due to the changes in the scope of consolidation – equity-accounted investments 2,639
Changes due to changes in the tax rate 6,029 Retirements due to allocation to the provision for the share in deferred profit 20,130
Reclassification of provision for impairment of financial assets (4,291)
Other changes (391) Closing balance at 31 December 2006 236,412
Exchange differences, arising basically as a result of non-monetary items whose fair value is adjusted against equity are not material and are included jointly in the above table of changes.
Distribution of profit
The distribution of 2006 profit of Grupo Catalana Occidente, Sociedad Anónima that the Board of Directors will propose for approval by shareholders at the Annual General Meeting is as follows:
2006
Distribution Thousands
of Euros To voluntary reserves 16,879 To dividends 48,000
Net profit for the year 64,879
In accordance with the distribution of 2005 net profit approved by shareholders at the General Meeting of the Parent held on 25 May 2006, EUR 14,880 thousand of the net profit of EUR 18,263 thousand was allocated to dividend payments and EUR 3,383 thousand to increased voluntary reserves.
Previously, at a meeting held on 30 March 2006, the Parent’s Board of Directors had approved the distribution of an interim dividend out of 2005 profit for a total amount of EUR 14,880 thousand, which was paid on 12 May 2006.
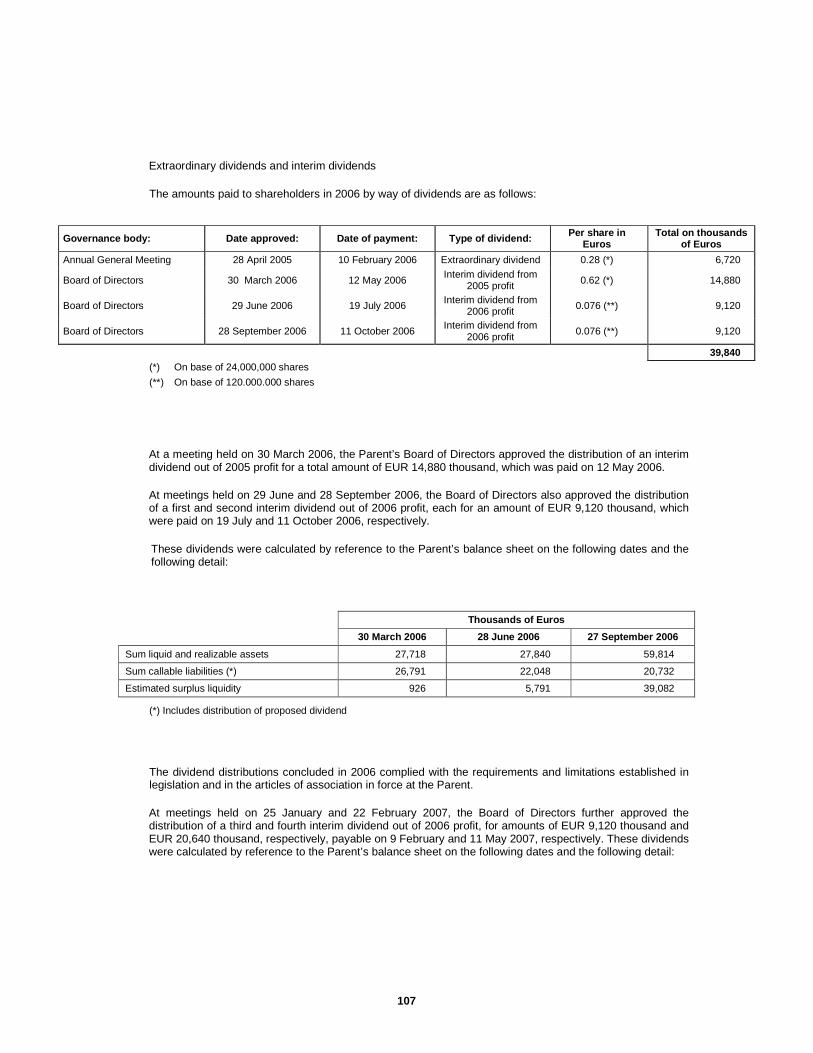
107
Extraordinary dividends and interim dividends
The amounts paid to shareholders in 2006 by way of dividends are as follows:
(*) On base of 24,000,000 shares
(**) On base of 120.000.000 shares
At a meeting held on 30 March 2006, the Parent’s Board of Directors approved the distribution of an interim dividend out of 2005 profit for a total amount of EUR 14,880 thousand, which was paid on 12 May 2006.
At meetings held on 29 June and 28 September 2006, the Board of Directors also approved the distribution of a first and second interim dividend out of 2006 profit, each for an amount of EUR 9,120 thousand, which were paid on 19 July and 11 October 2006, respectively.
These dividends were calculated by reference to the Parent’s balance sheet on the following dates and the following detail:
Thousands of Euros
30 March 2006 28 June 2006 27 September 2006
Sum liquid and realizable assets 27,718 27,840 59,814
Sum callable liabilities (*) 26,791 22,048 20,732
Estimated surplus liquidity 926 5,791 39,082
(*) Includes distribution of proposed dividend
The dividend distributions concluded in 2006 complied with the requirements and limitations established in legislation and in the articles of association in force at the Parent.
At meetings held on 25 January and 22 February 2007, the Board of Directors further approved the distribution of a third and fourth interim dividend out of 2006 profit, for amounts of EUR 9,120 thousand and EUR 20,640 thousand, respectively, payable on 9 February and 11 May 2007, respectively. These dividends were calculated by reference to the Parent’s balance sheet on the following dates and the following detail:
Governance body: Date approved: Date of payment: Type of dividend: Per share in Euros
Total on thousands of Euros
Annual General Meeting 28 April 2005 10 February 2006 Extraordinary dividend 0.28 (*) 6,720
Board of Directors 30 March 2006 12 May 2006 Interim dividend from
2005 profit 0.62 (*) 14,880
Board of Directors 29 June 2006 19 July 2006 Interim dividend from 2006 profit 0.076 (**) 9,120
Board of Directors 28 September 2006 11 October 2006 Interim dividend from
2006 profit 0.076 (**) 9,120
39,840

108
Balances at: (Thousands of Euros)
24 January 2007 21 February 2007
Sum liquid and realisable assets 29,729 36,676
Sum callable liabilities (*) 13,682 35,406
Estimated surplus liquidity 16,047 1,270
(*) Includes distribution of proposed dividend
Treasury shares
The balance under this sub-heading which is recorded with a reduction to the equity attributed to the Parent’s shareholders in the consolidated balance sheet at 31 December 2006 and 2005, in accordance with the presentation requirements under IAS 32, relates to the Grupo Catalana Occidente, S.A. shares owned by the consolidated subsidiary Salerno 94, S.A.
The shares in the Group owned by the subsidiary Salerno 94, S.A. at 31 December 2006 together accounted for 1.6% of share capital at this date (1.45% at 31 December 2005).
In 2006 the percentage of outstanding shares held by the above company ranged from 1.36% to 1.6%, calculated on a daily basis (and from 1.44% to 1.56% in 2005). The average price of period additions was EUR 96.06 per share (for those made prior to the share split), and the average cost price at 31 December 2006 was EUR 6.37 per share. These shares are available for sale with the aim of ensuring liquidity. No other Grupo Catalana Occidente, S.A. shares are held by other Group companies or third parties making use of such shares. In addition, at 31 December 2006 neither the Parent nor any of its subsidiaries had any outstanding commitments for payments in shares of the Parent.
The net earnings in 2006 from transactions involving treasury shares amounting to EUR 883 thousand (EUR 799 thousand in 2005) are recognised in the “Reserves – Other Reserves Due To Application of International Accounting Standards” sub-heading in equity.
The purchases and sales made by Salerno 94, S.A. in 2006 and 2005 were as follows:
Thousands of Euros
Acquisition Cost Par Value
Number of Shares
Balance at 1 January 2005 7,166 561 373,781
Additions 702 20 13,159
Retirements (779) (60) (39,968)
Balance at 31 December 2005 7,089 521 346,972
Additions 5,567 87 57,953
Share split - - 1,537,164
Retirements (422) (31) (20,634)
Balance at 31 December 2006 12,234 577 1,921,455

109
Earnings per share
Basic earnings per share are calculated by dividing the net profit attributable to the Group by the weighted average number of ordinary shares outstanding during the year, excluding the average number of treasury shares held during the year.
The calculation is as follows:
2004 2005 (*) 2005 Change
Net profit for the year attributable to the Parent (Thousands of Euros)
137,591 137,591 191,389 53,798
Weighted average number of shares issued 24,000,000 120,000,000 120,000,000 0
Less: Treasury shares (Thousands of Shares) (347,000) (1,735,000) (1,921,455) -186,455
Weighted average number of shares outstanding (Thousands of Shares) (**) 23,640,000 118,197,500 118,171,773 -25,727
Basic earnings per share (Euros) 5,8203 1,1641 1,6196 0,4555
(*) For purpose of comparison basic earnings per share has been restated to reflect the share split concluded in 2006.
(**) At 1 January 2005, there was a total of 374,000 thousand treasury shares (1,870,000 shares after the split).
Since there are no options on shares, warrants or other equivalent instruments that may cause a potential dilutive effect, the basic earnings per share figure is the same as the diluted earnings per share in the different years presented.
k) Minority interests
The detail, by consolidated company, of the balance of the sub-headings ‘Minority Interests’ and ‘Profit Attributable to Minority Interests’ at 31 December 2006 anode 2005 was as follows:
Thousands of Euros
31/12/2005 31/12/2006 Company
Minority Interests
Profit Attributable to Minority Interests
Minority Interests
Profit Attributable to Minority Interests
Catoc Vida, S.A. de Seguros y Reaseguros 3,724 225 3,661 253
Lepanto, S.A. de Seguros y Reaseguros 226 11 - -
Nortehispana, S.A. de Seguros y Reaseguros 99 32 108 15
Compañía Española de Crédito y Caución, S.A. de Seguros y Rea. 250,660 38,842 424,384 56,725
Bilbao Compañía Anónima de Seguros y Reaseguros, S.A. 666 106 665 125
Catoc SICAV, S.A 8,992
(1,304) 11,672 1,008
Total 264,367 37,912 440,490 58,126
The changes under the sub-heading “Minority Interests” in 2006 and 2005 are shown in the statement of recognised income and expense - changes in consolidated equity.
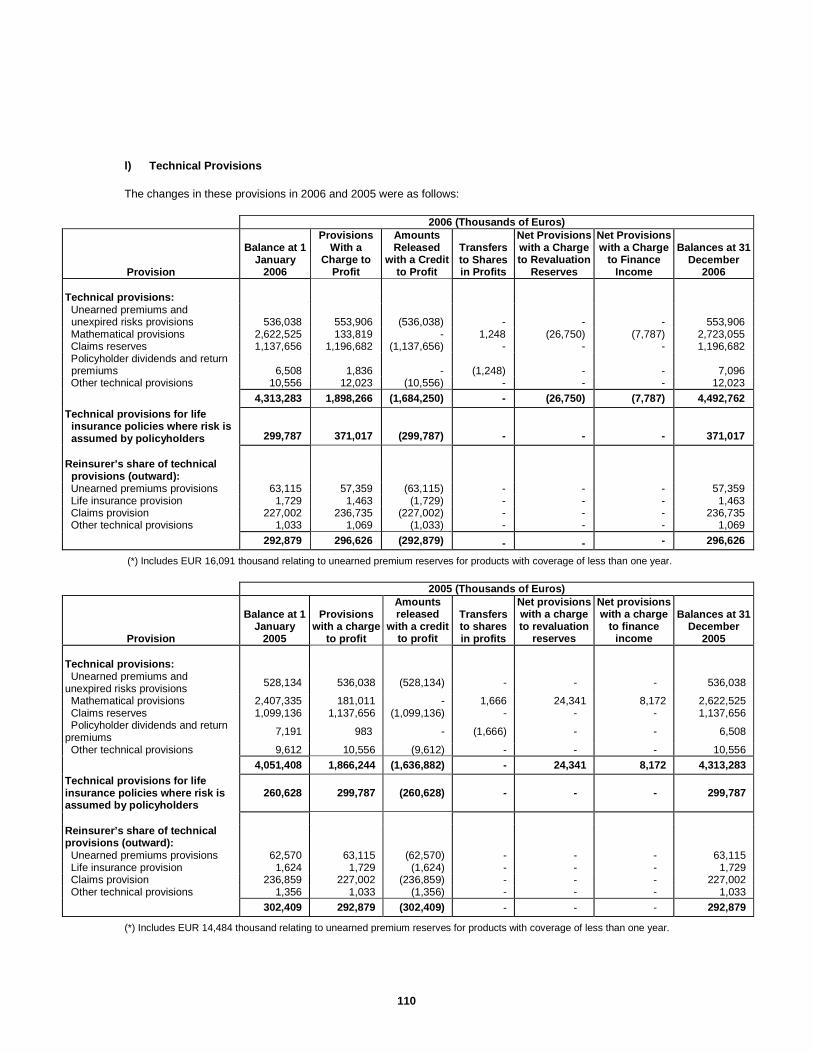
110
l) Technical Provisions
The changes in these provisions in 2006 and 2005 were as follows:
2006 (Thousands of Euros)
Provision
Balance at 1 January
2006
Provisions With a
Charge to Profit
Amounts Released
with a Credit to Profit
Transfers to Shares in Profits
Net Provisions with a Charge to Revaluation
Reserves
Net Provisions with a Charge
to Finance Income
Balances at 31 December
2006 Technical provisions: Unearned premiums and
unexpired risks provisions 536,038 553,906 (536,038) - - - 553,906 Mathematical provisions 2,622,525 133,819 - 1,248 (26,750) (7,787) 2,723,055 Claims reserves 1,137,656 1,196,682 (1,137,656) - - - 1,196,682 Policyholder dividends and return
premiums 6,508 1,836 - (1,248) - - 7,096 Other technical provisions 10,556 12,023 (10,556) - - - 12,023
4,313,283 1,898,266 (1,684,250) - (26,750) (7,787) 4,492,762 Technical provisions for life
insurance policies where risk is assumed by policyholders 299,787 371,017 (299,787) - - - 371,017
Reinsurer’s share of technical
provisions (outward): Unearned premiums provisions 63,115 57,359 (63,115) - - - 57,359 Life insurance provision 1,729 1,463 (1,729) - - - 1,463 Claims provision 227,002 236,735 (227,002) - - - 236,735 Other technical provisions 1,033 1,069 (1,033) - - - 1,069
292,879 296,626 (292,879) - - - 296,626
(*) Includes EUR 16,091 thousand relating to unearned premium reserves for products with coverage of less than one year.
2005 (Thousands of Euros)
Provision
Balance at 1 January
2005
Provisions with a charge
to profit
Amounts released
with a credit to profit
Transfers to shares in profits
Net provisions with a charge to revaluation
reserves
Net provisions with a charge
to finance income
Balances at 31 December
2005 Technical provisions: Unearned premiums and unexpired risks provisions 528,134 536,038 (528,134) - - - 536,038
Mathematical provisions 2,407,335 181,011 - 1,666 24,341 8,172 2,622,525 Claims reserves 1,099,136 1,137,656 (1,099,136) - - - 1,137,656 Policyholder dividends and return premiums 7,191 983 - (1,666) - - 6,508
Other technical provisions 9,612 10,556 (9,612) - - - 10,556
4,051,408 1,866,244 (1,636,882) - 24,341 8,172 4,313,283 Technical provisions for life insurance policies where risk is assumed by policyholders
260,628 299,787 (260,628) - - - 299,787
Reinsurer’s share of technical provisions (outward):
Unearned premiums provisions 62,570 63,115 (62,570) - - - 63,115 Life insurance provision 1,624 1,729 (1,624) - - - 1,729 Claims provision 236,859 227,002 (236,859) - - - 227,002 Other technical provisions 1,356 1,033 (1,356) - - - 1,033
302,409 292,879 (302,409) - - - 292,879
(*) Includes EUR 14,484 thousand relating to unearned premium reserves for products with coverage of less than one year.

111
In certain life insurance lines marketed by Seguros Catalana Occidente, S.A. de Seguros y Reaseguros and Catoc Vida, S.A. de Seguros y Reaseguros, mainly combined life insurance and retirement insurance, upon expiration of the policy the insureds may choose capital or annuity, where interest is fixed when the policy is taken out. The life insurance provisions recognised at 31 December 2006 include, on the basis of each subsidiary’s past experience and the increased estimated cost involved in the second option, the value of these surrender options amounting to EUR 3,972 thousand. This provision totalled EUR 4,802 thousand at 31 December 2005.
For the various types of Universal insurance and for the periods in which those types of insurance guarantee an interest rate higher than that specified under Article 33.1 of the ROSSP (three or six months), the mathematical reserve for those periods is determined by reference to the highest applicable interest rate published each year by the DGSFP, rather than the guaranteed interest rate. The effect on the consolidated income statement for 2006 of applying the highest interest rate, 2.42%, was the recognition of an expense amounting to EUR 248 thousand (EUR 1,251 thousand at 31 December 2005).
Finally, as of 2006 and on the basis of the DGSFP guidelines, the Group adjusted the interest rates used to calculate the mathematical reserve for all lines of individual insurance and for certain group policies previously treated pursuant to the provisions of article 33.2 a) of the Regulations, implemented by Ministerial Decree of 23 December 1998, and will henceforth use the higher interest rate of 2.42%. The effect of applying the highest interest rate, 2.42% was an additional charge to the mathematical reserve of EUR 7,126 thousand.
The detail of the technical provisions for direct insurance at 31 December 2006, in accordance with the various businesses included in the life and non-life segments, is as follows:
Thousands of Euros Provision at 31 December 2006 Non-Life
Auto Multirisk Other Life Total
Technical provisions: Unearned premiums and unexpired risks
provisions 225,986 161,835 166,085 16,091 569,997
Mathematical provisions - - - 2,706,964 2,706,964 Claims reserves 378,503 131,547 638,695 47,937 1,196,682 Policyholder dividends and return premiums - - 2,673 4,423 7,096 Other technical provisions - - 12,023 - 12,023
604,489 293,382 819,476 2,775,415 4,492,762
Mathematical provisions also include the amount of the unrealised gains arising on the financial assets classified in the available-for-sale portfolios at fair value through profit or loss attributable to the insureds at the year-end. These deferred gains amounted to EUR 85,890 thousand at 31 December 2006 (EUR 119,427 thousand at 31 December 2005) and the changes in such gains in 2006 were as follows:
Deferred share in profits Thousands of Euros
Balance at 1 January 2006 119,427 Net additions due to the allocation of net
unrealised gains for the year against equity (26,750)
Net additions due to the allocation of net unrealised gains for the year with a charge to income
(7,787)
Other changes - Balance at 31 December 2006 84,890

112
Changes in such gains in 2005 were as follows:
Deferred share in profits Thousands of Euros Balance at 1 January 2005 86,914 Net additions due to the allocation of net
unrealised gains for the year against equity 24,341
Net additions due to the allocation of net unrealised gains for the year with a charge to income
8,172
Other changes - Balance at 31 December 2005 119,427
The amount of the provision for deferred policyholder dividends at 31 December 2006 represents an overall allocation of 35.90% (27.67% at 31 December 2005) of the total unrealised gains of the sub portfolios of financial assets associated with insurance contracts with rights to the above policyholder dividends.
The interest assigned to life insurance contracts in 2006 and 2005 amounted to EUR 157,593 thousand and EUR 140,110 thousand respectively.
The detail of technical provisions for direct insurance at 31 December 2005 was as follows:
Thousands of Euros Provision at 31 December 2005 Non-Life
Auto Multirisk Other Life Total
Technical provisions: Unearned premiums and unexpired risks
provisions 218,401 151,410 166,227
14,484 550,522
Mathematical provisions - - - 2,608,041 2,608,041 Claims reserves 375,062 124,945 597,524 40,125 1,137,656 Policyholder dividends and return premiums - - 2,582 3,926 6,508 Other technical provisions - - 10,556 - 10,556
593,463 276,355 776,889 2,666,576 4,313,283
The effect of reinsurance on the income statements for 2006 and 2005 was as follows:
Thousands of Euros
2005 2006
Premiums allocated to outward reinsurance ─ Outward premiums 225,368 219,312 ─ Changes in unearned premiums
provision 132
4,162
Commissions (*) 67,379 70,412
Cost of outward reinsurance 158,121 153,062 Claims relating to reinsurance (*) 121,100 128,908
Total cost of reinsurance 37,021 24,154
(*) The commissions and claims relating to reinsurance are shown in the income statement, netting the headings for net operating expenses and claims incurred in the year less reinsurance, respectively.

113
m) Provisions for liabilities and charges
The detail at 31 December 2006 and 2005 was as follows:
Thousands of Euros 31/12/2005 31/12/2006
Provision for taxes other than income tax 13,508 18,930 Provision for pensions and similar obligations 41,461 43,083 Severance pay 4,637 3,687 Other employee obligations 2,268 2,601 Payables under agreements with insurers 6,851 6,866 Provisions for liabilities 437 437 Other provisions 1,626 2,823 Closing balance 70,788 78,427
No significant claims, rulings or lawsuits that could individually impair or affect the consolidated financial statements are currently pending against the Group, other than those inherent to the insurance business, which are in any case duly assessed and, where applicable, incorporated in claims provisions, nor are there any contingent liabilities that could involve the Group in litigation or result in the imposition of fines or penalties with a material impact on its assets.
At 31 December 2005 and 2006 provisions for taxes included EUR 9,784 thousand relating to the inspection assessment issued in relation to the subsidiary Catoc, SICAV S.A. (see Note 6.h).
A detail of the most significant pension obligations within the Group included under the provision for pensions and similar obligations is as follows:
─ At the end of 2002, Seguros Catalana Occidente, S.A. de Seguros y Reaseguros entered into a new collective bargaining agreement with its employees effective for 2003 through 2006. As a result of this collective bargaining process, the existing obligations were replaced by a single, company-funded, defined-contribution employee welfare and pension system implemented, for current employees, through the “Plan de Pensiones de Empleados de Seguros Catalana Occidente, Sociedad Anónima de Seguros y Reaseguros”, assigned to the pension fund “Catalana Occidente Empleo 1, Fondo de Pensiones”, whereas for the rest of pensioners it continues to be implemented through the relevant insurance contracts with non-group insurance companies. In 2006 and 2005 this subsidiary made contributions to the aforementioned pension plan amounting to EUR 1,581 thousand and EUR 1,710 thousand, respectively, while premiums paid to other Group insurance companies under the insurance policies for the remaining obligations amounted to EUR 173 thousand and EUR 444 thousand in each year.
In addition, on 31 March 2005, the voluntary employee welfare system for the Group’s Management team came into force in order to provide an adequate supplement to the Social Security benefits by taking out a group life insurance contract with Catoc Vida, S.A. de Seguros y Reaseguros, paying a premium of EUR 104 thousand in 2006 (EUR 108 thousand in 2005).
Under the above collective agreement, this company also has obligations for long-service bonuses. The amount provided for in relation to this item at 31 December 2006 and 2005 amounted to EUR 1,525 thousand and EUR 1,520 thousand respectively and formed part of the balance of the heading “Provision for Liabilities and Charges – Other Employee Obligations”.
─ Bilbao Compañía Anónima de Seguros y Reaseguros, S.A. is required to pay for a portion of former employees a fixed life annuity until death of the employee, consisting of the difference between the last salary paid while in service and the social security pension payable at that time. This subsidiary took out a policy where the mathematical provisions calculated at the assumed interest rate of 4% cover the actuarially estimated liabilities in connection with these benefits to former employees.
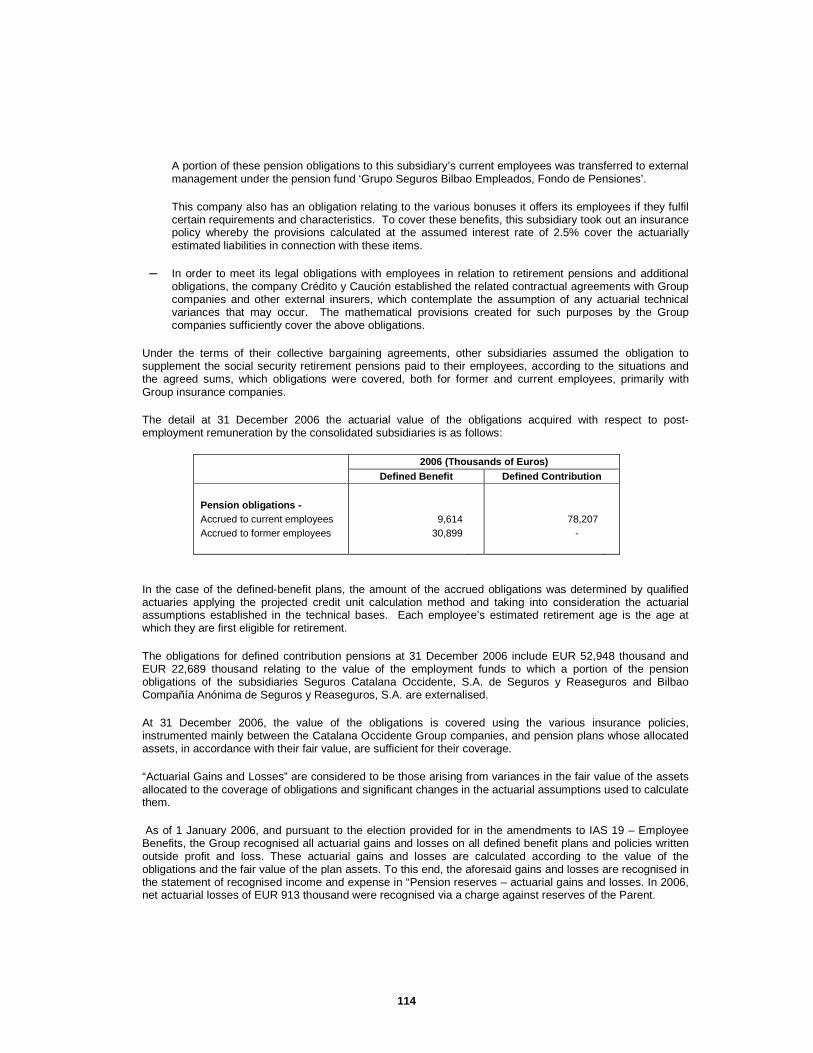
114
A portion of these pension obligations to this subsidiary’s current employees was transferred to external management under the pension fund ‘Grupo Seguros Bilbao Empleados, Fondo de Pensiones’.
This company also has an obligation relating to the various bonuses it offers its employees if they fulfil certain requirements and characteristics. To cover these benefits, this subsidiary took out an insurance policy whereby the provisions calculated at the assumed interest rate of 2.5% cover the actuarially estimated liabilities in connection with these items.
─ In order to meet its legal obligations with employees in relation to retirement pensions and additional obligations, the company Crédito y Caución established the related contractual agreements with Group companies and other external insurers, which contemplate the assumption of any actuarial technical variances that may occur. The mathematical provisions created for such purposes by the Group companies sufficiently cover the above obligations.
Under the terms of their collective bargaining agreements, other subsidiaries assumed the obligation to supplement the social security retirement pensions paid to their employees, according to the situations and the agreed sums, which obligations were covered, both for former and current employees, primarily with Group insurance companies.
The detail at 31 December 2006 the actuarial value of the obligations acquired with respect to post-employment remuneration by the consolidated subsidiaries is as follows:
2006 (Thousands of Euros) Defined Benefit Defined Contribution Pension obligations -
Accrued to current employees 9,614 78,207 Accrued to former employees 30,899 -
In the case of the defined-benefit plans, the amount of the accrued obligations was determined by qualified actuaries applying the projected credit unit calculation method and taking into consideration the actuarial assumptions established in the technical bases. Each employee’s estimated retirement age is the age at which they are first eligible for retirement.
The obligations for defined contribution pensions at 31 December 2006 include EUR 52,948 thousand and EUR 22,689 thousand relating to the value of the employment funds to which a portion of the pension obligations of the subsidiaries Seguros Catalana Occidente, S.A. de Seguros y Reaseguros and Bilbao Compañía Anónima de Seguros y Reaseguros, S.A. are externalised.
At 31 December 2006, the value of the obligations is covered using the various insurance policies, instrumented mainly between the Catalana Occidente Group companies, and pension plans whose allocated assets, in accordance with their fair value, are sufficient for their coverage.
“Actuarial Gains and Losses” are considered to be those arising from variances in the fair value of the assets allocated to the coverage of obligations and significant changes in the actuarial assumptions used to calculate them.
As of 1 January 2006, and pursuant to the election provided for in the amendments to IAS 19 – Employee Benefits, the Group recognised all actuarial gains and losses on all defined benefit plans and policies written outside profit and loss. These actuarial gains and losses are calculated according to the value of the obligations and the fair value of the plan assets. To this end, the aforesaid gains and losses are recognised in the statement of recognised income and expense in “Pension reserves – actuarial gains and losses. In 2006, net actuarial losses of EUR 913 thousand were recognised via a charge against reserves of the Parent.
115
n) Information on insurance contracts in the primar y segments
Breakdown of insurance business
The total volume of direct and inward reinsurance premiums accrued in 2006 and 2005 amounted to EUR 1,941,488 thousand and EUR 1,859,269 thousand respectively. In addition, the Group managed certain pension plan and mutual fund contributions not recognised in the consolidated income statement in the amounts of EUR 137,928 thousand and EUR 96,832 thousand in 2006 and 2005 respectively.
The detail of premiums written in 2006, and all other income and expense items, in accordance with the main defined segments and subsegements is as follows:
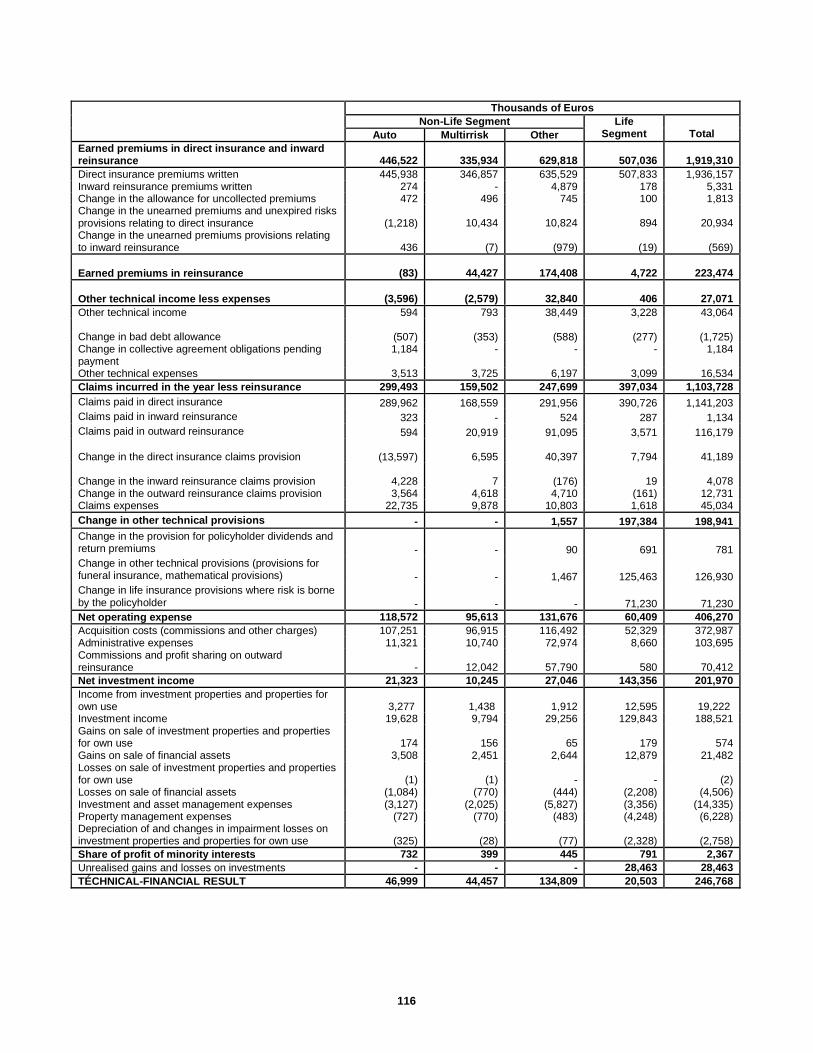
116
Thousands of Euros Non-Life Segment
Auto Multirris k Other Life
Segment Total Earned premiums in direct insurance and inward reinsurance 446,522 335,934 629,818 507,036 1,919,310 Direct insurance premiums written 445,938 346,857 635,529 507,833 1,936,157 Inward reinsurance premiums written 274 - 4,879 178 5,331 Change in the allowance for uncollected premiums 472 496 745 100 1,813 Change in the unearned premiums and unexpired risks provisions relating to direct insurance
(1,218) 10,434 10,824 894 20,934
Change in the unearned premiums provisions relating to inward reinsurance 436
(7)
(979)
(19)
(569)
Earned premiums in reinsurance
(83) 44,427 174,408 4,722 223,474
Other technical income less expenses
(3,596)
(2,579)
32,840
406
27,071 Other technical income 594 793 38,449 3,228 43,064
Change in bad debt allowance
(507)
(353)
(588)
(277)
(1,725) Change in collective agreement obligations pending payment
1,184 - - - 1,184
Other technical expenses 3,513 3,725 6,197 3,099 16,534 Claims incurred in the year less reinsurance 299,493 159,502 247,699 397,034 1,103,728 Claims paid in direct insurance 289,962 168,559 291,956 390,726 1,141,203 Claims paid in inward reinsurance 323 - 524 287 1,134 Claims paid in outward reinsurance 594 20,919 91,095 3,571 116,179
Change in the direct insurance claims provision
(13,597) 6,595 40,397 7,794 41,189
Change in the inward reinsurance claims provision 4,228 7
(176) 19 4,078 Change in the outward reinsurance claims provision 3,564 4,618 4,710 (161) 12,731 Claims expenses 22,735 9,878 10,803 1,618 45,034 Change in other technical provisions - - 1,557 197,384 198,941 Change in the provision for policyholder dividends and return premiums - - 90 691 781 Change in other technical provisions (provisions for funeral insurance, mathematical provisions) - - 1,467 125,463 126,930 Change in life insurance provisions where risk is borne by the policyholder - - - 71,230 71,230 Net operating expense 118,572 95,613 131,676 60,409 406,270 Acquisition costs (commissions and other charges) 107,251 96,915 116,492 52,329 372,987 Administrative expenses 11,321 10,740 72,974 8,660 103,695 Commissions and profit sharing on outward reinsurance - 12,042 57,790 580 70,412 Net investment income 21,323 10,245 27,046 143,356 201,970 Income from investment properties and properties for own use 3,277 1,438 1,912 12,595 19,222 Investment income 19,628 9,794 29,256 129,843 188,521 Gains on sale of investment properties and properties for own use 174 156 65 179 574 Gains on sale of financial assets 3,508 2,451 2,644 12,879 21,482 Losses on sale of investment properties and properties for own use (1) (1) - - (2) Losses on sale of financial assets (1,084) (770) (444) (2,208) (4,506) Investment and asset management expenses (3,127) (2,025) (5,827) (3,356) (14,335) Property management expenses (727) (770) (483) (4,248) (6,228) Depreciation of and changes in impairment losses on investment properties and properties for own use
(325)
(28)
(77)
(2,328)
(2,758)
Share of profit of minority interests 732 399 445 791 2,367 Unrealised gains and losses on investments - - - 28,463 28,463 TÉCHNICAL-FINANCIAL RESULT 46,999 44,457 134,809 20,503 246,768

117
The other technical income attributed to the Non-Life segment is basically due to the income from recoveries due to reports issued at the company Compañía Española de Crédito y Caución, S.A. de Seguros y Reaseguros. The other technical expenses relate to the portion of general expenses borne by the Group which must be considered as technical expenses.
The income statement for the “Other Activities” segment includes, under the sub-headings “Operating Income” and “Operating Expenses”, the following income and expense items:
Thousands of Euros
Thousands of Euros Operating Income -
2006 Other Activities Segment
Operating Expenses - 2006 Other Activities
Segment
Income due to the administration of pension funds
222 Tax provisions 7,019
Collection premiums 341 Allocated personnel expenses
5,901
Income preparation of reports Crédito y Caución
1,538 Other administrative expenses
1,644
Other income 1,553 Other expenses 1,953 Total 3,654 Total 16,517
For presentation purposes, the net operating income and expenses of the Other activities segment is included, at net value, under the sub-heading “Other income less expenses” of the consolidated incomes statement.
Breakdown of the life business by premium volume
The breakdown in 2006 and 2005 of the life business (direct insurance), by premium volume, was as follows:
Thousands of Euros Life Insurance Premiums (Direct) 2005 2006
Premiums for individual contracts 455,711 482,969 Premiums for group insurance contracts 32,986 24,864
488,697 507,833 Regular premiums 387,220 415,667 Single premiums 101,477 92,166
488,697 507,833 Premiums for contracts without policyholder dividends 145,402 147,792 Premiums for contracts with policyholder dividends (1) 268,470 257,675 Premiums for contracts where risk is borne by the policyholder 74,825 102,366
488,697 507,833
(1) Includes insurance contracts with a spread between the guaranteed interest rate and the interest rate per the technical bases.

118
Technical conditions for the main types of life insurance
The technical conditions for the main types of life insurance, which account for more than 5% of life insurance premiums or provisions, are as follows:
Miles de Euros
2005 2006
Type of Insurance and Coverage
Assumed Interest
Rate Mortality Table (*) Premiums
Mathematical Provision (*)
Policyholder Dividends
Paid Premiums Mathematical Provision (*)
Policyholder Dividends
Paid Universal Jubilación GKM-80 32,437 332,916 511 29,778 340,881 568 Claims payable upon
retirement (capital or annuity)
Index-linked and 5%
Universal Vida y Jubilación
GKM-80 24,411 292,106 376 23,399 293,292 368
Same as above, plus capital upon death if prior to retirement
Index-linked .3% and 5%
Universal Vida y Pensión
GKM-80 40,042 280,002 362 37,566 296,646 401
Same as above.
Index-linked. 3.5%
and 5% Universal Ahorro Previsión
Index-linked GKM-80 53,797 131,049 975 44,910 144,771 1146
Same as above. Seguro Colectivo de Jubilación con Participación en Beneficios Claims payable upon retirement (capital or annuity)
2.25, 3.5 and 5% and
matched transactions
GRM-70; GRM-80-2; GRM/F-95;
PERM/F2000P
18,595 391,117 201 7,578 395,484 716
Flexivida Seguros Bilbao
5.47% GKM-70/ 80 16,898 176,635 - 16,659 176,733 -
Plan de Jubilación Seguros Bilbao
4.44% GRM-70 / 80 / 95 28,317 156,930 308 27,750 165,081 351
Cuenta ahorro seguro Seguros Bilbao
Index-linked GKM - 80 30,704 46,825 - 37,784 65,211 -
Nortehispana Pensiones
6. 4. 3. 2% GRM – 95 5,487 59,323 1,634 12,340 98,086 2,042
Deferred annuity with policyholder dividends
(*) The mortality tables specified in the Technical Bases used by the subsidiaries to calculate their life insurance provisions. Additional reserves are recorded to adapt to the new PERM/F-2000 and GRM/F – 95 tables (see Note 3.i).
The policyholder dividends are allocated, for all types of individual life insurance and certain group life insurance policies, through increases in the life insurance provision in accordance with the term of the various policies. Policyholder dividends for the group life risk business are allocated to the policyholders through premium reductions upon renewal of the policy. Dividends accrued to insured’s or policyholders but not yet allocated are recognised in the sub-heading “Technical Provisions – Reserves for Policyholder Dividends and Return Premiums”.

119
Pursuant to the provisions of the current ROSSP, the assumed interest rate used to calculate the life insurance provision was as follows:
a) For obligations assumed since 1 January 1999, in respect of insurance policies with assigned (matched) investments, the subsidiaries have used the interest rate set forth in the technical bases (based on the internal rate of return on such investments). For policies without matched investments the interest rate used was the rate set by the Directorate-General of Insurance and Pension Funds for both 2006 and 2005 (2.42%).
b) For obligations assumed prior to 1 January 1999, the mathematical provisions continue to be calculated at the same assumed interest rate as that used to calculate the premium, up to the limit of the actual return obtained or expected from the investments assigned to meet coverage requirements in respect of these provisions. Since the rate of return on the investments assigned for this purpose in 2006 and 2005 exceeded the established assumed interest rate, no additional provision was required due to a shortfall in returns, except for certain types of policies issued by the subsidiary Bilbao Compañía Anónima de Seguros y Reaseguros, S.A. in which the actual rate of return obtained was not sufficient to meet also the future administrative expenses relating to such policies. To cover these expenses the subsidiary had a EUR 8,463 thousand provision at 31 December 2006 (EUR 10,029 thousand at 31 December 2005).
Change in claims provision
Changes in the claims provision (for direct insurance) made at various dates, on a claims occurrence basis, according to claims paid and the reserve available for such claims following the year-ends were as follows:

120
AUTO OTHER MULTIRISK
Claims
Occurred up to 31
December 2003
Claims Occurred in 2004
Claims Occurred in 2005
Claims Occurred up to 31
December 2003
Claims Occurred in 2004
Claims Occurred in 2005
Claims Occurred up to 31
December 2003
Claims Occurred in 2004
Claims Occurred in 2005
Initially estimated claims provision (*)
381,086 207,223 175,219 480,044 316,793 324,896 97,797 55,993 66,714
Accumulated amounts paid:
One year later 156,659 82,956 82,965 213,370 232,115 223,221 40,704 28,776 37,929 Two years later 211,169 104,130 - 248,558 205,579 - 51,484 31,553 - Three years later 234,098 - - 263,173 - - 55,789 - - Re-estimated reserve: One year later 183,664 78,188 65,007 207,362 58,455 38,452 47,032 14,368 15,069 Two years later 111,435 37,857 - 170,601 48,547 - 34,640 10,144 - Three years later 69,961 - - 149,941 - - 30,280 -
Accumulated (Deficit) / Surplus
77,027 65,236 27,247 66,930 62,667 63,223 11,728 14,296 13,716
In percentage terms 20.2% 31.5% 15.6% 13.9% 19.8% 19.5% 12.0% 25.5% 20.6%
(*) Not including the technical provision for claims settlement expenses.
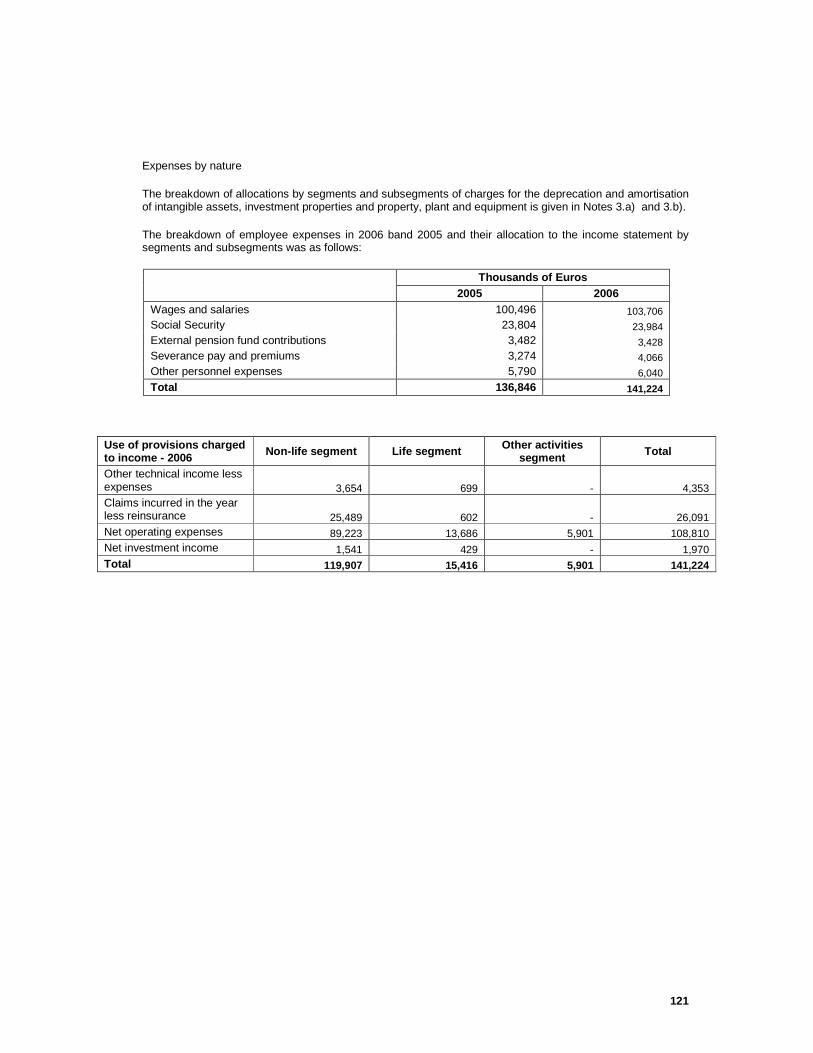
121
Expenses by nature
The breakdown of allocations by segments and subsegments of charges for the deprecation and amortisation of intangible assets, investment properties and property, plant and equipment is given in Notes 3.a) and 3.b).
The breakdown of employee expenses in 2006 band 2005 and their allocation to the income statement by segments and subsegments was as follows:
Thousands of Euros
2005 2006 Wages and salaries 100,496 103,706 Social Security 23,804 23,984 External pension fund contributions 3,482 3,428 Severance pay and premiums 3,274 4,066 Other personnel expenses 5,790 6,040 Total 136,846 141,224
Use of provisions charged to income - 2006
Non-life segment Life segment Other activities segment
Total
Other technical income less expenses 3,654 699 - 4,353 Claims incurred in the year less reinsurance 25,489 602 - 26,091 Net operating expenses 89,223 13,686 5,901 108,810 Net investment income 1,541 429 - 1,970 Total 119,907 15,416 5,901 141,224
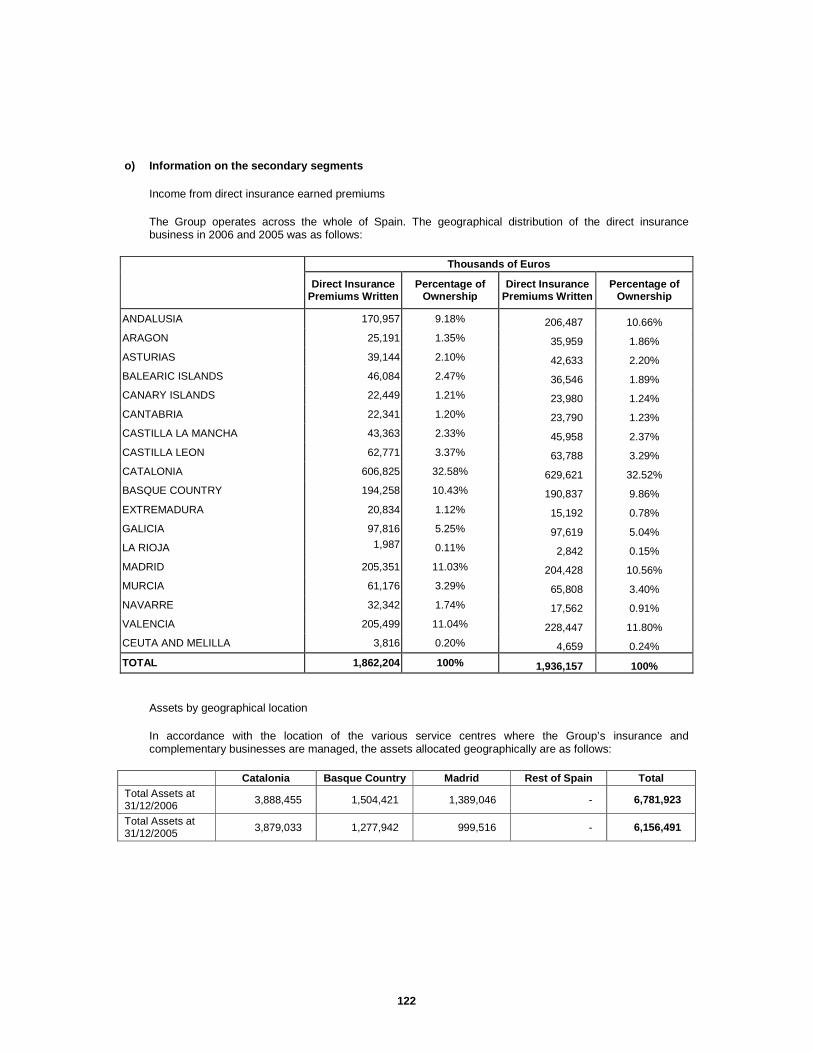
122
o) Information on the secondary segments
Income from direct insurance earned premiums
The Group operates across the whole of Spain. The geographical distribution of the direct insurance business in 2006 and 2005 was as follows:
Thousands of Euros
Direct Insurance Premiums Written
Percentage of Ownership
Direct Insurance Premiums Written
Percentage of Ownership
ANDALUSIA 170,957 9.18% 206,487 10.66%
ARAGON 25,191 1.35% 35,959 1.86%
ASTURIAS 39,144 2.10% 42,633 2.20%
BALEARIC ISLANDS 46,084 2.47% 36,546 1.89%
CANARY ISLANDS 22,449 1.21% 23,980 1.24%
CANTABRIA 22,341 1.20% 23,790 1.23%
CASTILLA LA MANCHA 43,363 2.33% 45,958 2.37%
CASTILLA LEON 62,771 3.37% 63,788 3.29%
CATALONIA 606,825 32.58% 629,621 32.52%
BASQUE COUNTRY 194,258 10.43% 190,837 9.86%
EXTREMADURA 20,834 1.12% 15,192 0.78%
GALICIA 97,816 5.25% 97,619 5.04%
LA RIOJA 1,987 0.11% 2,842 0.15%
MADRID 205,351 11.03% 204,428 10.56%
MURCIA 61,176 3.29% 65,808 3.40%
NAVARRE 32,342 1.74% 17,562 0.91%
VALENCIA 205,499 11.04% 228,447 11.80%
CEUTA AND MELILLA 3,816 0.20% 4,659 0.24%
TOTAL 1,862,204 100% 1,936,157 100%
Assets by geographical location
In accordance with the location of the various service centres where the Group’s insurance and complementary businesses are managed, the assets allocated geographically are as follows:
Catalonia Basque Country Madrid Rest of Spain Total Total Assets at 31/12/2006 3,888,455 1,504,421 1,389,046 - 6,781,923
Total Assets at 31/12/2005 3,879,033 1,277,942 999,516 - 6,156,491
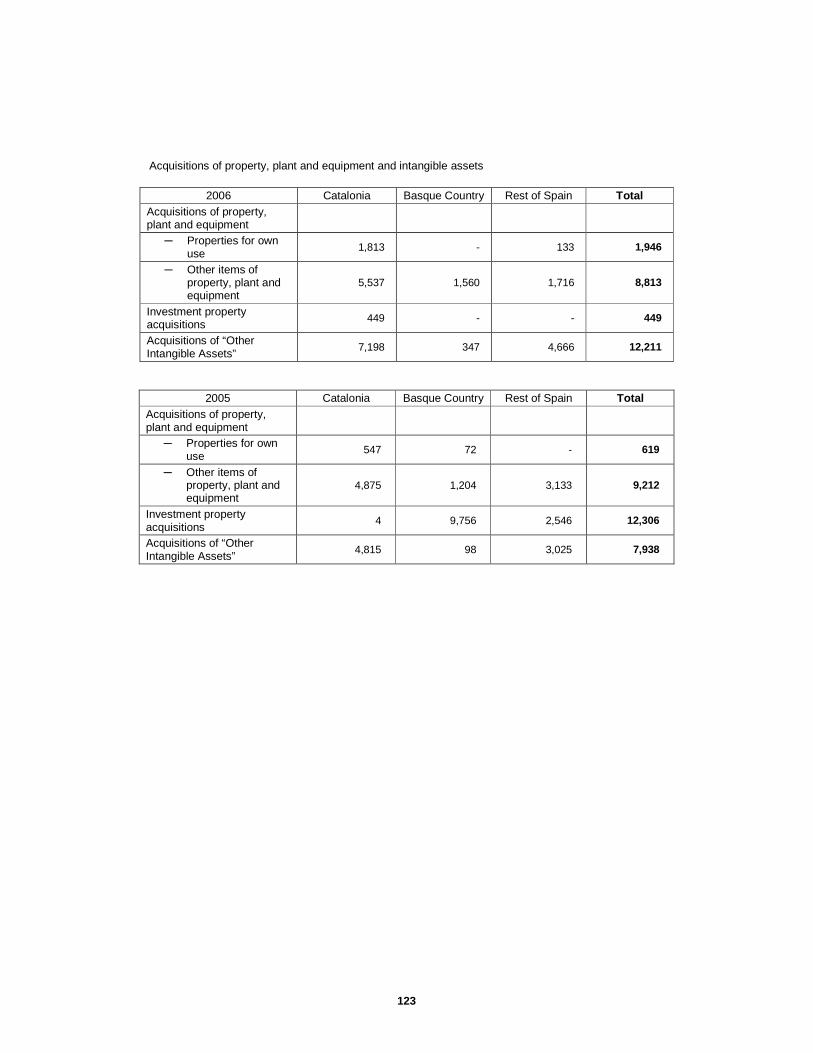
123
Acquisitions of property, plant and equipment and intangible assets
2006 Catalonia Basque Country Rest of Spain Total Acquisitions of property, plant and equipment
─ Properties for own use
1,813 - 133 1,946
─ Other items of property, plant and equipment
5,537 1,560 1,716 8,813
Investment property acquisitions
449 - - 449
Acquisitions of “Other Intangible Assets”
7,198 347 4,666 12,211
2005 Catalonia Basque Country Rest of Spain Total Acquisitions of property, plant and equipment
─ Properties for own use
547 72 - 619
─ Other items of property, plant and equipment
4,875 1,204 3,133 9,212
Investment property acquisitions
4 9,756 2,546 12,306
Acquisitions of “Other Intangible Assets”
4,815 98 3,025 7,938

124
p) Breakdowns of related parties
Transactions between consolidated Group companies
The detail of the main transactions carried out in 2006 is as follows:
Thousands of Euros
Balances per Balance Sheet at 31 December
2006
Income Expenses Receivables Payables Technical Provisions
Seguros Catalana Occidente, Sociedad Anónima de Seguros y Reaseguros’ outward reinsurance to: Depsa S.A. de Seguros y Reaseguros 8,469 10,771 - 1,674 20,538 Nortehispana, de Seguros y Reaseguros, S.A. 1,291 2,583 67 - 492 Seguros Catalana Occidente’s inward reinsurance from: 17,617 9,891 2,077 216 8,974 Compañía Española de Seguros y Reaseguros de Crédito y Caución, S.A.
Group policies written by Depsa, S.A. de Seguros y Reaseguros with Catoc Vida, Sociedad Anónima de Seguros y Reaseguros 131 75 - - 844
Group policies written by Nortehispana, de Seguros y Reaseguros with Catoc Vida, Sociedad Anónima de Seguros y Reaseguros
14 92 - - 1,344
Group policies written by Seguros Catalana Occidente, Sociedad Anónima de Seguros y Reaseguros with Catoc Vida, Sociedad Anónima de Seguros y Reaseguros 2,031 257 - - 21,014
Group policies written by Catoc Vida, Sociedad Anónima de Seguros y Reaseguros with Seguros Catalana Occidente, Sociedad Anónima de Seguros y Reaseguros 6 - - - 738 Group policies written by Depsa, S.A de Seguros y Reaseguros with Seguros Catalana Occidente, S.A. de Seguros y Reaseguros
41 29 - - 506
Group policies written by Cosalud, S.A. de Seguros with Seguros Catalana Occidente, Sociedad Anónima de Seguros y Reaseguros
- - - - 83
Group policies written by Compañía Española de Crédito y Caución, S.A. with Seguros Catalana Occidente, S.A. de Seguros y Reaseguros
1,084 402 - - 10,363
Group policies written by Baqueira Beret, S.A. with Seguros Catalana Occidente, S.A. de Seguros y Reaseguros
2 202 - - 730
Consolidated taxation with Grupo Catalana Occidente, Sociedad Anónima (2005): Catoc Vida, Sociedad Anónima de Seguros y Reaseguros 616 Cosalud, S.A. de Seguros 1,420 Depsa, Sociedad Anónima de Seguros y Reaseguros 1,438 Nortehispana, de Seguros y Reaseguros, S.A. 3,306 Tecniseguros, Sociedad de Agencia de Seguros 2 Salerno 94, S.A. 581 Catalana Occidente Capital, Agencia de Valores, S.A. 178 Seguros Catalana Occidente, Sociedad Anónima de Seguros y Reaseguros - 9,872 Other current transactions: Seguros Catalana Occidente, S.A. de Seguros y Reaseguros with Grupo Catalana Occidente, S.A. 225 - 101 Seguros Catalana Occidente, S.A. de Seguros y Reaseguros with Prepersa de Peritación de Seguros y Prevención, A..I.E. - - - 94 Seguros Catalana Occidente, S.A. de Seguros y Reaseguros with Tecniseguros, S.A. 146 Seguros Catalana Occidente, S.A. de Seguros y Reaseguros with Baqueira Beret, S.A - - 77 - Grupo Catalana Occidente, S.A. with Seguros Catalana Occidente, S.A. de Seguros y Reaseguros and Bilbao Compañía Anómina de Seguros y Reaseguros (loans). - 2,234 125,064 -
All significant intra-group transactions were duly eliminated in consolidation.
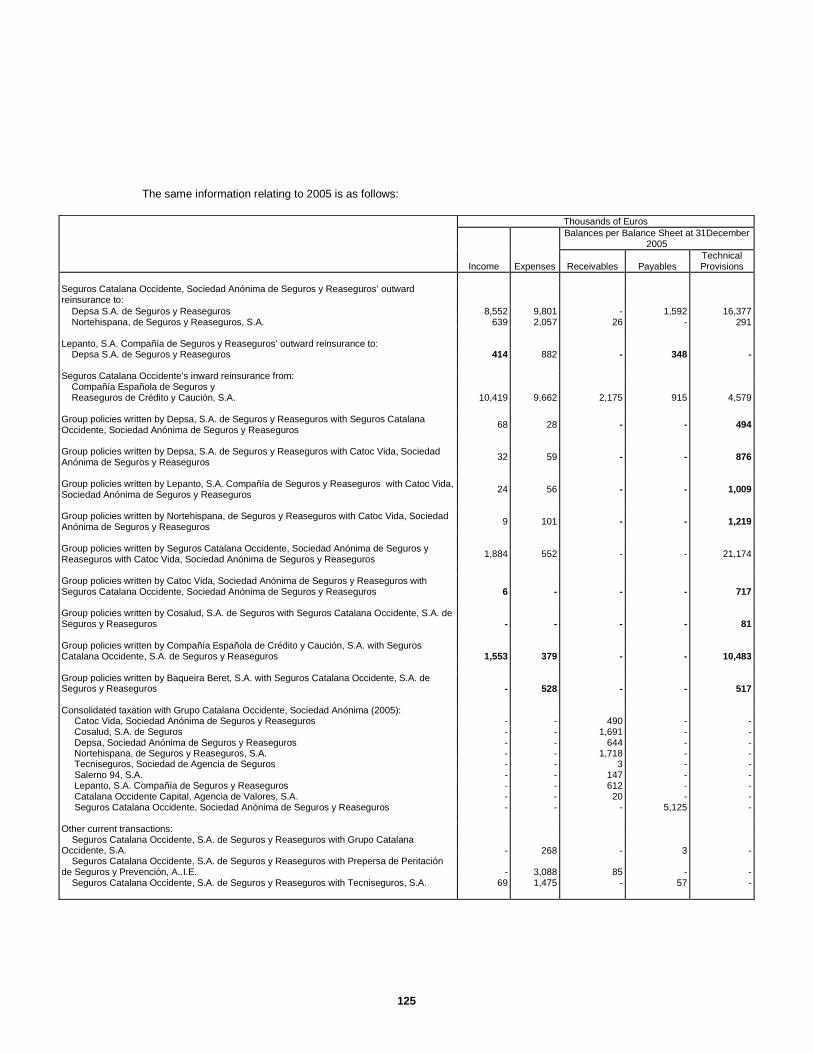
125
The same information relating to 2005 is as follows:
Thousands of Euros
Balances per Balance Sheet at 31December
2005
Income Expenses Receivables Payables Technical Provisions
Seguros Catalana Occidente, Sociedad Anónima de Seguros y Reaseguros’ outward reinsurance to: Depsa S.A. de Seguros y Reaseguros 8,552 9,801 - 1,592 16,377 Nortehispana, de Seguros y Reaseguros, S.A. 639 2,057 26 - 291 Lepanto, S.A. Compañía de Seguros y Reaseguros’ outward reinsurance to: Depsa S.A. de Seguros y Reaseguros 414 882 - 348 - Seguros Catalana Occidente’s inward reinsurance from: Compañía Española de Seguros y Reaseguros de Crédito y Caución, S.A. 10,419 9,662 2,175 915 4,579 Group policies written by Depsa, S.A. de Seguros y Reaseguros with Seguros Catalana Occidente, Sociedad Anónima de Seguros y Reaseguros 68 28 - - 494
Group policies written by Depsa, S.A. de Seguros y Reaseguros with Catoc Vida, Sociedad Anónima de Seguros y Reaseguros 32 59 - - 876
Group policies written by Lepanto, S.A. Compañía de Seguros y Reaseguros with Catoc Vida, Sociedad Anónima de Seguros y Reaseguros 24 56 - - 1,009
Group policies written by Nortehispana, de Seguros y Reaseguros with Catoc Vida, Sociedad Anónima de Seguros y Reaseguros 9 101 - - 1,219
Group policies written by Seguros Catalana Occidente, Sociedad Anónima de Seguros y Reaseguros with Catoc Vida, Sociedad Anónima de Seguros y Reaseguros 1,884 552 - - 21,174
Group policies written by Catoc Vida, Sociedad Anónima de Seguros y Reaseguros with Seguros Catalana Occidente, Sociedad Anónima de Seguros y Reaseguros 6 - - - 717 Group policies written by Cosalud, S.A. de Seguros with Seguros Catalana Occidente, S.A. de Seguros y Reaseguros - - - - 81 Group policies written by Compañía Española de Crédito y Caución, S.A. with Seguros Catalana Occidente, S.A. de Seguros y Reaseguros 1,553 379 - - 10,483 Group policies written by Baqueira Beret, S.A. with Seguros Catalana Occidente, S.A. de Seguros y Reaseguros - 528 - - 517 Consolidated taxation with Grupo Catalana Occidente, Sociedad Anónima (2005): Catoc Vida, Sociedad Anónima de Seguros y Reaseguros - - 490 - - Cosalud, S.A. de Seguros - - 1,691 - - Depsa, Sociedad Anónima de Seguros y Reaseguros - - 644 - - Nortehispana, de Seguros y Reaseguros, S.A. - - 1,718 - - Tecniseguros, Sociedad de Agencia de Seguros - - 3 - - Salerno 94, S.A. - - 147 - - Lepanto, S.A. Compañía de Seguros y Reaseguros - - 612 - - Catalana Occidente Capital, Agencia de Valores, S.A. - - 20 - - Seguros Catalana Occidente, Sociedad Anónima de Seguros y Reaseguros - - - 5,125 - Other current transactions: Seguros Catalana Occidente, S.A. de Seguros y Reaseguros with Grupo Catalana Occidente, S.A. - 268 - 3 - Seguros Catalana Occidente, S.A. de Seguros y Reaseguros with Prepersa de Peritación de Seguros y Prevención, A..I.E. - 3,088 85 - - Seguros Catalana Occidente, S.A. de Seguros y Reaseguros with Tecniseguros, S.A. 69 1,475 - 57 -
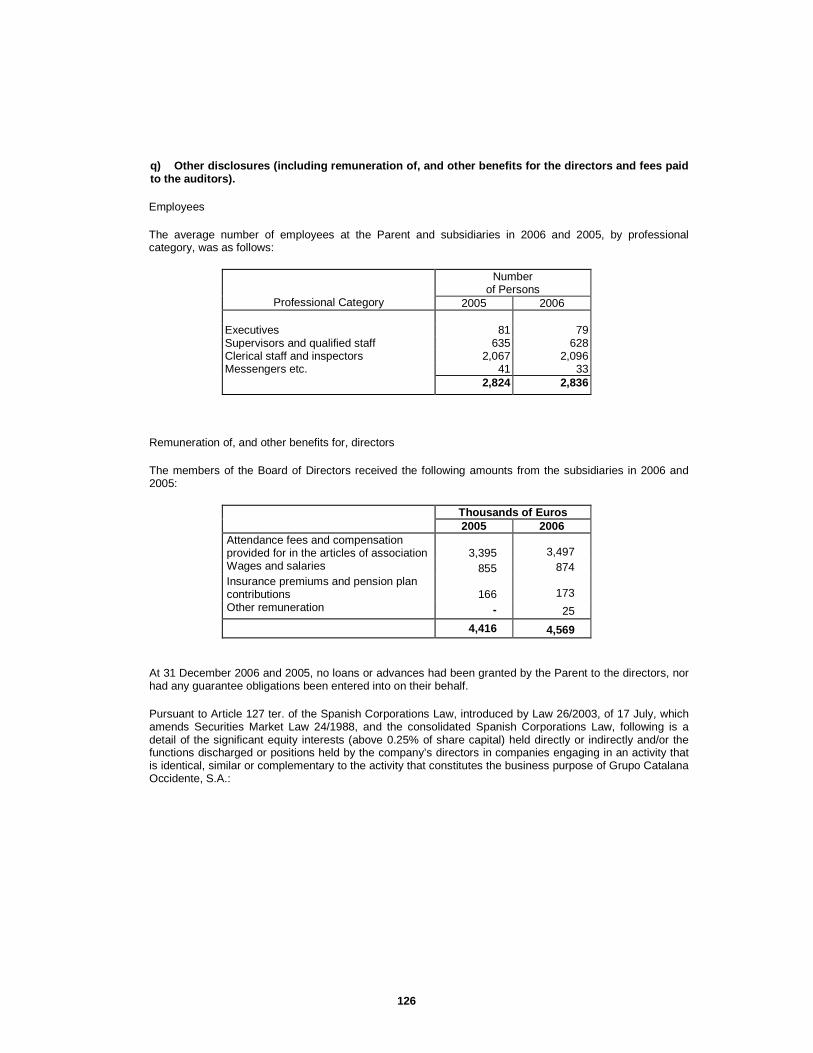
126
q) Other disclosures (including remuneration of, an d other benefits for the directors and fees paid to the auditors).
Employees
The average number of employees at the Parent and subsidiaries in 2006 and 2005, by professional category, was as follows:
Number of Persons
Professional Category 2005 2006 Executives 81 79 Supervisors and qualified staff 635 628 Clerical staff and inspectors 2,067 2,096 Messengers etc. 41 33 2,824 2,836
Remuneration of, and other benefits for, directors
The members of the Board of Directors received the following amounts from the subsidiaries in 2006 and 2005:
Thousands of Euros 2005 2006 Attendance fees and compensation provided for in the articles of association 3,395 3,497 Wages and salaries 855 874 Insurance premiums and pension plan contributions 166 173 Other remuneration - 25 4,416 4,569
At 31 December 2006 and 2005, no loans or advances had been granted by the Parent to the directors, nor had any guarantee obligations been entered into on their behalf.
Pursuant to Article 127 ter. of the Spanish Corporations Law, introduced by Law 26/2003, of 17 July, which amends Securities Market Law 24/1988, and the consolidated Spanish Corporations Law, following is a detail of the significant equity interests (above 0.25% of share capital) held directly or indirectly and/or the functions discharged or positions held by the company’s directors in companies engaging in an activity that is identical, similar or complementary to the activity that constitutes the business purpose of Grupo Catalana Occidente, S.A.:
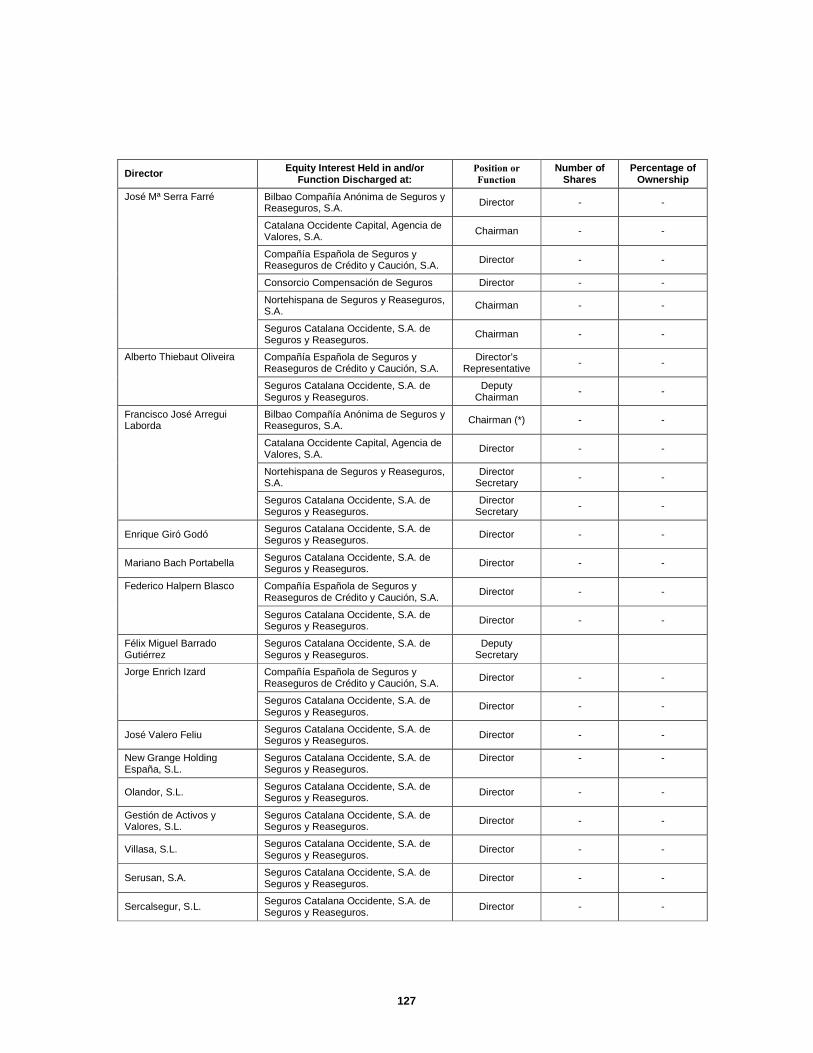
127
Director Equity Interest Held in and/or Function Discharged at:
Position or
Function Number of
Shares Percentage of
Ownership
Bilbao Compañía Anónima de Seguros y Reaseguros, S.A. Director - -
Catalana Occidente Capital, Agencia de Valores, S.A.
Chairman - -
Compañía Española de Seguros y Reaseguros de Crédito y Caución, S.A. Director - -
Consorcio Compensación de Seguros Director - -
Nortehispana de Seguros y Reaseguros, S.A.
Chairman - -
José Mª Serra Farré
Seguros Catalana Occidente, S.A. de Seguros y Reaseguros.
Chairman - -
Compañía Española de Seguros y Reaseguros de Crédito y Caución, S.A.
Director’s Representative
- - Alberto Thiebaut Oliveira
Seguros Catalana Occidente, S.A. de Seguros y Reaseguros.
Deputy Chairman
- -
Bilbao Compañía Anónima de Seguros y Reaseguros, S.A. Chairman (*) - -
Catalana Occidente Capital, Agencia de Valores, S.A.
Director - -
Nortehispana de Seguros y Reaseguros, S.A.
Director Secretary - -
Francisco José Arregui Laborda
Seguros Catalana Occidente, S.A. de Seguros y Reaseguros.
Director Secretary
- -
Enrique Giró Godó Seguros Catalana Occidente, S.A. de Seguros y Reaseguros.
Director - -
Mariano Bach Portabella Seguros Catalana Occidente, S.A. de Seguros y Reaseguros.
Director - -
Compañía Española de Seguros y Reaseguros de Crédito y Caución, S.A.
Director - - Federico Halpern Blasco
Seguros Catalana Occidente, S.A. de Seguros y Reaseguros.
Director - -
Félix Miguel Barrado Gutiérrez
Seguros Catalana Occidente, S.A. de Seguros y Reaseguros.
Deputy Secretary
Compañía Española de Seguros y Reaseguros de Crédito y Caución, S.A.
Director - - Jorge Enrich Izard
Seguros Catalana Occidente, S.A. de Seguros y Reaseguros.
Director - -
José Valero Feliu Seguros Catalana Occidente, S.A. de Seguros y Reaseguros. Director - -
New Grange Holding España, S.L.
Seguros Catalana Occidente, S.A. de Seguros y Reaseguros.
Director - -
Olandor, S.L. Seguros Catalana Occidente, S.A. de Seguros y Reaseguros. Director - -
Gestión de Activos y Valores, S.L.
Seguros Catalana Occidente, S.A. de Seguros y Reaseguros.
Director - -
Villasa, S.L. Seguros Catalana Occidente, S.A. de Seguros y Reaseguros.
Director - -
Serusan, S.A. Seguros Catalana Occidente, S.A. de Seguros y Reaseguros.
Director - -
Sercalsegur, S.L. Seguros Catalana Occidente, S.A. de Seguros y Reaseguros.
Director - -

128
Director Equity Interest Held in and/or Function Discharged at: Position or Function Number of
Shares Percentage of
Ownership
Compañía Española de Seguros y Reaseguros de Crédito y Caución, S.A.
Director’s Representative
- - Alberto Thiebaut Oliveira
Seguros Catalana Occidente, S.A. de Seguros y Reaseguros.
Deputy Chairman - -
Bilbao Compañía Anónima de Seguros y Reaseguros, S.A.
Chairman (**) - -
Catalana Occidente Capital, Agencia de Valores, S.A.
Director - -
Lepanto, S.A. Compañía de Seguros y Reaseguros
Director Secretary - -
Nortehispana de Seguros y Reaseguros, S.A.
Director Secretary - -
Francisco José Arregui Laborda
Seguros Catalana Occidente, S.A. de Seguros y Reaseguros.
Director Secretary - -
Enrique Giró Godó Seguros Catalana Occidente, S.A. de Seguros y Reaseguros.
Director - -
Mariano Bach Portabella Seguros Catalana Occidente, S.A. de Seguros y Reaseguros.
Director - -
Compañía Española de Seguros y Reaseguros de Crédito y Caución, S.A.
Director - - Federico Halpern Blasco
Seguros Catalana Occidente, S.A. de Seguros y Reaseguros.
Director - -
Compañía Española de Seguros y Reaseguros de Crédito y Caución, S.A.
Director - - Jorge Enrich Izard
Seguros Catalana Occidente, S.A. de Seguros y Reaseguros.
Director - -
José Valero Feliu Seguros Catalana Occidente, S.A. de Seguros y Reaseguros.
Director - -
New Grange Holding España, S.L.
Seguros Catalana Occidente, S.A. de Seguros y Reaseguros.
Director - -
Olandor, S.L. Seguros Catalana Occidente, S.A. de Seguros y Reaseguros.
Director - -
Gestión de Activos y Valores, S.L.
Seguros Catalana Occidente, S.A. de Seguros y Reaseguros.
Director - -
Villasa, S.A. Seguros Catalana Occidente, S.A. de Seguros y Reaseguros.
Director - -
Serusan, S.A. Seguros Catalana Occidente, S.A. de Seguros y Reaseguros.
Director - -
(*) Appointed on 1 February 2006

129
Also, following is a detail of the equity interests (above 0.25% of share capital) held directly or indirectly and/or the positions held or functions discharged by the individual representatives of the legal-entity directors listed in the above table, in companies engaging in an activity that is identical, similar or complementary to the activity that constitutes the business purpose of Grupo Catalana Occidente, S.A.:
Director Directors’ Individual Representative
Equity Interest Held in and/or Function Discharged at
Position or Function
No. of Shares
Percentage of Ownership
Compañía Española de Seguros y Reaseguros de Crédito y
Caución, S.A.
Director - -
Gestión de Activos y Valores, S.L.
Javier Juncadella Salisachs
Seguros Catalana Occidente, S.A. de Seguros y Reaseguros
Director’s Representative
- -
Seguros Catalana Occidente, S.A. de Seguros y Reaseguros
Director’s Representative
- -
BIBM Gestió d’Actius,S.A. Chairman - -
Banca Internacional d’Andorra Director’s
Representative “Mora fills, S.A.”
- -
Banca Mora, S.A. Director’s
Representative “Mora fills, S.A.”
- -
New Grange Holding España,
S.L. Jordi Mora Magriñà
BIBM Assegurances, S.A. Director’s
Representative “Mora fills, S.A.”
- -
Compañía Española de Seguros y Reaseguros de Crédito y
Caución, S.A. Chairman - -
Seguros Catalana Occidente, S.A. de Seguros y Reaseguros
Director’s Representative
- - Serusan, S.A. Jesús Serra Farré
Atradius, NV Director - -
Sercalsegur, S.L. Hugo Serra Calderón Seguros Catalana Occidente, S.A. de Seguros y Reaseguros
Director’s Representative
-
-
Olandor, S.L. Javier Pérez Farguell Seguros Catalana Occidente, S.A. de Seguros y Reaseguros
Director’s Representative
- -
Compañía Española de Seguros y Reaseguros de Crédito y
Caución, S.A. Director - -
Villasa, S.L. Javier Villavecchia de Delás
Seguros Catalana Occidente, S.A. de Seguros y Reaseguros
Director’s Representative
- -
Related-party transactions
Further to Order EHA/3050/2004 of 15 September, it is hereby stated that, besides the dividends received, no related-party transactions took place in 2005 with directors or executives or similar persons for these purposes, except for those pertaining to the company’s ordinary course of business which were performed under normal market conditions and are of scant significance.
130
Fees paid to the auditors
The fees relating to the financial audit services provided to the companies composing the “Grupo Catalana Occidente, S.A. and Subsidiaries” Group by the main auditors or by other companies related to the main auditors in 2006 and 2005 amounted to EUR 587 thousand and EUR 624 thousand in each year respectively (VAT included). The audit fees charged by other auditors participating in the audit of various Group companies totalled EUR 271 thousand in 2006 and EUR 403 thousand in 2005. In addition, in 2006 the fees charged for other non-attest services provided by other entities not related to the main auditors amounted to EUR 87 thousand. The fees charged by the main auditors or by other entities related to the main auditors for other related services amounted to EUR 18 thousand (VAT included) in 2005. The total fees paid to the main auditors account for less than 1% of their volume of business.
DGSFP Inspections
On 5 May 2005, the Directorate-General of Insurance and Pension Funds notified Seguros Catalana Occidente, S.A. de Seguros y Reaseguros of a limited inspection of the analysis of the claims provision relating to non-life products at 31 December 2004, of the analysis of the risks assumed in the Non-Life lines and their technical formulation, of coverage of the above risks through reinsurance, of the transactions performed in the Life line and any other matters it considered appropriate to examine during the course of the review.
Events after the balance-sheet date
On 19 February 2007, Royal Decree 239/2007, of 16 February, amending the Private Insurance Regulations (ROSSP) was published in the Official State Gazette (BOE). The main amendments introduced were as follows:
─ With regards to the interest rate used to calculate mathematical provisions, the amendments introduce the possibility of using interest rates more aligned with the current market scenario, allowing, in certain situations, for provisions for life insurance to be calculated using the interest rate effective on the date on which the policy is written,
─ The types of financial assets capable of supporting technical provisions has been considerably expanded, in particular to include certain derivatives, structured products and venture capital funds and companies that were not previously accepted for such purposes,
─ Under the guidance of the Board of Directors, insurance companies are required to implement internal control systems appropriate to the size of their organisation. The audit functions of the models implemented must be performed by personnel with sufficient knowledge and experience to guarantee the independence of the said functions from all other sections of the Company. On a yearly basis, the Board of Directors must submit to the DGSFP a report on the efficiency of the control procedures introduced, detailing any significant deficiencies identified, the implications of such deficiencies and, where applicable, proposing appropriate remedial measures.
These amendments entered into force on the day following their publication in the BOE.
7. Explanation added for translation to English
These consolidated financial statements are presented on the basis of IFRSs, as adopted by the European Union. Certain accounting practices applied by the Company that conform with IFRSs may not conform with other generally accepted accounting principles.

APPENDICES
Appendix I: Information on subsidiaries
Appendix II: Information on associates

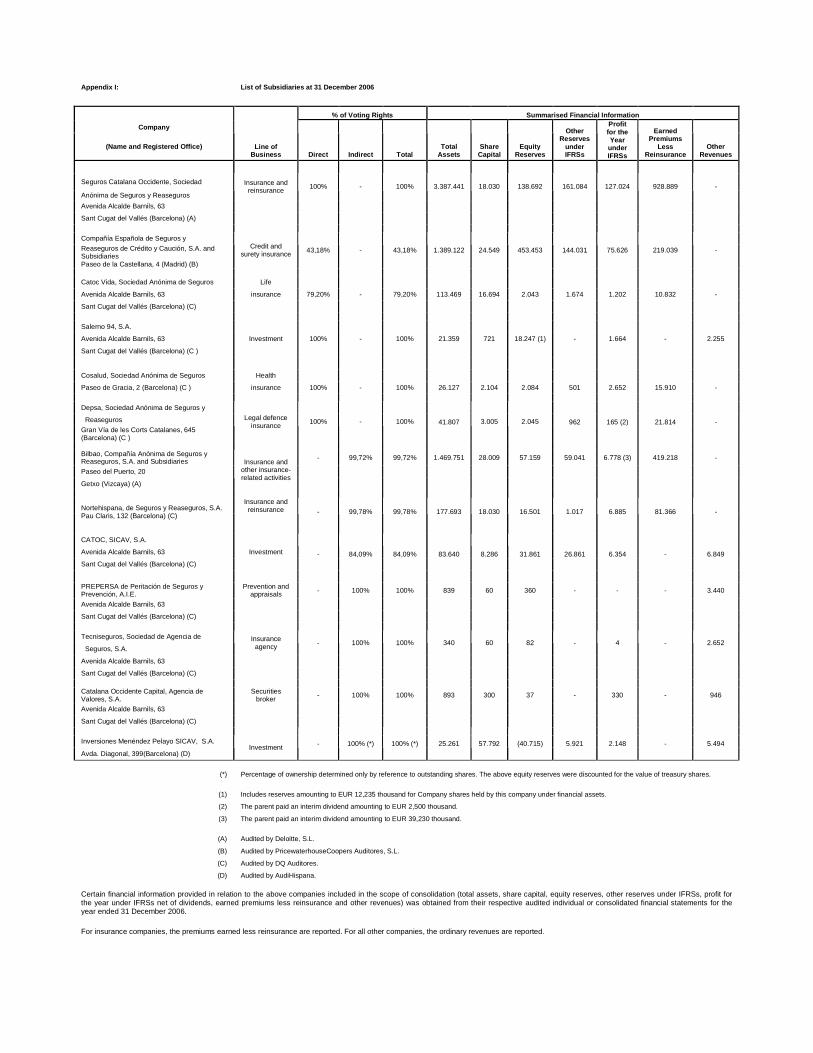
Appendix I: List of Subsidiaries at 31 December 2006
% of Voting Rights Summarised Financial Information
Company
(Name and Registered Office) Line of Business Direct Indirect Total
Total Assets
Share Capital
Equity Reserves
Other Reserves
under IFRSs
Profit for the Year
under IFRSs
Earned Premiums
Less Reinsurance
Other Revenues
Seguros Catalana Occidente, Sociedad
Anónima de Seguros y Reaseguros
Insurance and reinsurance
100% - 100% 3.387.441 18.030 138.692 161.084 127.024 928.889 -
Avenida Alcalde Barnils, 63
Sant Cugat del Vallés (Barcelona) (A)
Compañía Española de Seguros y
Reaseguros de Crédito y Caución, S.A. and Subsidiaries Paseo de la Castellana, 4 (Madrid) (B)
Credit and surety insurance
43,18% - 43,18% 1.389.122 24.549 453.453 144.031 75.626 219.039 -
Catoc Vida, Sociedad Anónima de Seguros Life
Avenida Alcalde Barnils, 63 insurance 79,20% - 79,20% 113.469 16.694 2.043 1.674 1.202 10.832 -
Sant Cugat del Vallés (Barcelona) (C)
Salerno 94, S.A.
Avenida Alcalde Barnils, 63 Investment 100% - 100% 21.359 721 18.247 (1) - 1.664 - 2.255
Sant Cugat del Vallés (Barcelona) (C )
Cosalud, Sociedad Anónima de Seguros Health
Paseo de Gracia, 2 (Barcelona) (C ) insurance 100% - 100% 26.127 2.104 2.084 501 2.652 15.910 -
Depsa, Sociedad Anónima de Seguros y
Reaseguros 41.807 962 165 (2) 21.814 - Gran Vía de les Corts Catalanes, 645 (Barcelona) (C )
Legal defence insurance
100% - 100%
3.005 2.045
Bilbao, Compañía Anónima de Seguros y Reaseguros, S.A. and Subsidiaries - 99,72% 99,72% 1.469.751 28.009 57.159 59.041 6.778 (3) 419.218 -
Paseo del Puerto, 20
Getxo (Vizcaya) (A)
Insurance and other insurance-related activities
Insurance and reinsurance Nortehispana, de Seguros y Reaseguros, S.A.
Pau Claris, 132 (Barcelona) (C) - 99,78% 99,78% 177.693 18.030 16.501 1.017 6.885 81.366 -
CATOC, SICAV, S.A. Avenida Alcalde Barnils, 63 Investment - 84,09% 84,09% 83.640 8.286 31.861 26.861 6.354 - 6.849 Sant Cugat del Vallés (Barcelona) (C)
PREPERSA de Peritación de Seguros y Prevención, A.I.E.
Prevention and appraisals - 100% 100% 839 60 360 - - - 3.440
Avenida Alcalde Barnils, 63
Sant Cugat del Vallés (Barcelona) (C)
Tecniseguros, Sociedad de Agencia de
Seguros, S.A.
Insurance agency
- 100% 100% 340 60 82 - 4 - 2.652
Avenida Alcalde Barnils, 63
Sant Cugat del Vallés (Barcelona) (C)
Catalana Occidente Capital, Agencia de Valores, S.A.
Securities broker
- 100% 100% 893 300 37 - 330 - 946
Avenida Alcalde Barnils, 63
Sant Cugat del Vallés (Barcelona) (C)
Inversiones Menéndez Pelayo SICAV, S.A. 25.261 5.921 2.148 - 5.494
Avda. Diagonal, 399(Barcelona) (D) Investment - 100% (*) 100% (*)
57.792 (40.715)
(*) Percentage of ownership determined only by reference to outstanding shares. The above equity reserves were discounted for the value of treasury shares.
(1) Includes reserves amounting to EUR 12,235 thousand for Company shares held by this company under financial assets.
(2) The parent paid an interim dividend amounting to EUR 2,500 thousand.
(3) The parent paid an interim dividend amounting to EUR 39,230 thousand.
(A) Audited by Deloitte, S.L.
(B) Audited by PricewaterhouseCoopers Auditores, S.L.
(C) Audited by DQ Auditores.
(D) Audited by AudiHispana.
Certain financial information provided in relation to the above companies included in the scope of consolidation (total assets, share capital, equity reserves, other reserves under IFRSs, profit for the year under IFRSs net of dividends, earned premiums less reinsurance and other revenues) was obtained from their respective audited individual or consolidated financial statements for the year ended 31 December 2006.
For insurance companies, the premiums earned less reinsurance are reported. For all other companies, the ordinary revenues are reported.

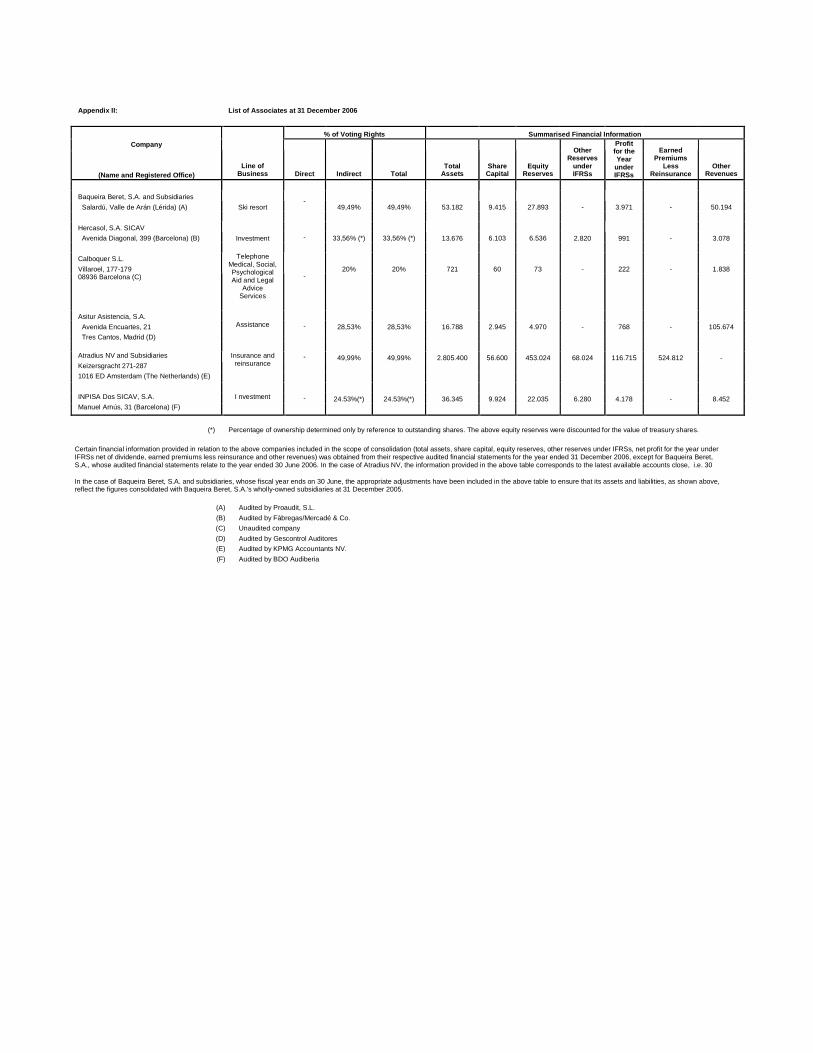
Appendix II: List of Associates at 31 December 2006
% of Voting Rights Summarised Financial Information Company
(Name and Registered Office) Line of
Business Direct Indirect Total Total
Assets Share
Capital Equity
Reserves
Other Reserves
under IFRSs
Profit for the Year
under IFRSs
Earned Premiums
Less Reinsurance
Other Revenues
Baqueira Beret, S.A. and Subsidiaries
Salardú, Valle de Arán (Lérida) (A) Ski resort -
49,49% 49,49% 53.182 9.415 27.893 - 3.971 - 50.194
Hercasol, S.A. SICAV
Avenida Diagonal, 399 (Barcelona) (B) Investment - 33,56% (*) 33,56% (*) 13.676 6.103 6.536 2.820 991 - 3.078
Calboquer S.L.
Villaroel, 177-179 20% 20% 721 60 73 - 222 - 1.838 08936 Barcelona (C)
Telephone Medical, Social, Psychological Aid and Legal
Advice Services
-
Asitur Asistencia, S.A.
Avenida Encuartes, 21 Assistance - 28,53% 28,53% 16.788 2.945 4.970 - 768 - 105.674
Tres Cantos, Madrid (D) Atradius NV and Subsidiaries - 49,99% 49,99% 2.805.400 56.600 453.024 68.024 116.715 524.812 - Keizersgracht 271-287
Insurance and reinsurance
1016 ED Amsterdam (The Netherlands) (E) INPISA Dos SICAV, S.A. I nvestment - 24.53%(*) 24.53%(*) 36.345 9.924 22.035 6.280 4.178 - 8.452 Manuel Arnús, 31 (Barcelona) (F)
(*) Percentage of ownership determined only by reference to outstanding shares. The above equity reserves were discounted for the value of treasury shares.
Certain financial information provided in relation to the above companies included in the scope of consolidation (total assets, share capital, equity reserves, other reserves under IFRSs, net profit for the year under IFRSs net of dividende, earned premiums less reinsurance and other revenues) was obtained from their respective audited financial statements for the year ended 31 December 2006, except for Baqueira Beret, S.A., whose audited financial statements relate to the year ended 30 June 2006. In the case of Atradius NV, the information provided in the above table corresponds to the latest available accounts close, i.e. 30 In the case of Baqueira Beret, S.A. and subsidiaries, whose fiscal year ends on 30 June, the appropriate adjustments have been included in the above table to ensure that its assets and liabilities, as shown above, reflect the figures consolidated with Baqueira Beret, S.A.'s wholly-owned subsidiaries at 31 December 2005.
(A) Audited by Proaudit, S.L. (B) Audited by Fàbregas/Mercadé & Co. (C) Unaudited company (D) Audited by Gescontrol Auditores (E) Audited by KPMG Accountants NV. (F) Audited by BDO Audiberia