2005 employee - hardware retailing · employee employee compensation data for hardware stores, home...
TRANSCRIPT
Employee
Employee compensation
data for hardware stores,
home centers and
lumber/building
materials outlets
North American Retail Hardware AssociationHome Center Institute
StudyCompensation
2005
Contents
© NRHA/HCI, 2005 The Employee Compensation Report 1
Price: $49 for NRHA/HCI members;$98 for non-members; quantitydiscounts are available.
© 2005 North American Retail Hard w a reAssociation / Home Center Institute. All rights re s e rved. Except as perm i t t e dunder the United States Copyright Actof 1976, no part of this publication maybe re p roduced or distributed in anyf o rm or by any means or stored in adatabase or retrieval system withoutprior written permission of the publisher.Printed in the United States of America.
Introduction ..............................................2What’s in the Employee Compensation Report?
How to use the Employee Compensation Report
Hardware StoresSummary and Historical Data..................3
Payroll Structure
Employee Productivity
Annual Turnover Rate
Employment ..............................................5Number of Employees
Compensation ..........................................6Hourly Wages
Bonuses
Benefits......................................................8Insurance
Retirement
Vacations/Paid Days Off
Training
Home CentersSummary and Historical Data................14
Payroll Structure
Employee Productivity
Annual Turnover Rate
Employment ............................................16Number of Employees
Compensation ........................................17Hourly Wages
Bonuses
Benefits....................................................19Insurance
Retirement
Vacations/Paid Days Off
Training
Lumber/Building Material OutletsSummary and Historical Data ................25
Payroll Structure
Employee Productivity
Annual Turnover Rate
Employment ............................................27Number of Employees
Compensation ........................................28Hourly Wages
Bonuses
Benefits....................................................30Insurance
Retirement
Vacations/Paid Days Off
Training
Employee Compensation ReportRetail Hardware/Home Improvement
Employment, Salary and Benefits Data
2 The Employee Compensation Report © NRHA/HCI, 2005
Introduction
The Employee Compensation Report p resents data on employment, wages and benefits inthe retail hard w a re/home improvement industry. It includes employee productivity dataf rom the most recent North American Retail Hard w a re Association (NRHA) and the HomeCenter Institute’s (HCI) cost of doing business surv e y, as well as historical trend data fro mannual cost of doing business surveys and previous employee compensation studies.
Compensation data was gathered by NRHA/HCI and D o - I t - Yourself Retailing magazine in a by-mails u rvey of approximately 3,500 hard w a re stores, home centers and lumber/building material outlets. A total of 230 surveys were re t u rned for a response rate of nearly 7 percent. The averages in thisre p o rt were calculated from those responses. Respondents are primarily independent, family-owned orclosely held companies.
What’s in the Employee Compensation Report?
Data in the 2005 edition of the Employee Compensation Report is segmented for hard w a re store s ,home centers and lumber/building material outlets. It is further segmented by annual sales volumeand type of market in which stores are located. Data includes:
• Average number of managers and Department Managers and other full- and part-timeemployees in eight job classifications
• Average hourly wages for these same classifications• Payroll expense structure• Employee productivity ratios• Average annual employee turnover rates• Use of bonuses• Insurance and retirement benefits• Paid vacation and days off• Employee training
P a y roll expense stru c t u res and employee productivity ratios offer a way to evaluate re t u rn oninvestment in quality employees. Wages and salaries re p resent 86-88 percent of payroll expenses,and total payroll is the second largest investment behind inventory. The productivity ratios areindicators of the re t u rn on that investment.
Because the competition for good employees is as intense as the competition for customers, weincluded information on benefits—insurance offered to employees and their families, how much of thepremiums employers pay, retirement benefits and paid time off. These are as important in attractinggood employees as salary levels. We also asked about formal training programs because well-trainedemployees are more productive than those left to learn on their own.
How to Use the Employee Compensation Report
Data presented should be considered as guidelines to wage levels and benefits, not as absolutes.The methodology of this study produced results that tend to favor better managed, more aggre s s i v e ,h i g h - p e rf o rmance re t a i l e r s .
Company size and location heavily influence personnel practices. For example, owners of smallercompanies tend to function as active managers. Because they have fewer employees, smallercompanies expect employees to do a variety of jobs and tend not to define positions for receiving,stocking, office personnel, etc.
Salary levels for owners may indicate differing operational styles, as some owners balance salarieswith return on invested capital.
The breakouts by sales volume and type of market should help retailers benchmark their ownoperations and draw meaningful comparisons.

How Many Employees and How Much Are They Paid?SUMMARY DATAThis chart summarizes thenumber of full-time and part-time employees working inh a rd w a re stores submittingdata for the NRHA/HCIcompensation study and theaverage hourly wages paid tothose employees. The wagedata can be used as a generalguide to salaries in theh a rd w a re segment of the homei m p rovement industry; however,local market conditions shouldbe taken into account inestablishing or evaluatingsalary/wage structure s .
PAYROLL STRUCTUREThe payroll structure forh a rd w a re stores comes fro mthe NRHA/HCI 2005 Cost ofDoing Business Study. Itindicates that payroll is 22.1%of net sales and that salaries,wages, and bonuses accountfor 19.5% of sales—or 88% ofp a y roll dollars. The graph onpage 4 traces payroll as ap e rcent of sales for the past 20years and compares averages t o res to high-profit store s .
EMPLOYEEPRODUCTIVITYThese ratios help to evaluatethe investment in employeesand their re t u rn on thatinvestment. Sales and gro s sm a rgin per employee measureemployee performance; thet h ree payroll expense ratiosshow the cost of employees;the personnel pro d u c t i v i t yratio shows payroll as ap e rcent of gross marg i n .
Summary & Historical Data
© NRHA/HCI, 2005 The Employee Compensation Report 3
Hardware Stores
Full-Time Employees Part-Time Employees
Number Average Number AveragePer Store Hourly Wage Per Store Hourly Wage
Owners/Officers 1.6 $46,154* 0.1 $25,600*
Managers/Assistant Managers 0.4 $13.14 0.1 $9.60
Department Managers 0.5 $10.18 0.3 $9.06
Sales Personnel 2.0 $9.29 3.0 $7.78
Office Personnel 0.4 $10.89 0.3 $8.29
Cashiers 0.9 $8.14 1.5 $7.25
Stock Personnel 0.3 $8.53 0.8 $7.44
Delivery/Receiving Personnel 0.2 $9.99 0.2 $7.88
Warehouse Personnel 0.1 $8.23 0.1 $7.38
Yard Personnel NA NA NA NA
Lumber Counter Personnel NA NA NA NA
Total 6.4 6.4*Annual salary
Owners/Officers Salaries & Bonuses 4.1%
All Other Employee Salaries, Wages & Bonuses 15.4%
Total Salaries, Wages & Bonuses 19.5%
Payroll Taxes, FICA, Workers’ Comp & Unemployment 1.6%
Group Insurance (Hospital/Medical/Life) 0.9%
Benefit Plans (Pension, Profit Sharing, etc.) 0.0%
Total Payroll Expenses 22.1%Source: NRHA/HCI 2005 Cost of Doing Business Study
Payroll Expenses as a Percent of Net Sales
Number of Full-Time Equivalent Employees 9.0
Sales per Employee $131,062
Gross Margin per Employee $53,881
Payroll per Employee (including benefits) $28,928
Salary per Employee $25,553
Payroll Expense as Percent of Sales 22.1%
Personnel Productivity Ratio 53.8%
Source: NRHA/HCI 2005 Cost of Doing Business Study
Employee Productivity Ratios

4 The Employee Compensation Report © NRHA/HCI, 2005
Summary & Historical DataHardware Stores
HISTORICALCOMPARISON
This chart shows employeeproductivity ratios for the last
20 years in five-yearincrements. It puts current
payroll structures andemployee performance in
perspective. Between 1986and 2005, salaries have
increased while productivityhas stayed relatively flat.
EMPLOYEETURNOVER
To derive the annual employeet u rnover rate, we asked
retailers how many employeeshad left or been fired and then
replaced. Because part-timeemployees move more oftenthan full-time employees, weshow turnover rates for both.
Tu rnover rates for full-timeemployees have declined
slightly while turnover rates forpart timers have incre a s e d .
Employee Productivity: Historical Comparison1986 1991 1996 2001 2005
Number of Employees 9 11 10 10 9
Sales Per Employee $75,418 $89,082 $104,761 $118,923 $131,062
Gross Margin Per Employee $27,336 $32,944 $39,204 $45,731 $53,881
Payroll Per Employee $14,684 $18,016 $20,574 $24,073 $28,928
Salary Per Employee $12,781 $15,400 $17,810 $20,671 $25,553
Payroll as Percent of Sales 19.4% 20.3% 20.2% 20.7% 22.1%
Personnel Productivity Ratio 53.7% 55.2% 53.9% 54.0% 53.8%
Source: Annual cost of doing business surveys
Annual Employee Turnover RatesSales Volume Type of Market Location
Under $ 5 0 0 , 0 0 0- $1 Million- Over Major S u b u r b a n D o w n t o w n Small$ 5 0 0 , 0 0 0 $1 Million $2 Million $2 Million Metro S e c o n d a ry Town
Full Time Average: 16% 17% 23% 11% 13% 26% 12% 11% 17%
Part Time Average: 47% 40% 45% 42% 57% 46% 52% 55% 38%
Historical Comparison 1997 1999 2001 2005
Full Time 20% 18% 19% 16%
Part Time 50% 45% 38% 47%
Source: NRHA/HCI compensation studies
Payroll as % of Sales: Typical vs. High-Profit Stores
Source: NRHA/HCI annual cost of doing business surveys
Average
High-Profit

Employment
© NRHA/HCI, 2005 The Employee Compensation Report 5
Hardware Stores
HARDWARE STOREEMPLOYMENTThese two charts showaverage number of employeesper store broken out by salesvolume and by type of marketin which the stores arelocated. In many instancesthe averages show fewer thanone employee. This means asignificant number of store sdo not define this job as aseparate position. Indicationsa re that stores in larg e rmarkets are cutting staff whiles t o res in smaller markets areadding staff .
Number of Employees: Sales VolumeFull-Time Employees Part-Time Employees
Under $ 5 0 0 , 0 0 0- $1 Million- Over Under $ 5 0 0 , 0 0 0- $1 Million- Over$ 5 0 0 , 0 0 0 $1 Million $2 Million $2 Million $ 5 0 0 , 0 0 0 $1 Million $2 Million $2 Million
Managers/Assistant Managers 0.6 0.9 1.3 2.2 0.1 NA NA 0.1
Department Managers 0.2 0.3 0.4 0.1 0.1 0.3 0.5 0.1
Sales Personnel 1.2 1.5 2.1 3.5 1.6 2.4 2.9 7.8
Office Personnel 0.3 0.3 0.6 1.4 0.2 0.3 0.4 0.7
Cashiers 0.2 0.5 1.0 3.2 0.3 1.2 2.0 3.2
Stock Personnel 0.3 0.1 0.2 0.2 0.1 0.4 0.2 1.2
Delivery/Receiving Personnel 0.1 0.1 0.1 1.1 NA 0.2 0.1 0.3
Warehouse Personnel NA 0.1 0.1 0.1 NA NA 0.1 0.1
Yard Personnel NA NA NA NA NA NA NA NA
Lumber Counter Personnel NA NA NA NA NA NA NA NA
Total 2.9 3.8 5.8 11.8 2.4 4.8 6.2 13.5
Number of Employees: Type of Market LocationFull-Time Employees Part-Time Employees
Major S u b u r b a n D o w n t o w n Small Major S u b u r b a n D o w n t o w n SmallMetro S e c o n d a ry Town Metro S e c o n d a ry Town
Managers/Assistant Managers 1.5 1.4 1.2 1.1 NA 0.1 NA 0.1
Department Managers 1.4 0.9 0.3 0.9 NA 0.4 NA 0.1
Sales Personnel 6.2 1.5 1.5 2.2 2.5 5.4 0.8 2.8
Office Personnel 0.4 0.5 0.2 0.6 0.1 0.4 0.2 0.3
Cashiers 3.1 0.6 0.8 0.9 1.8 2.3 1.5 1.3
Stock Personnel 0.1 0.3 0.3 0.3 0.4 3.5 1.0 0.5
Delivery/Receiving Personnel 0.6 0.1 0.2 0.3 NA 0.1 0.5 0.2
Warehouse Personnel NA 0.1 0.1 0.1 NA NA NA 0.1
Yard Personnel NA NA NA NA NA NA NA NA
Lumber Counter Personnel NA NA NA NA NA NA NA NA
Total 13.3 5.4 4.6 6.4 4.8 12.2 4.0 5.4

6 The Employee Compensation Report © NRHA/HCI, 2005
CompensationHardware Stores
HARDWARE STORE WAGES
Charts on this page showaverage hourly wages paid
by hard w a re stores by salesvolume and by type of
market in which the store sa re located. Despite market
competition for employees, itappears hard w a re re t a i l e r sa re not paying their peoplemuch more than they were
t h ree years ago.
Hourly Wages: Sales VolumeFull-Time Employees Part-Time Employees
Under $ 5 0 0 , 0 0 0- $1 Million- Over Under $ 5 0 0 , 0 0 0- $1 Million- Over$ 5 0 0 , 0 0 0 $1 Million $2 Million $2 Million $ 5 0 0 , 0 0 0 $1 Million $2 Million $2 Million
Managers/Assistant Managers $10.08 $12.16 $13.35 $15.66 NA NA NA $8.25
Department Managers $9.00 $10.12 $11.07 $11.40 NA $7.25 $10.69 $9.50
Sales Personnel $8.97 $7.96 $9.89 $10.69 $7.03 $6.37 $8.28 $8.57
Office Personnel $8.63 $11.28 $11.25 $10.88 $9.50 $7.00 $11.78 $8.95
Cashiers $7.50 $7.17 $8.40 $8.58 $6.87 $6.89 $7.36 $7.60
Stock Personnel $8.25 $6.30 $7.68 $7.34 $8.25 $6.30 $7.68 $7.34
Delivery/Receiving Personnel NA $8.00 $10.62 $9.92 NA $7.18 $8.87 $8.20
Warehouse Personnel NA $7.00 NA $9.45 NA NA $7.00 $7.75
Yard Personnel NA NA NA NA NA NA NA NA
Lumber Counter Personnel NA NA NA NA NA NA NA NA
Hourly Wages: Type of Market LocationFull-Time Employees Part-Time Employees
Major S u b u r b a n D o w n t o w n Small Major S u b u r b a n D o w n t o w n SmallMetro S e c o n d a ry Town Metro S e c o n d a ry Town
Managers/Assistant Managers $15.54 $16.48 $12.75 $13.48 NA $10.08 NA NA
Department Managers $12.67 $11.45 $11.29 $12.88 NA $11.33 NA $9.03
Sales Personnel $8.81 $10.11 $10.81 $9.19 $8.00 $7.86 $7.75 $7.70
Office Personnel $12.37 $11.25 $11.50 $10.76 $10.00 $11.93 $10.00 $8.18
Cashiers $7.88 $8.19 $8.88 $8.10 $7.73 $7.51 $7.25 $7.01
Stock Personnel $8.05 $8.33 $7.50 $8.81 $7.40 $8.80 $8.58 $6.78
Delivery/Receiving Personnel $8.75 $10.55 $9.59 $9.60 NA $6.83 $7.50 $8.38
Warehouse Personnel $10.29 $9.75 NA $9.45 NA NA NA $7.38
Yard Personnel NA NA NA NA NA NA NA NA
Lumber Counter Personnel NA NA NA NA NA NA NA NA

Compensation
© NRHA/HCI, 2005 The Employee Compensation Report 7
Hardware Stores
BONUSESIn addition to hourly wages,a sizable number ofh a rd w a re stores off e rbonuses to their employees.The percentage of store so ffering bonuses is aboutthe same as it was thre eyears ago. Charts on thispage show the perc e n t a g eof reporting hard w a re store sthat offer bonuses. Alsoshown is the averagep e rcent of payroll that ispaid out in bonuses.
Bonuses
Sales Volume
Percent of Hardware Stores Giving Bonuses
Management Employees 47%
Full-Time Employees 39%
Part-Time Employees 24%
Percent of Payroll Paid in Bonuses 6%
Percent of Hardware Stores Giving Bonuses
Under $500,000 $500,000-$1 Million $1 Million-$2 Million Over $2 Million
Management Employees 5% 41% 68% 64%
Full-Time Employees 15% 28% 61% 45%
Part-Time Employees 15% 16% 35% 27%
Percent of Payroll Paid in Bonuses 3% 5% 6% 7%
Type of Market LocationPercent of Hardware Stores Giving Bonuses
Major Metro Suburban D o w n t o w n S e c o n d a ry Small Town
Management Employees 72% 52% 50% 40%
Full-Time Employees 64% 43% 17% 35%
Part-Time Employees 45% 33% 35% 20%
Percent of Payroll Paid in Bonuses 6% 4% 9% 5%

8 The Employee Compensation Report © NRHA/HCI, 2005
Benefits
INSURANCECOVERAGE
While health insurancecontinues to rise in cost, it
remains one of the mainreasons good employeeschose one employer over
a n o t h e r. The charts on thisand the following thre e
pages detail the kinds ofhealth insurance off e red to
employees and their familiesby hard w a re stores and the
portion of premiums paid bythe stores. The HistoricalComparison chart at the
bottom of this page indicatesthat fewer hard w a re store s
o ffer group health insurancenow than did so back in
1988 and that retailers aremaking employees pick up a
l a rger percentage of thep remiums. Both trends can
be largely attributable to thei n c reased costs of health
insurance. Still, scaling backtheir health insurance
benefits could put hard w a res t o res at a competitive
disadvantage in hiring thebest people.
Hardware Stores
Insurance CoveragePercent of Hardware Stores Offering Group Insurance
Major Dental Eye Disability LifeMedical Care Care
For Employees
Management 73% 30% 10% 16% 39%
Full-Time Employees 41% 52% 7% 18% 33%
Part-Time Employees 7% 6% 0% 6% 7%
For Employees’ Families
Management 45% 21% 10% 9% 16%
Full-Time Employees 35% 17% 5% 7% 13%
Part-Time Employees 3% 3% 0% 3% 3%
Insurance Premiums
Major Medical Insurance: Historical Comparison
Percent of Premiums Paid by Hardware Stores
0% 1%-24% 25%-49% 50%-74% 75%-99% 100%
For Employees 35% 2% 1% 23% 14% 25%
For Employees’ Families 73% 5% 0% 10% 7% 5%
Percent of Hardware Stores Offering Insurance
1988 1997 1999 2001 2005
For Employees
Management 68% 78% 80% 80% 73%
Full-Time Employees 60% 74% 77% 55% 41%
Part-Time Employees 3% 5% 4% 6% 7%
For Employees’ Families
Management 51% 54% 55% 55% 45%
Full-Time Employees 38% 47% 46% 44% 35%
Part-Time Employees 2% 4% 1% 3% 3%
Percent of Hardware Stores Paying 100% of Premium
For Employees 75% 54% 46% 46% 25%
For Employees’ Families NA 45% 27% 20% 5%
Source: NRHA/HCI compensation studies

Benefits
© NRHA/HCI, 2005 The Employee Compensation Report 9
Hardware Stores
Insurance Offered to Management Employees: Type of Market Location
Percent of Hardware Stores Offering Coverage
Under $500,000 $500,000-$1 Million $1 Million-$2 Million Over $2 Million
For Employees
Major Medical 53% 65% 80% 91%
Dental Care 13% 6% 43% 45%
Eye Care 7% 7% 13% 14%
Disability 11% 10% 17% 36%
Life 13% 42% 33% 59%
For Employees’ Families
Major Medical 13% 23% 53% 86%
Dental Care 13% 10% 27% 36%
Eye Care 7% 6% 10% 14%
Disability 2% 3% 10% 23%
Life 6% 10% 13% 41%
Insurance Offered to Full-Time Employees: Type of Market Location
Percent of Hardware Stores Offering Coverage
Under $500,000 $500,000-$1 Million $1 Million-$2 Million Over $2 Million
For Employees
Major Medical 50% 48% 79% 90%
Dental Care 8% 10% 38% 46%
Eye Care 5% 3% 10% 14%
Disability 7% 13% 16% 38%
Life 25% 29% 26% 57%
For Employees’ Families
Major Medical 8% 27% 45% 71%
Dental Care 8% 3% 24% 32%
Eye Care 2% 3% 7% 9%
Disability 2% 3% 10% 14%
Life 6% 7% 13% 29%
10 The Employee Compensation Report © NRHA/HCI, 2005
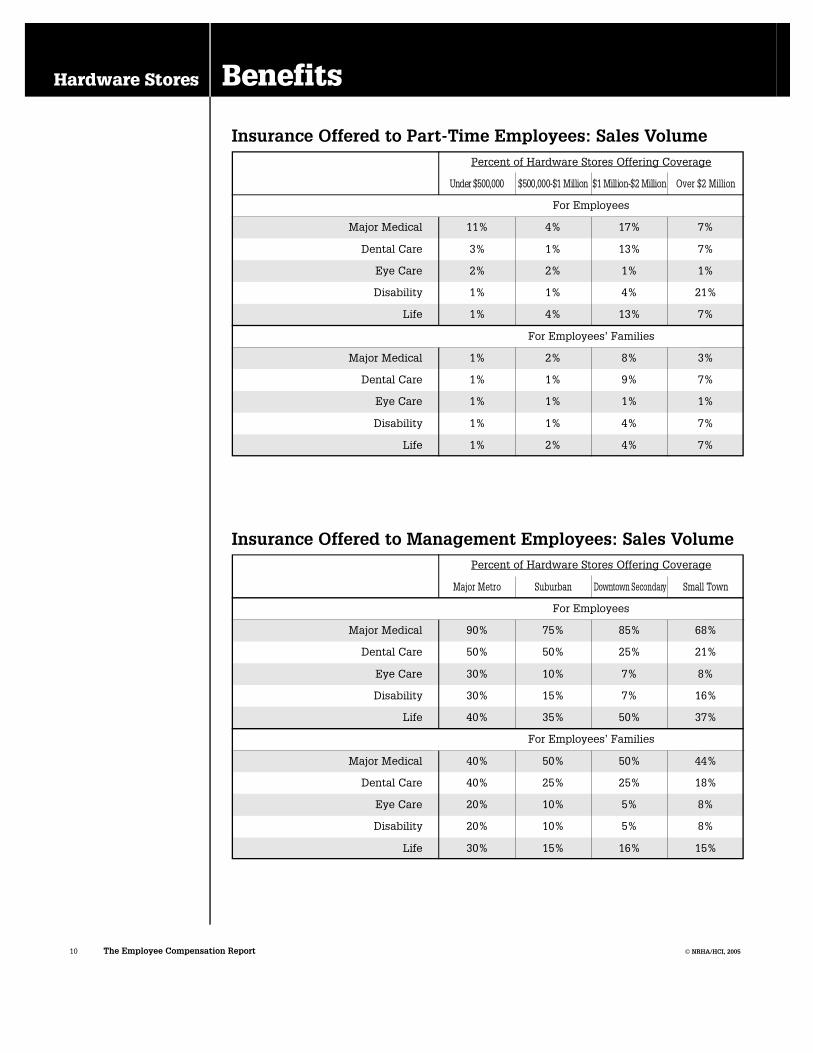
BenefitsHardware Stores
Insurance Offered to Part-Time Employees: Sales VolumePercent of Hardware Stores Offering Coverage
Under $500,000 $500,000-$1 Million $1 Million-$2 Million Over $2 Million
For Employees
Major Medical 11% 4% 17% 7%
Dental Care 3% 1% 13% 7%
Eye Care 2% 2% 1% 1%
Disability 1% 1% 4% 21%
Life 1% 4% 13% 7%
For Employees’ Families
Major Medical 1% 2% 8% 3%
Dental Care 1% 1% 9% 7%
Eye Care 1% 1% 1% 1%
Disability 1% 1% 4% 7%
Life 1% 2% 4% 7%
Insurance Offered to Management Employees: Sales VolumePercent of Hardware Stores Offering Coverage
Major Metro Suburban D o w n t o w n S e c o n d a ry Small Town
For Employees
Major Medical 90% 75% 85% 68%
Dental Care 50% 50% 25% 21%
Eye Care 30% 10% 7% 8%
Disability 30% 15% 7% 16%
Life 40% 35% 50% 37%
For Employees’ Families
Major Medical 40% 50% 50% 44%
Dental Care 40% 25% 25% 18%
Eye Care 20% 10% 5% 8%
Disability 20% 10% 5% 8%
Life 30% 15% 16% 15%

Benefits
© NRHA/HCI, 2005 The Employee Compensation Report 11
Hardware Stores
Insurance Offered to Full-Time Employees: Type of Market Location
Percent of Hardware Stores Offering Coverage
Major Metro Suburban D o w n t o w n S e c o n d a ry Small Town
For Employees
Major Medical 78% 71% 75% 64%
Dental Care 44% 47% 25% 20%
Eye Care 33% 5% 5% 7%
Disability 33% 16% 7% 18%
Life 33% 32% 20% 33%
For Employees’ Families
Major Medical 22% 29% 25% 39%
Dental Care 22% 21% 15% 17%
Eye Care 11% 5% 4% 7%
Disability 11% 11% 4% 7%
Life 11% 16% 15% 12%
Insurance Offered to Part-Time Employees: Type of Market Location
Percent of Hardware Stores Offering Coverage
Major Metro Suburban D o w n t o w n S e c o n d a ry Small Town
For Employees
Major Medical 14% 7% 14% 7%
Dental Care 14% 9% 13% 4%
Eye Care 2% 1% 1% 1%
Disability 2% 13% 3% 4%
Life 4% 8% 13% 4%
For Employees’ Families
Major Medical 4% 7% 14% 4%
Dental Care 2% 13% 2% 1%
Eye Care 2% 1% 1% 1%
Disability 1% 13% 2% 1%
Life 2% 13% 2% 2%
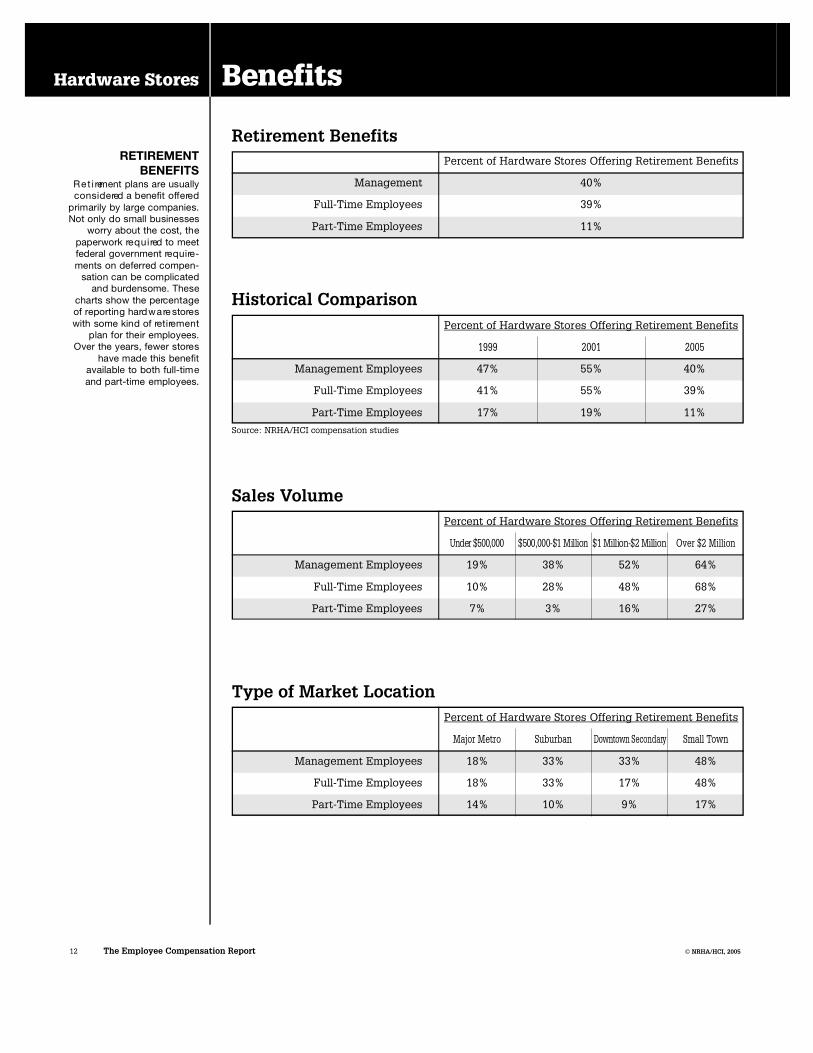
Percent of Hardware Stores Offering Retirement Benefits
Management 40%
Full-Time Employees 39%
Part-Time Employees 11%
12 The Employee Compensation Report © NRHA/HCI, 2005
BenefitsHardware Stores
RETIREMENTBENEFITS
R e t i rement plans are usuallyc o n s i d e red a benefit off e re d
primarily by large companies.Not only do small businesses
worry about the cost, thepaperwork re q u i red to meetfederal government re q u i re -ments on deferred compen-
sation can be complicatedand burdensome. These
charts show the perc e n t a g eof reporting hard w a re store swith some kind of re t i re m e n t
plan for their employees.Over the years, fewer store s
have made this benefitavailable to both full-timeand part-time employees.
Retirement Benefits
Type of Market LocationPercent of Hardware Stores Offering Retirement Benefits
Major Metro Suburban D o w n t o w n S e c o n d a ry Small Town
Management Employees 18% 33% 33% 48%
Full-Time Employees 18% 33% 17% 48%
Part-Time Employees 14% 10% 9% 17%
Sales VolumePercent of Hardware Stores Offering Retirement Benefits
Under $500,000 $500,000-$1 Million $1 Million-$2 Million Over $2 Million
Management Employees 19% 38% 52% 64%
Full-Time Employees 10% 28% 48% 68%
Part-Time Employees 7% 3% 16% 27%
Historical ComparisonPercent of Hardware Stores Offering Retirement Benefits
1999 2001 2005
Management Employees 47% 55% 40%
Full-Time Employees 41% 55% 39%
Part-Time Employees 17% 19% 11%
Source: NRHA/HCI compensation studies

Benefits
© NRHA/HCI, 2005 The Employee Compensation Report 13
Hardware Stores
PAID TIME OFFVacation and paid sick orpersonal days are benefitsthat employees rely on anda p p reciate, particularly thosethat have been with acompany for an extendedtime. These charts show thepractices of hard w a re store sin giving employees paidtime off. In general, mosts t o res give management andfull-time employees one ortwo weeks of paid vacation ayear; few offer any amount ofvacation to part-timeemployees. In general,h a rd w a re stores do not off e rvery liberal policies re g a rd i n gthe number of paid sick orpersonal days off; those thatdo limit this benefit tomanagement and full-timeemployees and offer lessthan 10 days a year.
EMPLOYEE TRAININGWell-trained employees area competitive advantage.Yet, only 21% of re s p o n d i n gh a rd w a re stores have aformal training program. Asthis chart shows, even fewerbudget for training and theamount is small, about twotenths of one percent ofsales for the typicalh a rd w a re store profiled inN R H A / H C I ’s 2005 Cost ofDoing Business Study.
Percent of Companies with Formal Training Programs 21%
Average Annual Hours of Training for Management 30 hrs.
Average Annual Hours of Training for Full-Time Employees 20 hrs.
Average Annual Hours of Training for Part - Time Employees 17 hrs.
Percent of Companies that Have a Training Budget 11%
Average Amount Budgeted for Training $2,400
Employee Training
Annual Paid VacationPercent of Hardware Stores Giving Paid Vacations
No Days 1-5 Days 6-10 Days M o re than 10 Days
Management Employees 19% 16% 35% 30%
Full-Time Employees 22% 28% 36% 14%
Part-Time Employees 84% 13% 2% 2%
Paid Sick/Personal Days AnnuallyPercent of Hardware Stores Offering Paid Days Off
No Days 1-5 Days 6-10 Days M o re than 10 Days
Management Employees 46% 34% 12% 8%
Full-Time Employees 51% 31% 14% 4%
Part-Time Employees 93% 5% 1% 1%
14 The Employee Compensation Report © NRHA/HCI, 2005
Summary & Historical DataHome Centers
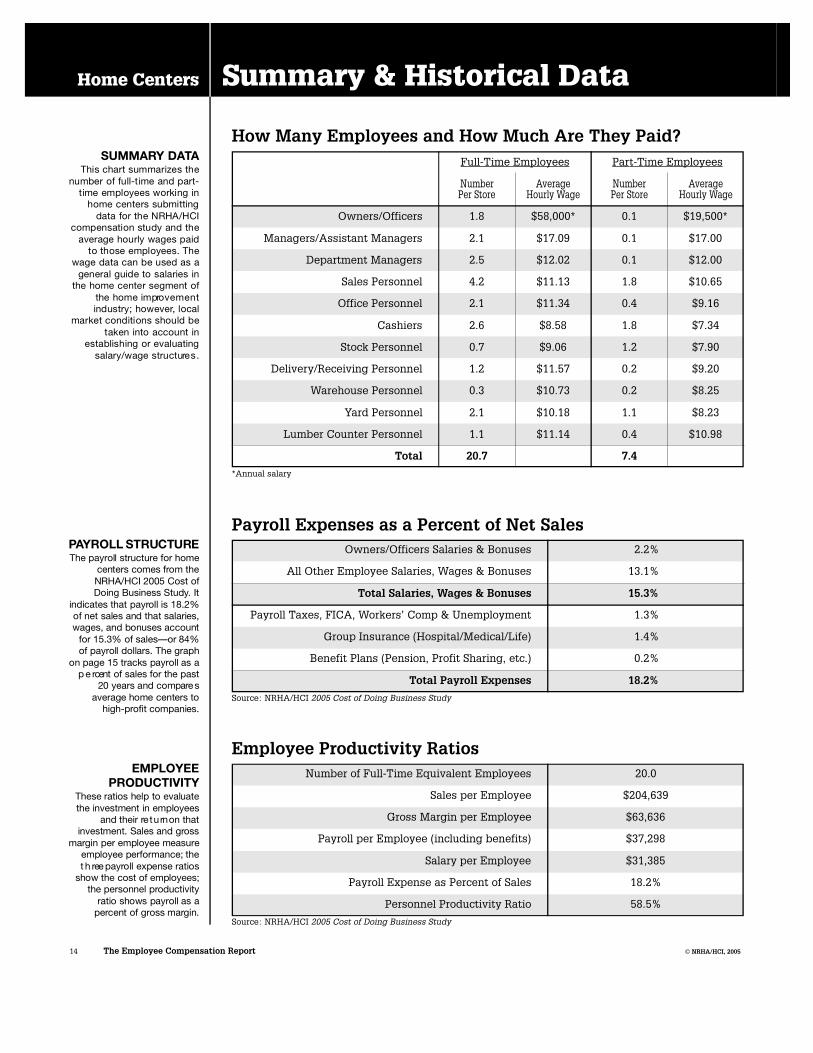
SUMMARY DATAThis chart summarizes the
number of full-time and part-time employees working in
home centers submittingdata for the NRHA/HCI
compensation study and theaverage hourly wages paid
to those employees. Thewage data can be used as a
general guide to salaries inthe home center segment of
the home impro v e m e n tindustry; however, local
market conditions should betaken into account in
establishing or evaluatingsalary/wage structure s .
PAYROLL STRUCTUREThe payroll structure for home
centers comes from theNRHA/HCI 2005 Cost ofDoing Business Study. It
indicates that payroll is 18.2%of net sales and that salaries,wages, and bonuses account
for 15.3% of sales—or 84%of payroll dollars. The graph
on page 15 tracks payroll as ap e rcent of sales for the past
20 years and compare saverage home centers to
h i g h - p rofit companies.
EMPLOYEEPRODUCTIVITY
These ratios help to evaluatethe investment in employees
and their re t u rn on thatinvestment. Sales and gro s s
m a rgin per employee measureemployee performance; thet h ree payroll expense ratios
show the cost of employees;the personnel pro d u c t i v i t y
ratio shows payroll as ap e rcent of gross margin.
How Many Employees and How Much Are They Paid?Full-Time Employees Part-Time Employees
Number Average Number AveragePer Store Hourly Wage Per Store Hourly Wage
Owners/Officers 1.8 $58,000* 0.1 $19,500*
Managers/Assistant Managers 2.1 $17.09 0.1 $17.00
Department Managers 2.5 $12.02 0.1 $12.00
Sales Personnel 4.2 $11.13 1.8 $10.65
Office Personnel 2.1 $11.34 0.4 $9.16
Cashiers 2.6 $8.58 1.8 $7.34
Stock Personnel 0.7 $9.06 1.2 $7.90
Delivery/Receiving Personnel 1.2 $11.57 0.2 $9.20
Warehouse Personnel 0.3 $10.73 0.2 $8.25
Yard Personnel 2.1 $10.18 1.1 $8.23
Lumber Counter Personnel 1.1 $11.14 0.4 $10.98
Total 20.7 7.4*Annual salary
Owners/Officers Salaries & Bonuses 2.2%
All Other Employee Salaries, Wages & Bonuses 13.1%
Total Salaries, Wages & Bonuses 15.3%
Payroll Taxes, FICA, Workers’ Comp & Unemployment 1.3%
Group Insurance (Hospital/Medical/Life) 1.4%
Benefit Plans (Pension, Profit Sharing, etc.) 0.2%
Total Payroll Expenses 18.2%Source: NRHA/HCI 2005 Cost of Doing Business Study
Payroll Expenses as a Percent of Net Sales
Number of Full-Time Equivalent Employees 20.0
Sales per Employee $204,639
Gross Margin per Employee $63,636
Payroll per Employee (including benefits) $37,298
Salary per Employee $31,385
Payroll Expense as Percent of Sales 18.2%
Personnel Productivity Ratio 58.5%
Source: NRHA/HCI 2005 Cost of Doing Business Study
Employee Productivity Ratios

Summary & Historical Data
© NRHA/HCI, 2005 The Employee Compensation Report 15
Home Centers
HISTORICALCOMPARISONThis chart shows employeep roductivity ratios for thelast 20 years in five-yeari n c rements. It puts curre n tp a y roll structures andemployee performance inperspective. Between 1986and 2005, payroll hasi n c reased. More importantly,personnel productivity hasalso been on the rise.
EMPLOYEETURNOVERTo derive the annual employeet u rnover rate, we askedretailers how many employeeshad left or been fired and thenreplaced. Because part-timeemployees move more oftenthan full-time, we showt u rnover rates for both. Homecenter retailers have been ableto slightly reduce turn o v e rrates for both full-time andpart-time employees.
Employee Productivity: Historical Comparison1986 1991 1996 2001 2005
Number of Employees 25 26 23 20 20
Sales per Employee $136,719 $147,440 $150,154 $168,948 $204,639
Gross Margin per Employee $37,751 $42,327 $45,084 $53,522 $63,636
Payroll per Employee $19,967 $24,457 $24,353 $30,183 $37,298
Salary per Employee $17,115 $21,031 $21,039 $25,371 $31,385
Payroll as Percent of Sales 14.6% 16.6% 16.9% 17.4% 18.2%
Personnel Productivity Ratio 53.1% 57.8% 55.0% 58.6% 58.5%
Source: Annual cost of doing business surveys
Annual Employee Turnover Rates
Payroll as % of Sales: Typical vs. High-Profit Stores
Source: NRHA/HCI annual cost of doing business surveys
Average
High-Profit
Sales Volume Type of Market Location
Under $2 Million- Over Major S u b u r b a n Downtown Small$2 Million $5 Million $5 Million Metro S e c o n d a ry Town
Full Time Average: 21% 25% 16% 21% 23% 16% 10% 23%
Part Time Average: 42% 37% 44% 45% 41% 40% 43% 43%
Historical Comparison 1997 1999 2001 2005
Full Time 22% 26% 24% 21%
Part Time 45% 55% 45% 42%
Source: NRHA/HCI compensation studies
16 The Employee Compensation Report © NRHA/HCI, 2005
EmploymentHome Centers
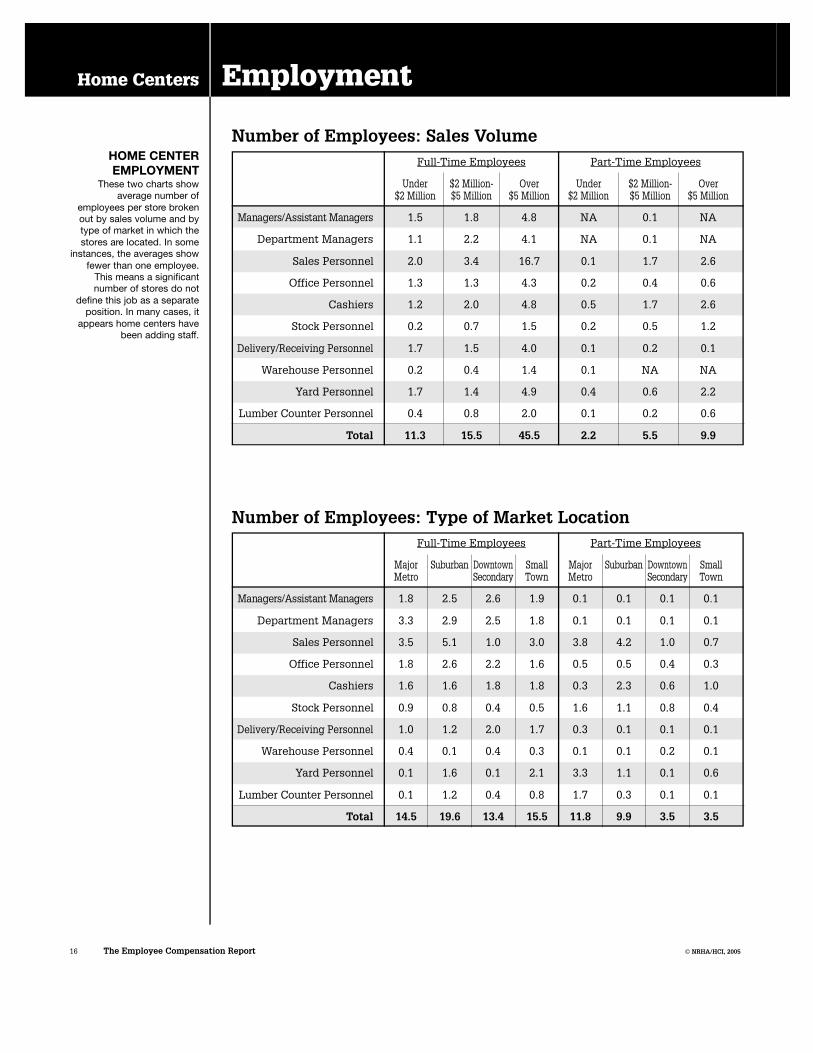
HOME CENTEREMPLOYMENT
These two charts showaverage number of
employees per store brokenout by sales volume and bytype of market in which thestores are located. In some
instances, the averages showfewer than one employee.
This means a significantnumber of stores do not
define this job as a separateposition. In many cases, it
appears home centers havebeen adding staff.
Number of Employees: Sales Volume
Number of Employees: Type of Market LocationFull-Time Employees Part-Time Employees
Major S u b u r b a n Downtown Small Major S u b u r b a n Downtown SmallMetro S e c o n d a ry Town Metro S e c o n d a ry Town
Managers/Assistant Managers 1.8 2.5 2.6 1.9 0.1 0.1 0.1 0.1
Department Managers 3.3 2.9 2.5 1.8 0.1 0.1 0.1 0.1
Sales Personnel 3.5 5.1 1.0 3.0 3.8 4.2 1.0 0.7
Office Personnel 1.8 2.6 2.2 1.6 0.5 0.5 0.4 0.3
Cashiers 1.6 1.6 1.8 1.8 0.3 2.3 0.6 1.0
Stock Personnel 0.9 0.8 0.4 0.5 1.6 1.1 0.8 0.4
Delivery/Receiving Personnel 1.0 1.2 2.0 1.7 0.3 0.1 0.1 0.1
Warehouse Personnel 0.4 0.1 0.4 0.3 0.1 0.1 0.2 0.1
Yard Personnel 0.1 1.6 0.1 2.1 3.3 1.1 0.1 0.6
Lumber Counter Personnel 0.1 1.2 0.4 0.8 1.7 0.3 0.1 0.1
Total 14.5 19.6 13.4 15.5 11.8 9.9 3.5 3.5
Full-Time Employees Part-Time Employees
Under $2 Million- Over Under $2 Million- Over$2 Million $5 Million $5 Million $2 Million $5 Million $5 Million
Managers/Assistant Managers 1.5 1.8 4.8 NA 0.1 NA
Department Managers 1.1 2.2 4.1 NA 0.1 NA
Sales Personnel 2.0 3.4 16.7 0.1 1.7 2.6
Office Personnel 1.3 1.3 4.3 0.2 0.4 0.6
Cashiers 1.2 2.0 4.8 0.5 1.7 2.6
Stock Personnel 0.2 0.7 1.5 0.2 0.5 1.2
Delivery/Receiving Personnel 1.7 1.5 4.0 0.1 0.2 0.1
Warehouse Personnel 0.2 0.4 1.4 0.1 NA NA
Yard Personnel 1.7 1.4 4.9 0.4 0.6 2.2
Lumber Counter Personnel 0.4 0.8 2.0 0.1 0.2 0.6
Total 11.3 15.5 45.5 2.2 5.5 9.9

Compensation
© NRHA/HCI, 2005 The Employee Compensation Report 17
Home Centers
HOME CENTERWAGESCharts on this page showaverage hourly wages paid byhome centers by sales volumeand by type of market in whichthe stores are located. The factmost hourly rates are wellabove the federal minimumwage reflects the competitivemarket for employees.
Hourly Wages: Sales Volume
Hourly Wages: Type of Market LocationFull-Time Employees Part-Time Employees
Major S u b u r b a n Downtown Small Major S u b u r b a n Downtown SmallMetro S e c o n d a ry Town Metro S e c o n d a ry Town
Managers/Assistant Managers $ 4 9 , 3 3 0 * $18.53 $18.98 $16.22 NA $17.00 $13.53 $15.59
Department Managers $12.38 $13.15 $10.00 $11.93 $10.98 $12.10 $10.63 $12.00
Sales Personnel $12.60 $13.15 $9.58 $9.78 $10.68 $9.15 $9.23 $8.73
Office Personnel $11.77 $12.46 $10.32 $10.48 $10.86 $9.86 $8.50 $8.87
Cashiers $8.82 $13.02 $8.37 $7.10 $9.23 $7.50 $8.73 $7.22
Stock Personnel $9.84 $9.51 $8.00 $8.73 $9.48 $9.13 $7.25 $6.50
Delivery/Receiving Personnel $12.03 $9.97 $10.30 $10.15 $8.00 $8.33 $7.35 $7.13
Warehouse Personnel $13.96 $10.75 $11.30 $8.46 NA $7.65 $8.25 $7.00
Yard Personnel $11.33 $11.09 $10.72 $7.47 $9.81 $9.20 $8.02 $7.68
Lumber Counter Personnel $13.76 $11.10 $11.30 $10.88 $9.70 $8.69 $9.37 $11.00
*Annual salary
Full-Time Employees Part-Time Employees
Under $2 Million- Over Under $2 Million- Over$2 Million $5 Million $5 Million $2 Million $5 Million $5 Million
Managers/Assistant Managers $14.91 $14.89 $18.95 $10.70 $17.00 $12.37
Department Managers $12.92 $10.96 $13.04 $10.20 $12.00 $11.03
Sales Personnel $9.19 $10.78 $13.70 $8.90 $9.73 $10.20
Office Personnel $10.20 $10.96 $13.11 $8.25 $10.39 $9.00
Cashiers $7.68 $8.29 $9.33 $7.09 $7.20 $8.28
Stock Personnel $8.00 $8.68 $10.43 $7.25 $8.69 $8.84
Delivery/Receiving Personnel $9.67 $9.71 $11.68 $6.26 $9.75 $10.50
Warehouse Personnel $8.71 $9.43 $10.95 $8.25 NA NA
Yard Personnel $9.92 $10.32 $10.09 $7.32 $7.98 $9.28
Lumber Counter Personnel $9.95 $10.33 $13.53 $9.95 $10.63 $11.00

18 The Employee Compensation Report © NRHA/HCI, 2005
CompensationHome Centers
BONUSESIn addition to hourly wages,
a large number of homecenters offer bonuses to
their employees. Charts onthis page show the
p e rcentage of re p o r t i n ghome centers that off e r
bonuses. It also shows theaverage percent of payro l l
that is paid out in bonuses.
Bonuses
Sales Volume
Percent of Home Centers Giving Bonuses
Management Employees 67%
Full-Time Employees 52%
Part-Time Employees 23%
Percent of Payroll Paid in Bonuses 6.8%
Type of Market LocationPercent of Home Centers Giving Bonuses
Major Metro Suburban D o w n t o w n S e c o n d a ry Small Town
Management Employees 75% 80% 40% 67%
Full-Time Employees 75% 67% 40% 49%
Part-Time Employees 16% 47% 12% 22%
P e rcent of Payroll Paid in Bonuses 5% 6% 4% 8%
Percent of Home Centers Giving Bonuses
Under $2 Million $2 Million-$5 Million Over $5 Million
Management Employees 69% 70% 61%
Full-Time Employees 50% 48% 65%
Part-Time Employees 15% 26% 30%
Percent of Payroll Paid in Bonuses 4% 7% 9%

Benefits
© NRHA/HCI, 2005 The Employee Compensation Report 19
Home Centers
INSURANCECOVERAGEA prime benefit is healthinsurance. It can beexpensive but may also bethe reason good employeeschose one employer overa n o t h e r. The charts on thisand the following thre epages detail the kinds ofhealth insurance off e red toemployees and their familiesby home centers and theportion of premiums paid bythe stores. The HistoricalComparison chart indicatesthat fewer home centers areo ffering group healthinsurance than did so in1988. Furthermore ,significantly fewer pay 100p e rcent of the pre m i u m s .That is attributable, in mostpart, to increased costs ofhealth insurance. However,cutting back on benefitscould put these independenthome centers at acompetitive disadvantage inhiring the best people.
Insurance CoveragePercent of Home Centers Offering Group Insurance
Major Dental Eye Disability LifeMedical Care Care
For Employees
Management 90% 47% 32% 42% 63%
Full-Time Employees 79% 45% 28% 38% 55%
Part-Time Employees 6% 5% 5% 6% 5%
For Employees’ Families
Management 75% 39% 26% 22% 38%
Full-Time Employees 58% 36% 21% 18% 33%
Part-Time Employees 4% 3% 3% 3% 1%
Insurance Premiums
Major Medical Insurance: Historical Comparison
Percent of Premiums Paid by Home Centers
0% 1%-24% 25%-49% 50%-74% 75%-99% 100%
For Employees 11% 1% 4% 25% 24% 36%
For Employees’ Families 51% 3% 4% 17% 12% 13%
Percent of Home Centers Offering Insurance
1988 1997 1999 2001 2005
For Employees
Management 98% 47% 97% 87% 90%
Full-Time Employees 97% 47% 95% 87% 79%
Part-Time Employees 12% 3% 5% 3% 6%
For Employees’ Families
Management 91% 34% 78% 67% 75%
Full-Time Employees 86% 31% 68% 66% 58%
Part-Time Employees 8% 1% 3% 1% 4%
Percent of Home Centers Paying 100% of Premium
For Employees 65% 53% 35% 35% 36%
For Employees’ Families NA 24% 14% 11% 13%
Source: NRHA/HCI compensation studies

20 The Employee Compensation Report © NRHA/HCI, 2005
BenefitsHome Centers
Insurance Offered to Management Employees: Sales VolumePercent of Home Centers Offering Coverage
Under $2 Million $2 Million-$5 Million Over $5 Million
For Employees
Major Medical 84% 73% 75%
Dental Care 13% 15% 43%
Eye Care 7% 7% 18%
Disability 5% 18% 37%
Life 26% 46% 66%
For Employees’ Families
Major Medical 44% 60% 58%
Dental Care 9% 13% 17%
Eye Care 4% 5% 17%
Disability 2% 9% 12%
Life 5% 13% 20%
Insurance Offered to Full-Time Employees: Sales VolumePercent of Home Centers Offering Coverage
Under $2 Million $2 Million-$5 Million Over $5 Million
For Employees
Major Medical 58% 73% 74%
Dental Care 11% 15% 20%
Eye Care 4% 8% 16%
Disability 5% 17% 16%
Life 8% 25% 22%
For Employees’ Families
Major Medical 36% 52% 53%
Dental Care 8% 11% 17%
Eye Care 3% 5% 13%
Disability 3% 8% 8%
Life 4% 15% 15%

Benefits
© NRHA/HCI, 2005 The Employee Compensation Report 21
Home Centers
Insurance Offered to Part-Time Employees: Sales VolumePercent of Home Centers Offering Coverage
Under $2 Million $2 Million-$5 Million Over $5 Million
For Employees
Major Medical 1% 4% 3%
Dental Care 1% 3% 3%
Eye Care 1% 3% 3%
Disability 1% 1% 4%
Life 1% 1% 5%
For Employees’ Families
Major Medical 1% 3% 1%
Dental Care 1% 1% 1%
Eye Care 1% 1% 1%
Disability 1% 1% 1%
Life 1% 1% 1%
Insurance Offered to Management Employees:Type of Market Location
Percent of Home Centers Offering Coverage
Major Metro Suburban D o w n t o w n S e c o n d a ry Small Town
For Employees
Major Medical 97% 93% 80% 90%
Dental Care 75% 60% 35% 43%
Eye Care 65% 40% 20% 27%
Disability 65% 60% 20% 35%
Life 97% 67% 48% 63%
For Employees’ Families
Major Medical 82% 73% 80% 75%
Dental Care 52% 47% 20% 37%
Eye Care 30% 33% 20% 12%
Disability 15% 14% 12% 18%
Life 35% 34% 25% 37%
22 The Employee Compensation Report © NRHA/HCI, 2005
BenefitsHome Centers
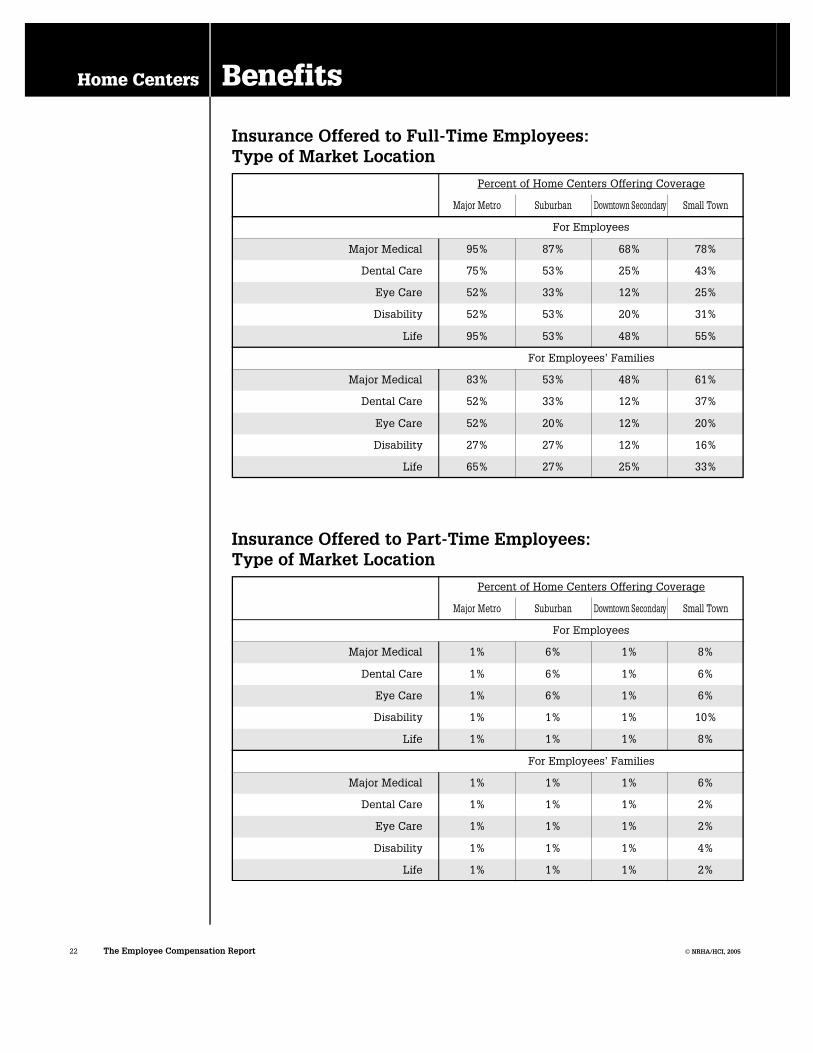
Insurance Offered to Full-Time Employees:Type of Market Location
Percent of Home Centers Offering Coverage
Major Metro Suburban D o w n t o w n S e c o n d a ry Small Town
For Employees
Major Medical 95% 87% 68% 78%
Dental Care 75% 53% 25% 43%
Eye Care 52% 33% 12% 25%
Disability 52% 53% 20% 31%
Life 95% 53% 48% 55%
For Employees’ Families
Major Medical 83% 53% 48% 61%
Dental Care 52% 33% 12% 37%
Eye Care 52% 20% 12% 20%
Disability 27% 27% 12% 16%
Life 65% 27% 25% 33%
Insurance Offered to Part-Time Employees:Type of Market Location
Percent of Home Centers Offering Coverage
Major Metro Suburban D o w n t o w n S e c o n d a ry Small Town
For Employees
Major Medical 1% 6% 1% 8%
Dental Care 1% 6% 1% 6%
Eye Care 1% 6% 1% 6%
Disability 1% 1% 1% 10%
Life 1% 1% 1% 8%
For Employees’ Families
Major Medical 1% 1% 1% 6%
Dental Care 1% 1% 1% 2%
Eye Care 1% 1% 1% 2%
Disability 1% 1% 1% 4%
Life 1% 1% 1% 2%

Benefits
© NRHA/HCI, 2005 The Employee Compensation Report 23
Home Centers
RETIREMENTBENEFITSR e t i rement plans are usuallyc o n s i d e red a benefit off e re dprimarily by large companies.Not only do smallerbusinesses worry about thecost, the paperwork re q u i re dto meet federal govern m e n tre q u i rements on deferre dcompensation can becomplicated and burd e n s o m e .These charts show thep e rcentage of reporting homecenters with some kind ofre t i rement plan for theiremployees. In recent years,the percentage of store so ffering this benefit hasactually increased slightly.
Percent of Home Centers Offering Retirement Benefits
Management 70%
Full-Time Employees 67%
Part-Time Employees 15%
Retirement Benefits
Type of Market LocationPercent of Home Centers Offering Retirement Benefits
Major Metro Suburban D o w n t o w n S e c o n d a ry Small Town
Management Employees 55% 68% 43% 67%
Full-Time Employees 55% 67% 43% 67%
Part-Time Employees 25% 7% 10% 18%
Sales VolumePercent of Home Centers Offering Retirement Benefits
Under $2 Million $2 Million-$5 Million Over $5 Million
Management Employees 62% 63% 87%
Full-Time Employees 58% 59% 87%
Part-Time Employees 4% 15% 26%
Historical ComparisonPercent of Home Centers Offering Retirement Benefits
1999 2001 2005
Management Employees 65% 64% 70%
Full-Time Employees 63% 64% 67%
Part-Time Employees 27% 16% 15%
Source: NRHA/HCI compensation studies

24 The Employee Compensation Report © NRHA/HCI, 2005
BenefitsHome Centers
PAID TIME OFFVacation and paid sick or
personal days are benefitsthat all employees
a p p reciate. These chartsshow the practices of homecenters in giving employees
paid time off. In general,most stores give
management and full-timeemployees one or twoweeks or more of paid
vacation a year; few off e rany amount of vacation to
part-time employees. Ag rowing number of store so ffer paid sick or personal
days off but tend to limitthis benefit to management
and full-time employees.
EMPLOYEE TRAININGWell-trained employees are
a competitive advantage.Yet, only 26 percent of
responding home centershave a formal trainingp rogram. As this chart
shows, less than 10 perc e n tof them budget annually for
training and the amount issmall, slightly less than one
tenth of one percent ofsales for the typical home
center profiled inN R H A / H C I ’s 2005 Cost of
Doing Business Study.
Percent of Companies with Formal Training Programs 26%
Average Annual Hours of Training for Management 13.2 hrs.
Average Annual Hours of Training for Full-Time Employees 13 hrs.
Average Annual Hours of Training for Part-Time Employees 8 hrs.
Percent of Companies that Have a Training Budget 9%
Average Amount Budgeted for Training $3,400
Employee Training
Annual Paid VacationPercent of Home Centers Giving Paid Vacations
No Days 1-5 Days 6-10 Days M o re than 10 Days
Management Employees 13% 11% 39% 37%
Full-Time Employees 15% 20% 45% 21%
Part-Time Employees 90% 7% 3% 2%
Paid Sick/Personal Days AnnuallyPercent of Home Centers Offering Paid Days Off
No Days 1-5 Days 6-10 Days M o re than 10 Days
Management Employees 36% 40% 18% 6%
Full-Time Employees 37% 40% 21% 2%
Part-Time Employees 95% 3% 1% 1%

Summary & Historical Data
© NRHA/HCI, 2005 The Employee Compensation Report 25
LBM Outlets
SUMMARY DATAThis chart summarizes thenumber of full-time and part-time employees working inlumber/building materialoutlets submitting data forthe 2005 E m p l o y e eCompensation Report a n dthe average hourly wagespaid to those employees.The wage data can be usedas a general guide to salariesin the lumber/buildingmaterial segment of thehome improvement industry;h o w e v e r, local marketconditions should be takeninto account in establishingor evaluating salary/wages t r u c t u re s .
PAYROLL STRUCTUREThe payroll structure forlumber/building materialoutlets comes from theNRHA/HCI 2005 Cost ofDoing Business Study. Itindicates that payroll is 14.2%of net sales and that salaries,wages, and bonuses accountfor 11.9% of sales—84% ofp a y roll expenses. The graphon page 26 tracks payroll as ap e rcent of sales for the past20 years, comparing averageLBM outlets to high-pro f i tc o m p a n i e s .
EMPLOYEEPRODUCTIVITYThese ratios help to evaluatethe investment in employeesand their re t u rn on thatinvestment. Sales and gro s sm a rgin per employee measureemployee performance; thet h ree payroll expense ratiosshow the cost of employees;the personnel pro d u c t i v i t yratio shows payroll as ap e rcent of gross marg i n .
How Many Employees and How Much Are They Paid?Full-Time Employees Part-Time Employees
Number Average Number AveragePer Store Hourly Wage Per Store Hourly Wage
Owners/Officers 1.7 $72,725* 0.1 $42,500*
Managers/Assistant Managers 1.9 $18.72 0.1 $12.25
Department Managers 2.0 $12.50 0.1 $9.00
Sales Personnel 2.6 $12.11 0.1 $8.03
Office Personnel 2.1 $11.36 0.1 $9.10
Cashiers 1.9 $9.18 0.2 $7.45
Stock Personnel 1.1 $8.46 0.3 $7.27
Delivery/Receiving Personnel 2.4 $10.48 0.1 $8.58
Warehouse Personnel 2.2 $10.21 0.2 $7.63
Yard Personnel 4.0 $9.12 0.6 $7.90
Lumber Counter Personnel 2.2 $11.15 0.1 $7.00
Total 24.1 2.0*Annual salary
Owners/Officers Salaries & Bonuses 1.7%
All Other Employee Salaries, Wages & Bonuses 10.2%
Total Salaries, Wages & Bonuses 11.9%
Payroll Taxes, FICA, Workers’ Comp & Unemployment 1.1%
Group Insurance (Hospital/Medical/Life) 1.0%
Benefit Plans (Pension, Profit Sharing, etc.) 0.2%
Total Payroll Expenses 14.2%Source: NRHA/HCI 2005 Cost of Doing Business Study
Payroll Expenses as a Percent of Net Sales
Number of Full-Time Equivalent Employees 20.0
Sales per Employee $269,776
Gross Margin per Employee $68,940
Payroll per Employee (including benefits) $38,400
Salary per Employee $32,211
Payroll Expense as Percent of Sales 14.2%
Personnel Productivity Ratio 55.7%
Source: NRHA/HCI 2005 Cost of Doing Business Study
Employee Productivity Ratios

26 The Employee Compensation Report © NRHA/HCI, 2005
Summary & Historical DataLBM Outlets
HISTORICALCOMPARISON
This chart shows employeeproductivity ratios for the last
20 years in five-yearincrements. It puts current
payroll structures andemployee performance in
perspective. Between 1986 and2005, salaries have incre a s e d ;
however, after 15 years ofimprovement, productivity
ratios declined in 2005.
EMPLOYEETURNOVER
To derive the annualemployee turnover rate, we
asked retailers how manyemployees had left or been
fired and then replaced.Because part-time employees
move more often than full-time, we show turnover rates
for both. Turnover rates forfull-time employees increased
slightly while turnover forpart-timers decreased.
Employee Productivity: Historical Comparison1986 1991 1996 2001 2005
Number of Employees 14 13 14 18.5 20
Sales per Employee $144,238 $159,528 $195,990 $240,793 $269,776
Gross Margin per Employee $37,304 $41,348 $47,964 $63,263 $68,940
Payroll per Employee $20,856 $24,117 $27,109 $38,422 $38,400
Salary per Employee $17,709 $20,674 $22,789 $31,988 $32,211
Payroll as Percent of Sales 14.6% 15.1% 14.2% 15.5% 14.2%
Personnel Productivity Ratio 56.7% 58.3% 57.7% 60.3% 55.7%
Source: Annual cost of doing business surveys
Payroll as % of Sales: Typical vs. High-Profit Stores
Source: NRHA/HCI annual cost of doing business surveys
Average
High-Profit
Annual Employee Turnover RatesSales Volume Type of Market Location
Under $2 Million- Over Major S u b u r b a n Downtown Small$2 Million $5 Million $5 Million Metro S e c o n d a ry Town
Full Time Average: 29% 34% 26% 27% 43% 18% 35% 30%
Part Time Average: 42% 25% 30% 44% 33% 60% 40% 62%
Historical Comparison 1997 1999 2001 2005
Full Time 21% 26% 26% 29%
Part Time 58% 57% 45% 42%
Source: NRHA/HCI compensation studies

Employment
© NRHA/HCI, 2005 The Employee Compensation Report 27
LBM Outlets
LUMBER/BUILDINGMATERIAL OUTLETEMPLOYMENTThese two charts showaverage number of employeesper store broken out by salesvolume and by type of marketin which the stores arelocated. In some instances,the averages show fewer thanone employee. This means asignificant number of store sdo not define this job as aseparate position. As ageneral rule, LBM outletsseem to be maintainings t a ffing levels.
Number of Employees: Type of Market LocationFull-Time Employees Part-Time Employees
Major S u b u r b a n D o w n t o w n Small Major S u b u r b a n D o w n t o w n SmallMetro S e c o n d a ry Town Metro S e c o n d a ry Town
Managers/Assistant Managers 1.0 1.7 1.0 1.2 0.5 0.1 0.1 0.1
Department Managers 2.2 1.4 1.0 1.0 0.5 0.1 0.1 0.1
Sales Personnel 3.5 2.9 2.2 2.0 0.2 0.5 0.2 0.5
Office Personnel 2.0 2.0 1.3 1.5 0.2 0.3 0.8 0.2
Cashiers 1.5 0.6 1.8 0.8 0.7 0.5 0.5 0.7
Stock Personnel 4.2 0.8 0.8 0.3 0.5 0.2 0.5 0.5
Delivery/Receiving Personnel 3.0 2.2 2.4 2.1 0.2 1.0 0.1 0.2
Warehouse Personnel 2.0 0.8 1.4 0.2 0.3 0.2 0.1 0.3
Yard Personnel 5.0 1.9 3.4 3.9 0.8 0.5 0.1 0.8
Lumber Counter Personnel 5.5 0.9 1.6 0.9 0.1 0.5 0.2 0.1
Total 29.9 15.2 16.9 13.9 4.0 3.9 2.7 3.5
Number of Employees: Sales VolumeFull-Time Employees Part-Time Employees
Under $2 Million- Over Under $2 Million- Over$2 Million $5 Million $5 Million $2 Million $5 Million $5 Million
Managers/Assistant Managers 0.8 0.9 1.6 0.1 0.1 0.1
Department Managers 0.3 0.9 1.4 0.1 0.1 0.1
Sales Personnel 1.3 2.6 4.4 0.1 0.2 2.7
Office Personnel 0.2 1.5 1.8 0.1 0.4 0.1
Cashiers 0.4 1.3 2.1 0.1 0.5 0.5
Stock Personnel 0.4 0.2 1.2 0.2 0.4 1.2
Delivery/Receiving Personnel 0.4 1.6 1.6 0.2 0.1 0.6
Warehouse Personnel 0.4 0.2 1.2 0.6 0.1 0.1
Yard Personnel 1.6 1.6 5.2 0.2 0.1 0.4
Lumber Counter Personnel 1.4 1.3 3.4 0.1 0.5 1.1
Total 7.2 12.1 23.9 1.8 2.5 6.9

28 The Employee Compensation Report © NRHA/HCI, 2005
CompensationLBM Outlets
LUMBER/BUILDINGMATERIAL OUTLET
WAGESCharts on this page show
average hourly wages paid by lumber/building material
outlets by sales volume andby type of market in which
the stores are located. Wageshave increased across some
but not all job categories inthe last three years, perhapsreflecting pressure to contain
payroll expenses.
Hourly Wages: Type of Market Location
Hourly Wages: Sales VolumeFull-Time Employees Part-Time Employees
Under $2 Million- Over Under $2 Million- Over$2 Million $5 Million $5 Million $2 Million $5 Million $5 Million
Managers/Assistant Managers $16.50 $49,371* $62,429* $9.90 $45,000* $13.20
Department Managers $11.15 $11.50 $14.75 $9.75 $10.71 $10.95
Sales Personnel $10.50 $10.20 $12.83 $8.93 $8.65 $10.13
Office Personnel $10.35 $10.12 $12.67 $8.50 $8.00 $9.68
Cashiers $8.32 $8.00 $10.50 $7.85 $7.75 $7.45
Stock Personnel $8.31 $8.17 $11.75 $6.95 $7.25 $7.30
Delivery/Receiving Personnel $8.91 $9.97 $12.27 $8.00 $9.61 $9.15
Warehouse Personnel $8.00 $9.00 $10.75 $8.13 $6.50 $7.75
Yard Personnel $8.09 $9.03 $10.33 $7.00 $8.15 $8.00
Lumber Counter Personnel $9.12 $10.03 $11.90 $7.00 $8.30 $8.10
*Annual salary
Full-Time Employees Part-Time Employees
Major S u b u r b a n Small Major S u b u r b a n SmallMetro Town Metro Town
Managers/Assistant Managers $17.50 $16.00 $48,311* $10.31 $9.82 $10.75
Department Managers $14.25 $11.75 $33,000* $11.50 $8.25 $10.60
Sales Personnel $10.75 $12.83 $10.18 $9.83 $9.75 $10.50
Office Personnel $10.80 $11.95 $11.12 $10.23 $9.45 $9.45
Cashiers $11.50 $11.16 $8.71 $6.75 $9.13 $7.45
Stock Personnel $11.25 $9.17 $8.56 $8.44 $9.20 $6.50
Delivery/Receiving Personnel $10.50 $11.23 $10.34 $12.00 $6.78 $8.58
Warehouse Personnel $9.75 $11.48 $9.87 $10.50 $6.25 $8.08
Yard Personnel $10.60 $8.81 $7.60 $6.65 $8.75 $7.56
Lumber Counter Personnel $14.50 $13.15 $10.75 $10.07 $10.26 $9.72
*Annual salary

Compensation
© NRHA/HCI, 2005 The Employee Compensation Report 29
LBM Outlets
BONUSESIn addition to hourly wages, a large number of lumber/building material outlets offerbonuses to their employees.Charts on this page show thepercentage of reporting LBMoutlets that offer bonuses. It also shows the averagepercent of payroll that is paid out in bonuses—6%.
Bonuses
Sales Volume
Percent of LBM Outlets Giving Bonuses
To Management Employees 67%
To Full-Time Employees 57%
To Part-Time Employees 33%
Percent of Payroll Paid in Bonuses 6%
Type of Market LocationPercent of LBM Outlets Giving Bonuses
Major Metro Suburban D o w n t o w n S e c o n d a ry Small Town
To Management Employees 90% 77% 80% 59%
To Full-Time Employees 80% 69% 65% 48%
To Part-Time Employees 25% 23% 40% 41%
Percent of Payroll Paid in Bonuses 10% 8% 5% 4%
Percent of LBM Outlets Giving Bonuses
Under $2 Million $2 Million-$5 Million Over $5 Million
To Management Employees 53% 72% 77%
To Full-Time Employees 53% 72% 54%
To Part-Time Employees 20% 44% 31%
Percent of Payroll Paid in Bonuses 4% 5% 9%
30 The Employee Compensation Report © NRHA/HCI, 2005
BenefitsLBM Outlets
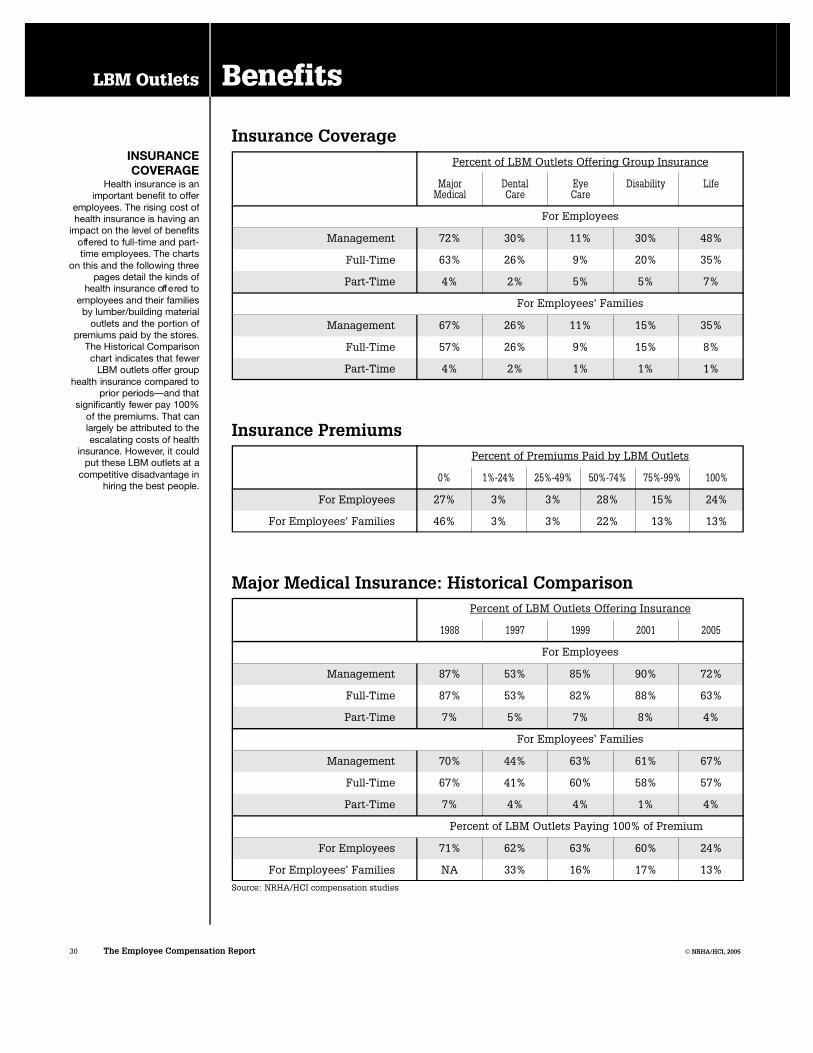
INSURANCECOVERAGE
Health insurance is animportant benefit to off e r
employees. The rising cost ofhealth insurance is having an
impact on the level of benefitso ff e red to full-time and part-time employees. The charts
on this and the following thre epages detail the kinds of
health insurance off e red toemployees and their families
by lumber/building materialoutlets and the portion of
p remiums paid by the store s .The Historical Comparisonchart indicates that fewer
LBM outlets offer gro u phealth insurance compared to
prior periods—and thatsignificantly fewer pay 100%
of the premiums. That canl a rgely be attributed to theescalating costs of health
insurance. However, it couldput these LBM outlets at a
competitive disadvantage inhiring the best people.
Insurance CoveragePercent of LBM Outlets Offering Group Insurance
Major Dental Eye Disability LifeMedical Care Care
For Employees
Management 72% 30% 11% 30% 48%
Full-Time 63% 26% 9% 20% 35%
Part-Time 4% 2% 5% 5% 7%
For Employees’ Families
Management 67% 26% 11% 15% 35%
Full-Time 57% 26% 9% 15% 8%
Part-Time 4% 2% 1% 1% 1%
Insurance Premiums
Major Medical Insurance: Historical Comparison
Percent of Premiums Paid by LBM Outlets
0% 1%-24% 25%-49% 50%-74% 75%-99% 100%
For Employees 27% 3% 3% 28% 15% 24%
For Employees’ Families 46% 3% 3% 22% 13% 13%
Percent of LBM Outlets Offering Insurance
1988 1997 1999 2001 2005
For Employees
Management 87% 53% 85% 90% 72%
Full-Time 87% 53% 82% 88% 63%
Part-Time 7% 5% 7% 8% 4%
For Employees’ Families
Management 70% 44% 63% 61% 67%
Full-Time 67% 41% 60% 58% 57%
Part-Time 7% 4% 4% 1% 4%
Percent of LBM Outlets Paying 100% of Premium
For Employees 71% 62% 63% 60% 24%
For Employees’ Families NA 33% 16% 17% 13%
Source: NRHA/HCI compensation studies

Benefits
© NRHA/HCI, 2005 The Employee Compensation Report 31
LBM Outlets
Insurance Offered to Management Employees: Sales VolumePercent of LBM Outlets Offering Coverage
Under $2 Million $2 Million-$5 Million Over $5 Million
For Employees
Major Medical 68% 71% 75%
Dental Care 22% 32% 41%
Eye Care 13% 15% 18%
Disability 17% 13% 21%
Life 23% 44% 65%
For Employees’ Families
Major Medical 42% 49% 66%
Dental Care 19% 25% 38%
Eye Care 8% 8% 15%
Disability 10% 6% 14%
Life 9% 13% 29%
Insurance Offered to Full-Time Employees: Sales VolumePercent of LBM Outlets Offering Coverage
Under $2 Million $2 Million-$5 Million Over $5 Million
For Employees
Major Medical 58% 66% 74%
Dental Care 21% 25% 41%
Eye Care 8% 11% 18%
Disability 8% 13% 28%
Life 30% 30% 62%
For Employees’ Families
Major Medical 39% 44% 65%
Dental Care 19% 22% 35%
Eye Care 7% 8% 15%
Disability 7% 6% 14%
Life 17% 13% 24%

32 The Employee Compensation Report © NRHA/HCI, 2005
BenefitsLBM Outlets
Insurance Offered to Management Employees:Type of Market Location
Percent of LBM Outlets Offering Coverage
Major Metro Suburban D o w n t o w n S e c o n d a ry Small Town
For Employees
Major Medical 77% 69% 93% 70%
Dental Care 33% 31% 33% 33%
Eye Care 33% 23% 33% 4%
Disability 30% 38% 67% 26%
Life 60% 39% 63% 48%
For Employees’ Families
Major Medical 73% 59% 77% 67%
Dental Care 18% 31% 33% 26%
Eye Care 30% 23% 24% 4%
Disability 30% 31% 33% 19%
Life 20% 39% 20% 30%
Insurance Offered to Part-Time Employees: Sales VolumePercent of LBM Outlets Offering Coverage
Under $2 Million $2 Million-$5 Million Over $5 Million
For Employees
Major Medical 4% 2% 4%
Dental Care 3% 2% 1%
Eye Care 2% 1% 1%
Disability 2% 1% 1%
Life 4% 2% 2%
For Employees’ Families
Major Medical 1% 2% 4%
Dental Care 1% 2% 1%
Eye Care 1% 1% 1%
Disability 1% 1% 1%
Life 1% 1% 1%
Benefits
© NRHA/HCI, 2005 The Employee Compensation Report 33
LBM Outlets
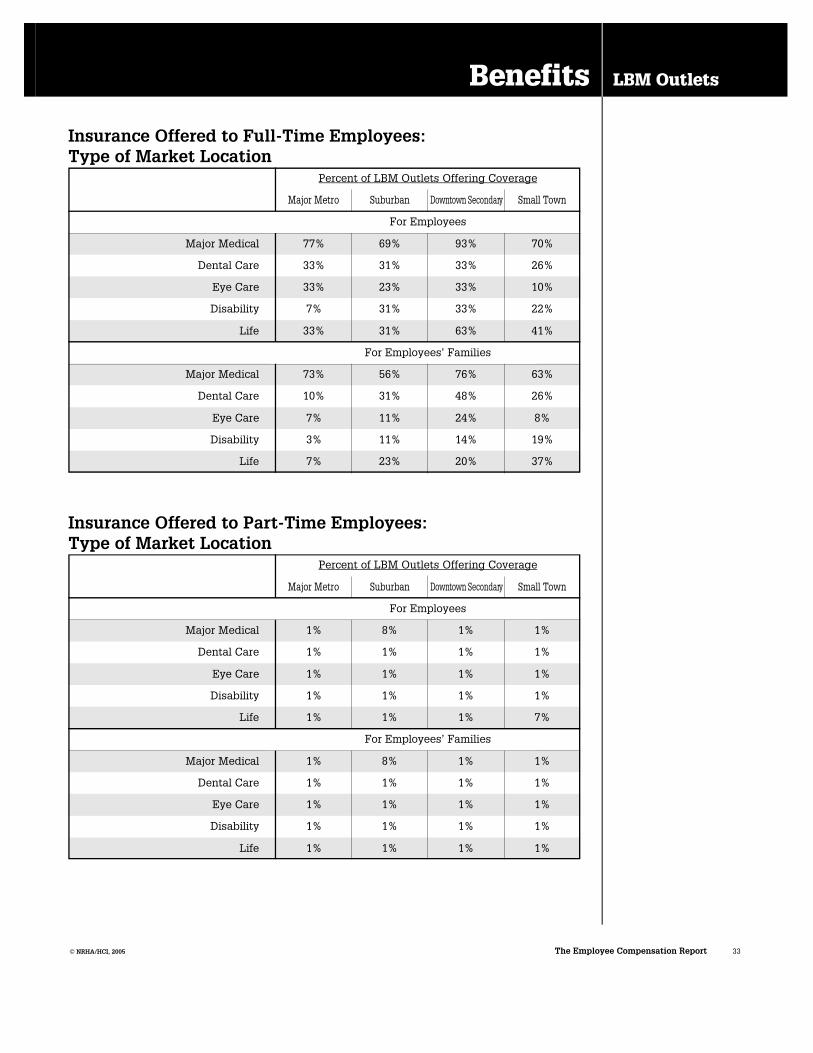
Insurance Offered to Full-Time Employees:Type of Market Location
Percent of LBM Outlets Offering Coverage
Major Metro Suburban D o w n t o w n S e c o n d a ry Small Town
For Employees
Major Medical 77% 69% 93% 70%
Dental Care 33% 31% 33% 26%
Eye Care 33% 23% 33% 10%
Disability 7% 31% 33% 22%
Life 33% 31% 63% 41%
For Employees’ Families
Major Medical 73% 56% 76% 63%
Dental Care 10% 31% 48% 26%
Eye Care 7% 11% 24% 8%
Disability 3% 11% 14% 19%
Life 7% 23% 20% 37%
Insurance Offered to Part-Time Employees:Type of Market Location
Percent of LBM Outlets Offering Coverage
Major Metro Suburban D o w n t o w n S e c o n d a ry Small Town
For Employees
Major Medical 1% 8% 1% 1%
Dental Care 1% 1% 1% 1%
Eye Care 1% 1% 1% 1%
Disability 1% 1% 1% 1%
Life 1% 1% 1% 7%
For Employees’ Families
Major Medical 1% 8% 1% 1%
Dental Care 1% 1% 1% 1%
Eye Care 1% 1% 1% 1%
Disability 1% 1% 1% 1%
Life 1% 1% 1% 1%

34 The Employee Compensation Report © NRHA/HCI, 2005
BenefitsLBM Outlets
RETIREMENTBENEFITS
Fewer LBM retailers areo ffering their employees a
re t i rement program, followinga trend that is evident acro s s
most industries. For smallerbusinesses, the paperworkhassles related to deferre d
compensation plans outweighthe benefits. These charts
show the percentage ofreporting lumber/building
material outlets with somekind of re t i rement plan fortheir employees. Over the
years, fewer stores have madethis benefit available to full-
time and part-time employees.
Percent of LBM Outlets Offering Retirement Benefits
Management 50%
Full-Time Employees 54%
Part-Time Employees 9%
Retirement Benefits
Type of Market LocationPercent of LBM Outlets Offering Retirement Benefits
Major Metro Suburban D o w n t o w n S e c o n d a ry Small Town
Management Employees 43% 70% 62% 37%
Full-Time Employees 43% 70% 62% 44%
Part-Time Employees 12% 10% 15% 15%
Historical ComparisonPercent of LBM Outlets Offering Retirement Benefits
1999 2001 2005
Management Employees 57% 70% 50%
Full-Time Employees 55% 70% 54%
Part-Time Employees 11% 15% 9%
Source: NRHA/HCI compensation studies
Sales VolumePercent of LBM Outlets Offering Retirement Benefits
Under $2 Million $2 Million-$5 Million Over $5 Million
Management Employees 27% 50% 77%
Full-Time Employees 27% 61% 77%
Part-Time Employees 13% 11% 10%
Benefits
© NRHA/HCI, 2005 The Employee Compensation Report 35
LBM Outlets
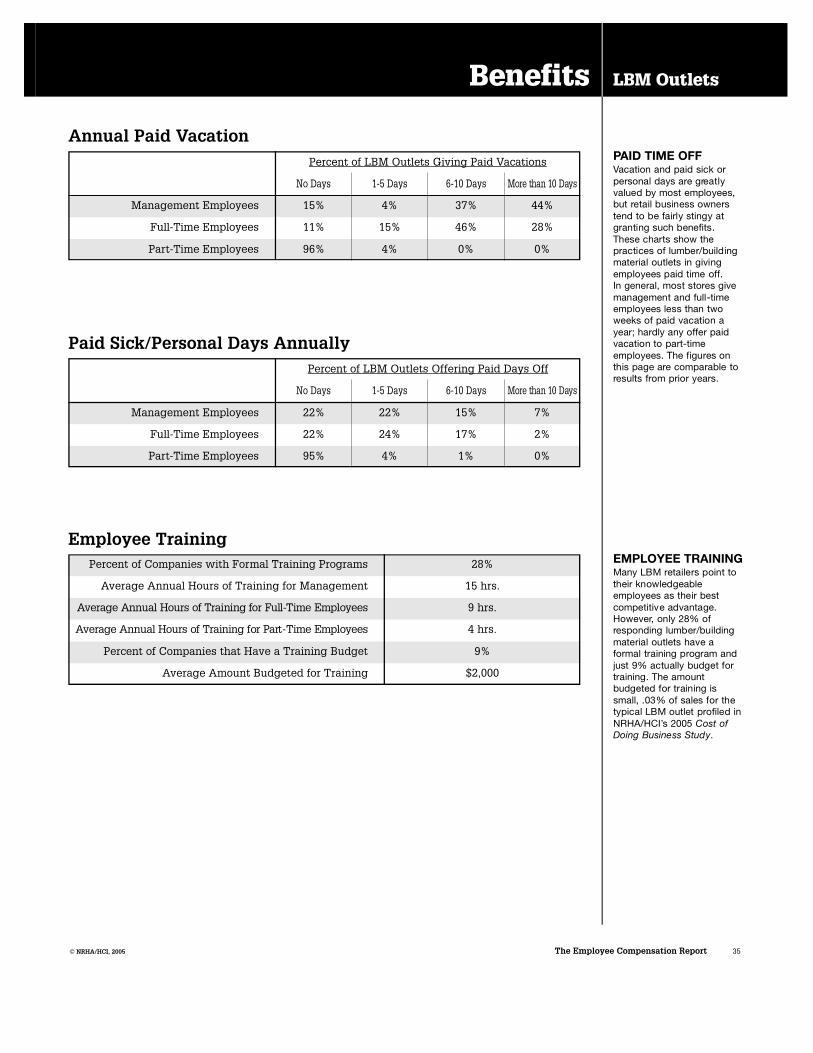
PAID TIME OFFVacation and paid sick orpersonal days are gre a t l yvalued by most employees,but retail business ownerstend to be fairly stingy atgranting such benefits.These charts show thepractices of lumber/buildingmaterial outlets in givingemployees paid time off. In general, most stores givemanagement and full-timeemployees less than twoweeks of paid vacation ayear; hardly any offer paidvacation to part-timeemployees. The figures onthis page are comparable toresults from prior years.
EMPLOYEE TRAININGMany LBM retailers point totheir knowledgeableemployees as their bestcompetitive advantage.H o w e v e r, only 28% ofresponding lumber/buildingmaterial outlets have aformal training program andjust 9% actually budget fortraining. The amountbudgeted for training issmall, .03% of sales for thetypical LBM outlet profiled inN R H A / H C I ’s 2005 Cost ofDoing Business Study.
Percent of Companies with Formal Training Programs 28%
Average Annual Hours of Training for Management 15 hrs.
Average Annual Hours of Training for Full-Time Employees 9 hrs.
Average Annual Hours of Training for Part - Time Employees 4 hrs.
Percent of Companies that Have a Training Budget 9%
Average Amount Budgeted for Training $2,000
Employee Training
Annual Paid VacationPercent of LBM Outlets Giving Paid Vacations
No Days 1-5 Days 6-10 Days M o re than 10 Days
Management Employees 15% 4% 37% 44%
Full-Time Employees 11% 15% 46% 28%
Part-Time Employees 96% 4% 0% 0%
Paid Sick/Personal Days AnnuallyPercent of LBM Outlets Offering Paid Days Off
No Days 1-5 Days 6-10 Days M o re than 10 Days
Management Employees 22% 22% 15% 7%
Full-Time Employees 22% 24% 17% 2%
Part-Time Employees 95% 4% 1% 0%
36 The Employee Compensation Report © NRHA/HCI, 2005
Retail Hardware Associations
NORTH AMERICAN RETAIL HARDWARE ASSOCIATION
5822 W. 74th StreetIndianapolis, IN 46278(317) 290-0338Fax: (317) 328-4354E-mail: [email protected] site: www.nrha.org
NRHA Board of Directors
PresidentThomas M. Green Sr., Rochester, NY
Executive Vice PresidentWalter Toole, Winter Garden, FL
First Vice PresidentRichard N. Thomes, Arlington, MN
Second Vice PresidentKenneth Eilers, Mercedes, TX
Third Vice PresidentDonald Lochard, Sidney, OH
Immediate Past PresidentMichael O’Hara, Ottumwa, IA
DirectorsMary Ricker, Billings, MTLinda Johnson, Western Springs, ILTom Ruedisueli, Oscoda, MIMario Giannetti, Ottawa, ON, CanadaDennis Allen, Sunnyside, WA
NRHA Headquarters Staff
Managing DirectorJohn P. Hammond
Executive Vice President-COOThomas W. Smith
Vice President/PublishingKevin M. Hohman
Vice President of Catalog Operations and Creative Services
Bill LeeEditor
Dan M. TratensekExecutive Editor
Chris JensenNRHA Canada
Scott HoyScarborough, ON(416) 264-6664
Direct Membership Regions
Far West Region Indiana-Kentucky-Tennessee Region Iowa Retail Hardware Association Ohio RegionSoutheast Region
Thomas W. SmithIndianapolis, IN (800) 282-1642
Northeast Retail Hardware Association Todd BellowsEast Syracuse, NY (315) 437-7318
Pacific Northwest Region Ron MooreSalem, OR (503) 375-9024
Southwestern Region Jeff FloraFort Worth, TX (817) 625-5562
Affiliated Associations
Michigan Retail Hardware Association Mike SteeleLansing, MI (517) 394-1710
Midwest Hardware Association John HakaStevens Point, WI(715) 341-7100
Minnesota-Dakotas Retail Hardware Association Mac HardinHopkins, MN(952) 933-2026
HOME CENTER INSTITUTE5822 W. 74th StreetIndianapolis, IN 46278(317) 290-0338Fax: (317) 328-4354
Executive DirectorKevin M. Hohman(317) 299-0339
HCI Advisory Board
ChairmanCharles Bender, Busy Beaver Building Centers
DirectorsRichard Damman, Damman HardwareArt Dragoo, Dye Lumber Inc.Greg Fuller, All American Home CenterGerald Wille, Edward Hines Lumber Co.C. Stan Hardman, Hardman Supply Co.Rocco Falcone, Rocky's AceHoward Elsberry, Westlake Hardware Inc.

2005 EMPLOYEE COMPENSATION STUDY
5822 W. 74th St. • Indianapolis, IN 46278
317.290.0338 • Fax 317.328.4354
E-mail: [email protected] • www.nrha.org