2005 baw baw shire statpro
TRANSCRIPT

December 2005
STATISTICAL PROFILE
BAW BAW SHIRE
Prepared by: Gippsland Research & Information ServiceSchool of Humanities, Communications and Social Sciences
Monash University Gippsland Campus CHURCHILL VIC 3842

Disclaimer
Any representation, statement, opinion or advice, expressed or implied in this publication is made in good faith but on the basis that the Gippsland Research & Information Service, its agents and employees are not liable (whether by reason of negligence, lack of care or otherwise) to any person for any damage or loss whatsoever which has occurred or may occur in relation to that person taking or not taking (as the case may be) action in respect of any representation, statement, or advice referred to.

STATISTICAL PROFILE
BAW BAW SHIRE
December 2005
BAW BAW SHIRE COUNCIL
Municipal Offices Civic Place – Warragul
PO Box 304 – Warragul – Victoria – 3820 Telephone: 5624 2411 Facsimile: 5622 3654
Prepared by:
GIPPSLAND RESEARCH & INFORMATION SERVICE
School of Humanities, Communications and Social Sciences Monash University Churchill, Victoria 3842 Telephone: 5122 6418 Facsimile: 5122 6888 Email: [email protected] Web: www.gris.com.au


TABLE OF CONTENTS
EXPLANATORY NOTE 1
1.0 WEATHER 2
TABLE 1 (a): RAINFALL STATISTICS, Erica 2 TABLE 1 (b): RAINFALL STATISTICS, Warragul 2 TABLE 2 (a): MEAN DAILY TEMPERATURE, Erica 3 TABLE 2 (b): MEAN DAILY TEMPERATURE, Warragul 3 TABLE 3: AVERAGE RAINFALL BY SEASON (mm) – WEST GIPPSLAND DISTRICT 4
2.0 COMMUNITY PROFILE 5
TABLE 4: ESTIMATED RESIDENT POPULATION – BAW BAW SHIRE 5 TABLE 5: POPULATION GROWTH 6 TABLE 6: AGE DISTRIBUTION 6 TABLE 7: ESTIMATED POPULATION PROJECTIONS – AGE by Sex, BAW BAW SHIRE 8 TABLE 8: POPULATION PROJECTIONS BY AGE GROUPS 9 TABLE 9: SELECTED POPULATION CHARACTERISTICS 10 TABLE 10: TOWNSHIP PROFILE (BAW BAW SHIRE) 11 TABLE 11: INDIGENOUS PROFILE 13 TABLE 12: LIFE EXPECTANCY AT BIRTH 14 TABLE 13: CAUSES OF DEATH (a) – West Gippsland Statistical Subdivision, 1999 and 2003 15 TABLE 14: PROVISIONAL CRIME STATISTICS 16
3.0 EDUCATION 17
TABLE 15: GOVERNMENT & NON-GOVERNMENT SCHOOL ENROLMENTS 17 TABLE 16: EDUCATION CHARACTERISTICS 19
4.0 INCOME 20
TABLE 17 (a): AVERAGE TAXABLE INCOME OF INDIVIDUALS, Drouin 20 TABLE 17 (b): AVERAGE TAXABLE INCOME OF INDIVIDUALS, Trafalgar 20 TABLE 17 (c): AVERAGE TAXABLE INCOME OF INDIVIDUALS, Warragul 20 TABLE 17 (d): AVERAGE TAXABLE INCOME OF INDIVIDUALS, Yarragon 21 TABLE 17 (e): AVERAGE TAXABLE INCOME OF INDIVIDUALS, Baw Baw Shire 21 TABLE 17 (f): AVERAGE TAXABLE INCOME OF INDIVIDUALS BY REGION 21 TABLE 18: WEEKLY INDIVIDUAL INCOME 22 TABLE 19: WEEKLY HOUSEHOLD INCOME 22 TABLE 20 (a): PENSION AND BENEFIT RECIPIENTS, Drouin 23 TABLE 20 (b): PENSION AND BENEFIT RECIPIENTS, Trafalgar 24 TABLE 20 (c): PENSION AND BENEFIT RECIPIENTS, Warragul 25 TABLE 20 (d): PENSION AND BENEFIT RECIPIENTS, Yarragon 26 TABLE 20 (e): PENSION AND BENEFIT RECIPIENTS, Baw Baw Shire 27
5.0 HOUSING 28
TABLE 21: SELECTED HOUSING CHARACTERISTICS 28 TABLE 22: DWELLING TYPE, PERSONS AGED 45 YEARS AND OVER (a) – number of persons 29 TABLE 23: DWELLING WEEKLY RENT 31 TABLE 24: DWELLING MONTHLY MORTGAGE PAYMENTS 31 TABLE 25: BUILDING APPROVALS – DWELLINGS – BAW BAW SHIRE 32 TABLE 26: RESIDENTIAL PROPERTY SALES 32 TABLE 27 (a): MEDIAN HOUSE PRICES 33 TABLE 27 (b): MEDIAN VACANT HOUSE BLOCK PRICES 33
6.0 ECONOMIC CHARACTERISTICS 34
TABLE 28: SELECTED EMPLOYMENT CHARACTERISTICS 34 TABLE 29: LABOUR FORCE PARTICIPATION, Persons Aged 45+ 35 TABLE 30: EMPLOYMENT BY INDUSTRY SECTOR – BAW BAW SHIRE (a) 36 TABLE 31: BUSINESS ESTABLISHMENTS BY TOWNSHIP – BAW BAW SHIRE – 2001 (a) 36 TABLE 32: LABOUR FORCE BY OCCUPATION 37 TABLE 33: NUMBER AND RATE1 UNEMPLOYED 37 TABLE 34: TOURIST ACCOMMODATION STATISTICS (a) 38 TABLE 35: CARAVAN PARKS 39 TABLE 36: TRAFFIC COUNTS 40
7.0 AGRICULTURE 41
TABLE 37: LIVESTOCK NUMBERS 41 TABLE 38: NUMBER OF ESTABLISHMENTS WITH AGRICULTURAL ACTIVITY 41 TABLE 39: GROSS VALUE OF AGRICULTURAL PRODUCTION ($) 41 TABLE 40 (a): RURAL PROPERTY SALES - CATTLE PROPERTIES 41 TABLE 40 (b): RURAL PROPERTY SALES - DAIRY PROPERTIES 42 TABLE 40 (c): RURAL PROPERTY SALES -HOBBY FARMS & UNSPECIFIED RURAL PROPERTIES 44


BAW BAW SHIRE STATISTICAL PROFILE 2005
Gippsland Research & Information Service. 1
EXPLANATORY NOTE
This data was compiled from a variety of sources: Australian Bureau of Statistics, Department of Infrastructure, Bureau of Meteorology, Department of Education and Training, Australian Taxation Office, CentreLink and the Department of Sustainability & Environment. The map below shows population density by Collection District for the Shire of Baw Baw and major towns compiled from ABS CDATA2001 using MapInfo computer mapping package.
Population Density by Collection District(persons per sq km)
1,001 to 2,700 (9)501 to 1,000 (13)101 to 500 (20)
0 to 100 (38)
Rawson
EricaNeerim South
Thorpdale
Trafalgar
Yarragon
Willow Grove
Darnum
Warragul
DrouinLongwarry
Baw Baw Shire
SOURCE: MapInfo, ABS CDATA2001

BAW BAW SHIRE STATISTICAL PROFILE 2005
Gippsland Research & Information Service. 2
1.0 WEATHER
TABLE 1 (a): RAINFALL STATISTICS, Erica
Period 1931 to 2004 using all available data Erica
Mean Rainfall (mm)
Highest Monthly Rainfall (mm)
Lowest Monthly Rainfall (mm)
Mean No. Raindays
January 76.8 238.6 8.0 11.0
February 67.6 329.3 2.9 10.2
March 79.2 206.3 7.9 12.0
April 97.0 320.8 18.8 13.8
May 88.1 299.7 6.3 15.0
June 92.2 450.0 12.5 15.7
July 82.7 172.8 21.0 16.3
August 96.3 222.6 32.1 17.0
September 102.5 256.3 40.2 16.0
October 116.7 243.2 32.4 16.7
November 109.0 271.6 35.8 14.6
December 103.3 326.7 6.1 12.9
Annual 1 111.4 - - 171.1
SOURCE: Bureau of Meteorology
TABLE 1 (b): RAINFALL STATISTICS, Warragul
Period 1888 to 2004 using all available data Warragul
Mean Rainfall (mm)
Highest Monthly Rainfall (mm)
Lowest Monthly Rainfall (mm)
Mean No. Raindays
January 62.0 185.5 0.8 8.3
February 51.4 222.7 1.0 7.2
March 68.7 222.0 3.4 10.1
April 84.1 258.9 0.0 12.7
May 94.2 256.7 4.8 14.8
June 93.4 231.4 17.5 15.7
July 91.1 184.8 33.8 16.4
August 102.9 220.8 24.8 17.1
September 104.2 248.2 27.0 15.9
October 108.6 205.0 4.9 15.1
November 88.7 208.8 16.8 12.9
December 79.8 219.2 9.1 10.4
Annual 1 029.0 - - 156.6
SOURCE: Bureau of Meteorology
Mean Rainfall - Erica
1931 - 2004
0
20
40
60
80
100
120
Jan Feb Mar Apr May Jun Jul Aug Sep Oct Nov Dec
mm
SOURCE: Bureau of Meterology
Mean Rainfall - Warragul
1888 - 2004
0
20
40
60
80
100
120
Jan Feb Mar Apr May Jun Jul Aug Sep Oct Nov Dec
mm
SOURCE: Bureau of Meterology

BAW BAW SHIRE STATISTICAL PROFILE 2005
Gippsland Research & Information Service. 3
TABLE 2 (a): MEAN DAILY TEMPERATURE, Erica
Period 1931 to 2004 using all available data
Erica
Mean Daily Max.
0C
Mean Daily Min.
0C
Highest Max. 0C
Lowest Min. 0C
January 23.2 11.6 41.1 5.0
February 23.0 12.4 40.3 5.3
March 20.8 11.0 36.4 2.2
April 16.7 8.5 29.2 1.9
May 13.6 6.8 23.9 -0.6
June 11.1 4.8 20.3 -1.5
July 10.8 4.2 20.5 -1.7
August 11.5 4.4 21.7 -1.5
September 14.1 5.6 28.9 -0.6
October 16.4 7.1 29.4 0.0
November 18.0 8.1 33.9 -0.6
December 21.1 10.0 36.0 3.3
Annual 16.6 7.8 41.1 -1.7
SOURCE: Bureau of Meteorology
TABLE 2 (b): MEAN DAILY TEMPERATURE, Warragul
Period 1888 to 2004 using all available data
Warragul
Mean Daily Max.
0C
Mean Daily Min.
0C
Highest Max. 0C
Lowest Min. 0C
January 25.9 12.7 41.7 3.9
February 26.1 13.3 42.3 3.3
March 23.8 11.7 38.1 1.8
April 19.9 9.2 31.2 -1.6
May 16.0 6.6 26.1 -0.9
June 13.4 4.9 20.6 -3.4
July 12.9 3.8 22.2 -3.7
August 13.9 5.0 24.7 -3.5
September 15.9 6.2 26.7 -1.6
October 18.9 8.0 32.7 -0.9
November 20.6 9.2 36.7 1.2
December 23.1 11.0 38.9 2.8
Annual 19.0 8.3 42.3 -3.7
SOURCE: Bureau of Meteorology
Range of Mean Daily Temperatures
Warragul 1888 - 2004
0
5
10
15
20
25
30
Jan Feb Mar Apr May Jun Jul Aug Sep Oct Nov Dec
oC
SOURCE: Bureau of Meterology
Range of Mean Daily Temperatures Erica
1931 - 2004
0
5
10
15
20
25
30
Jan Feb Mar Apr May Jun Jul Aug Sep Oct Nov Dec
oC
SOURCE: Bureau of Meterology

BAW BAW SHIRE STATISTICAL PROFILE 2005
Gippsland Research & Information Service. 4
TABLE 3: AVERAGE RAINFALL BY SEASON (mm) – WEST GIPPSLAND DISTRICT
Years 1992 – 2004 Year Summer Autumn Winter Spring 1992 179 172 246 331 1993 320 125 271 413 1994 284 155 178 314 1995 149 277 252 321 1996 236 210 276 267 1997 93 141 182 180 1998 146 125 226 303 1999 218 161 153 169 2000 175 213 162 266 2001 118 211 245 242 2002 68 179 154 173 2003 83 159 237 230 2004 151 176 225 225 *
NOTE: *Spring 2004 Seasonal Average not available – data is estimated using actual rainfall over a three month period SOURCE: Bureau of Meteorology
Average Rainfall by Season (mm) - West Gippsland
1994 to 2004
0
50
100
150
200
250
300
350
Su A W Sp Su A W Sp Su A W Sp Su A W Sp Su A W Sp Su A W Sp Su A W Sp Su A W Sp Su A W Sp Su A W Sp Su A W Sp
1994 2004199719961995
Source: Bureau of Meteorology
1998 1999 2000 2001 2002 2003
(mm)
1
23
4
5
67
8
9
Districts
Bonang
Gabo IslandOrbost
Lakes EntranceSale
Dargo
Warragul
Port Albert
Melbourne
Wilson’s Promontory
1. Mallee
2. Wimmera
3. Northern Country
4. North East
5. East Gippsland
6. West and South Gippsland
7. East Central
8. North Central
9. Western District
VICTORIA AREA FORECAST DISTRICT
Source: Bureau of Meteorology
1
23
4
5
67
8
9
Districts
Bonang
Gabo IslandOrbost
Lakes EntranceSale
Dargo
Warragul
Port Albert
Melbourne
1
23
4
5
67
8
9
Districts
Bonang
Gabo IslandOrbost
Lakes EntranceSale
Dargo
Warragul
Port Albert
Melbourne
Wilson’s Promontory
1. Mallee
2. Wimmera
3. Northern Country
4. North East
5. East Gippsland
6. West and South Gippsland
7. East Central
8. North Central
9. Western District
VICTORIA AREA FORECAST DISTRICT
Source: Bureau of Meteorology

BAW BAW SHIRE STATISTICAL PROFILE 2005
Gippsland Research & Information Service. 5
2.0 COMMUNITY PROFILE
TABLE 4: ESTIMATED RESIDENT POPULATION – BAW BAW SHIRE
2004 (p) Age Group
Area
0-4 Yrs
5-9 Yrs
10-14 Yrs
15-19 Yrs
20-24 Yrs
25-39 Yrs
40-59 Yrs
60+ Yrs Total
Part A Males 132 174 188 150 97 402 682 399 2 224
Females 127 132 183 139 105 379 664 427 2 156
Total 259 306 371 289 202 781 1 346 826 4 380
% of Total Persons 5.9 7.0 8.5 6.6 4.6 17.8 30.7 18.9 100.0
Part B (East) Males 129 159 166 149 116 309 655 426 2 109
Females 103 140 134 136 86 332 597 348 1 876
Total 232 299 300 285 202 641 1 252 774 3 985
% of Total Persons 5.8 7.5 7.5 7.2 5.1 16.1 31.4 19.4 100.0
Part B (West) Males 915 1 093 1 236 1 252 736 2 441 4 104 2 634 14 411
Females 918 1 057 1 267 1 111 734 2 748 4 228 3 096 15 159
Total 1 833 2 150 2 503 2 363 1 470 5 189 8 332 5 730 29 570
% of Total Persons 6.2 7.3 8.5 8.0 5.0 17.5 28.2 19.4 100.0
Baw Baw Shire Males 1 176 1 426 1 590 1 551 949 3 152 5 441 3 459 18 744
Females 1 148 1 329 1 584 1 386 925 3 459 5 489 3 871 19 191
Total 2 324 2 755 3 174 2 937 1 874 6 611 10 930 7 330 37 935
% of Total Persons 6.1 7.3 8.4 7.7 4.9 17.4 28.8 19.3 100.0
Gippsland Males 7 327 8 677 9 506 8 859 6 419 21 211 34 966 25 330 122 295
Females 7 102 8 162 9 278 8 501 6 003 21 768 35 210 28 273 124 297
Total 14 429 16 839 18 784 17 360 12 422 42 979 70 176 53 603 246 592
% of Total Persons 5.9 6.8 7.6 7.0 5.0 17.4 28.5 21.7 100.0
Victoria Males 156 418 164 517 170 638 170 511 178 675 543 731 665 093 403 564 2 453 147
Females 149 883 155 497 162 619 164 436 173 615 554 021 678 513 481 048 2 519 632
Total 306 301 320 014 333 257 334 947 352 290 1 097 752 1 343 606 884 612 4 972 779
% of Total Persons 6.2 6.4 6.7 6.7 7.1 22.1 27.0 17.8 100.0
NOTE: (p) preliminary figures SOURCE: Australian Bureau of Statistics
ESTIMATED RESIDENT POPULATION - BAW BAW SHIRE
2004 (p)
0
5
10
15
20
25
30
0-4 Yrs 5-9 Yrs 10-14 Yrs 15-19 Yrs 20-24 Yrs 25-39 Yrs 40-59 Yrs 60 + Yrs
Baw Baw Shire % Gippsland % Victoria %
SOURCE: Bureau of Statistics
(%)

BAW BAW SHIRE STATISTICAL PROFILE 2005
Gippsland Research & Information Service. 6
TABLE 5: POPULATION GROWTH
1976 Census to 2001 Census Change 1996 - 2001
Area 1976 1981 1986 1991 1996 2001 No. Ave.Annual Growth Rate
%
Darnum n.a. n.a. 255 325 293 316 23 1.5
Drouin 3 100 3 492 3 974 4 455 4 790 5 815 1 025 3.9
Erica 233 236 267 228 175 194 19 2.1
Longwarry 509 493 515 594 566 641 75 2.5
Neerim South 336 370 439 455 493 532 39 1.5
Rawson n.a. n.a. 337 312 301 277 -24 -1.6
Trafalgar 1 872 2 109 2 149 2 164 2 237 2 273 36 0.3
Warragul 7 442 7 712 8 170 8 910 9 011 10 397 1 386 2.9
Yarragon 490 574 652 709 679 704 25 0.7
Baw Baw Shire n.a. 28 827 30 712 33 084 32 985 34 737 1 752 1.0
Gippsland n.a. 198 006 213 715 224 978 222 389 228 400 6 011 0.5
Victoria 3 646 981 3 832 443 3 895 543 4 244 282 4 373 520 4 644 950 271 430 1.2
SOURCE: ABS, Census of Population and Housing
TABLE 6: AGE DISTRIBUTION
2001 Census Age Group
Area 0-4 Yrs
5-9 Yrs
10-14 Yrs
15-19 Yrs
20-24 Yrs 25-39 Yrs
40-59 Yrs
60+ Yrs
O/s Visitor Total
Drouin 388 460 526 413 246 1 076 1 407 1 183 12 5 711
% of population 6.8 8.0 9.2 7.2 4.3 18.8 24.6 20.7 0.2 100.0
Trafalgar 168 191 185 162 111 421 587 457 3 2 285
% of population 7.3 8.4 8.1 7.1 4.9 18.4 25.7 20.0 0.1 100.0
Warragul 747 821 876 840 561 2 023 2 571 2 013 34 10 486
% of population 7.1 7.8 8.3 8.0 5.3 19.3 24.5 19.2 0.3 100.0
Yarragon 49 63 55 56 44 138 186 117 3 711
% of population 6.9 8.9 7.7 7.9 6.2 19.4 26.2 16.5 0.4 100.0
Baw Baw Shire 2 322 2 832 3 068 2 668 1 654 6 403 9 584 6 101 105 34 737
% of population 6.7 8.2 8.8 7.7 4.8 18.4 27.6 17.6 0.3 100.0
Gippsland 14 567 17 457 18 504 16 483 11 043 41 902 62 731 44 859 854 228 400
% of population 6.4 7.6 8.1 7.2 4.8 18.3 27.5 19.6 0.4 100.0
Victoria 299 615 321 899 322 199 321 749 311 394 1 045 824 1 214 081 775 336 32 853 4 644 950
% of population 6.5 6.9 6.9 6.9 6.7 22.5 26.1 16.7 0.7 100.0
SOURCE: ABS, Census of Population and Housing 2001
AGE DISTRIBUTION 2001 CENSUS (%)
0
5
10
15
20
25
30
0-4 5-9 10-14 15-19 20-24 25-39 40-59 60+ O/s Vis.
(%)
Baw Baw Shire Gippsland Victoria
SOURCE: ABS, Census of Population and Housing 2001

BAW BAW SHIRE STATISTICAL PROFILE 2005
Gippsland Research & Information Service. 7
Age sex structure of Baw Baw Shire & Victoria, 2001 Census (%)
Baw Baw Shire Victoria
SOURCE: ABS, Census of Population and Housing 2001
0.0 0.5 1.0 1.5 2.0 2.5 3.0 3.5 4.0 4.5 5.0
0-4
5-9
10-14
15-19
20-24
25-29
30-34
35-39
40-44
45-49
50-54
55-59
60-64
65-69
70-74
75-79
80-84
85+
Females
5.0 4.5 4.0 3.5 3.0 2.5 2.0 1.5 1.0 0.5 0.0
Males
% of total population Age Group % of total population
Age sex structure of Baw Baw Shire, 1996 & 2001 Census
1996 2001
SOURCE: ABS, Census of Population and Housing
0 200 400 600 800 1,000 1,200 1,400 1,600 1,800
0-4
5-9
10-14
15-19
20-24
25-29
30-34
35-39
40-44
45-49
50-54
55-59
60-64
65-69
70-74
75-79
80-84
85+
Females
1,800 1,600 1,400 1,200 1,000 800 600 400 200 0
Males
No. of people Age Group No. of people

BAW BAW SHIRE STATISTICAL PROFILE 2005
Gippsland Research & Information Service. 8
TABLE 7: ESTIMATED POPULATION PROJECTIONS – AGE by Sex, BAW BAW SHIRE
2001 Census to 2031 Year Age Group 2001 Census 2006 2011 2016 2021 2026 2031
0-4 years Male 1 194 1 086 1 024 1 039 1 083 1 100 1 078 Female 1 128 1 040 981 995 1 037 1 054 1 034 Persons 2 322 2 126 2 005 2 034 2 121 2 154 2 112 5-9 years Male 1 412 1 312 1 178 1 118 1 137 1 188 1 211 Female 1 420 1 312 1 193 1 137 1 156 1 208 1 235 Persons 2 832 2 624 2 371 2 256 2 293 2 396 2 446 10-14 years Male 1 603 1 596 1 486 1 356 1 304 1 334 1 400 Female 1 465 1 590 1 461 1 340 1 290 1 317 1 383 Persons 3 068 3 186 2 947 2 696 2 594 2 650 2 783 15-19 years Male 1 374 1 558 1 532 1 423 1 298 1 252 1 284 Female 1 294 1 425 1 527 1 399 1 282 1 237 1 266 Persons 2 668 2 983 3 058 2 822 2 581 2 489 2 551 20-24 years Male 848 1 018 1 122 1 074 988 909 897 Female 806 1 020 1 049 1 127 1 014 931 917 Persons 1 654 2 038 2 171 2 201 2 002 1 840 1 814 25-29 years Male 819 897 988 1 089 1 042 959 885 Female 937 923 1 067 1 092 1 169 1 059 982 Persons 1 756 1 821 2 055 2 181 2 211 2 019 1 868 30-34 years Male 1 062 940 938 1 037 1 139 1 095 1 016 Female 1 125 1 102 1 019 1 173 1 197 1 278 1 175 Persons 2 187 2 041 1 957 2 210 2 336 2 374 2 190 35-39 years Male 1 153 1 205 1 006 1 008 1 115 1 220 1 183 Female 1 307 1 299 1 232 1 154 1 320 1 348 1 439 Persons 2 460 2 504 2 237 2 161 2 435 2 568 2 622 40-44 years Male 1 374 1 355 1 316 1 124 1 131 1 253 1 366 Female 1 456 1 457 1 401 1 341 1 271 1 451 1 486 Persons 2 830 2 812 2 717 2 465 2 402 2 704 2 853 45-49 years Male 1 264 1 517 1 439 1 406 1 220 1 235 1 371 Female 1 306 1 524 1 496 1 445 1 390 1 325 1 511 Persons 2 570 3 040 2 935 2 851 2 611 2 560 2 883 50-54 years Male 1 213 1 336 1 539 1 467 1 439 1 261 1 280 Female 1 164 1 374 1 571 1 548 1 505 1 459 1 400 Persons 2 377 2 710 3 110 3 016 2 944 2 720 2 680 55-59 years Male 920 1 312 1 367 1 574 1 513 1 497 1 335 Female 887 1 311 1 458 1 661 1 647 1 618 1 591 Persons 1 807 2 623 2 825 3 235 3 161 3 115 2 927 60-64 years Male 787 1 017 1 368 1 431 1 649 1 606 1 611 Female 766 1 055 1 450 1 605 1 825 1 832 1 831 Persons 1 553 2 071 2 818 3 035 3 474 3 438 3 441 65-69 years Male 604 859 1 037 1 390 1 460 1 688 1 662 Female 630 855 1 079 1 480 1 638 1 867 1 886 Persons 1 234 1 715 2 116 2 870 3 098 3 555 3 549 70-74 years Male 592 675 864 1 047 1 395 1 471 1 702 Female 621 693 865 1 091 1 490 1 651 1 884 Persons 1 213 1 368 1 729 2 138 2 885 3 122 3 585 75+ years Male 826 1 156 1 397 1 747 2 181 2 826 3 384 Female 1 275 1 597 1 843 2 193 2 683 3 458 4 239 Persons 2 101 2 753 3 240 3 940 4 863 6 284 7 623 Total Male 17 045 18 840 19 599 20 329 21 095 21 895 22 667 Female 17 587 19 577 20 693 21 781 22 914 24 093 25 261 Persons 34 632 38 416 40 292 42 110 44 010 45 988 47 928
SOURCE: Department of Sustainability and Environment & ABS, Census of Population and Housing 2001

BAW BAW SHIRE STATISTICAL PROFILE 2005
Gippsland Research & Information Service. 9
TABLE 8: POPULATION PROJECTIONS BY AGE GROUPS
2001 Census to 2031
Year
Area Age
Group 2001
Census 2006 2011 2016 2021 2026 2031
Baw Baw Shire 0-14 8 222 7 937 7 323 6 986 7 008 7 201 7 341
15-29 6 078 6 842 7 285 7 204 6 794 6 348 6 233
30-44 7 477 7 357 6 912 6 836 7 172 7 646 7 665
45-59 6 754 8 373 8 870 9 101 8 715 8 396 8 490
60-74 4 000 5 154 6 664 8 043 9 457 10 115 10 575
75+ 2 101 2 753 3 240 3 940 4 863 6 283 7 623
Total 34 632 38 416 40 292 42 110 44 010 45 988 47 928
Gippsland 0-14 50 528 47 956 43 758 41 296 40 371 40 374 39 985
15-29 39 362 42 322 43 450 41 281 38 115 35 039 33 973
30-44 47 581 46 539 43 188 42 234 42 997 44 529 43 129
45-59 45 216 53 977 55 110 54 766 51 920 49 386 49 416
60-74 29 648 37 110 46 304 54 714 61 914 64 349 65 667
75+ 15 211 20 679 24 206 28 598 34 681 43 785 52 185
Total 277 546 248 583 256 016 262 890 269 998 277 464 284 355
Victoria 0-14 943 713 949 209 922 655 904 920 905 520 918 273 929 047
15-29 963 693 1 046 404 1 085 308 1 091 926 1 083 981 1 056 964 1 038 445
30-44 1 069 395 1 137 290 1 153 095 1 177 640 1 206 240 1 247 643 1 255 304
45-59 859 960 1 009 101 1 068 851 1 130 304 1 159 605 1 174 075 1 199 405
60-74 501 561 597 802 724 752 841 316 952 381 1 013 778 1 073 911
75+ 273 775 337 403 376 954 428 649 502 834 620 636 729 366
Total 4 612 097 5 077 209 5 331 614 5 574 755 5 810 560 6 031 368 6 225 477
SOURCE: Department of Sustainability and Environment & ABS, Census of Population and Housing 2001
Population Projections, Baw Baw Shire, 2001 Census & 2031
2001 2031
SOURCE: Department of Sustainability and Environment & ABS, Census of Population and Housing 2001
0 200 400 600 800 1,000 1,200 1,400 1,600 1,800 2,000
0-4
5-9
10-14
15-19
20-24
25-29
30-34
35-39
40-44
45-49
50-54
55-59
60-64
65-69
70-74
75-79
80-84
85+
Females
2,000 1,800 1,600 1,400 1,200 1,000 800 600 400 200 0
Males
No. of people Age Group No. of people

BAW BAW SHIRE STATISTICAL PROFILE 2005
Gippsland Research & Information Service. 10
TABLE 9: SELECTED POPULATION CHARACTERISTICS
2001 Census
Area Population
No.
Youth (Age 0-14 yrs)
%
Ageing (Age 65+yrs)
%
Overseas born %
Single Parent with dependents
%
Dwelling Owners
%
Dwelling Purchasers
* %
Drouin 5 815 24.3 16.1 10.2 12.2 51.3 27.4
Trafalgar 2 273 23.9 16.3 8.1 12.1 47.6 28.1
Warragul 10 397 23.5 15.3 8.9 14.0 43.6 29.1
Yarragon 7.04 23.7 12.2 8.0 11.2 51.3 27.4
Baw Baw Shire 34 737 23.6 13.0 9.4 10.7 46.9 29.1
Gippsland 228 400 22.1 14.8 11.5 11.3 46.8 26.2
Victoria 4 644 950 20.3 12.6 23.2 9.8 42.9 27.8
NOTE: * - % of Total Occupied Dwellings SOURCE: ABS, Census of Population and Housing 2001
SELECTED POPULATION CHARACTERISTICS %
2001 Census
0
10
20
30
40
50
Youth Ageing O'seas born Single Parents Dw ell. Ow ners Dw ell. Purch.
(%)
Baw Baw Shire Gippsland Victoria
SOURCE: ABS, Census of Population and Housing 2001
BAW BAW SHIRE STATISTICAL PROFILE 2005
Gippsland Research & Information Service. 11
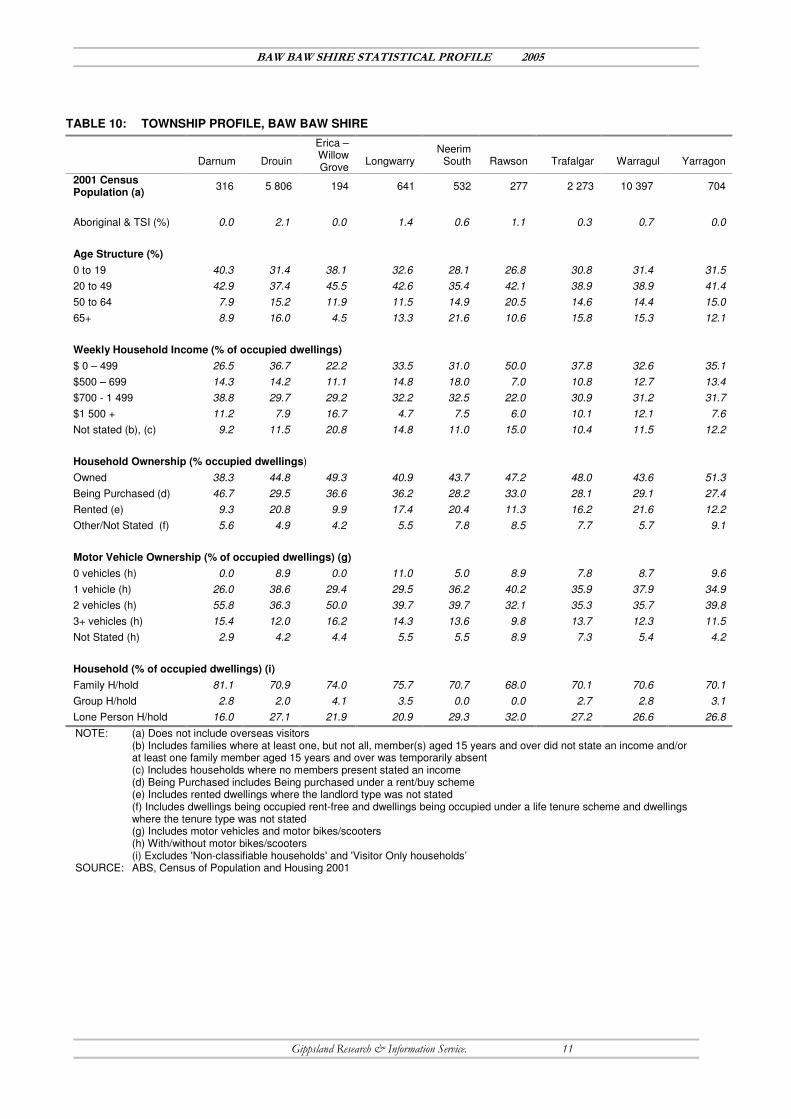
TABLE 10: TOWNSHIP PROFILE, BAW BAW SHIRE
Darnum
Drouin
Erica – Willow Grove
Longwarry
Neerim South
Rawson
Trafalgar
Warragul
Yarragon
2001 Census Population (a)
316 5 806 194 641 532 277 2 273 10 397 704
Aboriginal & TSI (%) 0.0 2.1 0.0 1.4 0.6 1.1 0.3 0.7 0.0
Age Structure (%)
0 to 19 40.3 31.4 38.1 32.6 28.1 26.8 30.8 31.4 31.5
20 to 49 42.9 37.4 45.5 42.6 35.4 42.1 38.9 38.9 41.4
50 to 64 7.9 15.2 11.9 11.5 14.9 20.5 14.6 14.4 15.0
65+ 8.9 16.0 4.5 13.3 21.6 10.6 15.8 15.3 12.1
Weekly Household Income (% of occupied dwellings)
$ 0 – 499 26.5 36.7 22.2 33.5 31.0 50.0 37.8 32.6 35.1
$500 – 699 14.3 14.2 11.1 14.8 18.0 7.0 10.8 12.7 13.4
$700 - 1 499 38.8 29.7 29.2 32.2 32.5 22.0 30.9 31.2 31.7
$1 500 + 11.2 7.9 16.7 4.7 7.5 6.0 10.1 12.1 7.6
Not stated (b), (c) 9.2 11.5 20.8 14.8 11.0 15.0 10.4 11.5 12.2
Household Ownership (% occupied dwellings)
Owned 38.3 44.8 49.3 40.9 43.7 47.2 48.0 43.6 51.3
Being Purchased (d) 46.7 29.5 36.6 36.2 28.2 33.0 28.1 29.1 27.4
Rented (e) 9.3 20.8 9.9 17.4 20.4 11.3 16.2 21.6 12.2
Other/Not Stated (f) 5.6 4.9 4.2 5.5 7.8 8.5 7.7 5.7 9.1
Motor Vehicle Ownership (% of occupied dwellings) (g)
0 vehicles (h) 0.0 8.9 0.0 11.0 5.0 8.9 7.8 8.7 9.6
1 vehicle (h) 26.0 38.6 29.4 29.5 36.2 40.2 35.9 37.9 34.9
2 vehicles (h) 55.8 36.3 50.0 39.7 39.7 32.1 35.3 35.7 39.8
3+ vehicles (h) 15.4 12.0 16.2 14.3 13.6 9.8 13.7 12.3 11.5
Not Stated (h) 2.9 4.2 4.4 5.5 5.5 8.9 7.3 5.4 4.2
Household (% of occupied dwellings) (i)
Family H/hold 81.1 70.9 74.0 75.7 70.7 68.0 70.1 70.6 70.1
Group H/hold 2.8 2.0 4.1 3.5 0.0 0.0 2.7 2.8 3.1
Lone Person H/hold 16.0 27.1 21.9 20.9 29.3 32.0 27.2 26.6 26.8
NOTE: (a) Does not include overseas visitors (b) Includes families where at least one, but not all, member(s) aged 15 years and over did not state an income and/or at least one family member aged 15 years and over was temporarily absent (c) Includes households where no members present stated an income (d) Being Purchased includes Being purchased under a rent/buy scheme (e) Includes rented dwellings where the landlord type was not stated (f) Includes dwellings being occupied rent-free and dwellings being occupied under a life tenure scheme and dwellings where the tenure type was not stated (g) Includes motor vehicles and motor bikes/scooters (h) With/without motor bikes/scooters (i) Excludes 'Non-classifiable households' and 'Visitor Only households’
SOURCE: ABS, Census of Population and Housing 2001

BAW BAW SHIRE STATISTICAL PROFILE 2005
Gippsland Research & Information Service. 12
2001 Census Population (a)
0
1500
3000
4500
6000
7500
9000
10500
Darnum Drouin Erica-
Willow
Grove
Longw arry Neerim Sth Raw son Trafalgar Warragul Yarragon
No
. o
f P
ers
on
s
SOURCE: ABS, Census of Population and Housing 2001
Weekly Household Income (% of Occupied Dwellings)
0
10
20
30
40
50
Darnum Drouin Erica-Willow
Grove
Longw arry Neerim Sth Raw son Trafalgar Warragul Yarragon
(%)$ 0 – 499 $500 – 699 $700 - 1 499 $1 500 + Not stated
SOURCE: ABS, Census of Population and Housing 2001
Household Structure (% of Occupied Dwellings)
0
10
20
30
40
50
60
70
80
90
Darnum Drouin Erica-Willow
Grove
Longw arry Neerim Sth Raw son Trafalgar Warragul Yarragon
(%)
Family H/hold Group H/hold Lone Person H/hold
SOURCE: ABS, Census of Population and Housing 2001

BAW BAW SHIRE STATISTICAL PROFILE 2005
Gippsland Research & Information Service. 13
TABLE 11: INDIGENOUS PROFILE
2001 Indigenous Census Population Baw Baw Gippsland Victoria Australia No. % No. % No. % No. %
2001 Indigenous Population 273 2 596 25 078 410 033 Age Structure 0 to 19 169 58.7 1 339 52.4 12 324 49.1 203 186 49.6 20 to 49 82 28.5 964 37.7 10 097 40.3 165 293 40.3 50 to 64 26 9.0 176 6.9 1 911 7.6 30 087 7.3 65+ 11 3.8 78 3.1 746 3.0 11 437 2.8
Total 288 100.0 2 557 100.0 25 078 100.0 410 003 100.0
Type of Educational Institution Attending Pre-School 6 5.1 68 7.1 594 6.5 10 448 7.5 Primary School 52 44.1 490 51.5 4 327 47.2 71 557 51.6 Secondary School 35 29.7 224 23.5 2 409 26.3 34 734 25.0 Technical or Further Educational Institution
19 16.1 118 12.4 965 10.5 12 458 9.0
University/Tertiary Institution 6 5.1 33 3.5 636 6.9 7 180 5.2 Other Institution - 0.0 19 2.0 233 2.5 2 426 1.7
Total 118 100.0 952 100.0 9 164 100.0 138 803 100.0
Not attending/Not stated 167 1 649 15 913 271 180 Selected Employment Characteristics Persons Aged 15 years and over Labour
Force (No.)
Unemp rate (%)
Labour Force (No.)
Unemp rate (%)
Labour Force (No.)
Unemp rate (%)
Labour Force (No.)
Unemp rate (%)
Males 38 36.8 381 26.2 4 686 19.8 70 045 21.8 Females 31 19.4 309 20.6 3 696 15.6 55 392 17.6
Total 69 29.0 690 23.7 8 382 18.0 125 437 20.0
No. % No. % No. % No. %
Not in Labour Force 81 52.3 753 49.5 6 496 42.4 115 422 46.3 Employed Labour Force 47 30.3 535 35.2 6 877 44.8 100 393 40.3 Unemployed Labour Force 18 11.6 160 10.5 1 505 9.8 25 044 10.1 Not Stated 9 5.8 72 4.7 459 3.0 8 214 3.3
Total 155 100.0 1 520 100.0 15 337 100.0 249 073 100.0
Education Characteristics Persons Aged 15 years and over Qualified 45 28.5 496 32.9 5 453 35.6 69 386 27.9 Not Qualified 113 71.5 1 011 67.1 9 884 64.4 179 687 72.1
Total 158 100.0 1 507 100.0 15 337 100.0 249 073 100.0
Qualified with (a): Post Graduate Degree - 0.0 4 0.8 80 1.5 693 1.0 Graduate Diploma/Graduate Certificate
- 0.0 6 1.2 100 1.8 894 1.3
Bachelor Degree 6 13.3 26 5.2 607 11.1 5 638 8.1 Advanced Diploma/Diploma 3 6.7 42 8.5 529 9.7 6 196 8.9 Certificate 15 33.3 150 30.2 2 002 36.7 23 352 33.7 Not Stated (b) 21 46.7 268 54.0 2 135 39.2 32 613 47.0
Total 45 100.0 496 100.0 5 453 100.0 69 386 100.0
Not Applicable 113 1 011 9 884 179 687 Weekly Household Income Low $0 - $499 22 27.5 304 37.8 2 782 33.3 38 796 33.6 Medium-low $500 - $699 17 21.3 116 14.4 1 132 13.5 16 609 14.4 Medium-high $700 - $1 499 20 25.0 184 22.9 2 377 28.4 33 208 28.8 High $1 500+ 5 6.3 51 6.3 888 10.6 10 543 9.1 Not stated (c) 16 20.0 150 18.6 1 186 14.2 16 203 14.0
Total Households 80 100.0 805 100.0 8 365 100.0 115 359 100.0
Selected Averages Median Age (years) 17 n.a. 20 20 Median weekly individual income $200-$299 n.a. $200-$299 $200-$299 Median weekly family income $500-$599 n.a. $700-$799 $600-$699 Median weekly household income $500-$599 n.a. $600-$699 $600-$699 Average Household size 3.4 n.a. 3.1 3.4
Note: (a) Excludes schooling up to Year 12 (b) Includes “inadequately described” (c) Includes households where only partial income or no income was stated Source: Australian Bureau of Statistics, Indigenous Census 2001
BAW BAW SHIRE STATISTICAL PROFILE 2005
Gippsland Research & Information Service. 14
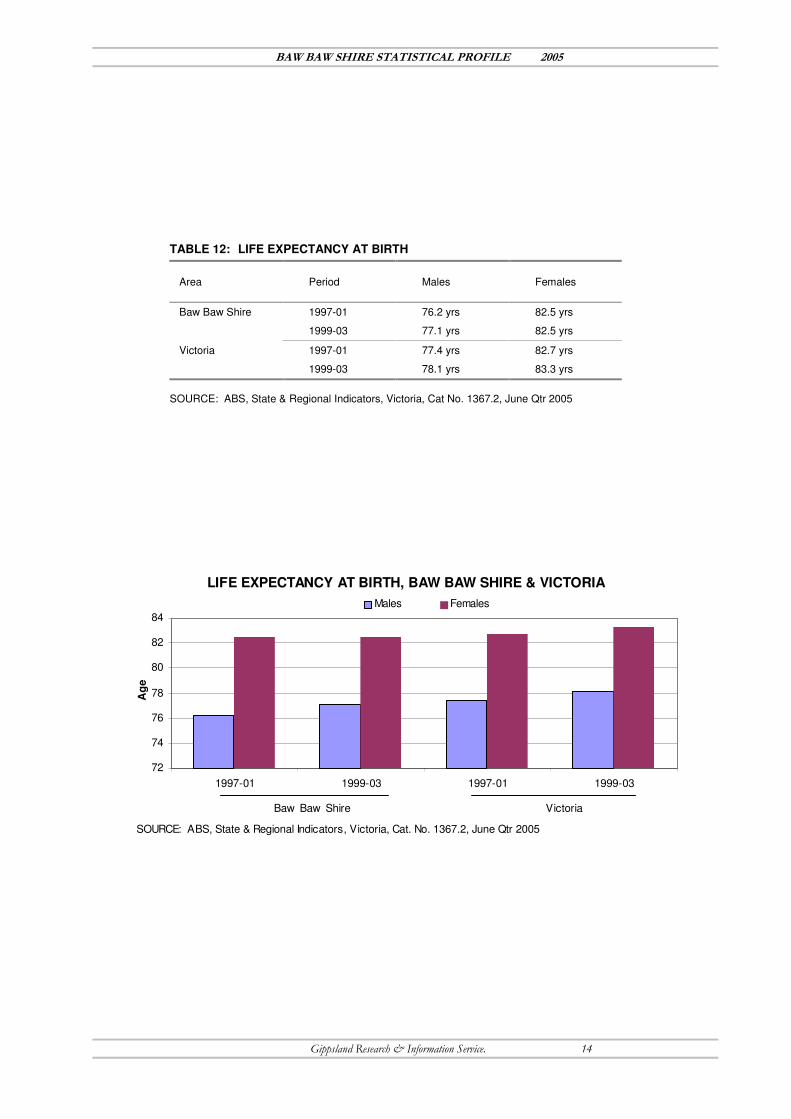
TABLE 12: LIFE EXPECTANCY AT BIRTH
Area Period Males Females
Baw Baw Shire 1997-01 76.2 yrs 82.5 yrs
1999-03 77.1 yrs 82.5 yrs
Victoria 1997-01 77.4 yrs 82.7 yrs
1999-03 78.1 yrs 83.3 yrs
SOURCE: ABS, State & Regional Indicators, Victoria, Cat No. 1367.2, June Qtr 2005
LIFE EXPECTANCY AT BIRTH, BAW BAW SHIRE & VICTORIA
72
74
76
78
80
82
84
1997-01 1999-03 1997-01 1999-03
Ag
e
Males Females
Baw Baw Shire Victoria
SOURCE: ABS, State & Regional Indicators, Victoria, Cat. No. 1367.2, June Qtr 2005

BAW BAW SHIRE STATISTICAL PROFILE 2005
Gippsland Research & Information Service. 15
TABLE 13: CAUSES OF DEATH (a) – West Gippsland Statistical Subdivision, 1999 & 2003
Cause of Death Year West Gippsland
(b)
% of total West
Gippsland (b) deaths
Total Gippsland
% of total Gippsland
deaths
Victoria (c)
% of total Victorian (c)
deaths
1999 71 32.7 564 29.0 9 016 28.2 Cancer (d)
2003 75 28.8 609 29.1 9 694 29.4
1999 52 24.0 547 28.1 8 424 26.4 Heart attack (e)
2003 70 26.9 566 27.1 8 207 24.9
1999 22 10.1 164 8.4 2 903 9.1 Stroke etc. (f)
2003 21 8.1 148 7.1 2 808 8.5
1999 16 7.4 126 6.5 2 338 7.3 Asthma etc. (g)
2003 28 10.8 189 9.0 2 835 8.6
1999 4 1.8 34 1.7 552 1.7 Suicide (h)
2003 6 2.3 38 1.8 540 1.6
1999 217 100.0 1 947 100.0 31 918 100.0 All causes
2003 260 100.0 2 092 100.0 32 925 100.0
NOTE: (a) Classified according to the tenth revision of the World Health Organisation’s International Classification of Diseases (b) Statistical Subdivision (c) This includes deaths where usual residence was overseas, no fixed abode and Victoria undefined (d) Malignant neoplasms (e) All heart diseases (f) Cerebrovascular diseases (g) Diseases of the respiratory system, incl. pneumonia and influenza (h) Intentional self harm SOURCE: ABS, State & Regional Indicators, Victoria, Cat. No. 1367.2, June Qtr 2005
CAUSES OF DEATH - WEST GIPPSLAND STATISTICAL
SUBDIVISION, 1999 & 2003
0
5
10
15
20
25
30
35
Cancer Heart attack Stroke etc. Asthma etc. Suicide
% o
f A
ll D
eath
s
1999 2003
SOURCE: ABS, State & Regional Indicators, Victoria, Cat. No. 1367.2, June Qtr 2005

BAW BAW SHIRE STATISTICAL PROFILE 2005
Gippsland Research & Information Service. 16
TABLE 14: PROVISIONAL CRIME STATISTICS – BAW BAW SHIRE
Offences Recorded Rate per 100,000 population*
2003/04 2004/05 % change 2003/04 2004/05 % change
Crime Against Person 249 284 14.1 669.5 748.6 11.8
Crime Against Property 1 475 1 509 2.3 3 965.8 3 977.9 0.3
Drug Offences 80 126 57.5 215.1 332.2 54.4
Other Crime 305 356 16.7 820.1 938.4 14.4
Baw Baw Shire
Total Crime 2 109 2 275 7.9 5 670.4 5 997.1 5.8
Crime Against Person 2 908 3 058 5.2 n.a. n.a. n.a.
Crime Against Property 12 902 11 070 -14.2 n.a. n.a. n.a.
Drug Offences 971 887 -8.7 n.a. n.a. n.a.
Other Crime 3 722 3 305 -11.2 n.a. n.a. n.a.
Total Gippsland1
Total Crime 20 503 18 320 -10.7 n.a. n.a. n.a.
Crime Against Person 35 138 38 584 9.8 711.1 771.3 8.5
Crime Against Property 310 326 280 314 -9.7 6 280.1 5 603.7 -10.8
Drug Offences 15 146 13 656 -9.8 306.5 273.0 -10.9
Other Crime 37 911 41 363 9.1 767.2 826.9 7.8
Total Victoria
Total Crime 398 521 373 917 -6.2 8 064.9 7 475.0 -7.3
NOTE: *Rates were calculated using estimated resident population figures as at 31 December for 2003 and 2004 obtained from the Australian Bureau of Statistics (ABS Cat. No. 3218.0).
1 Total Gippsland = combined totals of Division 3 and Division 4
SOURCE: Victoria Police, www.police.vic.gov.au
PROVISIONAL CRIME STATISTICS, BAW BAW SHIRE
400
800
1 200
1 600
Crime Against Person Crime Against
Property
Drug Offences Other Crime
No
. o
f O
ffen
ces R
eco
rded
2003/04 2004/05
SOURCE: Victoria Police, w w w .police.vic.gov.au
Provisional Crime Statistics, Offences Recorded
% Change 2003/04 - 2004/05
-20
-10
0
10
20
30
40
50
60
Crime Against Person Crime Against Property Drug Offences Other Crime
% C
han
ge
Baw Baw Victoria
SOURCE: Victoria Police, w w w .police.vic.gov.au

BAW BAW SHIRE STATISTICAL PROFILE 2005
Gippsland Research & Information Service. 17
3.0 EDUCATION
TABLE 15: GOVERNMENT & NON-GOVERNMENT SCHOOL ENROLMENTS
1995 to 2005
Government Non-Government
District Year Students Schools/ Campuses
Students Schools/ Campuses
Drouin & District -Primary 1995 1 208 12 440 2
1996 1 147 12 446 2
1997 1 154 12 516 2
1998 1 168 12 512 2
1999 1 136 12 486 2
2000 1 117 12 498 2
2001 1 115 12 516 2
2002 1 059 12 472 2
2003 1 054 12 426 2
2004 1 039 12 427 2
2005 1 029 12 321 2
-Secondary 1995 886 2 121 1
1996 879 2 174 1
1997 865 2 225 1
1998 873 2 275 1
1999 916 2 296 1
2000 951 2 290 1
2001 1 029 2 316 1
2002 1 075 2 330 1
2003 1 038 2 436 1
2004 1 053 2 348 1
2005 1 053 2 479 1
Trafalgar & District - Primary 1995 896 10 134 1
1996 872 10 118 1
1997 836 10 111 1
1998 850 10 108 1
1999 847 10 102 1
2000 820 10 98 1
2001 824 10 103 1
2002 840 10 98 1
2003 869 10 96 1
2004 879 10 92 1
2005 842 10 97 1
- Secondary 1995 501 1 - -
1996 506 1 - -
1997 561 1 - -
1998 (r) 580 1 - -
1999 533 1 - -
2000 547 1 - -
2001 549 1 - -
2002 561 1 - -
2003 541 1 - -
2004 552 1 - -
2005 612 1 - -
Continued…

BAW BAW SHIRE STATISTICAL PROFILE 2005
Gippsland Research & Information Service. 18
TABLE 15: GOVERNMENT & NON-GOVERNMENT SCHOOL ENROLMENTS continued
1995 to 2005
Government Non-Government
District Year Students Schools/ Campuses
Students Schools/ Campuses
Warragul & District -Primary 1995 1 201 9 287 1
1996 1 169 9 271 1
1997 1 169 8 315 2
1998 1 142 8 355 2
1999 1 201 8 366 2
2000 1 228 8 384 2
2001 1 199 8 410 2
2002 1 245 8 436 2
2003 1 241 8 457 2
2004 1 273 8 451 2
2005 1 236 8 494 2
-Secondary 1995 988 1 1 141 2
1996 899 1 1 246 2
1997 848 1 1 351 2
1998 (r) 769 1 1 398 2
1999 672 1 1 496 2
2000 627 1 1 584 2
2001 664 1 1 646 2
2002 619 1 1 655 2
2003 674 1 1 715 2
2004 674 1 1 714 2
2005 706 1 1 724 2
Baw Baw Shire Total - Primary 1995 3 305 31 861 4
1996 3 188 31 835 4
1997 3 159 30 942 5
1998 3 160 30 975 5
1999 3 184 30 954 5
2000 3 165 30 980 5
2001 3 138 30 1 029 5
2002 3 144 30 1 006 5
2003 3 164 30 979 5
2004 3 191 30 970 5
2005 3 107 30 912 5
- Secondary 1995 (r) 2 375 4 1 262 3
1996 2 284 4 1 420 3
1997 2 274 4 1 576 3
1998 (r) 2 222 4 1 673 3
1999 2 121 4 1 792 3
2000 2 125 4 1 874 3
2001 2 242 4 1 962 3
2002 2 255 4 1 985 3
2003 2 253 4 (r) 2 061 3
2004 2 279 4 2 062 3
2005 2 371 4 2 203 3
NOTE: from 2004 campus data (where available) by town (r) Revised SOURCE: Department of Education & Training, Catholic Education Office & Independent Schools
PRIMARY SCHOOL ENROLMENTS
BAW BAW SHIRE - 1995 to 2005
0
1000
2000
3000
4000
5000
1995 1997 1999 2001 2003 2005
Govt NonGovt
No.
SOURCE: Department of Education and Training, Catholic Education
Office & Independent Schools
0
1000
2000
3000
4000
5000
1995 1997 1999 2001 2003 2005
Govt NonGovt
No. POST PRIMARY SCHOOL ENROLMENTS
BAW BAW SHIRE - 1995 to 2005
SOURCE: Department of Education and Training, Catholic Education
Office & Independent Schools

BAW BAW SHIRE STATISTICAL PROFILE 2005
Gippsland Research & Information Service. 19
TABLE 16: EDUCATION CHARACTERISTICS
Persons aged 15 years and over, 2001 Census
Town
Drouin
% Trafalgar
% Warragul
% Yarragon
%
Baw Baw Shire
% Gippsland
% Victoria
%
Highest Level
Schooling Completed:
Year 8 15.3 12.5 12.4 16.5 12.5 12.9 10.6
Year 9 12.0 9.3 9.8 9.6 10.6 10.9 7.5
Year 10 22.7 23.3 20.2 24.6 21.5 21.1 15.9
Year 11 15.0 18.8 16.0 16.7 16.6 16.7 14.0
Year 12 22.3 22.8 28.3 19.7 26.4 25.2 38.9
Still at School 4.1 4.8 4.6 4.5 4.6 4.3 3.9
Did not go to school 0.7 1.3 0.5 0.6 0.5 0.5 1.2
Not Stated 7.7 7.1 8.1 7.7 7.4 8.3 7.8
Total aged 15+ % 100.0 100.0 100.0 100.0 100.0 100.0 100.0
Total aged 15+ No. 4 394 1 736 7 998 532 26 410 177 018 3 668 384
Qualified:
Qualified % 29.8 31.6 32.0 25.7 32.1 30.2 34.8
No. 1 309 549 2 562 137 8 470 53 524 1 277 884
Not Qualified/NS % 70.2 68.4 68.0 74.3 67.9 69.8 65.2
No. 3 090 1 187 5 432 396 17 940 123 494 2 390 500
Qualified with (a):
Post Graduate Degree 0.8 0.5 0.9 0.6 0.8 0.7 1.8
Graduate Diploma and Graduate Certificate
1.1 1.4 1.8 1.1 1.6 1.2 1.8
Bachelor Degree 5.4 6.6 7.8 5.1 6.8 5.9 10.7
Advanced Diploma & Diploma
4.2 5.0 5.1 2.6 5.3 4.9 6.1
Certificate 18.3 18.1 16.4 16.3 17.5 17.6 14.5
Not stated (b) 11.8 11.5 12.4 12.2 11.3 12.6 11.5
Not Applicable (c) 58.5 56.9 55.6 62.1 56.6 57.1 53.7
Total % 100.0 100.0 100.0 100.0 100.0 100.0 100.0
Total No. 4 399 1 736 7 994 533 26 410 177 018 3 668 384
NOTE: (a) Excludes schooling up to Year 12 (b) Includes ‘inadequately described’ (c) Includes persons who do not have a qualification and persons who have a qualification out of scope of the Australian Standard of Classification of Education NS – Not stated SOURCE: ABS, Census of Population and Housing 2001

BAW BAW SHIRE STATISTICAL PROFILE 2005
Gippsland Research & Information Service. 20
4.0 INCOME
TABLE 17 (a): AVERAGE TAXABLE INCOME OF INDIVIDUALS, Drouin
Postcode Area 3818 – 1993 to 2003
Year Ended June 30 No. of Taxpayers Average Taxable
Income ($) Victorian Average
Taxable Income ($)
1993 3 316 23 581 26 940
1994 3 263 24 302 28 261
1995 3 318 24 399 29 238
1996 3 395 25 415 30 356
1997 3 403 26 531 31 241
1998 3 468 26 811 32 730
1999 3 393 28 823 34 578
2000 3 619 29 506 36 026
2001 3 554 31 512 38 636
2002 3 559 33 019 39 418
2003 3 707 33 870 40 799
SOURCE: Australian Taxation Office
TABLE 17 (b): AVERAGE TAXABLE INCOME OF INDIVIDUALS, Trafalgar
Postcode Area 3824 – 1993 to 2003
Year Ended June 30 No. of Taxpayers Average Taxable
Income ($) Victorian Average
Taxable Income ($)
1993 1 666 25 846 26 940
1994 1 582 26 886 28 261
1995 1 553 26 424 29 238
1996 1 643 26 686 30 356
1997 1 612 27 544 31 241
1998 1 554 28 394 32 730
1999 1 521 29 960 34 578
2000 1 552 30 683 36 026
2001 1 554 33 250 38 636
2002 1 594 35 011 39 418
2003 1 635 35 532 40 799
SOURCE: Australian Taxation Office
TABLE 17 (c): AVERAGE TAXABLE INCOME OF INDIVIDUALS, Warragul
Postcode Area 3820 – 1993 to 2003
Year Ended June 30 No. of Taxpayers Average Taxable
Income ($) Victorian Average
Taxable Income ($)
1993 5 334 24 851 26 940
1994 5 210 25 734 28 261
1995 5 352 25 391 29 238
1996 5 489 26 554 30 356
1997 5 444 27 578 31 241
1998 5 403 28 678 32 730
1999 5 320 30 611 34 578
2000 5 633 31 521 36 026
2001 5 547 34 144 38 636
2002 5 657 35 074 39 418
2003 5 782 36 853 40 799
SOURCE: Australian Taxation Office

BAW BAW SHIRE STATISTICAL PROFILE 2005
Gippsland Research & Information Service. 21
TABLE 17 (d): AVERAGE TAXABLE INCOME OF INDIVIDUALS, Yarragon
Postcode Area 3823 – 1993 to 2003
Year Ended June 30 No. of Taxpayers Average Taxable
Income ($) Victorian Average
Taxable Income ($)
1993 615 26 985 26 940
1994 574 26 855 28 261
1995 578 26 503 29 238
1996 587 27 414 30 356
1997 573 26 806 31 241
1998 583 27 186 32 730
1999 582 29 917 34 578
2000 593 30 091 36 026
2001 603 34 303 38 636
2002 612 34 840 39 418
2003 632 33 767 40 799
SOURCE: Australian Taxation Office
TABLE 17 (e): AVERAGE TAXABLE INCOME OF INDIVIDUALS, Baw Baw Shire
1994 to 2003
Year Ended June 30 No. of Taxpayers Average Taxable
Income ($) Victorian Average
Taxable Income ($)
1994 13 138 25 440 28 261
1995 13 285 25 213 29 238
1996 13 666 26 122 30 356
1997 13 518 27 039 31 241
1998 13 608 27 765 32 730
1999 13 364 29 678 34 578
2000 14 187 30 467 36 026
2001 14 027 33 094 38 636
2002 14 294 34 205 39 418
2003 14 819 35 336 40 799
SOURCE: Australian Taxation Office
TABLE 17 (f): AVERAGE TAXABLE INCOME OF INDIVIDUALS BY REGION
Year Ended 30 June 2003
District No. of Taxpayers Average Taxable
Income ($)
Baw Baw Shire 14 819 35 336
Gippsland 101 468 35 250
Country Victoria 804 562 36 156
Melbourne 1 374 543 43 530
Victoria 2 183 981 40 799
Australia 8 634 246 40 826
SOURCE: Australian Taxation Office
% INCREASE 1994 - 2003
INDIVIDUAL AVERAGE INCOME
38.9 34.544.4
0
10
20
30
40
50
Baw Baw Shire Gippsland Victoria
(%)
SOURCE: Australian Taxation Office
AVERAGE TAXABLE INCOME
1994 - 2003
0
10,000
20,000
30,000
40,000
50,000
1994 1995 1996 1997 1998 1999 2000 2001 2002 2003
($)
Baw Baw Shire Gippsland Victoria
SOURCE: Australian Taxation Off ice

BAW BAW SHIRE STATISTICAL PROFILE 2005
Gippsland Research & Information Service. 22
TABLE 18: WEEKLY INDIVIDUAL INCOME
2001 Census
Locality Low
$0-399 Medium-Low
$400-599 Medium-High
$600-999 High
$1000+ Not
Stated Total
Persons
Drouin No. 2 416 762 622 275 333 4 408
% 54.8 17.3 14.1 6.2 7.6 100.0
Trafalgar No. 968 259 270 131 102 1 730
% 55.9 15.0 15.6 7.6 5.9 100.0
Warragul No. 4 052 1 352 1 280 625 673 7 982
% 50.8 16.9 16.0 7.8 8.4 100.0
Yarragon No. 299 88 69 31 43 530
% 56.4 16.6 13.0 5.8 8.1 100.0
Baw Baw Shire No. 13 823 4 491 4 073 1 971 2 147 26 505
% 52.1 16.9 15.4 7.4 8.1 100.0
Gippsland No. 98 354 27 235 23 738 12 482 15 902 177 711
% 55.3 15.3 13.4 7.0 8.9 100.0
Victoria No. 1 745 984 585 049 654 078 389 223 323 683 3 698 017
% 47.2 15.8 17.7 10.5 8.8 100.0
SOURCE: ABS, Census of Population and Housing 2001
TABLE 19: WEEKLY HOUSEHOLD INCOME
2001 Census
Locality Low
$0-499 Medium-Low
$500-699 Medium-High
$700-1499 High
$1500+ Not Stated
(a) Total
Households
Drouin No. 818 317 662 177 257 2 231
% 36.7 14.2 29.7 7.9 11.5 100.0
Trafalgar No. 209 62 194 49 65 579
% 36.1 10.7 33.5 8.5 11.2 100.0
Warragul No. 1 270 495 1 217 470 447 3 899
% 32.6 12.7 31.2 12.0 11.5 100.0
Yarragon No. 92 35 83 20 32 262
% 35.1 13.4 31.7 7.6 12.2 100.0
Baw Baw Shire No. 4 077 1 612 3 878 1 514 1 537 12 618
% 32.3 12.8 30.7 12.0 12.2 100.0
Gippsland No. 32 570 11 346 23 382 8 627 10 207 86 132
% 37.8 13.2 27.1 10.0 11.9 100.0
Victoria No. 456 540 190 456 514 296 313 499 192 896 1 667 687
% 27.4 11.4 30.8 18.8 11.6 100.0
NOTE: (a) Includes partial income stated SOURCE: ABS, Census of Population and Housing 2001

BAW BAW SHIRE STATISTICAL PROFILE 2005
Gippsland Research & Information Service. 23
TABLE 20 (a): PENSION AND BENEFIT RECIPIENTS, Drouin
Postcode Area 3818 – 1994 to 2005 Number of Recipients as at June: Type of Benefit and Pension 1994 1995 1996 1997 1998 1999 2000 2001 2002 2003 2005
Pensions Age/Mature Age Pension 826 832 783 838 850 897 947 991 1 016 1 048 1 139 Disability Support Pension 166 167 186 210 229 251 261 290 301 332 360 Carer Payment/Allowance 62 58 53 43 36 45 103 166 192 160 230 Widow Pension/Allowance 28 29 29 13 17 14 76 82 81 63 66
Family Payment Maximum Family Payment* 439 464 500 534 528 510 1 640 1 751 1 613 1 604 1 709 Parenting Payment Single 153 180 178 186 207 208 213 222 214 203 230 Childcare Benefit 197 286
Unemployment/Youth Allowance Unemployment Benefits 348 260 308 310 321 418 Newstart MAA <20 23 22 22 <20 Newstart Allowance 213 218 152 148 140 Youth Allowance 187 186 178 156 145
Other Payments Sickness Allowance 13 17 14 5 1 2 <20 <20 <20 <20 <20 Special Benefit 4 5 4 1 2 2 <20 <20 - Rent Assistance 402 425 360 347 400
NOTE: *Maximum Family Payment is paid to low income families. Previous to 1997 called the Additional Family Payment 2004 figures not available
Where the pension/benefit type have been less than 20 recipients, data has not been included. SOURCE: Metadata, CentreLink
PENSIONS & BENEFITS RECIPIENTS - DROUIN
2000 - 2005
0
500
1000
1500
2000
2500
3000
2000 2001 2002 2003 2005
(No.) Pensions Family Payments Unemployment/Youth Allow ance Other Payments
SOURCE: Metadata, CentreLink

BAW BAW SHIRE STATISTICAL PROFILE 2005
Gippsland Research & Information Service. 24
TABLE 20 (b): PENSION AND BENEFIT RECIPIENTS, Trafalgar
Postcode Area 3824 – 1994 to 2005 Number of Recipients as at June: Type of Benefit and Pension 1994 1995 1996 1997 1998 1999 2000 2001 2002 2003 2005
Pensions Age/Mature Age Pension 325 313 308 344 356 376 393 405 415 443 465 Disability Support Pension 48 46 55 68 75 92 103 114 112 109 110 Carer Payment/Allowance 25 24 27 21 15 17 43 52 83 81 113 Widow Pension/Allowance 11 11 9 4 3 4 25 28 34 27 <20
Family Payment Maximum Family Payment* 185 192 208 211 223 223 717 751 672 651 675 Parenting Payment Single 57 54 59 61 70 71 121 99 84 86 84 Childcare Benefit 71 94
Unemployment/Youth Allowance Unemployment Benefits 142 180 181 191 184 238 Newstart MAA <20 <20 <20 <20 <20 Newstart Allowance 121 120 87 94 79 Youth Allowance 87 85 74 66 62
Other Payments Sickness Allowance 14 5 1 2 0 - - <20 <20 <10 <20 Special Benefit 1 0 0 0 0 0 - - <20 <20 - Rent Assistance 184 173 141 134 134
NOTE: *Maximum Family Payment is paid to low income families. Previous to 1997 called the Additional Family Payment 2004 figures not available Where the pension/benefit type have been less than 20 recipients, data has not been included. SOURCE: Metadata, CentreLink
PENSIONS & BENEFITS RECIPIENTS - TRAFALGAR
2000 - 2005
0
500
1000
1500
2000
2500
3000
2000 2001 2002 2003 2005
(No.)
Pensions Family Payments Unemployment/Youth Allow ance Other Payments
SOURCE: Metadata, CentreLink

BAW BAW SHIRE STATISTICAL PROFILE 2005
Gippsland Research & Information Service. 25
TABLE 20 (c): PENSION AND BENEFIT RECIPIENTS, Warragul
Postcode Area 3820 – 1994 to 2005 Number of Recipients as at June: Type of Benefit and Pension 1994 1995 1996 1997 1998 1999 2000 2001 2002 2003 2005
Pensions Age/Mature Age Pension 1 146 1 127 1 158 1 226 1 238 1 253 1 272 1 342 1 354 1 385 1 433 Disability Support Pension 213 225 270 278 303 343 363 380 427 436 478 Carer Payment/Allowance 77 86 88 80 72 75 166 230 244 257 319 Widow Pension/Allowance 49 50 49 39 34 29 122 115 122 82 85
Family Payment Maximum Family Payment* 622 632 667 663 651 620 2 189 2 243 2 175 2 174 2 348 Parenting Payment Single 239 250 256 254 257 261 259 284 303 315 321 Childcare Benefit 267 326
Unemployment/Youth Allowance Unemployment Benefits 461 411 423 419 415 605 Newstart MAA 24 25 32 30 <20 Newstart Allowance 259 272 186 178 170 Youth Allowance 294 291 269 231 233
Other Payments Sickness Allowance 18 26 19 12 5 5 <20 <20 <20 <20 <20 Special Benefit 2 3 0 0 0 0 - - <20 <20 - Rent Assistance 526 553 518 523 600
NOTE: *Maximum Family Payment is paid to low income families. Previous to 1997 called the Additional Family Payment 2004 figures not available Where the pension/benefit type have been less than 20 recipients, data has not been included. SOURCE: Metadata, CentreLink
PENSIONS & BENEFITS RECIPIENTS - WARRAGUL
2000 - 2005
0
500
1000
1500
2000
2500
3000
2000 2001 2002 2003 2005
(No.)
Pensions Family Payments Unemployment/Youth Allow ance Other Payments
SOURCE: Metadata, CentreLink

BAW BAW SHIRE STATISTICAL PROFILE 2005
Gippsland Research & Information Service. 26
TABLE 20 (d): PENSION AND BENEFIT RECIPIENTS, Yarragon
Postcode Area 3823 – 1994 to 2005
Number of Recipients as at June:
Type of Benefit and Pension 1994 1995 1996 1997 1998 1999 2000 2001 2002 2003 2005
Pensions
Age/Mature Age Pension 108 95 101 106 105 108 108 112 126 129 135
Disability Support Pension 33 30 28 34 41 40 47 56 50 51 48
Carer Payment/Allowance 15 14 13 14 13 10 <20 <20 22 23 27
Widow Pension/Allowance 8 10 10 6 5 4 <20 <20 <20 <20 <20
Family Payment
Maximum Family Payment* 75 77 83 89 86 80 251 241 232 215 237
Parenting Payment Single 21 25 22 26 28 22 32 24 30 27 27
Childcare Benefit 21 27
Unemployment/Youth Allowance
Unemployment Benefits 58 48 55 57 49 83
Newstart MAA <20 <20 <20 <20 <20
Newstart Allowance 32 46 <20 <20 <20
Youth Allowance 40 37 25 29 27
Other Payments
Sickness Allowance 4 n.a. n.a. n.a n.a. n.a. <20 <20 <20 <20 -
Special Benefit 0 n.a. n.a. n.a. 0 0 - - <20 <20 -
Rent Assistance 41 42 33 32 29
NOTE: *Maximum Family Payment is paid to low income families. Previous to 1997 called the Additional Family Payment 2004 figures not available Where the pension/benefit type have been less than 20 recipients, data has not been included. SOURCE: Metadata, CentreLink
PENSIONS & BENEFITS RECIPIENTS - YARRAGON
2000 - 2005
0
500
1000
1500
2000
2500
3000
2000 2001 2002 2003 2005
(No.)
Pensions Family Payments Unemployment/Youth Allow ance Other Payments
SOURCE: Metadata, CentreLink

BAW BAW SHIRE STATISTICAL PROFILE 2005
Gippsland Research & Information Service. 27
TABLE 20 (e): PENSION AND BENEFIT RECIPIENTS, Baw Baw Shire
2000 to 2005
Number of Recipients as at June:
Type of Benefit and Pension 2000 2001 2002 2003 2004/2005
Pensions
Age/Mature Age Pension 3 170 3 346 3 447 3 576 n.a.
Disability Support Pension 936 1 024 1 091 1 133 n.a.
Carer Payment/Allowance 89 580 677 728 n.a.
Widow Pension/Allowance 340 352 352 323 n.a.
Family Payment
Maximum Family Payment* 6 440 6 315 6 032 5 979 n.a.
Parenting Payment Single 702 759 777 769 n.a.
Childcare Benefit 677 899 - - -
Unemployment/Youth Allowance
Unemployment Benefits - - - - -
Newstart MAA 70 77 96 87 n.a.
Newstart Allowance 784 804 559 566 n.a.
Youth Allowance 729 722 658 589 n.a.
Other Payments
Sickness Allowance 30 <20 21 21 n.a.
Special Benefit - - <20 <20 n.a.
Rent Assistance 1 373 1 420 1 243 1 217 n.a.
NOTE: *Maximum Family Payment is paid to low income families. Previous to 1997 called the Additional Family Payment 2004/2005 figures not available Where the pension/benefit type have been less than 20 recipients, data has not been included. SOURCE: Metadata, CentreLink

BAW BAW SHIRE STATISTICAL PROFILE 2005
Gippsland Research & Information Service. 28
5.0 HOUSING
TABLE 21: SELECTED HOUSING CHARACTERISTICS
2001 Census Occupied Private Dwellings Total Dwellings
Locality Owned
Being Purchased
(a) Rented
Rent Free/Life Tenure
Other & Not Stated Total Occupied Unoccupied Total
Drouin No. 1 011 666 470 43 67 2 257 2 257 155 2 412
% 44.8 29.5 20.8 1.9 3.0 100.0 93.6 6.4 100.0
Trafalgar No. 434 254 147 12 58 905 905 104 1 009
% 48.0 28.1 16.2 1.3 6.4 100.0 89.7 10.3 100.0
Warragul No. 1 750 1 168 869 60 169 4 016 4 016 213 4 229
% 43.6 29.1 21.6 1.5 4.2 100.0 95.0 5.0 100.0
Yarragon No. 135 72 32 16 8 263 263 20 283
% 51.3 27.4 12.2 6.1 3.0 100.0 92.9 7.1 100.0
Baw Baw Shire No. 6 046 3 762 2 208 399 516 12 931 12 931 1 557 14 488
% 46.8 29.1 17.1 3.1 4.0 100.0 89.3 10.7 100.0
Gippsland No. 42 007 23 521 17 031 2 801 4 384 89 744 89 744 23 327 113 071
% 46.8 26.2 19.0 3.1 4.9 100.0 79.4 20.6 100.0
Victoria No. 743 020 480 800 382 981 41 712 82 830 1 731 343 1 731 343 182 868 1 914 211
% 42.9 27.8 22.1 2.4 4.8 100.0 90.4 9.6 100.0
NOTE: (a) includes purchased under Rent/Buy Scheme SOURCE: ABS, Census of Population and Housing 2001
SELECTED HOUSING CHARACTERISTICS 2001
0
20
40
60
80
100
Ow ned Purchasing Rented Rent Free/ Life
Tenure
Not Stated Total Occ Unocc
(%)
Baw Baw Shire Gippsland Victoria
% Occupied Dwellings % Total Dwellings
SOURCE: ABS, Census of Population and Housing 2001
BAW BAW SHIRE STATISTICAL PROFILE 2005
Gippsland Research & Information Service. 29
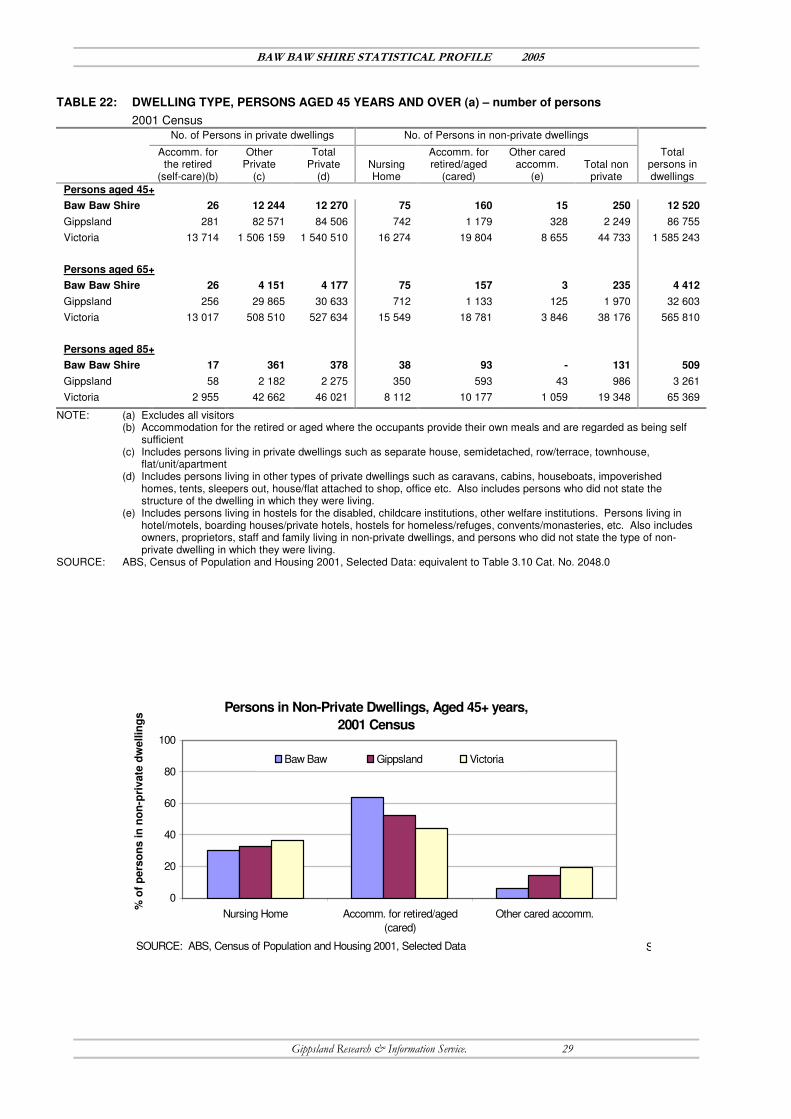
TABLE 22: DWELLING TYPE, PERSONS AGED 45 YEARS AND OVER (a) – number of persons
2001 Census No. of Persons in private dwellings No. of Persons in non-private dwellings
Accomm. for the retired
(self-care)(b)
Other Private
(c)
Total Private
(d) Nursing Home
Accomm. for retired/aged
(cared)
Other cared accomm.
(e) Total non
private
Total persons in dwellings
Persons aged 45+
Baw Baw Shire 26 12 244 12 270 75 160 15 250 12 520
Gippsland 281 82 571 84 506 742 1 179 328 2 249 86 755
Victoria 13 714 1 506 159 1 540 510 16 274 19 804 8 655 44 733 1 585 243
Persons aged 65+
Baw Baw Shire 26 4 151 4 177 75 157 3 235 4 412
Gippsland 256 29 865 30 633 712 1 133 125 1 970 32 603
Victoria 13 017 508 510 527 634 15 549 18 781 3 846 38 176 565 810
Persons aged 85+
Baw Baw Shire 17 361 378 38 93 - 131 509
Gippsland 58 2 182 2 275 350 593 43 986 3 261
Victoria 2 955 42 662 46 021 8 112 10 177 1 059 19 348 65 369
NOTE: (a) Excludes all visitors (b) Accommodation for the retired or aged where the occupants provide their own meals and are regarded as being self
sufficient (c) Includes persons living in private dwellings such as separate house, semidetached, row/terrace, townhouse,
flat/unit/apartment (d) Includes persons living in other types of private dwellings such as caravans, cabins, houseboats, impoverished
homes, tents, sleepers out, house/flat attached to shop, office etc. Also includes persons who did not state the structure of the dwelling in which they were living.
(e) Includes persons living in hostels for the disabled, childcare institutions, other welfare institutions. Persons living in hotel/motels, boarding houses/private hotels, hostels for homeless/refuges, convents/monasteries, etc. Also includes owners, proprietors, staff and family living in non-private dwellings, and persons who did not state the type of non-private dwelling in which they were living.
SOURCE: ABS, Census of Population and Housing 2001, Selected Data: equivalent to Table 3.10 Cat. No. 2048.0
% o
f p
ers
on
s in
no
n-p
rivate
dw
ellin
gs
SOURCE: ABS, Census of Population and Housing 2001, Selected Data
Persons in Non-Private Dwellings, Aged 45+ years,
2001 Census
0
20
40
60
80
100
Nursing Home Accomm. for retired/aged
(cared)
Other cared accomm.
% o
f p
ers
on
s in
no
n-p
rivate
dw
ellin
gs
Baw Baw Gippsland Victoria
SOURCE: ABS, Census of Population and Housing 2001, Selected Data

BAW BAW SHIRE STATISTICAL PROFILE 2005
Gippsland Research & Information Service. 30
Persons in Non-private Dwellings, Aged 65+ years,
2001 Census
0
20
40
60
80
100
Nursing Home Accomm. for retired/aged
(cared)
Other cared accomm.% o
f p
ers
on
s in
no
n-p
rivate
dw
ellin
gs
Baw Baw Gippsland Victoria
SOURCE: ABS, Census of Population and Housing 2001, Selected Data
Persons in Non-private Dwellings, Aged 85+ years,
2001 Census
0
20
40
60
80
100
Nursing Home Accomm. for retired/aged
(cared)
Other cared accomm.% o
f p
ers
on
s in
no
n-p
rivate
dw
ellin
gs
Baw Baw Gippsland Victoria
SOURCE: ABS, Census of Population and Housing 2001, Selected Data

BAW BAW SHIRE STATISTICAL PROFILE 2005
Gippsland Research & Information Service. 31
TABLE 23: DWELLING WEEKLY RENT
2001 Census Weekly Rent * ($)
Locality 0-99 100-199 200-299 300+ Not Stated Total
Drouin No. 171 276 12 3 18 480 % 35.6 57.5 2.5 0.6 3.8 100.0 Trafalgar No. 57 83 0 9 3 152 % 37.5 54.6 0.0 5.9 2.0 100.0 Warragul No. 256 553 39 15 48 911 % 28.1 60.7 4.3 1.6 5.3 100.0 Yarragon No. 12 18 0 0 6 36
% 33.3 50.0 0.0 0.0 16.7 100.0
Baw Baw Shire No. 700 1 303 61 30 108 2 202 % 31.8 59.2 2.8 1.4 4.9 100.0 Gippsland No. 6 945 8 680 341 280 779 17 025 % 40.8 51.0 2.0 1.6 4.6 100.0 Victoria No. 72 046 198 659 63 766 32 785 15 725 382 981 % 18.8 51.9 16.6 8.6 4.1 100.0
NOTE: (*) Includes caravans in caravan parks SOURCE: ABS, Census of Population and Housing 2001
TABLE 24: DWELLING MONTHLY MORTGAGE PAYMENTS
2001 Census
Weekly Rent * ($)
Locality 0-199 200-399 400-599 600-799 800-999 1000+ Not
Stated Total
Drouin No. 15 65 156 163 90 133 41 663
% 2.3 9.8 23.5 24.6 13.6 20.1 6.2 100.0
Trafalgar No. 9 34 107 52 22 25 13 262
% 3.4 13.0 40.8 19.8 8.4 9.5 5.0 100.0
Warragul No. 34 110 285 287 169 202 54 1 141
% 3.0 9.6 25.0 25.2 14.8 17.7 4.7 100.0
Yarragon No. 0 15 25 18 3 7 4 72
% 0.0 20.8 34.7 25.0 4.2 9.7 5.6 100.0
Baw Baw Shire No. 89 402 880 806 487 848 250 3 762
% 2.4 10.7 23.4 21.4 12.9 22.5 6.6 100.0
Gippsland No. 940 3 532 6 112 4 642 2 751 4 006 1 537 23 520
% 4.0 15.0 26.0 19.7 11.7 17.0 6.5 100.0
Victoria No. 13 186 32 005 68 427 85 791 78 960 173 069 29 362 480 800
% 2.7 6.7 14.2 17.8 16.4 36.0 6.1 100.0
NOTE: (*) Includes dwellings being purchased under a rent/buy scheme SOURCE: ABS, Census of Population and Housing 2001
BAW BAW SHIRE STATISTICAL PROFILE 2005
Gippsland Research & Information Service. 32
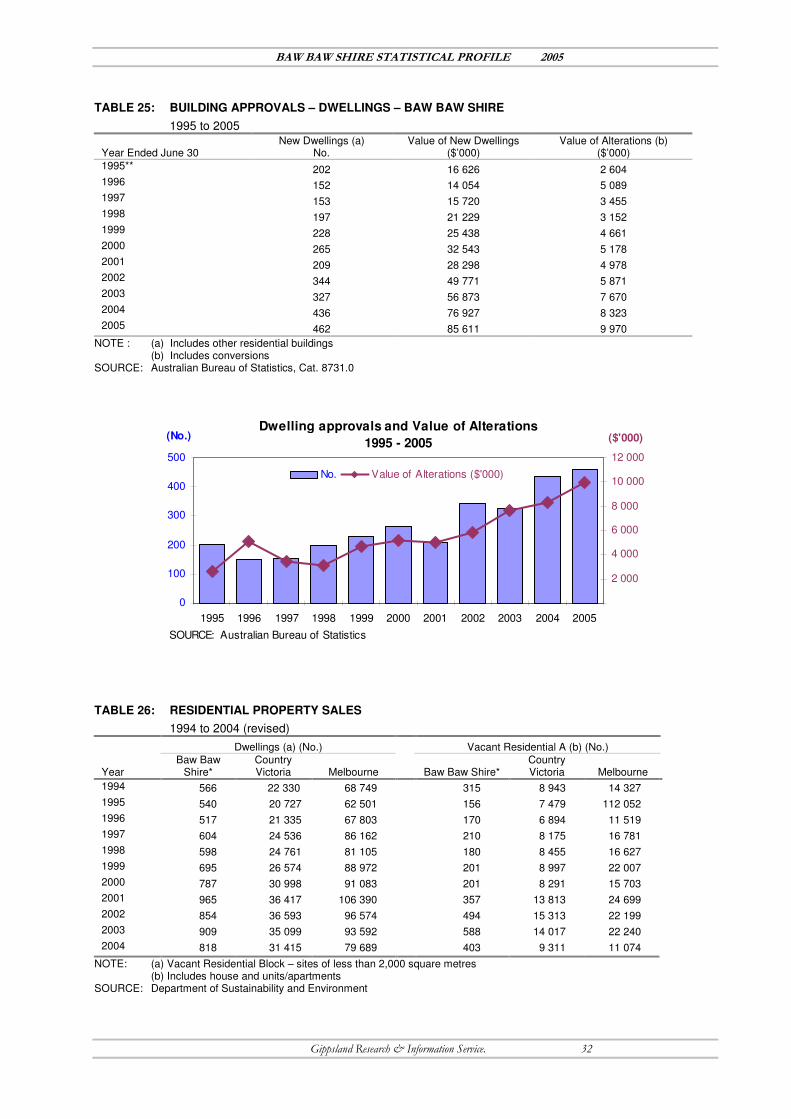
TABLE 25: BUILDING APPROVALS – DWELLINGS – BAW BAW SHIRE
1995 to 2005
Year Ended June 30 New Dwellings (a)
No. Value of New Dwellings
($’000) Value of Alterations (b)
($’000) 1995** 202 16 626 2 604 1996 152 14 054 5 089 1997 153 15 720 3 455 1998 197 21 229 3 152 1999 228 25 438 4 661 2000 265 32 543 5 178 2001 209 28 298 4 978 2002 344 49 771 5 871 2003 327 56 873 7 670 2004 436 76 927 8 323 2005 462 85 611 9 970
NOTE : (a) Includes other residential buildings (b) Includes conversions SOURCE: Australian Bureau of Statistics, Cat. 8731.0
Dwelling approvals and Value of Alterations
1995 - 2005
0
100
200
300
400
500
1995 1996 1997 1998 1999 2000 2001 2002 2003 2004 2005
(No.)
2 000
4 000
6 000
8 000
10 000
12 000
($'000)
No. Value of Alterations ($'000)
SOURCE: Australian Bureau of Statistics
TABLE 26: RESIDENTIAL PROPERTY SALES
1994 to 2004 (revised) Dwellings (a) (No.) Vacant Residential A (b) (No.)
Year Baw Baw
Shire* Country Victoria Melbourne Baw Baw Shire*
Country Victoria Melbourne
1994 566 22 330 68 749 315 8 943 14 327
1995 540 20 727 62 501 156 7 479 112 052
1996 517 21 335 67 803 170 6 894 11 519
1997 604 24 536 86 162 210 8 175 16 781
1998 598 24 761 81 105 180 8 455 16 627
1999 695 26 574 88 972 201 8 997 22 007
2000 787 30 998 91 083 201 8 291 15 703
2001 965 36 417 106 390 357 13 813 24 699
2002 854 36 593 96 574 494 15 313 22 199
2003 909 35 099 93 592 588 14 017 22 240
2004 818 31 415 79 689 403 9 311 11 074
NOTE: (a) Vacant Residential Block – sites of less than 2,000 square metres (b) Includes house and units/apartments SOURCE: Department of Sustainability and Environment

BAW BAW SHIRE STATISTICAL PROFILE 2005
Gippsland Research & Information Service. 33
TABLE 27 (a): MEDIAN HOUSE PRICES
1994 to 2004 (revised)
Year Drouin
($) Trafalgar
($) Warragul
($) Yarragon
($)
Baw Baw Shire
($)
Country Victoria
($) Melbourne
($)
1994 88 750 76 000 93 250 92 000 90 750 86 000 130 000 1995 95 000 81 500 86 000 74 000 90 000 85 000 129 000 1996 83 000 73 000 99 250 70 000 90 000 85 500 131 000 1997 86 000 78 500 95 000 62 000 90 000 88 000 142 000 1998 85 000 75 000 95 000 77 000 90 000 91 000 155 000 1999 96 750 80 250 100 000 83 500 97 250 100 000 175 000 2000 110 000 85 000 111 000 80 000 100 000 105 000 191 000 2001 125 000 90 000 133 000 92 000 122 500 121 000 225 000 2002 145 000 118 000 161 500 135 000 148 000 145 000 260 500 2003 180 000 140 000 192 500 140 000 176 000 174 000 295 000 2004 203 000 170 000 215 000 167 500 195 502 193 500 311 250
Compound Growth p.a. 1994 to 2004
8.6% 8.4% 8.7 6.2% n.a. n.a. n.a.
SOURCE: Department of Sustainability and Environment
COMPOUND GROWTH RATES
1994 - 2004
0%
2%
4%
6%
8%
10%
12%
Drouin Trafalgar Warragul Yarragon
(%)
Median House Prices Median Vacant House Blocks
SOURCE: Department of Sustainability and Environment
TABLE 27 (b): MEDIAN VACANT HOUSE BLOCK PRICES
1994 to 2004 (revised)
Year Drouin
($) Trafalgar
($) Warragul
($) Yarragon
($)
Baw Baw Shire
($)
Country Victoria
($) Melbourne
($)
1994 36 000 24 250 28 500 22 000 31 000 32 000 52 000 1995 32 000 25 000 33 000 90 000 33 000 33 500 55 000 1996 34 500 37 250 34 750 61 500 36 000 33 550 55 000 1997 36 000 22 800 39 000 55 000 40 000 35 000 59 000 1998 32 000 20 000 38 500 91 750 37 500 35 500 61 000 1999 41 000 34 000 37 500 15 000 38 500 38 000 65 750 2000 36 000 27 800 53 000 50 000 40 000 39 750 66 000 2001 34 000 40 000 49 500 31 000 43 500 44 000 74 000 2002 60 000 43 500 57 750 37 500 57 000 52 500 90 000 2003 64 000 55 000 69 000 44 500 63 500 65 000 118 000 2004 73 000 57 000 79 500 48 500 72 000 75 500 35 275 Compound Growth p.a. 1994 to 2004
7.3% 8.9% 10.8% 8.2% n.a. n.a. n.a.
SOURCE: Department of Sustainability and Environment

BAW BAW SHIRE STATISTICAL PROFILE 2005
Gippsland Research & Information Service. 34
6.0 ECONOMIC CHARACTERISTICS
TABLE 28: SELECTED EMPLOYMENT CHARACTERISTICS
2001 Census Town Baw Baw
Employment Drouin Trafalgar Warragul Yarragon Shire Gippsland Victoria Characteristics No. No. No. No. No. No. No.
Persons aged 15 years and over Not in the labour force 1 863 455 2 998 216 9 333 70 760 1 277 942 Labour Force 2 429 602 4 635 300 16 137 98 432 2 234 075
Employed labour force 2 242 546 4 363 262 15 079 89 652 2 082 216 Unemployed labour force 187 56 272 38 1 058 8 780 151 859
Not stated 152 31 312 25 936 7 826 156 367 TOTAL 4 444 1 088 7 945 541 26 406 177 018 3 668 384
Sex of total labour force
Males 1 371 368 2 413 178 8 952 55 025 1 226 657 Females 1 058 234 2 222 122 7 185 43 407 1 007 418
TOTAL 2 429 602 4 635 300 16 137 98 432 2 234 075
Age of total labour force
15 - 19 years 202 44 433 23 1 292 7 638 151 976 20 - 34 years 731 182 1 468 99 4 358 27 240 785 398 35 - 54 years 1 191 317 2 224 144 8 192 49 926 1 044 642 55+ years 305 59 510 34 2 295 13 628 252 059
TOTAL 2 429 602 4 635 300 16 137 98 432 2 234 075
SOURCE: ABS, Census of Population and Housing 2001
% Change in Labour Force
Baw Baw Shire, 1996 to 2001
-30 -20 -10 0 10 20 30
Victoria
Baw Baw
Employed F/T
Employed P/T
Total Employed
Unemployed
Total Labour Force
Not in L/F
Total Persons aged 15-64 Yrs
SOURCE: ABS, Census of Population and Housing

BAW BAW SHIRE STATISTICAL PROFILE 2005
Gippsland Research & Information Service. 35
TABLE 29: LABOUR FORCE PARTICIPATION, Persons Aged 45+
2001 Census
Employed Full Time
Employed Part Time
Total Employed (inc. not stated)
Unemployed: Looking for
Work
Total Labour Force
Not in Labour Force
Total Persons (excl. not stated)
Persons aged 45+
Baw Baw Shire 3 812 1 923 5 976 286 6 262 5 996 12 258
% of persons in age group 31.1 15.7 48.8 2.3 51.1 48.9 100.0
Gippsland 22 180 12 367 35 839 2 389 38 228 47 043 85 271
% of persons in age group 26.0 14.5 42.0 2.8 44.8 55.2 100.0
Victoria 462 775 216 598 701 118 36 148 737 266 807 158 1 544 424
% of persons in age group 30.0 14.0 45.4 2.3 47.7 52.3 100.0
Persons aged 65+
Baw Baw Shire 256 197 531 3 534 3 617 4 151
% of persons in age group 6.2 4.7 12.8 0.1 12.9 87.1 100.0
Gippsland 1 236 1 168 2 751 73 2 824 27 994 30 818
% of persons in age group 4.0 3.8 8.9 0.2 9.2 90.8 100.0
Victoria 17 539 20 062 41 383 1 181 42 564 486 344 528 908
% of persons in age group 3.3 3.8 7.8 0.2 8.0 92.0 100.0
SOURCE: ABS, Census of Population and Housing 2001
Labour Force Participation, Persons Aged 45+
0
10
20
30
40
50
60
Employed Full time Employed Part time Unemployed: Looking
for w ork
Not in Labour Force
(%) Baw Baw Gippsland Victoria
SOUIRCE: ABS, Census of Population and Housing 2001
Labour Force Participation, Persons Aged 65+
0
1
2
3
4
5
6
7
Employed Full time Employed Part time Unemployed: Looking for w ork
(%)
Baw Baw Gippsland Victoria
SOUIRCE: ABS, Census of Population and Housing 2001

BAW BAW SHIRE STATISTICAL PROFILE 2005
Gippsland Research & Information Service. 36
TABLE 30: EMPLOYMENT BY INDUSTRY SECTOR – BAW BAW SHIRE (a)
ABS, Census Period
1991 1996 2001
No. % No. % No. %
% Change 1991-2001
% Change 1996-2001
Agriculture, Forestry & Fishing 2 238 16.9 2 414 17.6 2 231 14.8 -0.3 -7.6
Mining 83 0.6 76 0.6 69 0.5 -16.9 -9.2
Manufacturing 1 270 9.6 1 578 11.5 1 596 10.6 25.7 1.1
Electricity, Gas & Water Supply 696 5.2 275 2.0 254 1.7 -63.5 -7.6
Construction 748 5.6 875 6.4 1 127 7.5 50.7 28.8
Wholesale Trade 631 4.8 612 4.5 841 5.6 33.3 37.4
Retail Trade 1 612 12.1 1 783 13.0 2 045 13.6 26.9 14.7
Accommodation, Cafes & Restaurants 280 2.1 339 2.5 550 3.6 96.4 62.2
Transport & Storage 421 3.2 441 3.2 525 3.5 24.7 19.0
Communication Services 187 1.4 176 1.3 170 1.1 -9.1 -3.4
Finance & Insurance 326 2.5 301 2.2 243 1.6 -25.5 -19.3
Property & Business Services 462 3.5 744 5.4 913 6.1 97.6 22.7
Government Admin & Defence 685 5.2 460 3.4 368 2.4 -46.3 -20.0
Education 1 067 8.0 1 191 8.7 1 380 9.2 29.3 15.9
Health & Community Services 997 7.5 1 175 8.6 1 505 10.0 51.0 28.1
Cultural & Recreational Services 175 1.3 242 1.8 284 1.9 62.3 17.4
Personal and Other Services 425 3.2 536 3.9 579 3.8 36.2 8.0
Non-classifiable economic units 26 0.2 174 1.3 110 0.7 - -
Not stated 952 7.2 286 2.1 289 1.9 - -
Total 13 281 100.0 13 678 100.0 15 079 100.0 13.5 10.2
NOTE: (a) The industry classification underwent a major review between the 1991 and 1996 Census. 1991 Census data in this table should be used as an Indicator only
SOURCE: ABS, Census of Population and Housing, Time Series
TABLE 31: BUSINESS ESTABLISHMENTS BY TOWNSHIP – BAW BAW SHIRE – 2001 (a)
No. and Type of Establishments by Town Baw Baw Shire Victoria
Industry Drouin
No. Trafalgar
No. Warragul
No. Yarragon
No. Balance No. (c)
Total No. (b)
Published data as %
of Total Industries
Total No.
% of Total Industries
Agri. Forestry & Fishing 328 180 411 109 347 1 375 32.1 19 661 9.6
Mining n.p. - n.p. - - n.p. - 279 0.1
Manufacturing 58 17 100 8 24 207 4.8 18 021 8.8
Elec. Gas & Water n.p. n.p. - - - n.p. - 142 0.1
Construction 157 53 262 17 73 562 13.1 27 271 13.3
Wholesale Trade 31 21 66 n.p. 12 130 3.0 10 677 5.2
Retail Trade 93 39 234 20 44 430 10.0 29 561 14.4
Accom., Cafes & Restaurants 16 6 40 9 7 78 1.8 8 048 3.9
Transport & Storage 49 26 85 16 40 216 5.0 9 066 4.4
Communication Services n.p. n.p. 13 n.p. n.p. 13 0.3 1 878 0.9
Finance & Insurance 28 14 120 5 17 184 4.3 7 872 3.8
Property & Business 112 50 281 17 61 521 12.2 41 316 20.2
Govt Admin & Defence n.p. n.p. n.p. n.p. n.p. n.p. - 348 0.2
Education 11 5 31 n.p. 5 52 1.2 4 507 2.2
Health & Comm. Services 29 10 78 n.p. 7 124 2.9 12 264 6.0
Cultural & Rec Services 34 9 46 n.p. 14 103 2.4 4 858 2.4
Personal & Other Services 31 15 88 n.p. 14 148 3.5 8 585 4.2
Not Stated 1 - 2 - - 3 0.1 233 0.1
All industries 992 450 1 882 218 742 4 284 - 204 587 100.0
NOTE: (a) Australian Business Number counts. Business entities counted in this table operate from one location only and are actively registered for GST
(b) Data is the sum of published data only Data derived from Postcode data (c) Balance includes the towns of Darnum, Longwarry, Neerim, Noojee and Thorpdale n.p. Not available for separate publication but included in totals were applicable SOURCE: Australian Business Number Register, ABS, Commonwealth of Australia, 2004

BAW BAW SHIRE STATISTICAL PROFILE 2005
Gippsland Research & Information Service. 37
TABLE 32: LABOUR FORCE BY OCCUPATION
2001 Census ABS, Census Period
1991 1996 2001 Occupation No. % No. % No. %
% Change 1991-2001
% Change 1996-2001
Managers & Administrators 2 466 18.6 2 464 18.0 2 356 15.6 -4.5 -4.4
Professionals 1 708 12.9 1 989 14.5 2 307 15.3 35.1 16.0
Associate Professionals 858 6.5 1 368 10.0 1 514 10.0 76.5 10.7
Tradespersons & Related Workers 1 832 13.8 1 821 13.3 2 051 13.6 12.0 12.6
Advanced Clerical & Service Workers 635 4.8 447 3.3 492 3.3 -22.5 10.1
Int. Clerical, Sales, Service Workers 1 066 8.0 1 556 11.4 1 871 12.4 75.5 20.2
Int. Production & Transport Workers 1 289 9.7 1 224 8.9 1 358 9.0 5.4 10.9
Elem. Clerical, Sales, Service Workers 1 174 8.8 1 102 8.1 1 293 8.6 10.1 17.3
Labourers & Related Workers 1 299 9.8 1 326 9.7 1 521 10.1 17.1 14.7
Not Stated 953 7.2 381 2.8 316 2.1 -66.8 -17.1
Total 13 280 100.0 13 678 100.0 15 079 100.0 13.5 10.2
SOURCE: ABS, Census of Population and Housing, Time Series
TABLE 33: NUMBER AND RATE1 UNEMPLOYED
as at June 30, 1999 to 2005
Area 1999 2000 2001 2002 2003 2004 2005
Part A No. 211 198 175 140 111 124 137 % 11.5 10.2 8.6 7.5 5.4 5.3 6.0 Part B West No. 734 735 657 496 476 534 661 % 6.9 6.5 5.6 4.6 3.7 3.5 4.3 Part B East No. 195 180 144 113 101 126 139 % 10.6 9.3 7.1 6.0 5.1 5.6 6.0 Baw Baw Shire No. 1 140 1 113 976 749 688 784 937 % 8.0 7.3 6.2 5.2 4.1 4.0 4.6 Gippsland* No. 9 800 9 900 8 200 7 400 7 000 8 300 10 200 % 10.8 10.3 8.1 8.1 6.3 6.8 8.2 Victoria No. 178 600 159 500 147 900 155 600 143 800 140 900 146 800 % 7.6 6.6 6.0 6.3 5.7 5.6 5.6
NOTE: (1) Rate – number unemployed as a percentage of labour force SOURCE: Department of Employment, Workplace Relations – Small Area Labour Market – Australia; *Australian Regional
Labour Markets, DEWR
UNEMPLOYMENT RATE 1999-2005
0
2
4
6
8
10
12
1999 2000 2001 2002 2003 2004 2005
(%)
Baw Baw Shire Gippsland Victoria
SOURCE: Department of Employment, Workplace Relations - Small Area Labour Market-Australia;
*Australian Regional Labour Markets, DEWR

BAW BAW SHIRE STATISTICAL PROFILE 2005
Gippsland Research & Information Service. 38
TABLE 34: TOURIST ACCOMMODATION STATISTICS (a)
March Qtr 2004 – June Qtr 2005, Baw Baw Shire (a)
Area Qtr
No. of Establish
ments (b)
No. of Guest Rooms
(b)
Persons Employed (Number)
(c)
No. of guest
arrivals/ lettings (‘000)
(b)
No. of Guest nights (‘000)
(b)
No. of room nights
occupied (‘000)
(b)
Takings from
accomm-odation ($’000)
(b)
Room occupancy
rate (%) (b)
Mar 04 3 105 23 4 032 7 675 4 104 336 43.0
Jun 04 3 105 25 4 870 9 198 4 614 352 48.3
Sep 04 3 105 28 4 188 7 395 3 805 289 39.4
Dec 04 3 106 25 4 514 10 508 4 893 360 50.2
Mar 05 4 124 36 5 882 11 237 5 634 500 50.5
Baw Baw Shire
(a)
Jun 05 4 124 31 4 526 7 776 4 440 352 39.3
Mar 04 11 375 142 21 714 51 248 20 625 2 588 60.4
Jun 04 11 371 134 14 056 28 768 12 472 1 403 36.9
Sep 04 10 332 133 14 522 23 250 10 320 1 098 33.8
Dec 04 10 344 132 18 724 35 702 14 218 1 858 44.9
Mar 05 10 344 105 20 988 48 151 19 480 2 772 62.9
Phillip Island Tourist Region
Jun 05 10 343 96 13 825 26 932 11 148 1 309 35.7
Mar 04 33 999 307 37 782 64 275 40 772 3 143 44.8
Jun 04 33 1 000 280 33 491 54 302 36 022 2 766 39.6
Sep 04 33 1 000 275 32 332 48 626 33 124 2 661 36.0
Dec 04 33 1 003 272 38 619 61 592 38 991 3 100 42.3
Mar 05 38 1 113 318 42 380 68 299 42 902 3 509 44.2
Gippsland Tourism
Region (d)
Jun 05 37 1 101 305 39 274 63 437 43 928 3 502 44.5
Mar 04 22 598 261 41 454 63 214 31 071 2 806 57.1
Jun 04 22 598 226 30 325 43 169 23 753 2 104 43.6
Sep 04 21 571 219 23 203 33 478 19 555 1 639 37.5
Dec 04 20 552 219 30 547 50 095 26 407 2 278 52.0
Mar 05 23 694 272 51 147 94 646 39 625 4 529 63.4
Lakes Tourism Region
Jun 05 24 710 249 30 245 46 046 24 760 2 145 40.8
Mar 04 744 35 317 21 600 1 518 110 3 386 548 1 973 662 260 315 61.6
Jun 04 746 35 473 21 645 1 436 003 3 032 759 1 815 864 222 573 56.5
Sep 04 739 35 299 21 866 1 556 368 3 282 255 1 933 385 251 013 59.6
Dec 04 741 35 353 21 228 1 623 570 3 391 323 2 003 250 258 123 62.1
Mar 05 776 36 371 21 529 1 674 480 3 725 746 2 141 530 291 678 66.3
Victoria
Jun 05 780 36 443 21 608 1 554 274 3 199 080 1 953 592 249 554 59.4
NOTE: (a) Comprising establishments with 15 or more rooms or units (b) Impact of Break – calculations of percentage change between quarters should be treated with caution for the March
and June qtr datasets. Technical Note: The Survey of Tourist Accommodation (STA) frame is based on an electronic file supplied each quarter by AAA Tourism. Since December 2002, AAA Tourism has been more active in maintaining their listing of accommodation establishments on this electronic file. This active maintenance has resulted in a large number of hotels, motels and guest houses and serviced apartments being identified for the first time in both the March quarter 2003 and the June quarter 2003. While these establishments were identified in these quarters, they actually commenced operations prior to these time periods. The number of additional establishments identified within the Victorian sample during the March and June 2003 quarter was 28 in total. (c) Employment numbers exclude real estate agents and their employees (d) Does not include Phillip Island Tourism Region or Lakes Tourism Region
SOURCE: The Survey of Tourist Accommodation, Australian Bureau of Statistics
Tourist Accommodation Mar Qtr 04 - Jun Qtr 05
0
20
40
60
80
Mar 04 Jun 04 Sep 04 Dec 04 Mar 05 Jun 05
% R
oo
m O
ccu
pan
cy R
ate
Baw Baw Shire Victoria
SOURCE: Survey of Tourist Accommodation, Australian Bureau of Statistics

BAW BAW SHIRE STATISTICAL PROFILE 2005
Gippsland Research & Information Service. 39
Tourist Accommodation March Quarter 2005
0
20
40
60
80
Baw Baw Shire Phillip Island
Tourism Region
Gippsland
Tourism Region
Lakes Tourism
Region
Victoria
% O
ccu
pan
cy R
ate
Hotels/Motels Caravan Parks
SOURCE: Survey of Tourist Accommodation, Australian Bureau of Statistics
TABLE 35: CARAVAN PARKS
March Quarter 2003 – June Quarter 2005
Quarter
Establishments (No.)
Total Capacity* (No.)
Persons
Employed (No.)
Site Occupancy
Rates (%)
Takings ($’000)
Mar 03 5 480 26 58.1 291
Jun 03 5 476 17 56.0 337
Sep 03 5 475 14 53.7 194
Dec 03 5 446 13 59.6 236
Mar 05 5 448 14 63.0 212
Baw Baw Shire
Jun 05 5 448 14 58.9 193
Mar 03 23 2 998 107 70.1 2 298
Jun 03 24 3 013 110 64.5 1 333
Sep 03 24 3 024 104 63.8 1 299
Dec 03 24 3 033 116 69.3 2 216
Mar 05 24 3 050 128 73.2 2 761
Phillip Island Tourist Region
Jun 05 24 3 076 129 70.0 1 880
Mar 03 31 3 840 115 56.7 1 717
Jun 03 35 4 023 114 49.5 1 589
Sep 03 35 4 081 97 48.0 1 263
Dec 03 35 4 153 110 50.1 1 717
Mar 05 34 3 991 115 58.0 2 466
Gippsland Tourism Region
(a)
Jun 05 33 3 911 106 54.7 1 634
Mar 03 35 3 792 150 47.3 2 151
Jun 03 35 3 738 156 44.3 1 605
Sep 03 36 3 756 147 43.4 1 337
Dec 03 36 3 785 147 47.4 2 201
Mar 05 34 3 468 146 49.4 2 587
Lakes Tourism Region
Jun 05 35 3 617 149 38.0 1 489
Mar 03 418 56 028 1 955 58.0 38 178
Jun 03 432 56 478 1 957 51.9 30 682
Sep 03 382 50 357 1 551 45.9 23 364
Dec 03 432 56 787 1 986 51.6 37 439
Mar 05 416 57 493 2 002 56.1 42 806
Victoria
Jun 05 414 57 025 1 924 48.2 30 111
NOTE: * Number of sites including On-site vans, powered and unpowered sites, cabins and flats. Comprising establishments with 40 or more powered sites and cabins etc. (a) Does not include Phillip Island Tourist Region or Lakes Tourism Region
SOURCE: The Survey of Tourist Accommodation, Australian Bureau of Statistics

BAW BAW SHIRE STATISTICAL PROFILE 2005
Gippsland Research & Information Service. 40
TABLE 36: TRAFFIC COUNTS
At selected locations in the Baw Baw Shire, 2004
Location Direction Location Count Start Count End ADT 7
day ADT week
ADT Mid/
Week
Cars %
Commercial %
Bloomfield Rd N Btw Drouin/Warragul Rd & Nilma Shady Creek Rd
10/03/04 16/03/04 958 997 999 84.4 15.6
Bloomfield Rd S Btw Drouin/Warragul Rd & Nilma Shady Creek Rd
10/03/04 16/03/04 961 1 015 1 012 85.2 14.8
Bloomfield Rd S btw Old Sale Rd & Ryries Rd 10/03/04 16/03/04 492 511 500 80.7 19.3
Bloomfield Rd N btw Old Sale Rd & Ryries Rd 10/03/04 16/03/04 522 528 523 82.0 18.0
Brandy Creek Rd N 300m S of Old Sale Rd 10/03/04 16/03/04 1 348 1 342 1 321 94.1 5.9
Brandy Creek Rd S 300m S of Old Sale Rd 10/03/04 16/03/04 1 350 1 337 1 321 90.9 9.1
Drouin/Warragul Rd W Btw Lardners Track & Tarwin St 10/03/04 16/03/04 5 827 6 369 6 322 92.9 7.5
Drouin/Warragul Rd E Btw Lardners Track & Tarwin St 10/03/04 16/03/04 6 230 6 799 6 714 92.3 7.7
Main Neerim Rd S 500m S of Telegraph Rd 10/03/04 16/03/04 804 696 677 85.3 14.7
Main Neerim Rd N 500m S of Telegraph Rd 10/03/04 16/03/04 808 713 690 86.3 13.7
Main Neerim Rd S Btw Bloomfield Rd & Town Rd 10/03/04 16/03/04 1 600 1 530 1 496 88.4 11.6
Main Neerim Rd N Btw Bloomfield Rd & Town Rd 10/03/04 16/03/04 1 621 1 560 1 519 86.1 13.9
Princes Fwy E 200m Past off ramp @ 109 km 25/02/04 02/03/04 9 220 9 263 8 669 80.6 19.4
Princes Fwy W 350m E of Boundary Rd 25/02/04 02/03/04 9 248 9 059 8 726 81.8 18.2
Princes Fwy E Btw Williamsons Rd & Ten Mile Rd
25/02/04 02/03/04 9 201 9 263 8 808 77.7 22.3
Princes Fwy W Btw Williamsons Rd & Ten Mile Rd
25/02/04 02/03/04 9 133 9 064 8 824 82.8 17.2
NOTE: ADT 7 Day - Average Daily Traffic over a seven day period ADT Week - Average Daily Traffic during the week (Monday to Friday) SOURCE: Vic Roads

BAW BAW SHIRE STATISTICAL PROFILE 2005
Gippsland Research & Information Service. 41
7.0 AGRICULTURE
TABLE 37: LIVESTOCK NUMBERS
Agricultural Census 2001
Total Milk Cattle Total Meat Cattle Total Sheep Total Other Livestock
Total Livestock
Baw Baw Shire 117 448 57 573 33 601 162 125 370 747
Gippsland 568 583 595 300 1 091 840 320 907 2 576 630
Victoria 1 970 752 2 434 698 16 794 056 4 674 681 25 874 187
Baw Baw Shire as a % of Gippsland 20.7 9.7 3.1 50.5 14.4
SOURCE: ABS, Agricultural Census 2001
TABLE 38: NUMBER OF ESTABLISHMENTS WITH AGRICULTURAL ACTIVITY
Agricultural Census 2001 No. of Establishments Sown Pasture
(ha) Area of Crops
(ha)
Baw Baw Shire 1 460 78 053 89 348
Gippsland 5 710 648 563 869 610
Victoria 47 475 4 909 322 6 741 256
Baw Baw Shire as a % of Gippsland 25.6 12.0 10.3
SOURCE: ABS, Agricultural Census 2001
TABLE 39: GROSS VALUE OF AGRICULTURAL PRODUCTION ($)
Agricultural Census 2001
Baw Baw Shire $
Baw Baw Shire as a % of Gippsland
Gippsland $
Victoria $
Horticultural Products
Vegetables 31 467 968 35.1 89 671 313 580 802 618
Grapes 57 503 8.7 663 170 365 011 710
Fruit (excluding grapes) 310 305 * 5.8 5 305 034 457 640 504
Cut Flowers 5 494 357 * 54.2 10 144 350 71 555 392
Cultivated Turf 81 142 * 16.4 493 612 39 265 773
Total Horticultural Products 37 411 275 35.2 106 277 479 1 514 275 997
Livestock Products
Wool 802 842 3.1 26 277 016 504 520 991
Milk 116 546 302 20.0 582 029 676 1 989 659 190
Eggs 3 554 417 46.4 7 652 652 * 90 405 538
Total Livestock Products (a) 120 903 561 19.6 616 127 471 2 591 565 079
Livestock Slaughtering
Sheep/Lamb 1 700 144 6.9 24 693 041 472 643 637
Cattle/Calves 49 911 384 17.2 290 644 915 1 100 730 332
Pigs 6 403 005 85.9 7 450 346 191 161 984
Chickens 7 552 007 72.6 10 401 256 282 850 261
Total Livestock Slaughterings (a) 65 690 495 19.7 334 096 011 2 053 380 439
Hay
Pasture for Hay 9 879 688 14.0 70 389 537 353 328 529
Crops for Hay 209 863 9.6 2 179 662 40 845 080
Lucernes for Hay 263 537 * 5.1 5 207 915 44 674 929
Total Hay 10 137 632 13.4 75 597 452 374 973 568
Other Pastures & Grasses 257 944 * 21.0 1 229 531 21 645 039
Total Agricultural GVP 250 150 007 21.6 1 160 149 896 8 301 249 631
NOTE: * Estimates have a relative standard error of 25% to 50% and should be used with caution (a) Does not include ‘Other’ SOURCE: ABS, Agricultural Census 2001

BAW BAW SHIRE STATISTICAL PROFILE 2005
Gippsland Research & Information Service. 42
TABLE 40 (a): RURAL PROPERTY SALES - CATTLE PROPERTIES
1996 to 2004
1996
1997
1998
1999
2000
2001
2002
2003
2004
No. of Sales
Baw Baw Shire 13 3 5 6 6 4 11 10 11
Country Victoria 302 347 244 112 217 293 304 358 308
Median Sale Price ($)
Baw Baw Shire 178 000 240 000 130 000 237 500 246 000 195 000 300 000 312 500 400 000
Country Victoria 120 000 110 200 115 000 128 053 152 000 180 000 195 000 220 500 277 000
Median Sale Price Per Unit Area ($/ha)
Baw Baw Shire 7 746.0 18 505.0 7 254.5 10 646.0 9 891.0 6 572.5 25 926.0 6 312.8 4 053.7
Country Victoria 3 213.6 2 804.7 2 846.9 2 325.0 3 396.0 3 975.0 7 228.0 7 945.8 5 894.5
Median Block Size (ha)
Baw Baw Shire 26.4 13.5 12.5 24.1 25.0 33.9 16.0 41.7 32.1
Country Victoria 39.0 40.2 45.0 49.2 47.0 41.6 40.4 42.8 43.7
SOURCE: Department of Sustainability and Environment
TABLE 40 (b): RURAL PROPERTY SALES - DAIRY PROPERTIES
1996 to 2004
1996
1997
1998
1999
2000
2001
2002
2003
2004
No. of Sales
Baw Baw Shire 6 3 3 7 11 11 10 9 15
Country Victoria 142 127 97 130 202 285 205 226 253
Median Sale Price ($)
Baw Baw Shire 277 500 400 000 630 000 310 000 112 500 205 000 357 500 410 000 350 000
Country Victoria 229 731 169 752 230 000 212 000 196 913 226 800 295 750 328 250 305 442
Median Sale Price Per Unit Area ($/ha)
Baw Baw Shire 8 766.0 8 573.0 7 868.1 9 839.0 3 535.0 5 117.0 9 521.0 3 376.4 4 053.7
Country Victoria 5 293.7 6 102.0 5 752.2 5 281.0 4 571.0 5 491.0 4 410.0 13 953.8 386.8
Median Block Size (ha)
Baw Baw Shire 28.0 44.1 61.3 39.1 29.8 56.8 37.2 54.2 32.1
Country Victoria 40.5 35.1 44.7 41.0 43.7 46.3 50.6 49.1 46.5

BAW BAW SHIRE STATISTICAL PROFILE 2005
Gippsland Research & Information Service. 43
SOURCE: Department of Sustainability and Environment

BAW BAW SHIRE STATISTICAL PROFILE 2005
Gippsland Research & Information Service. 44
TABLE 40 (c): RURAL PROPERTY SALES - HOBBY FARMS & UNSPECIFIED RURAL PROPERTIES
1999 to 2004
1999 2000 2001 2002 2003 2004
No. of Sales Baw Baw Shire
Hobby Farm with residence Hobby Farm without residence Unspecified Rural Property
44 27 21
60 28 33
57 22 53
57 24 50
71 35
116
126 12 70
Country Victoria Hobby Farm with residence Hobby Farm without residence Unspecified Rural Property
567 633 672
797 855
1 353
1 324 994
1 461
1 139 815
1 517
1 764 1 612 2 422
2 528 973
2 657
Melbourne Hobby Farm with residence Hobby Farm without residence Unspecified Rural Property
118 497
92
222 28
154
291 116 116
276 74
117
371 121 211
608 40
195
Median Sale Price ($) Baw Baw Shire
Hobby Farm with residence Hobby Farm without residence Unspecified Rural Property
166 500 70 000
155 000
170 000 75 000
206 000
197 500 99 500
247 500
255 000 88 500
307 500
300 000 180 000 340 917
350 000 120 000 367 500
Country Victoria Hobby Farm with residence Hobby Farm without residence Unspecified Rural Property
138 000 65 000
107 250
158 000 80 000
140 000
166 750 73 000
175 000
205 000 70 000
205 000
240 500 86 000
215 000
266 500 85 000
220 000
Melbourne Hobby Farm with residence Hobby Farm without residence Unspecified Rural Property
298 750 147 000 289 250
330 000 192 000 345 000
362 500 213 000 407 500
457 500 233 750 450 000
560 000 297 000 547 000
560 000 200 000 540 000
Median Sale Price Per Unit Area ($/ha) Baw Baw Shire
168 561.2 37 763.2
9 160.1
Hobby Farm with residence Hobby Farm without residence Unspecified Rural Property
51 974 29 771
9 340
82 386 32 500
8 725
66 253 38 664
8 925
95 959 37 983
8 174
59 354 63 229
7 361
Country Victoria 74 837.3 22 644.9
4 830.8
Hobby Farm with residence Hobby Farm without residence Unspecified Rural Property
26 222 24 000
4 579
45 000 27 272
4 069
43 803 20 035
4 275
55 931 49 535
4 837
56 014 21 554
8 936
Melbourne 524 056.8
15 682.9 21 251.1
Hobby Farm with residence Hobby Farm without residence Unspecified Rural Property
72 186 85 097 28 515
76 755 61 375 28 500
75 495 67 285 27 189
154 984 120 435
34 867
187 050 125 370
24 208
Median Block Size (ha) Baw Baw Shire
6.0 3.1
39.1
Hobby Farm with residence Hobby Farm without residence Unspecified Rural Property
2.6 1.5
19.0
2.0 4.0
23.9
3.0 2.8
29.3
4.0 2.2
36.4
4.1 4.5
36.0
Country Victoria 4.6 4.4
54.6
Hobby Farm with residence Hobby Farm without residence Unspecified Rural Property
4.1 1.8
21.6
3.0 3.0
32.0
3.9 3.1
40.5
2.7 2.0
30.8
2.4 2.1
33.4
Melbourne 20.6
4.2
33.4
Hobby Farm with residence Hobby Farm without residence Unspecified Rural Property
4.0 1.5 9.8
4.8 4.0
13.0
4.2 2.8
20.1
4.5 2.7
28.7
4.2 4.1
24.0
NOTE: In 1999, further reclassification of rural properties may cause fluctuations in total numbers. SOURCE: Department of Sustainability and Environment