2002 interim results
DESCRIPTION
2002 interim results. 31 July 2002. TRINITY MIRROR plc. TRINITY MIRROR plc. 2002 Interim Results SLIDE 1. Presentation overview. Sir Victor Blank, Chairman. Philip Graf, Group Chief Executive. Joe Sinyor, Chief Executive, Newspapers. Financial highlights. - PowerPoint PPT PresentationTRANSCRIPT

2002interim results31 July 2002
TRINITY MIRROR plc.
Sir Victor Blank, Chairman
Philip Graf, Group Chief Executive
Joe Sinyor, Chief Executive, Newspapers
Presentation overview
TRINITY MIRROR plc. 2002 Interim Results SLIDE 2
TRINITY MIRROR plc. 2002 Interim Results SLIDE 3
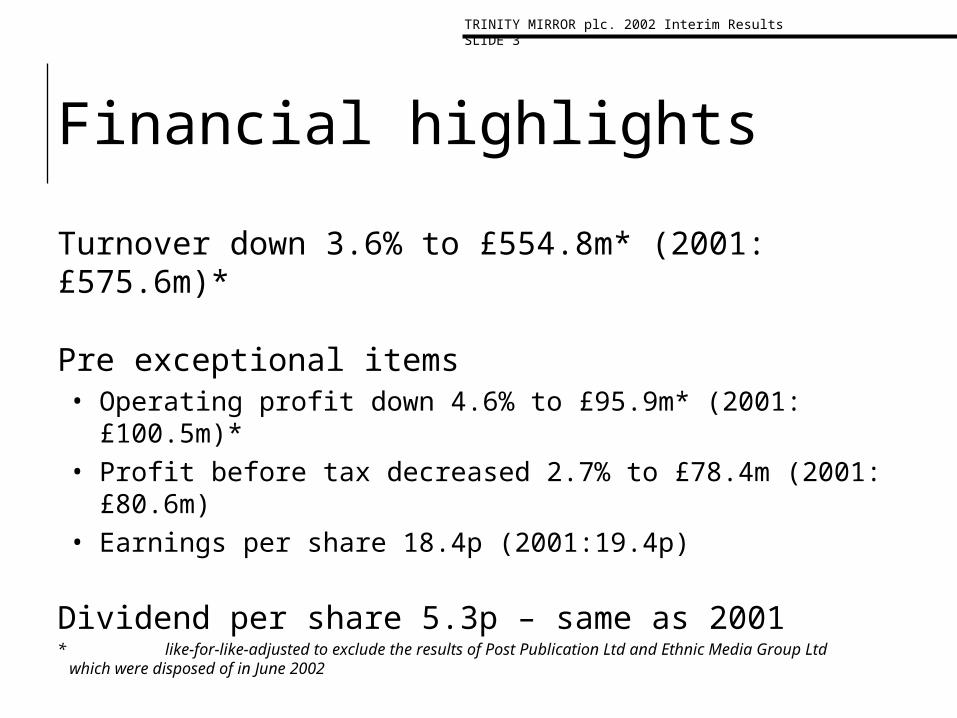
Financial highlights
Turnover down 3.6% to £554.8m* (2001: £575.6m)*
Pre exceptional items• Operating profit down 4.6% to £95.9m* (2001: £100.5m)* • Profit before tax decreased 2.7% to £78.4m (2001:
£80.6m)• Earnings per share 18.4p (2001:19.4p)
Dividend per share 5.3p – same as 2001
* like-for-like-adjusted to exclude the results of Post Publication Ltd and Ethnic Media Group Ltd which were disposed of in June 2002
TRINITY MIRROR plc. 2002 Interim Results SLIDE 4
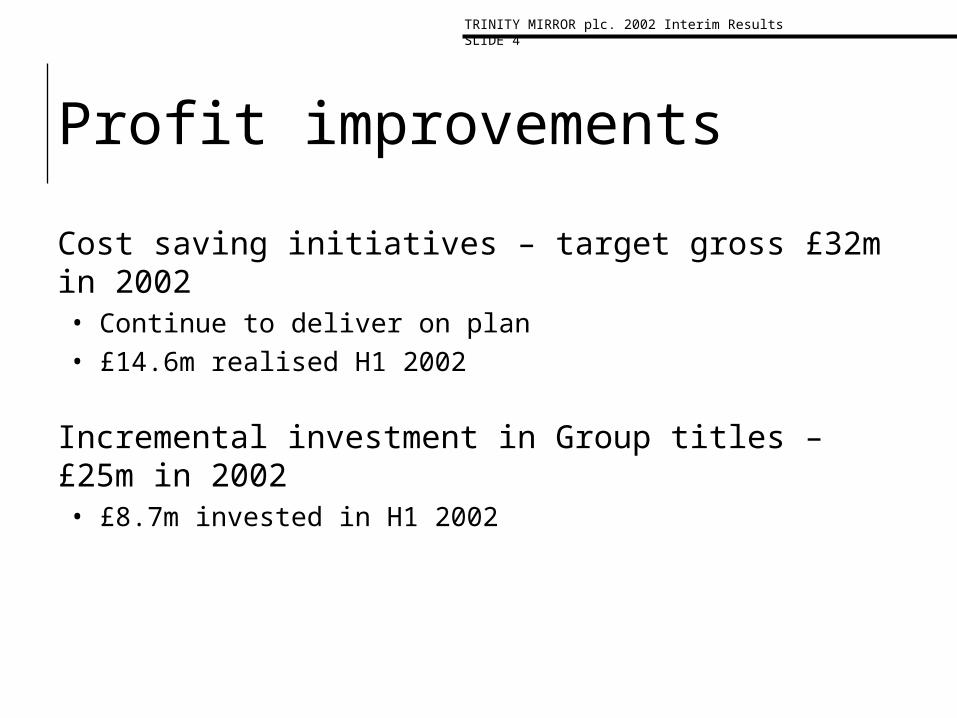
Profit improvements
Cost saving initiatives – target gross £32m in 2002• Continue to deliver on plan• £14.6m realised H1 2002
Incremental investment in Group titles – £25m in 2002• £8.7m invested in H1 2002
TRINITY MIRROR plc. 2002 Interim Results SLIDE 5
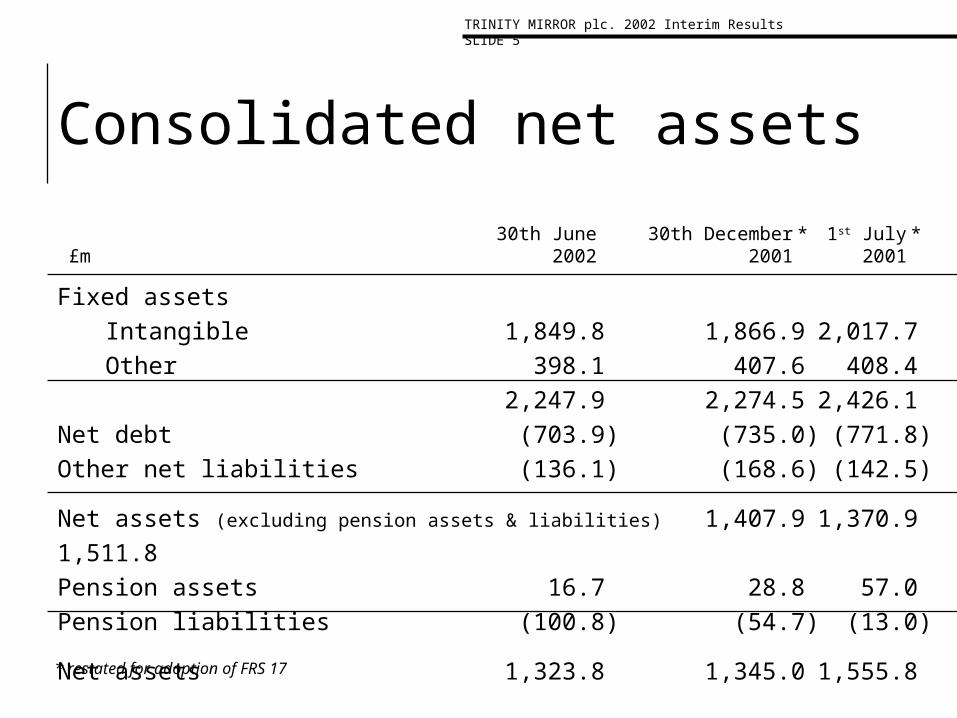
Consolidated net assets
Fixed assetsIntangible 1,849.8 1,866.9 2,017.7Other 398.1 407.6 408.4
2,247.9 2,274.5 2,426.1Net debt (703.9) (735.0) (771.8)Other net liabilities (136.1) (168.6) (142.5)
Net assets (excluding pension assets & liabilities)1,407.9 1,370.9 1,511.8Pension assets 16.7 28.8 57.0Pension liabilities (100.8) (54.7) (13.0)
Net assets 1,323.8 1,345.0 1,555.8
30th June 30th December * 1st July * £m 2002 2001 2001
* restated for adoption of FRS 17
TRINITY MIRROR plc. 2002 Interim Results SLIDE 6
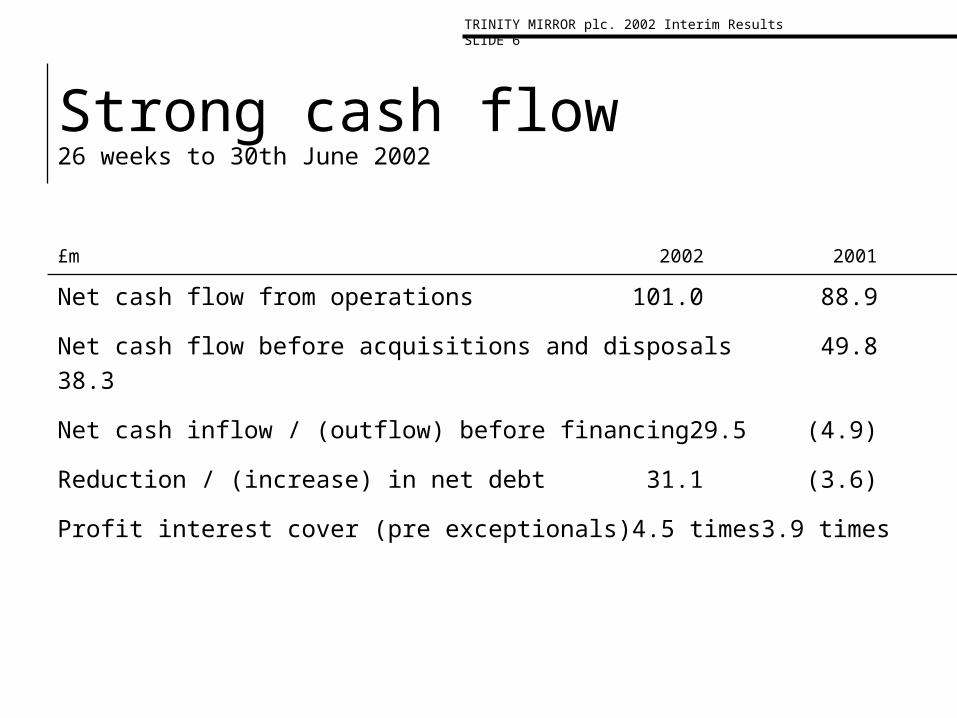
Strong cash flow26 weeks to 30th June 2002
Net cash flow from operations 101.0 88.9
Net cash flow before acquisitions and disposals 49.8 38.3
Net cash inflow / (outflow) before financing 29.5 (4.9)
Reduction / (increase) in net debt 31.1 (3.6)
Profit interest cover (pre exceptionals) 4.5 times 3.9 times
£m 2002 2001
operations reviewoperations review
TRINITY MIRROR plc.
Regional Newspapers
UK and Scottish National Newspapers
Sports Newspapers
TRINITY MIRROR plc. 2002 Interim Results SLIDE 8

Regional Newspapers
UK and Scottish National Newspapers
Sports Newspapers
Regional Newspapers
TRINITY MIRROR plc. 2002 Interim Results SLIDE 9
NationalNewspapers£26.7m
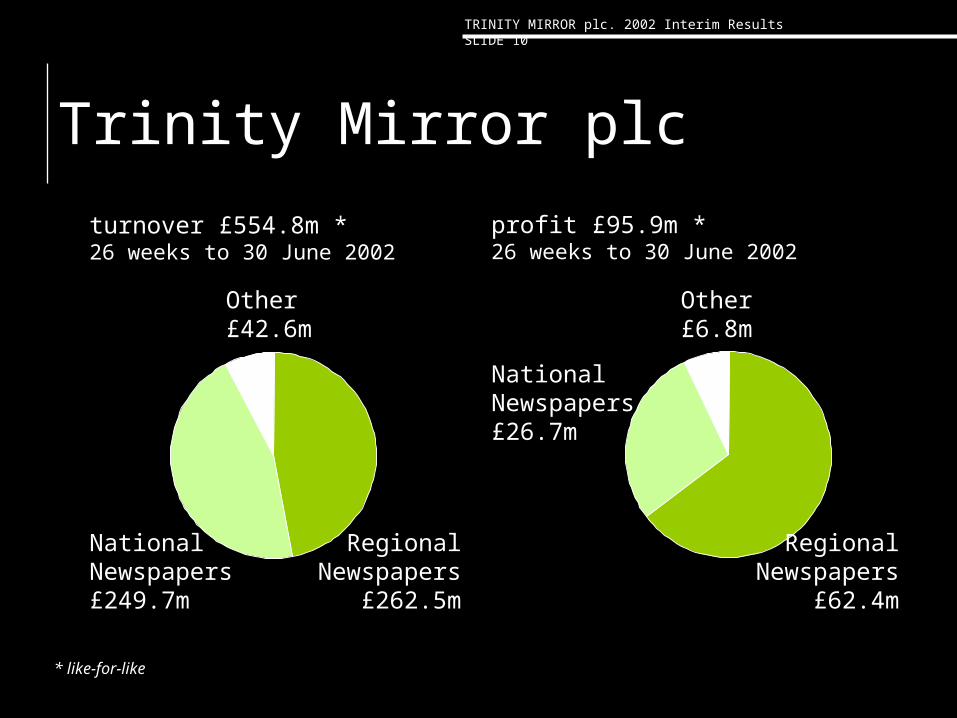
Trinity Mirror plc
TRINITY MIRROR plc. 2002 Interim Results SLIDE 10
turnover £554.8m *26 weeks to 30 June 2002
Other£42.6m
NationalNewspapers£249.7m
RegionalNewspapers
£262.5m
profit £95.9m *26 weeks to 30 June 2002
Other£6.8m
RegionalNewspapers
£62.4m
* like-for-like

TRINITY MIRROR plc. 2002 Interim Results SLIDE 11
Biggest regional newspaper business in UK•240 titles
•13 operating companies
•4 regions in development
TRINITY MIRROR plc. 2002 Interim Results SLIDE 11

Strategic directionfour cornerstones of the regional strategy
Striving forexcellence
Driving performance
Leveraging the benefits of scale
Maintaining ambition for growth
TRINITY MIRROR plc. 2002 Interim Results SLIDE 12

TRINITY MIRROR plc. 2002 Interim Results SLIDE 13
“Biggest to Best” projects completedPerformance management system
Standardised advertising classification
Design of more efficient editorial, pre-press and advertising functions
Development of plans to regionalise in the North West and North East

TRINITY MIRROR plc. 2002 Interim Results SLIDE 14
“Biggest to Best” investments
£1m relaunch of the Birmingham Evening Mail
£1m in brand and readership research
£3.3m in central support and one-off costs
£90m investment in new presses approvedand underway
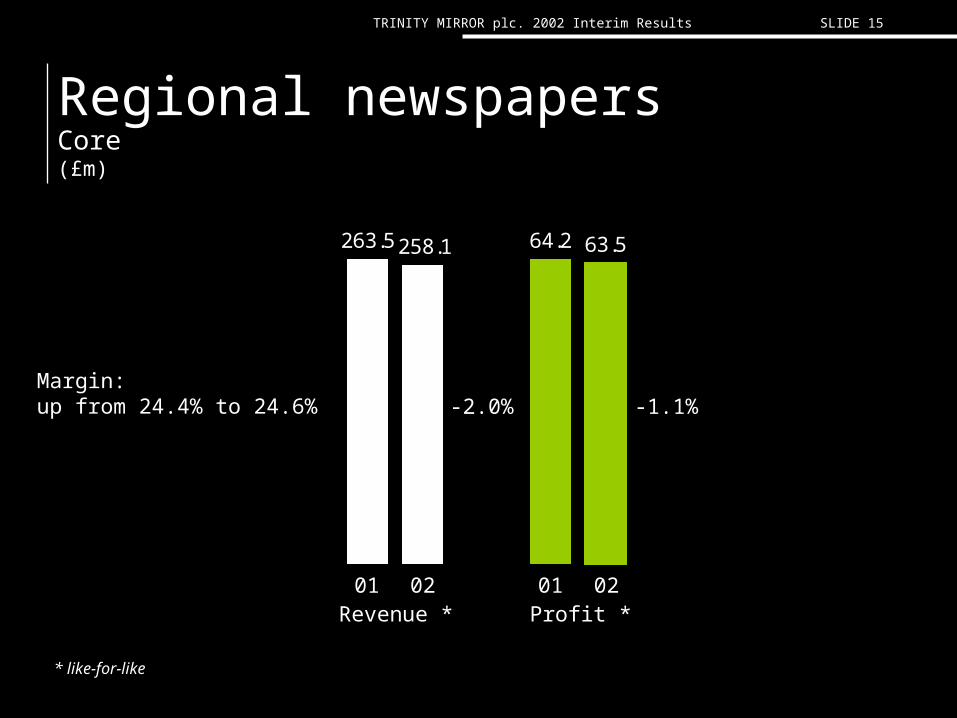
Regional newspapersCore(£m)
TRINITY MIRROR plc. 2002 Interim Results SLIDE 15
Margin: up from 24.4% to 24.6%
263.5 64.2 63.5258.1
01 02Revenue *
-1.1%-2.0%
01 02Profit *
* like-for-like

TRINITY MIRROR plc. 2002 Interim Results SLIDE 16
Regional division summary
“Biggest to best” change well underway
Active cost management
Strong performance outside London and South East and the Midlands
Investing for future
Regional Newspapers
UK National Newspapers
Sports Newspapers
UK National Newspapers
TRINITY MIRROR plc. 2002 Interim Results SLIDE 17

Mirror integratedmarketing strategy
TRINITY MIRROR plc. 2002 Interim Results SLIDE 18
change masthead
‘think again’ branding campaign
extended coverprice
reduction
targeted promotions
new sections
new columnists
productproduct
promotionpromotion
brandbrandpricingpricing
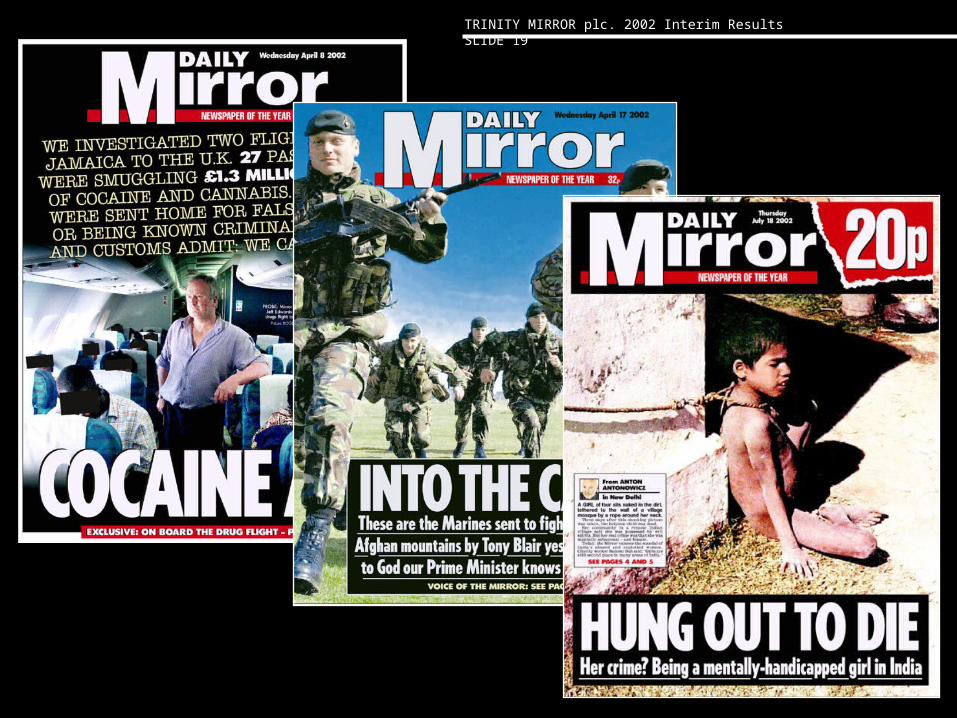
TRINITY MIRROR plc. 2002 Interim Results SLIDE 19
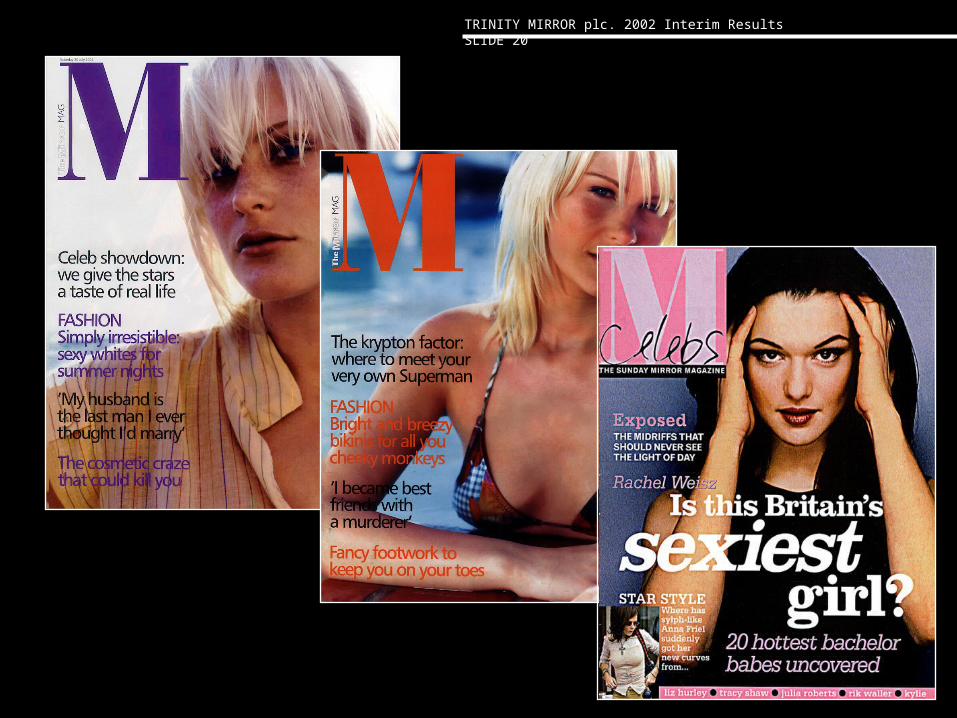
TRINITY MIRROR plc. 2002 Interim Results SLIDE 20
The Mirror's rebirth from trivial red-top to serious newspaper following the events of September 11 must go down as one of the most successful rebrands of recent times. The paper has since swept the board at press award ceremonies and seized the initiative from the previously rampant Sun
Marketing Magazine25th July 2002
TRINITY MIRROR plc. 2002 Interim Results SLIDE 21
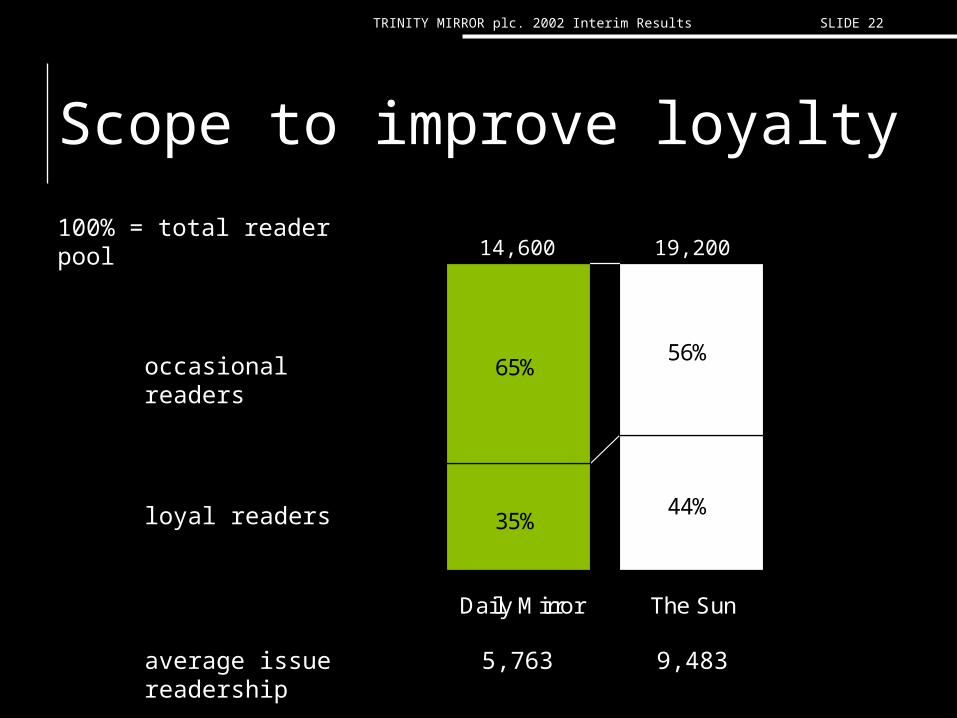
Scope to improve loyalty
100% = total reader pool
44%
65%56%
35%
Daily Mirror The Sun
occasional readers
loyal readers
14,600 19,200
average issue readership
5,763 9,483
TRINITY MIRROR plc. 2002 Interim Results SLIDE 22
0
5
10
15
20
25
30
35
40
45
50
Dec89
Feb99
Mar99
J un99
Sep99
Oct99
Nov99
J an00
Feb99
Mar00
Apr00
May00
J un00
Aug00
Sep00
Oct00
J an01
Mar01
Apr01
May01
J ul01
Aug01
Sep01
Nov01
Dec01
Feb02
Mar02
Apr02
J un02
J ul02
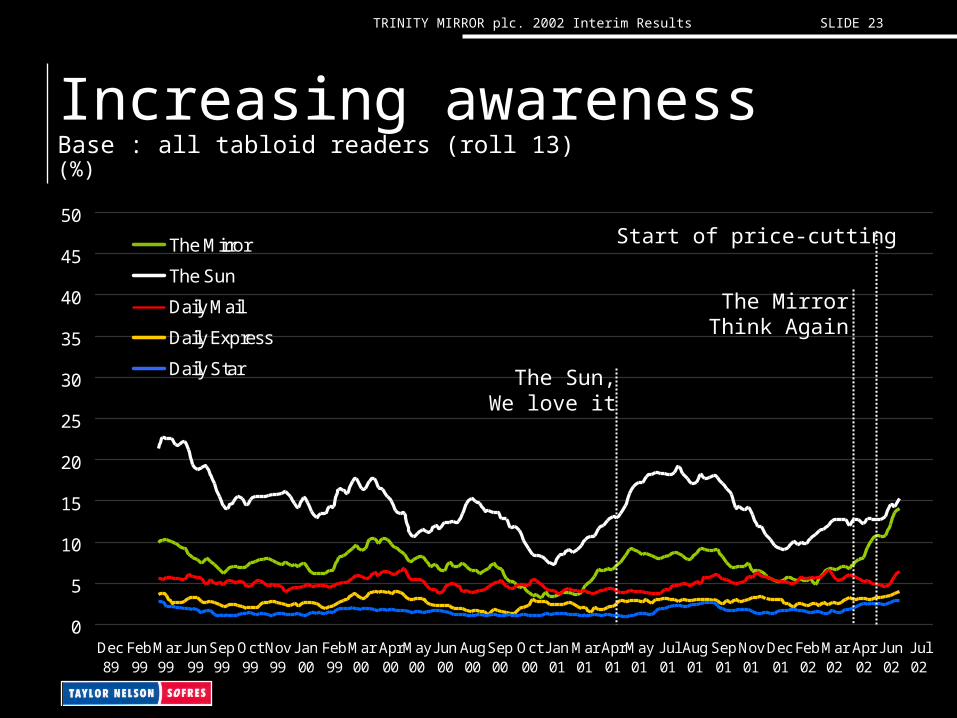
The Mirror
The Sun
Daily Mail
Daily Express
Daily Star
Increasing awarenessBase : all tabloid readers (roll 13)(%)
TRINITY MIRROR plc. 2002 Interim Results SLIDE 23
The Sun,We love it
The MirrorThink Again
Start of price-cutting

Brand becoming clearerBase : all tabloid / mid-market readers
TRINITY MIRROR plc. 2002 Interim Results SLIDE 24
Pre
Post (April-June)
Has a strong personality
Tells me what’s really going on
A trendsetter
A serious newspaper
Reminds you that things in life aren’t so bad
Has a good sense of what’s right and wrong
Makes you feel part of what’s going on
Helps you understand how news affects you
Is thought provoking
Clever
Responsible
Firm
Thorough
A bit simple
Childish
Image
Needs
Personality
5
5
5
4
6
5
4
4
4
5
5
5
5
- 5
- 7
Difference
23
2512
14
16
14
15
17
18
18
16
8
13
17
20
12
16
20
17
19
21
19
19
21
22
23
22
18
22
25

UK national newspapers(£m)
Margin: down from 15.6% to 9.3%
205.4 32.1
18.1*
195.0
01 02
-43.6%-5.1%
01 02
* includes £6.5m incremental investment
TRINITY MIRROR plc. 2002 Interim Results SLIDE 25
Revenue Profit

Regional Newspapers
Scottish National Newspapers
Sports Newspapers
Scottish National Newspapers
TRINITY MIRROR plc. 2002 Interim Results SLIDE 26

TRINITY MIRROR plc. 2002 Interim Results SLIDE 27
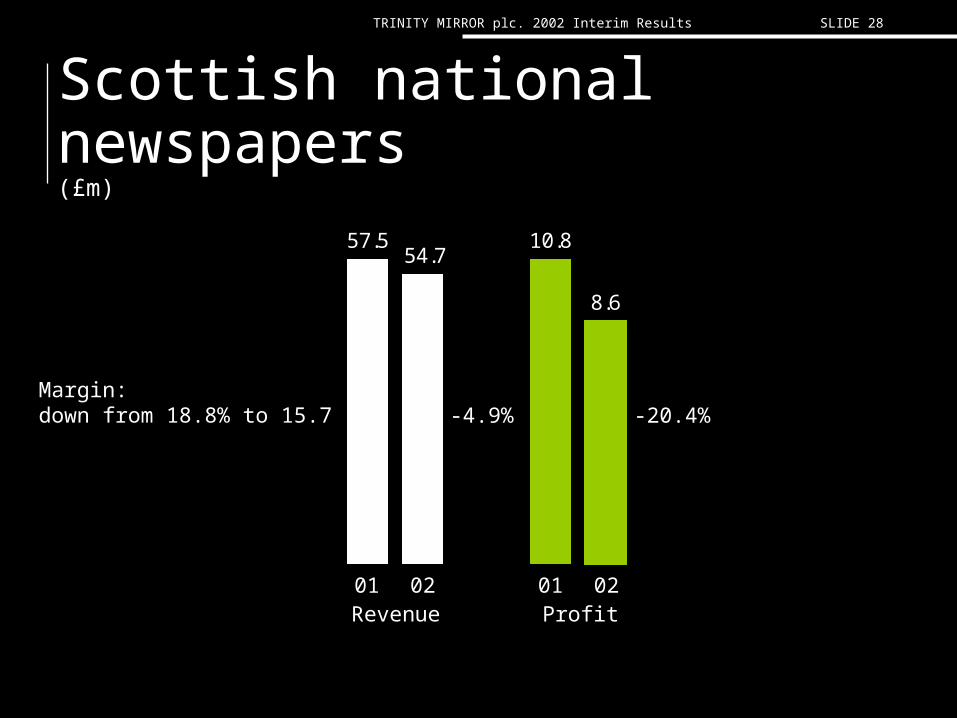
Scottish national newspapers(£m)
Margin: down from 18.8% to 15.7%
TRINITY MIRROR plc. 2002 Interim Results SLIDE 28
57.5 10.8
8.6
54.7
01 02
-20.4%-4.9%
01 02Revenue Profit
Regional Newspapers
UK and Scottish National Newspapers
Sports Newspapers Sports Newspapers
TRINITY MIRROR plc. 2002 Interim Results SLIDE 29

TRINITY MIRROR plc. 2002 Interim Results SLIDE 30
Sports business
TRINITY MIRROR plc. 2002 Interim Results SLIDE 30
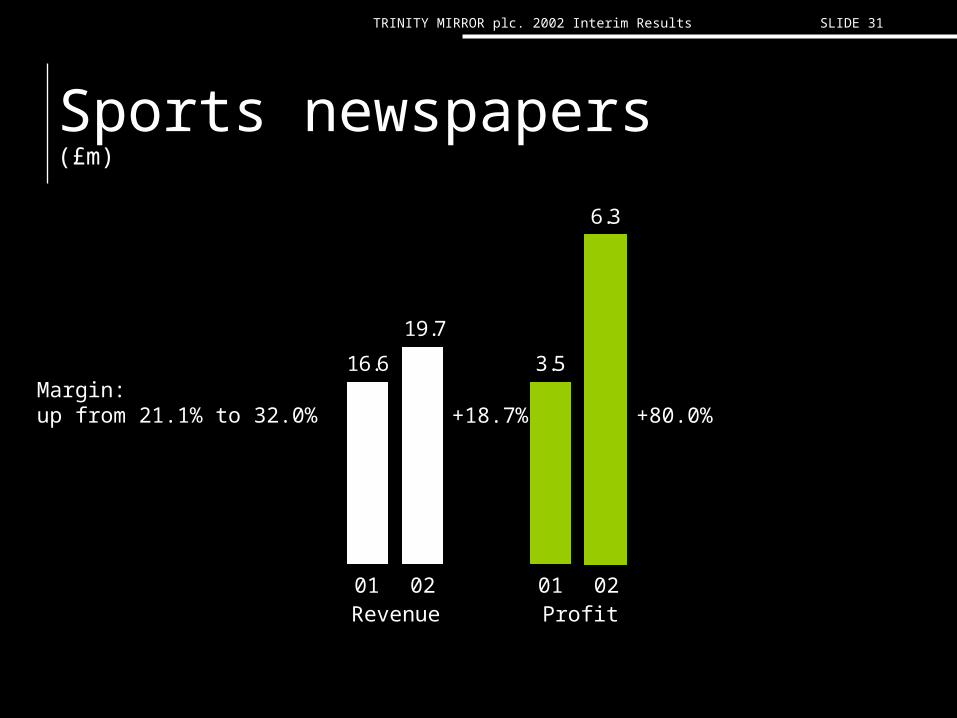
Sports newspapers(£m)
Margin: up from 21.1% to 32.0%
TRINITY MIRROR plc. 2002 Interim Results SLIDE 31
16.6 3.5
6.3
19.7
01 02
+80.0%+18.7%
01 02Revenue Profit

TRINITY MIRROR plc. 2002 Interim Results SLIDE 32
Summary
Excellent start on “From Biggest to Best”
Good cost control throughout
UK and Scottish Nationals strategies underway
Investing in businesses for long term

TRINITY MIRROR plc. 2002 Interim Results SLIDE 33
Outlook
Advertising environment remains uncertain
National advertising continues June trend
Regional advertising mixed

2002interim results
TRINITY MIRROR plc.
2002interim resultsappendicesfinancial performance interim 2002
TRINITY MIRROR plc.
TRINITY MIRROR plc. 2002 Interim Results SLIDE 36
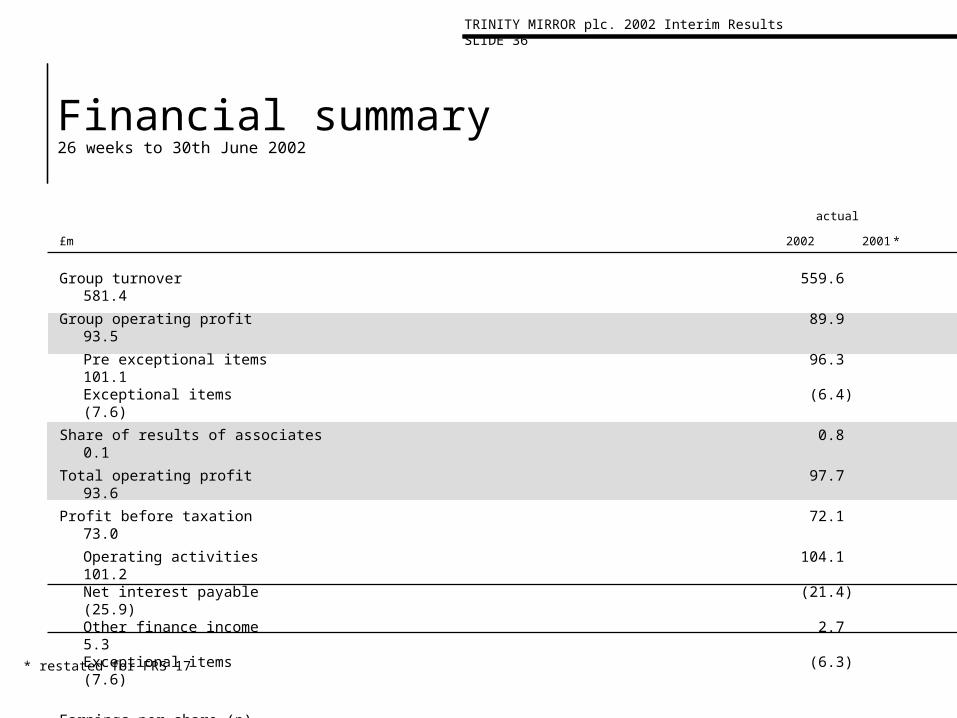
Financial summary26 weeks to 30th June 2002
Group turnover 559.6581.4
Group operating profit 89.993.5
Pre exceptional items 96.3101.1Exceptional items (6.4)(7.6)
Share of results of associates 0.80.1
Total operating profit 97.793.6
Profit before taxation 72.173.0
Operating activities 104.1101.2Net interest payable (21.4)(25.9)Other finance income 2.75.3Exceptional items (6.3)(7.6)
Earnings per share (p)
Before digital media investment 19.5p23.0p
Digital media activities (1.1)p(3.6)p
Underlying EPS 18.4p19.4p
Exceptional items (1.5)p(1.8)p
Basic earnings per share 16.9p17.6p
£m 2002 2001 *
actual
* restated for FRS 17
TRINITY MIRROR plc. 2002 Interim Results SLIDE 37
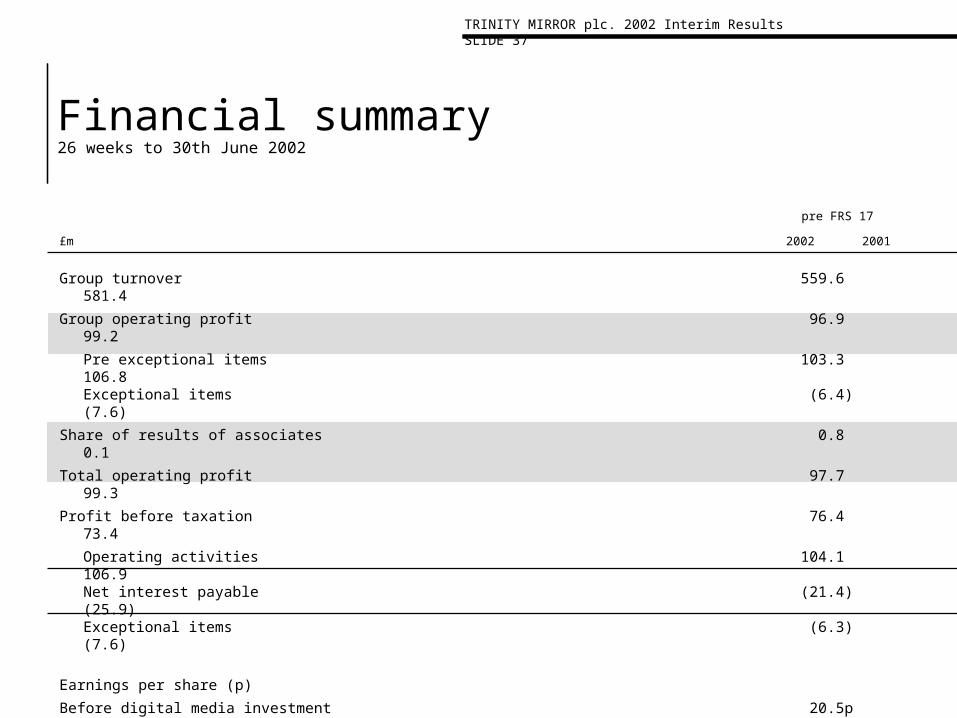
Financial summary26 weeks to 30th June 2002
Group turnover 559.6581.4
Group operating profit 96.999.2
Pre exceptional items 103.3106.8Exceptional items (6.4)(7.6)
Share of results of associates 0.80.1
Total operating profit 97.799.3
Profit before taxation 76.473.4
Operating activities 104.1106.9Net interest payable (21.4)(25.9)Exceptional items (6.3)(7.6)
Earnings per share (p)
Before digital media investment 20.5p23.1p
Digital media activities (1.1)p(3.6)p
Underlying EPS 19.4p19.5p
Exceptional items (1.5)p(1.8)p
Basic earnings per share 17.9p17.7p
£m 2002 2001
pre FRS 17
TRINITY MIRROR plc. 2002 Interim Results SLIDE 38
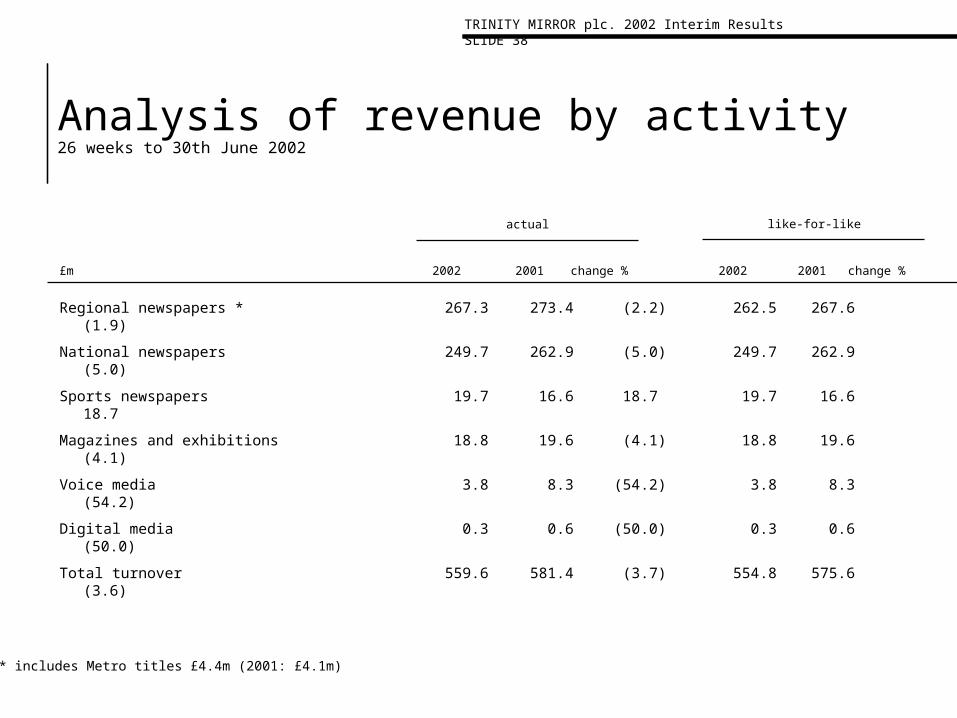
Analysis of revenue by activity26 weeks to 30th June 2002
* includes Metro titles £4.4m (2001: £4.1m)
Regional newspapers * 267.3 273.4 (2.2) 262.5 267.6(1.9)
National newspapers 249.7 262.9 (5.0) 249.7 262.9(5.0)
Sports newspapers 19.7 16.6 18.7 19.7 16.618.7
Magazines and exhibitions 18.8 19.6 (4.1) 18.8 19.6(4.1)
Voice media 3.8 8.3 (54.2) 3.8 8.3(54.2)
Digital media 0.3 0.6 (50.0) 0.3 0.6(50.0)
Total turnover 559.6 581.4 (3.7) 554.8 575.6(3.6)
£m 2002 2001 change % 2002 2001 change %
like-for-likeactual
TRINITY MIRROR plc. 2002 Interim Results SLIDE 39
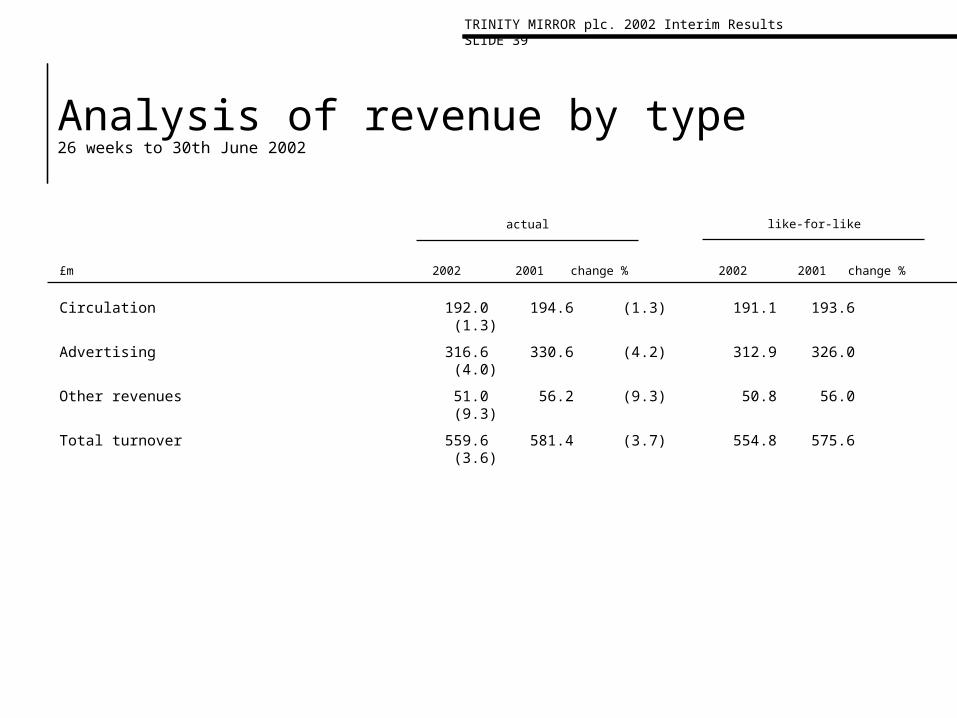
Analysis of revenue by type26 weeks to 30th June 2002
Circulation 192.0 194.6 (1.3) 191.1 193.6(1.3)
Advertising 316.6 330.6 (4.2) 312.9 326.0(4.0)
Other revenues 51.0 56.2 (9.3) 50.8 56.0(9.3)
Total turnover 559.6 581.4 (3.7) 554.8 575.6(3.6)
£m 2002 2001 change % 2002 2001 change %
actual like-for-like

TRINITY MIRROR plc. 2002 Interim Results SLIDE 40
Analysis of revenue by activity and type 26 weeks to 30th June 2002
Circulation 41.2 106.9 27.7 13.0 2.3 - - 191.1 34.4
Advertising 202.9 72.0 25.1 5.4 7.5 - - 312.9 56.4
Other 18.4 16.1 1.9 1.3 9.0 3.8 0.3 50.8 9.2
Total turnover 262.5 195.0 54.7 19.7 18.8 3.8 0.3 554.8
% of total 47.3% 35.1% 9.9% 3.6% 3.4% 0.7%
Nationals
Voice Digital %£m Regionals UK Scotland Sports Mags Media Media total of total
like-for-like
TRINITY MIRROR plc. 2002 Interim Results SLIDE 41
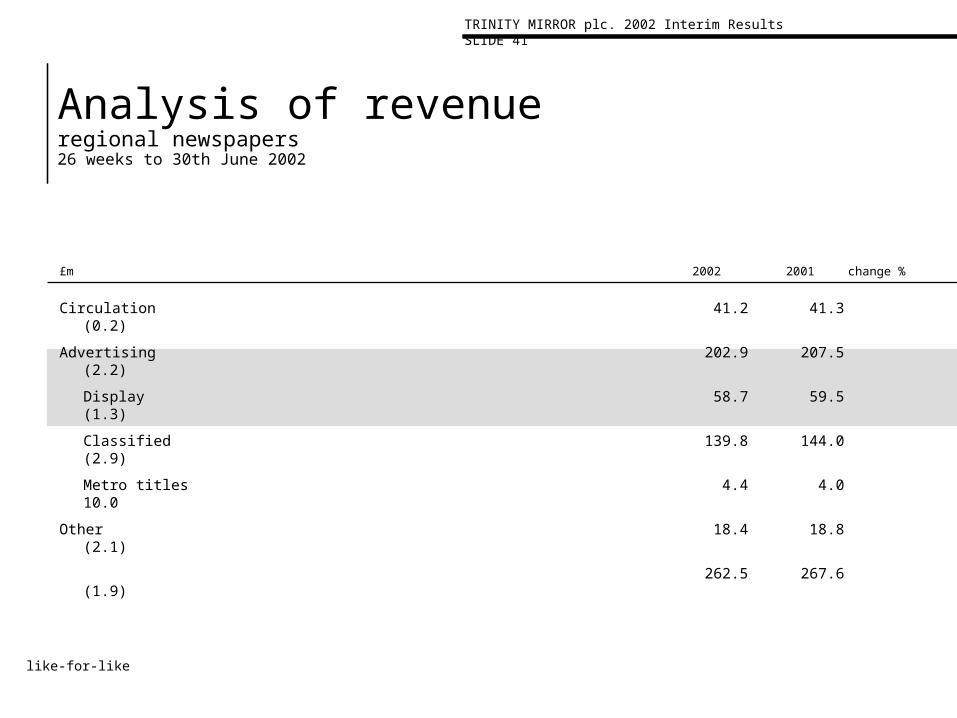
Analysis of revenueregional newspapers26 weeks to 30th June 2002
Circulation 41.2 41.3(0.2)
Advertising 202.9 207.5(2.2)
Display 58.7 59.5(1.3)
Classified 139.8 144.0(2.9)
Metro titles 4.4 4.010.0
Other 18.4 18.8(2.1)
262.5 267.6(1.9)
£m 2002 2001 change %
like-for-like
TRINITY MIRROR plc. 2002 Interim Results SLIDE 42
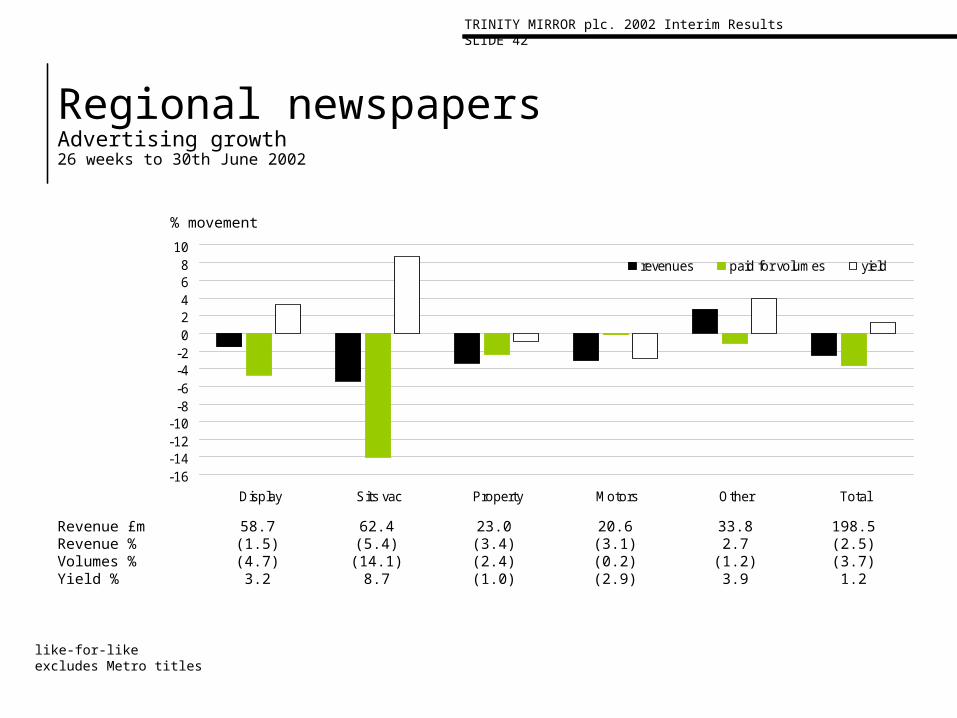
Regional newspapersAdvertising growth26 weeks to 30th June 2002
-16-14-12-10-8-6-4-202468
10
Display Sits vac Property Motors Other Total
revenues paid for volumes yield
Revenue £m 58.7 62.4 23.0 20.6 33.8 198.5Revenue % (1.5) (5.4) (3.4) (3.1) 2.7 (2.5)Volumes % (4.7) (14.1) (2.4) (0.2) (1.2) (3.7)Yield % 3.2 8.7 (1.0) (2.9) 3.9 1.2
like-for-likeexcludes Metro titles
% movement
TRINITY MIRROR plc. 2002 Interim Results SLIDE 43
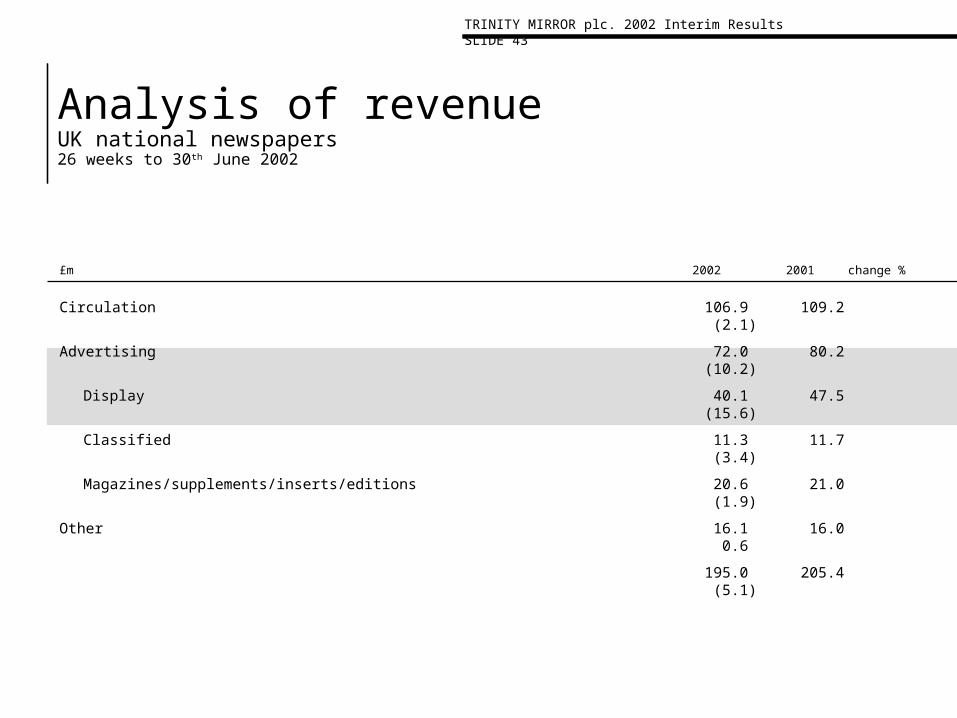
Analysis of revenueUK national newspapers26 weeks to 30th June 2002
£m 2002 2001 change %
Circulation 106.9 109.2(2.1)
Advertising 72.0 80.2(10.2)
Display 40.1 47.5(15.6)
Classified 11.3 11.7(3.4)
Magazines/supplements/inserts/editions 20.6 21.0(1.9)
Other 16.1 16.00.6
195.0 205.4(5.1)
TRINITY MIRROR plc. 2002 Interim Results SLIDE 44
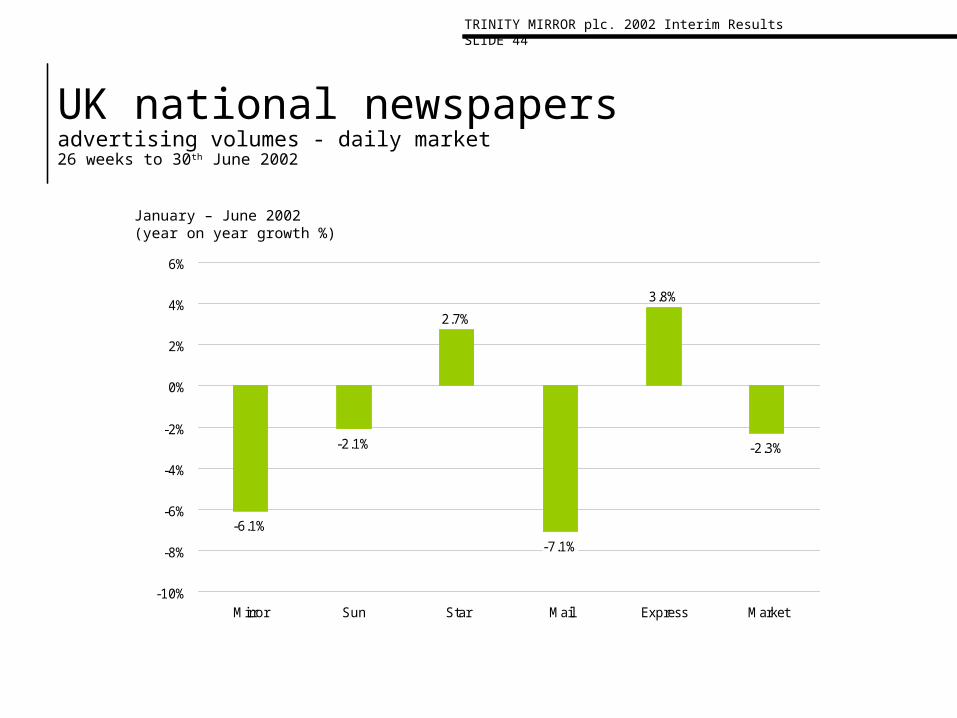
UK national newspapersadvertising volumes - daily market26 weeks to 30th June 2002
-6.1%
-2.1%
2.7%
-7.1%
3.8%
-2.3%
-10%
-8%
-6%
-4%
-2%
0%
2%
4%
6%
Mirror Sun Star Mail Express Market
January – June 2002(year on year growth %)
TRINITY MIRROR plc. 2002 Interim Results SLIDE 45
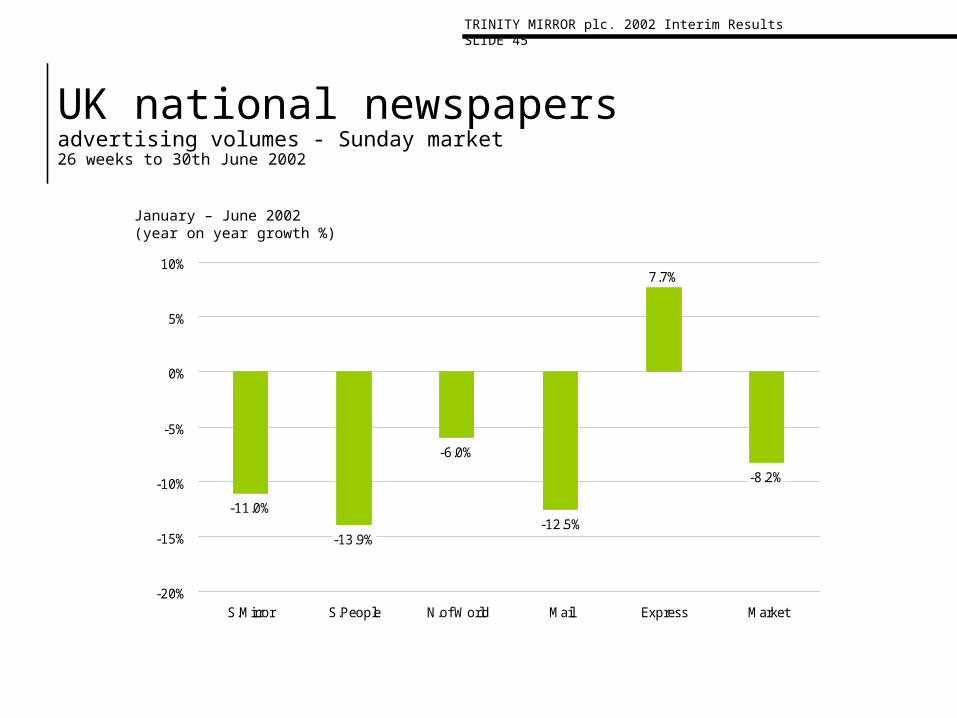
UK national newspapersadvertising volumes - Sunday market26 weeks to 30th June 2002
January – June 2002(year on year growth %)
-11.0%
-13.9%
-6.0%
7.7%
-8.2%
-12.5%
-20%
-15%
-10%
-5%
0%
5%
10%
S.Mirror S.People N.of World Mail Express Market
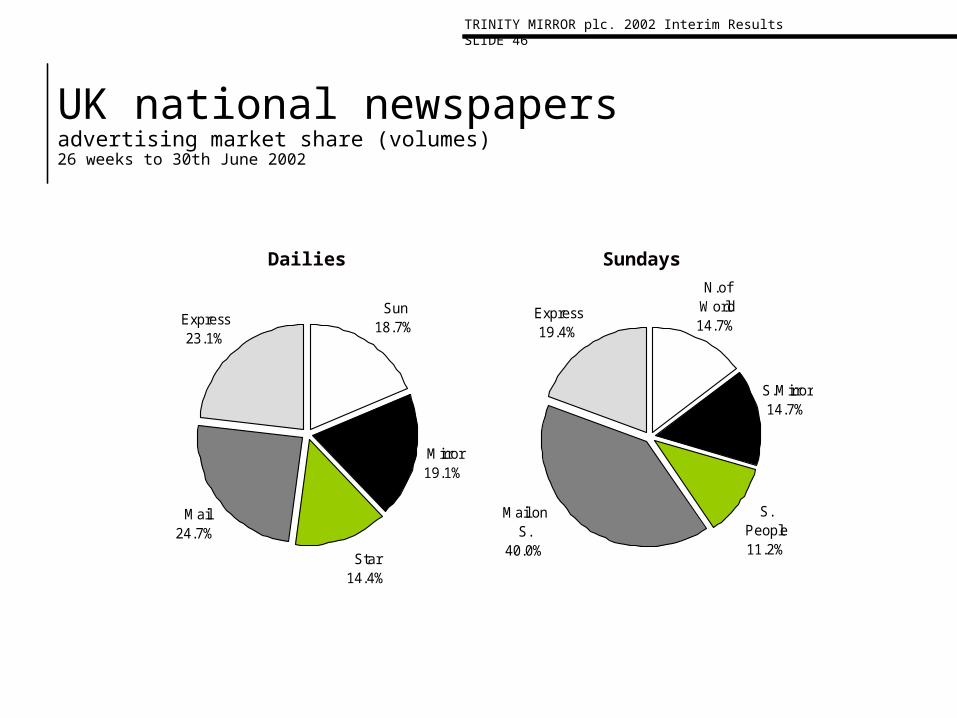
TRINITY MIRROR plc. 2002 Interim Results SLIDE 46
Dailies
Express19.4%
Mail on S.
40.0%
N.of World14.7%
S. People11.2%
S.Mirror14.7%
UK national newspapersadvertising market share (volumes)26 weeks to 30th June 2002
Sun18.7%
Mail24.7%
Express23.1%
Star14.4%
Mirror19.1%
Sundays

TRINITY MIRROR plc. 2002 Interim Results SLIDE 47
UK national newspapersdisplay advertising revenues26 weeks to 30th June 2002
-2.2%
10.3%
-33.4%-36.2%
-6.9%
-22.7%
-15.4%
-48.3%
-19.3%
-3.3%
-15.8%
-55%
-50%
-45%
-40%
-35%
-30%
-25%
-20%
-15%
-10%
-5%
0%
5%
10%
15%
Retail Motors Finance Travel Ent &Media
Mail Order fmcg Computers Telecoms Other Total
Revenue £m 14.5 4.9 3.0 1.8 3.3 2.0 1.5 2.3 2.7 4.1 40.1
(year on year growth %)

TRINITY MIRROR plc. 2002 Interim Results SLIDE 48
Analysis of revenuesScottish national newspapers26 weeks to 30th June 2002
£m 2002 2001 change %
Circulation 27.7 29.6(6.4)
Advertising 25.1 25.8(2.3)
Other 1.9 2.1(9.5)
54.7 57.5(4.9)
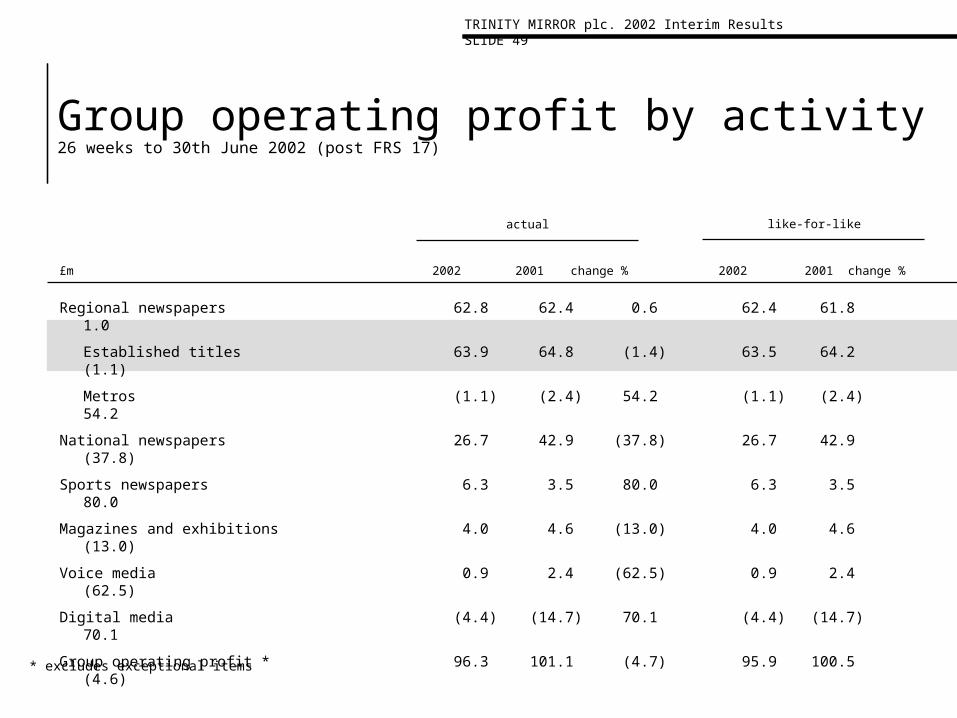
TRINITY MIRROR plc. 2002 Interim Results SLIDE 49
Group operating profit by activity26 weeks to 30th June 2002 (post FRS 17)
Regional newspapers 62.8 62.4 0.6 62.4 61.81.0
Established titles 63.9 64.8 (1.4) 63.5 64.2(1.1)
Metros (1.1) (2.4) 54.2 (1.1) (2.4)54.2
National newspapers 26.7 42.9 (37.8) 26.7 42.9(37.8)
Sports newspapers 6.3 3.5 80.0 6.3 3.580.0
Magazines and exhibitions 4.0 4.6 (13.0) 4.0 4.6(13.0)
Voice media 0.9 2.4 (62.5) 0.9 2.4(62.5)
Digital media (4.4) (14.7) 70.1 (4.4) (14.7)70.1
Group operating profit * 96.3 101.1 (4.7) 95.9 100.5(4.6)
£m 2002 2001 change % 2002 2001 change %
* excludes exceptional items
actual like-for-like
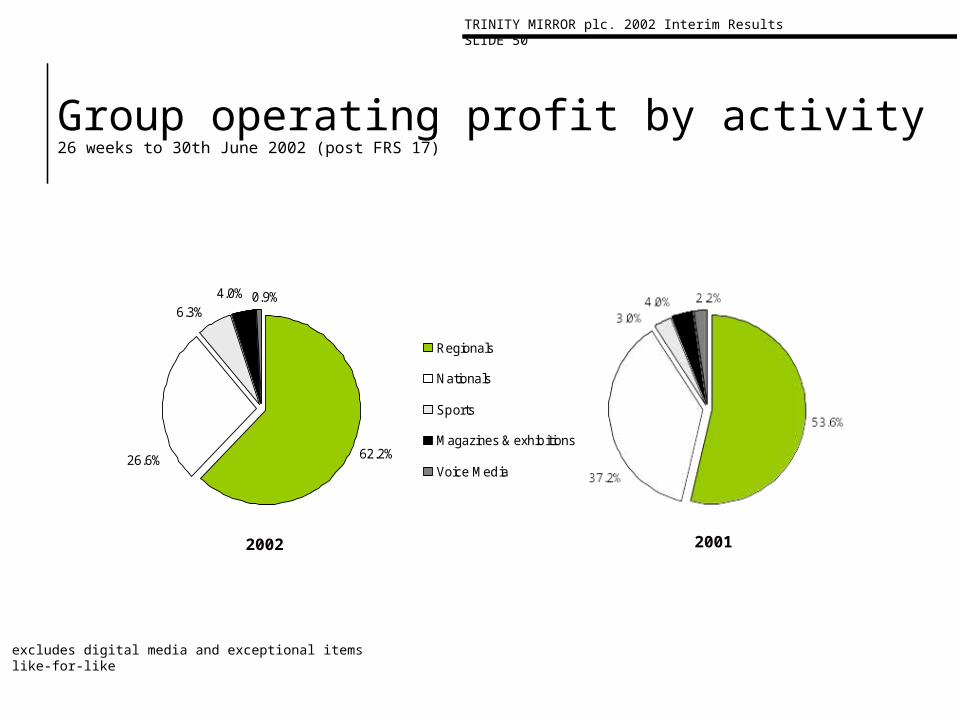
TRINITY MIRROR plc. 2002 Interim Results SLIDE 50
Group operating profit by activity26 weeks to 30th June 2002 (post FRS 17)
62.2%26.6%
0.9%4.0%6.3%
Regionals
Nationals
Sports
Magazines & exhibitions
Voice Media
2002 2001
excludes digital media and exceptional itemslike-for-like
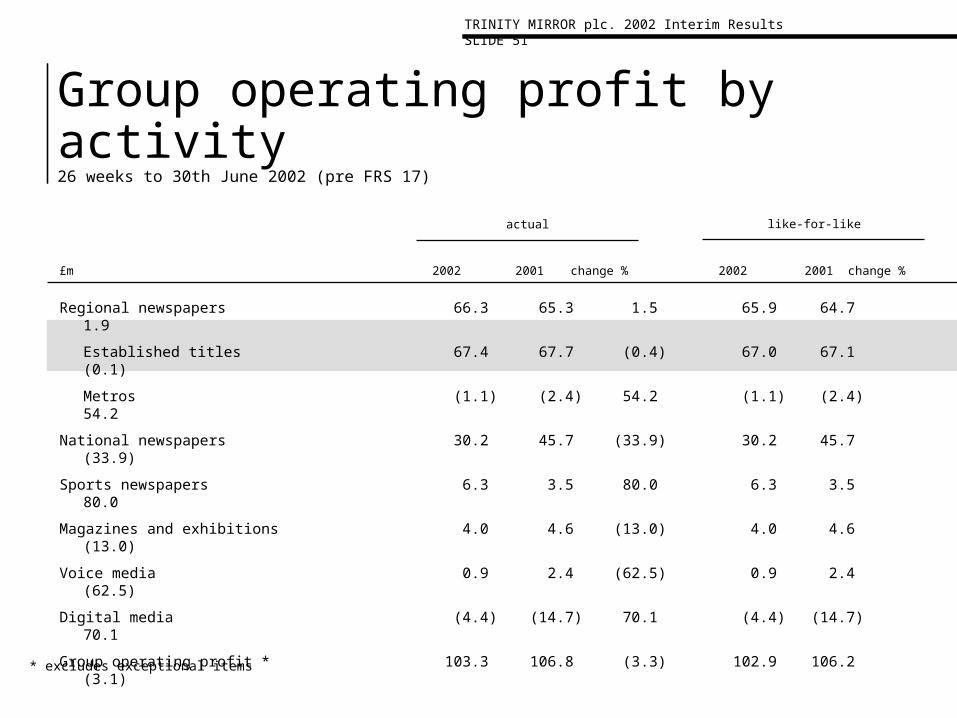
TRINITY MIRROR plc. 2002 Interim Results SLIDE 51
Group operating profit by activity26 weeks to 30th June 2002 (pre FRS 17)
Regional newspapers 66.3 65.3 1.5 65.9 64.71.9
Established titles 67.4 67.7 (0.4) 67.0 67.1(0.1)
Metros (1.1) (2.4) 54.2 (1.1) (2.4)54.2
National newspapers 30.2 45.7 (33.9) 30.2 45.7(33.9)
Sports newspapers 6.3 3.5 80.0 6.3 3.580.0
Magazines and exhibitions 4.0 4.6 (13.0) 4.0 4.6(13.0)
Voice media 0.9 2.4 (62.5) 0.9 2.4(62.5)
Digital media (4.4) (14.7) 70.1 (4.4) (14.7)70.1
Group operating profit * 103.3 106.8 (3.3) 102.9 106.2(3.1)
£m 2002 2001 change % 2002 2001 change %
* excludes exceptional items
actual like-for-like
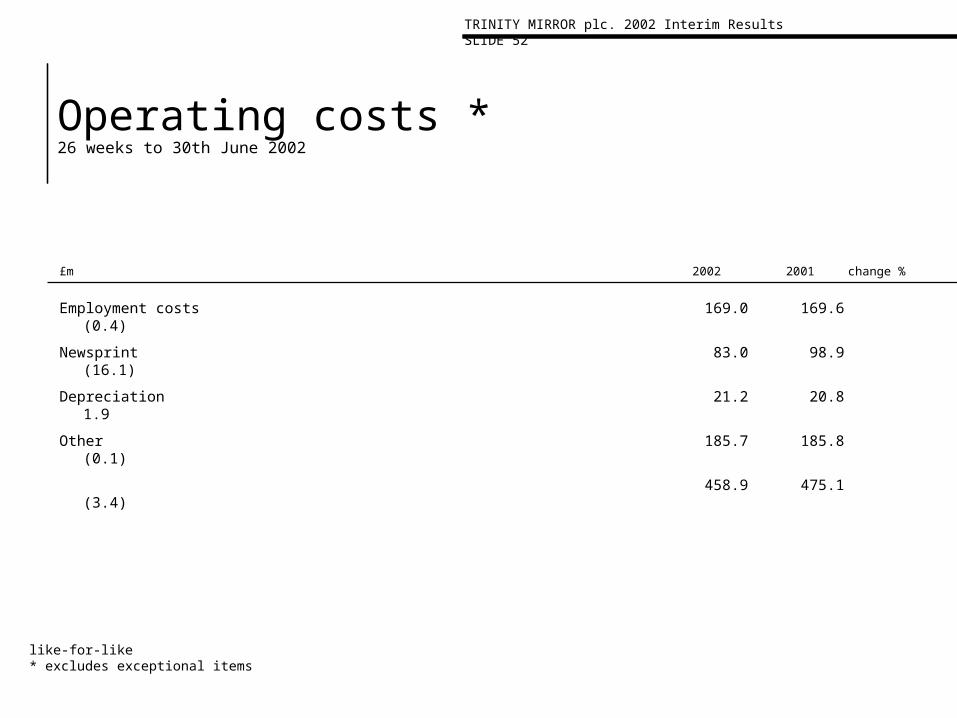
TRINITY MIRROR plc. 2002 Interim Results SLIDE 52
Operating costs *26 weeks to 30th June 2002
like-for-like* excludes exceptional items
£m 2002 2001 change %
Employment costs 169.0 169.6(0.4)
Newsprint 83.0 98.9(16.1)
Depreciation 21.2 20.81.9
Other 185.7 185.8(0.1)
458.9 475.1(3.4)