20 21 - cosl.com.cn
TRANSCRIPT
2021
Contents
China Oilfield Services Limited • Interim Report 2021 1
2 CHAIRMAN’S STATEMENT
4 MANAGEMENT DISCUSSION AND ANALYSIS
18 SUPPLEMENTARY INFORMATION
23 INDEPENDENT REVIEW REPORT
24 INTERIM CONDENSED CONSOLIDATED STATEMENT OF PROFIT OR LOSS
25 INTERIM CONDENSED CONSOLIDATED STATEMENT OF COMPREHENSIVE INCOME
26 INTERIM CONDENSED CONSOLIDATED STATEMENT OF FINANCIAL POSITION
28 INTERIM CONDENSED CONSOLIDATED STATEMENT OF CHANGES IN EQUITY
29 INTERIM CONDENSED CONSOLIDATED STATEMENT OF CASH FLOWS
30 NOTES TO INTERIM CONDENSED CONSOLIDATED FINANCIAL INFORMATION
64 COMPANY DIRECTORY
Introduction
China Oilfield Services Limited (the “Company”, the “Group” or “COSL”), listed on Hong Kong Stock Exchange (HK stock code: 2883) and Shanghai Stock Exchange (Shanghai stock code: 601808), is one of the leading integrated oilfield services providers in the world. Its services cover each phase of oil and gas exploration, development and production.
Financial Highlights
First Half of 2019 First Half of 2020 First Half of 2021RMB million RMB million RMB million
Revenue 13,552 14,497 12,723Profit from operations 1,601 2,222 1,355Profit from operations
(excluding impairment loss of property, plant and equipment and goodwill) 1,601 3,066 1,355
Profit for the period 986 1,723 809Profit for the period
(excluding impairment loss of property, plant and equipment and goodwill) 986 2,567 809
RMB/share RMB/share RMB/share
Earnings per share 0.20 0.36 0.17
2 China Oilfield Services Limited • Interim Report 2021
Chairman’s Statement
Dear Shareholders,
During the first half of 2021, the deep impact of the COVID-19 pandemic (hereinafter “Pandemic”) continued, the economic globalization faced a setback and the development faced a significant increase in new conflicts and challenges, and along with multiple adverse factors, such have caused unprecedented complications in the external development environment. Facing such severity in both safety and operational situations, the Company accurately seized the long-term positive trends in the domestic economy as well as leveraged on the opportunities arising from the slow recovery in the industry. By implementing measures on increasing revenue and efficiency, reducing costs, boosting efficiency, enhancing management effectiveness and others, the Company, together with all staff, made pragmatic progress and overcame difficulties. The Company achieved revenue of RMB12.72 billion and net profit of RMB0.81 billion during the first half of the year, with steady improvement in the overall production and operation.
1. Constantly improving risk management and control mechanism and promoting significant improvement in corporate governance
During the first half of the year, the Company strengthened the top-level design and systematically pushed forward the construction of a globalized management system. The Company also adhered to integrity and innovation, continued carrying out the system of “establishment, modification, abolition and interpretation”, enhanced system implementation, promoted modernization of governance capabilities in the corporate governance system, and reinforced restrictions on power allocation and operation at all levels in the Company. Moreover, constant improvement was made to the risk management and control mechanism with upwards and downwards interconnection and horizontal coordination, and focus was put on overseas compliance operations. The Company also carried out special risk investigation and response, timely adjusted and optimized key nodes in risk management and control as well as continued to enhance its ability to prevent and solve major risks.
2. Striving to promote core technology research and continuing releasing technology momentum
During the first half of the year, the Company persisted in technology independence and self-improvement and strived to promote core technology research, thus it earned fruitful technical achievements. The two technical achievements – the rotary steerable drilling and logging while drilling system, and the ultra-high temperature high-pressure wire line logging system were selected in the Recommended List for Scientific and Technological Innovation Achievements of Central Enterprises. Among which, the rotary steering technology had market applications at domestic onshore wells, with cumulative operations of over 600 wells and footage of 600,000 meters, and the success rate of one-off entry into the well increased to 90.3%; whereas the ultra-high temperature high-pressure wire line logging system continuously completed the ultra-high temperature high-voltage operations in customers’ multi-gas fields, setting the national record of highest pressure operation among similar instruments. The “two-wide and one-high” seismic acquisition and processing technology enabled discoveries of large-scale reserves; the deep-water HEM drilling fluids, full-liquid low-hydration heat cementing system enabled “Shen Hai Yi Hao” gas field to be successfully put into operation; the water-based drilling fluid BIODRILL A system in environmentally sensitive areas enabled Xinyoukuai project in significantly increasing ROP; the successful development of electric mechanical cutters applicable in various complex well conditions had successful operations in two sea areas; the successful implementation of overheated steaming technology in operating oilfields caused significant effect in oil increase; and the completion of offshore logging fracking operation in high quality, setting the national record of offshore single-layer fracking scale.

Chairman’s Statement (continued)
China Oilfield Services Limited • Interim Report 2021 3
3. Protecting and enhancing comprehensive competitiveness and exploring international operation management efficiency
In the first half of the year, the Company continued to enhance service guarantee abilities, focused on improving quality and efficiency, strengthened overseas operation support and overall coordination, strictly implemented the Pandemic prevention and control measures, and ensured smooth operations of overseas projects, thus gaining the recognition and trust from customers. The Company firmly grasped onto the opportunities arising from the slow recovery of oilfield service market, strengthened local business operations, adopted various methods such as online promotion, video communication and remote marking, actively communicated with customers, as well as steadily explored the overseas market. At present, the Company acquires two offshore jack-up drilling rigs projects and project for services such as offshore directional drilling, cementing, drilling & completion fluids in Southeast Asia; acquires new projects such as onshore drilling package service and cementing service in Middle East; acquires new projects such as onshore wireline logging and perforation, drilling & completion fluid, cementing and solids control services in Africa; newly launches offshore drilling rigs and ship logistics support integration service project and offshore 3D streamer seismic acquisition project in America; and acquires a new offshore drilling rigs service project in Europe.
Outlook
In the second half of 2021, the global economic recovery will remain sluggish, the oilfield service market will have limited improvement, and the impact of Pandemic will still be lingering. The Company will analyze the new situations and tasks, deepen its understanding on new opportunities and new challenges, precisely capture the new development phase at which it operates, comprehensively devise ideas for new development and set up new development goals. The Company will focus on new development strategies of “technology-driven”, “cost-saving”, “integration”, “internationalization” and “regional development”, continuously enhance technology R&D and application capabilities, strive to improve service quality, strengthen production and operational abilities, promote the implementation of “safe production responsibility system of all staff”, create integrated service competitive advantages as well as innovate business models. While safeguarding the national “Seven-Year Action Plan” of increasing reserves and production, the Company will proactively apply green development concepts, implement the mission goals of “peak carbon dioxide emissions and carbon neutrality”, and achieve transformation through business upgrade and technology innovations, thus starting off the Company’s new journey on high quality development.
Zhao ShunqiangChairman and Chief Executive Officer
25 August 2021
4 China Oilfield Services Limited • Interim Report 2021
Management Discussion and Analysis
INDUSTRY OVERVIEW
In the first half of 2021, with the positive momentum of global economy, oil demand gradually increased, and the international oil price fluctuated around an upward trend. Under the context of “peak carbon dioxide emissions and carbon neutrality”, the trend of international oil companies attempting to explore and transform into new energy companies is accelerating, and increased investment in new energy. The international oil companies continued to maintain cautious towards oil and gas exploration and development investment, and were especially cautious about risky exploration, frontier areas, and deep-water exploration and development. The saturation situation of oversupply in the oilfield service market was still existed, and some exploration and development projects have been delayed, postponed or even cancelled. The utilization rate of large-scale equipment is still at a low level, representing a significate difference when compared with the utilization rate before the Pandemic. In particular, the utilization rate of medium and low-end drilling rigs is still at a historically low level, and the price of oilfield services has not yet returned to the level before the Pandemic. From the perspective of operating performance, the overall global oilfield service industry continued to be in a downturn trend. Most heavy-asset oilfield service companies recorded poor profitability and their asset returns are at historically low levels. On the other hand, the domestic economy continued to improve in general. Driven by the national “Seven-Year Action Plan” for improving reserves and production, the domestic oilfield service market remained stable relatively.
BUSINESS REVIEW
In the first half of 2021, although the international oil prices rebounded, the investments in exploration and development of international oil companies were still lagging and remain cautions, the scale of oilfield service market had slow recovery. Due to the continued impact of the Pandemic across the world, the year-on-year operation volume and utilization rate of equipment have recorded a certain level of decline due to the delay in operations. Meanwhile, the overall domestic economy has maintained steady growth and driven by the implementation of CNOOC’s “Seven-Year Action Plan” and the promotion of safety strategy of national energy, the Company endeavored to overcome the adverse effects brought by the Pandemic and the decline in operation volume, to continue to optimize production and operation, strived to promotion cost reduction, quality improvement and efficiency improvement, actively practiced green low-carbon development strategy, with its technical system more improved and the operation and maintenance of its equipment constantly enhanced. In the first half of the year, the Company’s revenue was RMB12,723.0 million and net profit was RMB808.5 million.
Management Discussion and Analysis (continued)
China Oilfield Services Limited • Interim Report 2021 5
Drilling Services Segment
Revenue for the Company’s drilling services segment in the first half of the year was RMB4,347.8 million, a 29.5% decrease compared with RMB6,171.0 million for the same period of last year. An amount of US$188 million settlement income was received from Equinor Energy AS (hereinafter referred to as “Equinor”) during the same period of last year.
In the first half of 2021, due to the continuity of the Pandemic worldwide and delay in market orders, the overall operation volume of drilling rigs has declined. The Company continued to strengthen its refined management, strived to create leading cost advantages, constantly explored the standardization, modularization and serialization of management for large equipment as well as improved the industry chain. While continuing to explore the international market, the Company also fully safeguarded the efficient supply of equipment, technology and personnel for the national “Seven-Year Action Plan”. “HYSY936” continued to provide effective services to customers from the Americas; “China Merchants Hailong 7” commenced the first well drilling operation for new customers in North America; the drilling operation in North America undertaken by “COSLHunter” were successfully completed; “COSLConfidence” successfully passed the contract start-up inspection by American customers; “COSLBoss” accomplished the drilling operation project in Southeast Asia; “China Merchants Hailong 6” successfully completed the first oil testing operation in Southeast Asia; “COSLGift” passed the annual operation safety audit of Middle East customers with high scores and received high praise; “COSLStrike” successfully completed the handling of downhole complex situation and received written praise from Middle East customers; “COSL1” modular drilling rig completed the pre-launch inspection for the new operation project in the Americas; “COSL3” received written praise for efficient operations from customers in the Americas; self-developed “One Drilling Pipe Processing Work Station” and others received the invention patent authorization from China National Intellectual Property Administration.
As of 30 June 2021, the Company operated and managed a total of 56 drilling rigs, including 43 jack-up drilling rigs and 13 semi-submersible drilling rigs. Of these, 28 were operating in the China sea and 7 in overseas such as North America and Southeast Asia, while 19 were on standby and 2 were under repair in shipyards. During the first half of the year, operating days for the Company’s drilling rigs amounted to 6,578 days, representing a decrease of 1,084 days or 14.1% compared with the same period of last year. The calendar day utilisation rate of drilling rigs was 65.3%, representing a decrease of 10.9 percentage points compared with the same period of last year, due to the decrease in operation volume.
6 China Oilfield Services Limited • Interim Report 2021
Management Discussion and Analysis (continued)
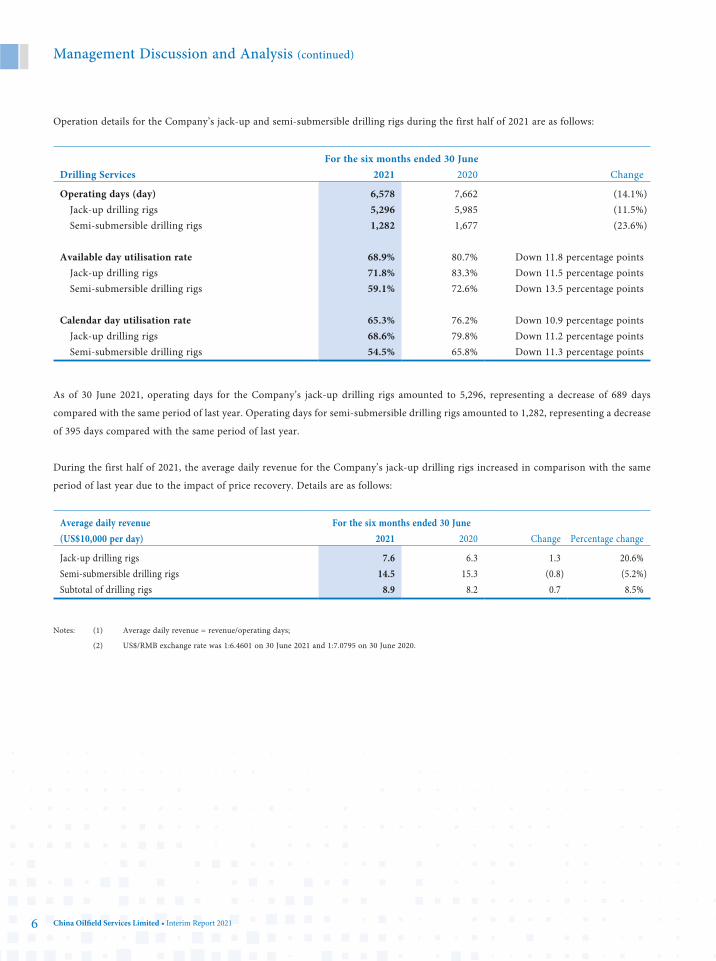
Operation details for the Company’s jack-up and semi-submersible drilling rigs during the first half of 2021 are as follows:
For the six months ended 30 JuneDrilling Services 2021 2020 Change
Operating days (day) 6,578 7,662 (14.1%)Jack-up drilling rigs 5,296 5,985 (11.5%)Semi-submersible drilling rigs 1,282 1,677 (23.6%)
Available day utilisation rate 68.9% 80.7% Down 11.8 percentage pointsJack-up drilling rigs 71.8% 83.3% Down 11.5 percentage pointsSemi-submersible drilling rigs 59.1% 72.6% Down 13.5 percentage points
Calendar day utilisation rate 65.3% 76.2% Down 10.9 percentage pointsJack-up drilling rigs 68.6% 79.8% Down 11.2 percentage pointsSemi-submersible drilling rigs 54.5% 65.8% Down 11.3 percentage points
As of 30 June 2021, operating days for the Company’s jack-up drilling rigs amounted to 5,296, representing a decrease of 689 days
compared with the same period of last year. Operating days for semi-submersible drilling rigs amounted to 1,282, representing a decrease
of 395 days compared with the same period of last year.
During the first half of 2021, the average daily revenue for the Company’s jack-up drilling rigs increased in comparison with the same
period of last year due to the impact of price recovery. Details are as follows:
Average daily revenue (US$10,000 per day)
For the six months ended 30 JuneChange Percentage change2021 2020
Jack-up drilling rigs 7.6 6.3 1.3 20.6%Semi-submersible drilling rigs 14.5 15.3 (0.8) (5.2%)Subtotal of drilling rigs 8.9 8.2 0.7 8.5%
Notes: (1) Average daily revenue = revenue/operating days;
(2) US$/RMB exchange rate was 1:6.4601 on 30 June 2021 and 1:7.0795 on 30 June 2020.
Management Discussion and Analysis (continued)
China Oilfield Services Limited • Interim Report 2021 7
Well Services Segment
The first half of the year saw various degree of changes in the operation volume of main lines in the Company’s well services segment, and its overall revenue was RMB6,020.0 million, which was basically equal to RMB6,050.4 million for the same period of last year.
In the first half of 2021, the Company promoted key core technology research, enhanced the capability of transforming scientific research result, persisted in the path of international development, bravely took on the task of being a pioneer in technological development, and provided strong technical support for the promotion of deep-sea oil and gas resources. In the first half of the year, the Company successfully completed certain high-temperature well wireline logging operation, realized for the first time the high-end logging operation of self-developed high-temperature wireline logging equipment such as ultra-high-temperature full logging system, high-temperature acoustoelectric imaging, and high-temperature magnetic resonance and rotating shaft wall coring; the constant flow temperature range index of its self-developed synthetic base drilling fluid broke through the minimum and maximum temperature of 3°C and 180°C respectively, indicating that the national self-developed drilling fluid technology has reached international leading standard; with the successfully self-developed drilling quadrupole acoustic logging tool (QUAST), the Company completed the logging operations with high quality in two sea areas, promoted the rapid improvement in the logging while drilling technical service capabilities which the Company has had intellectual property rights; completed the first airtight temporary blocking and fracking operation, indicating that the Company achieved breakthrough again on the path of exploring and practicing new process and technology on fracking; successfully completed the first overseas operation for self-developed “D+W” system’s Drilog tools, new synthetic base drilling fluids and its supporting technology were recognized by the international market; successfully completed the acidizing stimulation operation of certain oilfield wells in the Middle East, and helped reviving such well after being shut down for 8 years; successfully signed its first cooperation order for drilling fluids and well cementing services in North America with new international customers.

8 China Oilfield Services Limited • Interim Report 2021
Management Discussion and Analysis (continued)
Marine Support Services Segment
In the first half of the year, revenue from the Company’s marine support services business was RMB1,535.9 million, which was equal to the revenue for the same period of last year. Of which, RMB1,039.5 million was revenue from self-owned vessels.
In the first half of 2021, the Company’s marine support services segment continued to strengthen cost control and green development concept, strived to perform cost management for single vessel, optimized energy saving and emission reduction measures and construction of safety capacity, increased quality of equipment operation and maintenance, enhanced international market expansion. The Company’s four 5,000 horsepower LNG power guard supply vessels were put into operation. The Company fully completed the tug-on-water operation and anchor retrieval operation of the world’s first 100,000-tonne deep-water semi-submersible oil production and storage drilling rig “Shen Hai Yi Hao” as well as added new marine support resources in the America’s project market.
As of 30 June 2021, operating days for self-owned vessels of the Company’s marine support services business amounted to 14,806, representing a decrease of 735 days compared with the same period of last year. The calendar day utilisation rate decreased by 4.1 percentage points to 92.9% compared with the same period of last year, with various degree of decline in the operation volume of main business lines. Details are in the following table:
Marine Support Services (self-owned vessels)
For the six months ended 30 JunePercentage change2021 2020
Operating days (day) 14,806 15,541 (4.7%)Standby vessels 6,258 6,770 (7.6%)AHTS vessels 4,951 4,825 2.6%Platform supply vessels 2,420 2,535 (4.5%)Multipurpose vessels 634 712 (11.0%)Workover support barges 543 699 (22.3%)

Management Discussion and Analysis (continued)
China Oilfield Services Limited • Interim Report 2021 9
Geophysical Acquisition and Surveying Services Segment
Revenue for the Company’s geophysical acquisition and surveying services segment was RMB819.3 million for the first half of the year, representing an increase of RMB78.3 million or 10.6% compared with the same period of last year. It was mainly due to the substantial increase in the operation volume of ocean bottom cable business during the period, which led to an increase in revenue.
In the first half of 2021, facing the sluggish geophysical industry, the Company actively strengthened its refined management, enhanced technology innovation, continuously raised production and operation capacity, fully protected the exploration resources and constantly reduced costs and improved quality and efficiency. The self-developed streamer acquisition equipment “Hailiang” and streamer integrated navigation system “Haitu” have achieved commercial production and application which filled up the China’s equipment technology gap in such field, thus enabling the nation’s self-developed marine seismic streamer acquisition equipment technology to attain international advanced level. The geophysical vessel “HYSY720” continuously carried out several 3D seismic acquisition projects in the South America sea, and its high-quality, safe, efficient and environmental-friendly operations were well received by customers. Two geophysical vessels jointly completed the most difficult two-ship seismic acquisition project in the country’s geophysical streaming operation till now, with operation efficiency of up to 95%. The Company also organized CNOOC’s first Ocean Bottom Node (OBN) operating fleet, which enabled the Company to have an OBN seismic acquisition operation capability of over 100-meter water depth.
As of 30 June 2021, under the impact of Pandemic and operation delays as a result, the operation volume of the Company’s 2D acquisition business was 2,156 km, a 76.2% decrease compared with the same period of last year. The 3D acquisition business’s operation volume was 9,667 km2, a 7.6% decrease compared with the same period of last year. The operation volume of ocean bottom cable was full and was 990 km2, a 68.1% increase compared with the same period of last year; ocean bottom node business has been newly added and the operation volume was 210 km2. Details are as follows:
Geophysical Acquisition and Surveying ServicesFor the six months ended 30 June
Percentage change2021 2020
2D acquisition (km) 2,156 9,077 (76.2%)3D acquisition (km2) 9,667 10,466 (7.6%)
of which: multi-client acquisition (km2) 1,771 2,918 (39.3%)Ocean bottom cable (km2) 990 589 68.1%Ocean bottom node (km2) 210 0 N/A
10 China Oilfield Services Limited • Interim Report 2021
Management Discussion and Analysis (continued)
FINANCIAL REVIEW
1. Analysis of interim condensed consolidated statement of profit or loss
1.1 Revenue
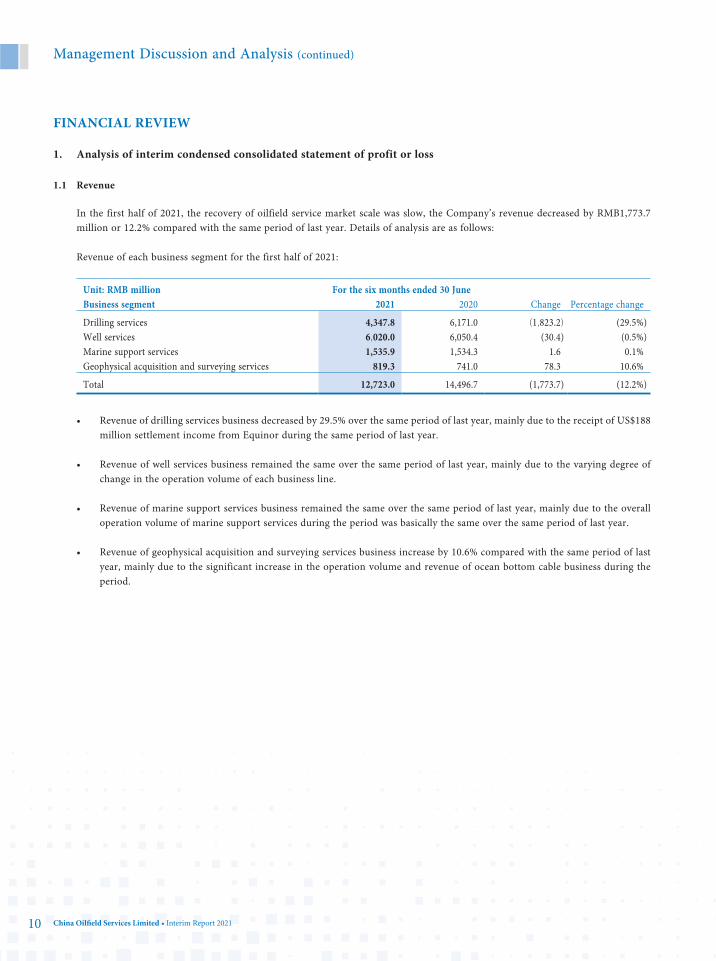
In the first half of 2021, the recovery of oilfield service market scale was slow, the Company’s revenue decreased by RMB1,773.7 million or 12.2% compared with the same period of last year. Details of analysis are as follows:
Revenue of each business segment for the first half of 2021:
Unit: RMB million For the six months ended 30 JuneChange Percentage changeBusiness segment 2021 2020
Drilling services 4,347.8 6,171.0 (1,823.2) (29.5%)Well services 6,020.0 6,050.4 (30.4) (0.5%)Marine support services 1,535.9 1,534.3 1.6 0.1%Geophysical acquisition and surveying services 819.3 741.0 78.3 10.6%
Total 12,723.0 14,496.7 (1,773.7) (12.2%)
• Revenue of drilling services business decreased by 29.5% over the same period of last year, mainly due to the receipt of US$188 million settlement income from Equinor during the same period of last year.
• Revenue of well services business remained the same over the same period of last year, mainly due to the varying degree of change in the operation volume of each business line.
• Revenue of marine support services business remained the same over the same period of last year, mainly due to the overall operation volume of marine support services during the period was basically the same over the same period of last year.
• Revenue of geophysical acquisition and surveying services business increase by 10.6% compared with the same period of last year, mainly due to the significant increase in the operation volume and revenue of ocean bottom cable business during the period.
Management Discussion and Analysis (continued)
China Oilfield Services Limited • Interim Report 2021 11
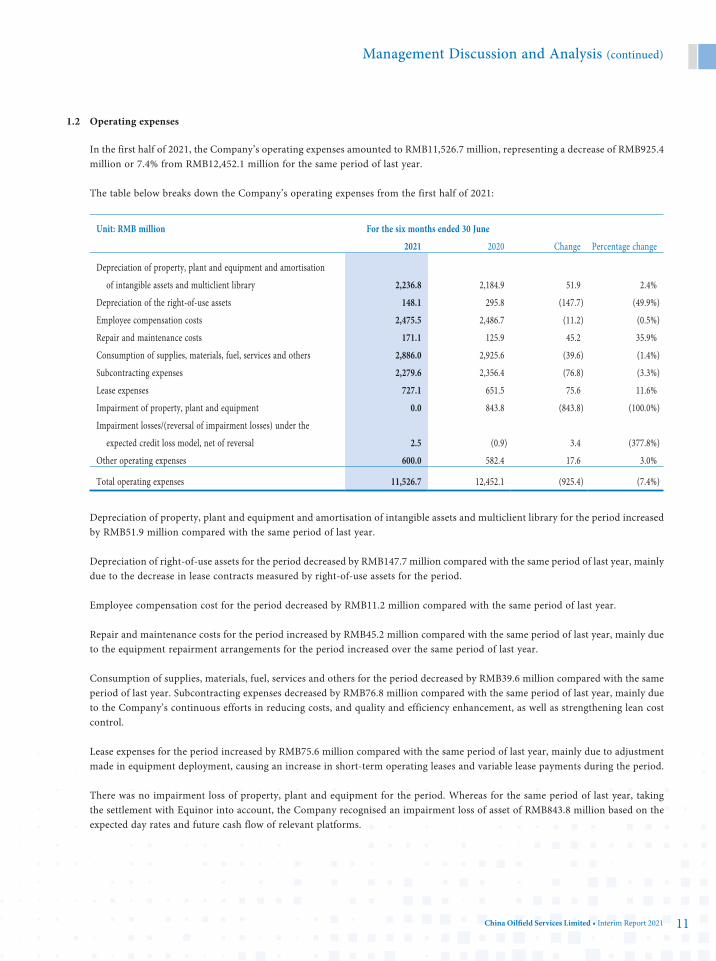
1.2 Operating expenses
In the first half of 2021, the Company’s operating expenses amounted to RMB11,526.7 million, representing a decrease of RMB925.4 million or 7.4% from RMB12,452.1 million for the same period of last year.
The table below breaks down the Company’s operating expenses from the first half of 2021:
Unit: RMB million For the six months ended 30 June
Change Percentage change2021 2020
Depreciation of property, plant and equipment and amortisation
of intangible assets and multiclient library 2,236.8 2,184.9 51.9 2.4%
Depreciation of the right-of-use assets 148.1 295.8 (147.7) (49.9%)
Employee compensation costs 2,475.5 2,486.7 (11.2) (0.5%)
Repair and maintenance costs 171.1 125.9 45.2 35.9%
Consumption of supplies, materials, fuel, services and others 2,886.0 2,925.6 (39.6) (1.4%)
Subcontracting expenses 2,279.6 2,356.4 (76.8) (3.3%)
Lease expenses 727.1 651.5 75.6 11.6%
Impairment of property, plant and equipment 0.0 843.8 (843.8) (100.0%)
Impairment losses/(reversal of impairment losses) under the
expected credit loss model, net of reversal 2.5 (0.9) 3.4 (377.8%)
Other operating expenses 600.0 582.4 17.6 3.0%
Total operating expenses 11,526.7 12,452.1 (925.4) (7.4%)
Depreciation of property, plant and equipment and amortisation of intangible assets and multiclient library for the period increased by RMB51.9 million compared with the same period of last year.
Depreciation of right-of-use assets for the period decreased by RMB147.7 million compared with the same period of last year, mainly due to the decrease in lease contracts measured by right-of-use assets for the period.
Employee compensation cost for the period decreased by RMB11.2 million compared with the same period of last year.
Repair and maintenance costs for the period increased by RMB45.2 million compared with the same period of last year, mainly due to the equipment repairment arrangements for the period increased over the same period of last year.
Consumption of supplies, materials, fuel, services and others for the period decreased by RMB39.6 million compared with the same period of last year. Subcontracting expenses decreased by RMB76.8 million compared with the same period of last year, mainly due to the Company’s continuous efforts in reducing costs, and quality and efficiency enhancement, as well as strengthening lean cost control.
Lease expenses for the period increased by RMB75.6 million compared with the same period of last year, mainly due to adjustment made in equipment deployment, causing an increase in short-term operating leases and variable lease payments during the period.
There was no impairment loss of property, plant and equipment for the period. Whereas for the same period of last year, taking the settlement with Equinor into account, the Company recognised an impairment loss of asset of RMB843.8 million based on the expected day rates and future cash flow of relevant platforms.
12 China Oilfield Services Limited • Interim Report 2021
Management Discussion and Analysis (continued)
Impairment losses under the expected credit loss model for the period amounted to RMB2.5 million, mainly due to an increase in the expected credit loss made for other receivables.
Other operating expenses for the period amounted to RMB600.0 million, which mainly included more than 30 cost subjects including travel expenses, business trip expense, office expenses, expenses for library materials, health, safety and environmental protection expenses, weather guarantee fees, consulting fees, audit fees and so on, with an increase of RMB17.6 million compared with the same period of last year. Among which, pandemic prevention expenses decreased by RMB96.4 million, while other subjects increased or decreased. Of the total other operating expenses, travel expenses amounted to RMB157.5 million, health, safety and environmental protection expenses amounted to RMB108.3 million, transfer fees for technology research amounted to RMB61.3 million, overseas business trip expenses amounted to RMB39.8 million, and other office expenses, consulting fees and audit fees and so on amounted to RMB233.1 million in total.
In the same period of 2020, other operating expenses amounted to RMB582.4 million, which mainly included more than 30 cost subjects including travel expenses, business trip expense, office expenses, expenses for library materials, health, safety and environmental protection expenses, weather guarantee fees, consulting fees, audit fees and so on, of which travel expenses amounted to RMB143.4 million, pandemic prevention expenses amounted to RMB112.0 million, health, safety and environmental protection expenses amounted to RMB90.6 million, overseas business trip expenses amounted to RMB85.7 million. Transfer fees for other technology research, consulting fees, audit fees and so on, amounted to RMB150.7 million in total.
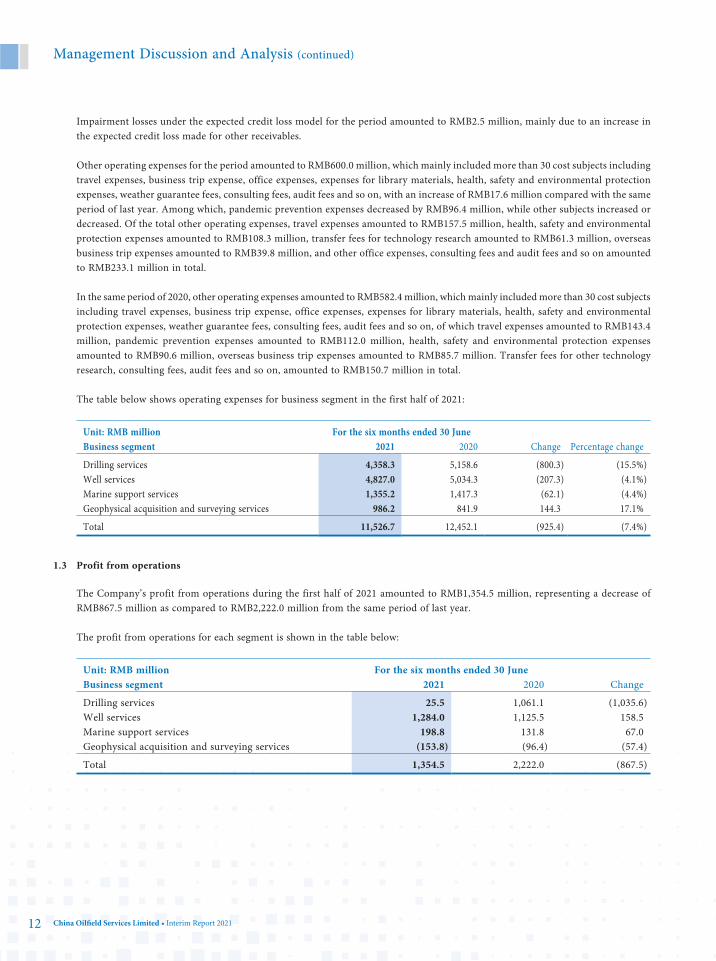
The table below shows operating expenses for business segment in the first half of 2021:
Unit: RMB million For the six months ended 30 JuneChange Percentage changeBusiness segment 2021 2020
Drilling services 4,358.3 5,158.6 (800.3) (15.5%)Well services 4,827.0 5,034.3 (207.3) (4.1%)Marine support services 1,355.2 1,417.3 (62.1) (4.4%)Geophysical acquisition and surveying services 986.2 841.9 144.3 17.1%
Total 11,526.7 12,452.1 (925.4) (7.4%)
1.3 Profit from operations
The Company’s profit from operations during the first half of 2021 amounted to RMB1,354.5 million, representing a decrease of RMB867.5 million as compared to RMB2,222.0 million from the same period of last year.
The profit from operations for each segment is shown in the table below:
Unit: RMB million For the six months ended 30 JuneBusiness segment 2021 2020 Change
Drilling services 25.5 1,061.1 (1,035.6)Well services 1,284.0 1,125.5 158.5Marine support services 198.8 131.8 67.0Geophysical acquisition and surveying services (153.8) (96.4) (57.4)
Total 1,354.5 2,222.0 (867.5)
Management Discussion and Analysis (continued)
China Oilfield Services Limited • Interim Report 2021 13
1.4 Financial expenses, net
In the first half of 2021, the Company’s net financial expenses were RMB434.1 million, representing an increase of RMB47.6 million compared with RMB386.5 million for the same period of last year. Of which, net exchange gain decreased by RMB142.6 million compared with the same period of last year, finance costs decreased by RMB59.4 million compared with the same period of last year, and interest income increased by RMB35.6 million compared with the same period of last year.
1.5 Investment income
In the first half of 2021, the Company’s investment income amounted to RMB23.5 million, representing a decrease of RMB54.0 million or 69.7% compared with RMB77.5 million for the same period of last year, mainly due to a decrease in income from wealth management products during the period.
1.6 Gains arising from financial assets at fair value through profit or loss
In the first half of 2021, gains arising from financial assets at fair value were RMB51.0 million, representing an increase of RMB25.5 million compared with RMB25.5 million for the same period of last year. This was mainly due to an increase in redemption of monetary funds and increase in gains from fair value changes of wealth management products during the period.
1.7 Other gains and losses
In the first half of 2021, net loss from disposal/retirement of assets and lease modifications was RMB21.5 million, while the net loss from disposal/retirement of assets for the same period of last year was RMB6.4 million.
1.8 Profit for the period
In the first half of 2021, the Company’s profit for the period was RMB808.5 million, as compared with RMB1,722.6 million for the same period of last year.
1.9 Basic earnings per share
In the first half of 2021, the Company’s basic earnings per share amounted to RMB16.80 cents as compared with basic earnings per share of RMB35.93 cents for the same period of last year.
14 China Oilfield Services Limited • Interim Report 2021
Management Discussion and Analysis (continued)
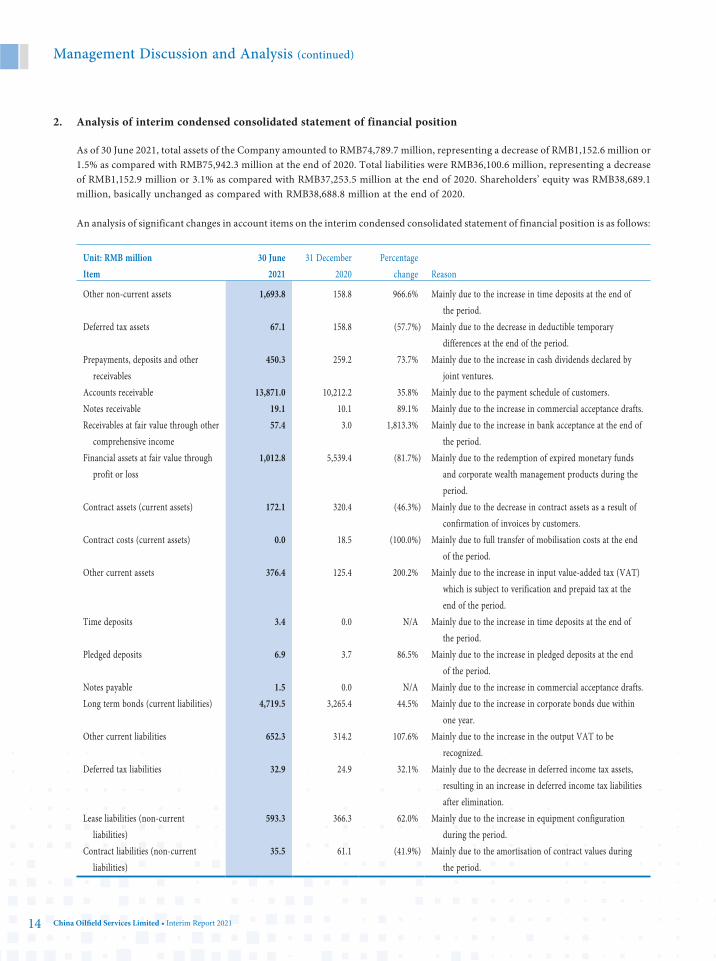
2. Analysis of interim condensed consolidated statement of financial position
As of 30 June 2021, total assets of the Company amounted to RMB74,789.7 million, representing a decrease of RMB1,152.6 million or 1.5% as compared with RMB75,942.3 million at the end of 2020. Total liabilities were RMB36,100.6 million, representing a decrease of RMB1,152.9 million or 3.1% as compared with RMB37,253.5 million at the end of 2020. Shareholders’ equity was RMB38,689.1 million, basically unchanged as compared with RMB38,688.8 million at the end of 2020.
An analysis of significant changes in account items on the interim condensed consolidated statement of financial position is as follows:
Unit: RMB million 30 June 2021
31 December 2020
Percentage change ReasonItem
Other non-current assets 1,693.8 158.8 966.6% Mainly due to the increase in time deposits at the end of the period.
Deferred tax assets 67.1 158.8 (57.7%) Mainly due to the decrease in deductible temporary differences at the end of the period.
Prepayments, deposits and other receivables
450.3 259.2 73.7% Mainly due to the increase in cash dividends declared by joint ventures.
Accounts receivable 13,871.0 10,212.2 35.8% Mainly due to the payment schedule of customers.Notes receivable 19.1 10.1 89.1% Mainly due to the increase in commercial acceptance drafts.Receivables at fair value through other
comprehensive income57.4 3.0 1,813.3% Mainly due to the increase in bank acceptance at the end of
the period.Financial assets at fair value through
profit or loss1,012.8 5,539.4 (81.7%) Mainly due to the redemption of expired monetary funds
and corporate wealth management products during the period.
Contract assets (current assets) 172.1 320.4 (46.3%) Mainly due to the decrease in contract assets as a result of confirmation of invoices by customers.
Contract costs (current assets) 0.0 18.5 (100.0%) Mainly due to full transfer of mobilisation costs at the end of the period.
Other current assets 376.4 125.4 200.2% Mainly due to the increase in input value-added tax (VAT) which is subject to verification and prepaid tax at the end of the period.
Time deposits 3.4 0.0 N/A Mainly due to the increase in time deposits at the end of the period.
Pledged deposits 6.9 3.7 86.5% Mainly due to the increase in pledged deposits at the end of the period.
Notes payable 1.5 0.0 N/A Mainly due to the increase in commercial acceptance drafts.Long term bonds (current liabilities) 4,719.5 3,265.4 44.5% Mainly due to the increase in corporate bonds due within
one year.Other current liabilities 652.3 314.2 107.6% Mainly due to the increase in the output VAT to be
recognized.Deferred tax liabilities 32.9 24.9 32.1% Mainly due to the decrease in deferred income tax assets,
resulting in an increase in deferred income tax liabilities after elimination.
Lease liabilities (non-current liabilities)
593.3 366.3 62.0% Mainly due to the increase in equipment configuration during the period.
Contract liabilities (non-current liabilities)
35.5 61.1 (41.9%) Mainly due to the amortisation of contract values during the period.
Management Discussion and Analysis (continued)
China Oilfield Services Limited • Interim Report 2021 15
3. Analysis of interim condensed consolidated statement of cash flows
At the beginning of 2021, the Company held cash and cash equivalents of RMB6,583.7 million. Net cash outflows from operating activities for the period amounted to RMB1,888.8 million. Net cash inflows from investing activities were RMB1,809.9 million. Net cash outflows from financing activities were RMB1,339.3 million. The impact of foreign exchange fluctuations on cash was a decrease of RMB39.5 million. As of 30 June 2021, the Company’s cash and cash equivalents amounted to RMB5,126.1 million.
3.1 Cash flows from operating activities
As of 30 June 2021, the Company’s net cash outflows from operating activities amounted to RMB1,888.8 million, as compared with the net cash outflows of RMB310.4 million for the same period of last year, mainly due to the receipt of US$188 million settlement income from Equinor over the same period of last year.
3.2 Cash flows from investing activities
As of 30 June 2021, net cash inflows from the Company’s investing activities amounted to RMB1,809.9 million, while net cash inflows from the Company’s investing activities amounted to RMB2,569.8 million for the same period of last year. This was mainly due to the cash outflows paid for purchases of bank wealth management products, debt instrument and time deposits decreased by RMB1,996.6 million as compared with the same period of last year. Cash inflows received from the disposal of/expired investments in bank wealth management products and monetary funds decreased by RMB2,485.3 million as compared with the same period of last year. Cash outflows paid for purchases of property, plant, equipment and other intangible assets increased by RMB469.3 million as compared with the same period of last year. The total decrease of cash outflows from other investing activities was RMB198.1 million.
3.3 Cash flows from financing activities
As of 30 June 2021, the Company’s net cash outflows from financing activities amounted to RMB1,339.3 million, as compared with RMB3,736.4 million of cash inflows from financing activities over the same period of last year. This was mainly due to no issuance of long term bonds during the period; cash inflows from the issuance of RMB5,613.7 million as compared with the same period of last year; cash outflows from the repayment of bank loans decreasing by RMB298.3 million over the same period of last year; cash outflows from the repayment of lease liabilities decreasing by RMB228.6 million as compared with the same period of last year; and the decrease in cash outflows from other financing activities was RMB11.1 million.
3.4 The impact of foreign exchange rate changes on cash during the period was a decrease of RMB39.5 million.

16 China Oilfield Services Limited • Interim Report 2021
Management Discussion and Analysis (continued)
4. Capital Expenditure
In the first half of 2021, the Company’s capital expenditure was RMB1,126.9 million, representing an increase of RMB185.3 million or 19.7% compared with RMB941.6 million for the same period of last year.
The capital expenditure of each business segment is shown in the table below:
Unit: RMB million For the six months ended 30 JuneChange Percentage changeBusiness segment 2021 2020
Drilling services 302.6 232.8 69.8 30.0%Well services 599.6 492.1 107.5 21.8%Marine support services 128.8 156.5 (27.7) (17.7%)Geophysical acquisition and surveying services 95.9 60.2 35.7 59.3%
Total 1,126.9 941.6 185.3 19.7%v
The capital expenditure of the drilling services segment was mainly used for the transformation and renovation of drilling rig equipment. The capital expenditure of the well services segment was mainly used for the construction of technical service-related equipment. The capital expenditure of the marine support services segment was mainly used for the construction of oilfield services vessel. The increased capital expenditure of the geophysical acquisition and surveying services segment was mainly used for the purchase of operation equipment.
5. Major Subsidiaries
China Oilfield Services (BVI) Limited, COSL Hong Kong International Limited, COSL Norwegian AS (“CNA”), COSL Singapore Limited are major subsidiaries of the Company mainly engaged in drilling and well services and related business.
As of 30 June 2021, China Oilfield Services (BVI) Limited’s total assets amounted to RMB3,617.6 million and equity was RMB531.4 million. China Oilfield Services (BVI) Limited realised revenue of RMB953.8 million in the first half of 2021, representing an increase of RMB118.2 million compared with the same period of last year. The revenue increase was mainly resulted from gradual market recovery and increase in operation. Net profit amounted to RMB103.8 million, representing an increase of RMB110.7 million compared with the same period of last year.
As of 30 June 2021, COSL Hong Kong International Limited’s total assets amounted to RMB6,881.1 million and equity was RMB6,881.1 million. COSL Hong Kong International Limited realised revenue of RMB16,700 in 2021, and revenue in the same period of last year was zero. Net profit amounted to RMB500, and net profit in the same period of last year was RMB-22,100.
As of 30 June 2021, CNA’s total assets amounted to RMB8,819.1 million and equity was RMB-1,655.9 million. CNA realised revenue of RMB399.5 million in the first half of 2021, representing a decrease of RMB1,885.5 million or 82.5% compared with the same period of last year. The major reason was the receipt of a settlement income of US$188 million from Equinor in the same period of last year. Net profit amounted to RMB-293.7 million, representing a decrease of RMB758.9 million compared with the same period of last year. Taking into account the settlement with Equinor in the same period of last year, CNA recognised an asset impairment loss of RMB843.8 million based on the expected day rates and future cash flow of COSLInnovator, whereas there was no impairment loss for the current period.
Management Discussion and Analysis (continued)
China Oilfield Services Limited • Interim Report 2021 17
As of 30 June 2021, COSL Singapore Limited’s total assets amounted to RMB24,237.6 million and equity was RMB-1,761.2 million. COSL Singapore Limited realised revenue of RMB710.1 million in the first half of 2021, representing a decrease of RMB168.5 million or 19.2% compared with the same period of last year. Net profit amounted to RMB-351.1 million, representing a decrease in loss of RMB189.8 million compared with the same period of last year. COSL DRILLING STRIKE PTE. LTD. and COSL PROSPECTOR PTE. LTD. are major subsidiaries of COSL Singapore Limited.
As of 30 June 2021, the total assets of COSL DRILLING STRIKE PTE. LTD. amounted to RMB3,697.7 million and equity was RMB-3,038.6 million. COSL DRILLING STRIKE PTE. LTD. realised revenue of RMB91.7 million in the first half of 2021, representing a decrease of RMB21.9 million or 19.3% compared with the same period of last year. Net profit amounted to RMB-137.1 million, representing an increase in loss of RMB5.6 million compared with the same period of last year.
As of 30 June 2021, the total assets of COSL PROSPECTOR PTE. LTD. amounted to RMB8,018.6 million and equity was RMB-4,615.2 million. COSL PROSPECTOR PTE. LTD. realised revenue of RMB208.8 million in the first half of 2021, representing a decrease of RMB54.8 million compared with the same period of last year. Net profit amounted to RMB-259.6 million, representing a decrease in loss of RMB86.9 million compared with the same period of last year.
PROSPECTS
The latest “World Economic Outlook Report” released by the International Monetary Fund (IMF) forecasts that the global economy is expected to grow by 6.0% and Chinese economy by 8.1% in 2021. The continued recovery of global economy is expected to facilitate the growth in demand for crude oil. The upstream exploration and development investment by oil companies is likely to increase, the oilfield service market will recover slowly and the low utilization rate of oilfield service equipment will be alleviated. At the same time, driven by the national “Seven-Year Action Plan” for improving reserves and production, the domestic market demand for oilfield services remains stable, and the Company will gain more market opportunities.
In the second half of the year, the Company will comprehensively enhance its technological research and development capabilities and promote the establishment of “strategic partners”, implement our safety responsibilities, realize our “peak carbon dioxide emissions and carbon neutrality” target objectives, and cultivate new development momentum, further reduce overall costs, enhance service capabilities and service efficiency, and help oil companies in increasing reserves and production. At the same time, the Company will keep abreast on the development of the global economy, the trend of international oil prices, investment in upstream exploration and development as well as the oilfield service market condition, and it will formulate targeted response measures in accordance with the development trends of the industry.
18 China Oilfield Services Limited • Interim Report 2021
Supplementary Information
AUDIT COMMITTEE
The audit committee comprises of three independent non-executive directors of the Company. The audit committee has reviewed the accounting principles and practices adopted by the Company as well as the risk management, internal control and financial reporting matters. The Company’s unaudited interim results and financial report for the six months ended 30 June 2021 have been reviewed by the audit committee.
CORPORATE GOVERNANCE CODE
During the six months ended 30 June 2021, the Company has complied with the code provisions of the Corporate Governance Code as set out in Appendix 14 of the Rules Governing the Listing of Securities on The Stock Exchange of Hong Kong Limited (hereinafter “Listing Rules”).
COMPLIANCE WITH THE MODEL CODE FOR SECURITIES TRANSACTIONS BY DIRECTORS OF LISTED ISSUERS
Upon specific enquiry to all directors and supervisors by the Company, the directors and supervisors of the Company have confirmed that they have, for the six months ended 30 June 2021, complied with the Model Code for Securities Transactions by Directors of Listed Issuers (hereinafter “Model Code”) as set out in Appendix 10 of the Listing Rules. The Company currently has adopted a code of conduct for securities transactions by directors that is stricter than the provisions set out in the Model Code.
PURCHASE, SALE AND REDEMPTION OF OUR LISTED SECURITIES
Neither the Company nor its subsidiaries have purchased, sold or redeemed any of the Company’s listed securities during the six months ended 30 June 2021.
DIRECTORS’ AND SUPERVISORS’ INTERESTS IN CONTRACTS
During the six months ended 30 June 2021, none of the directors and supervisors had any material interest, whether direct or indirect, in any contract that was significant to the Company’s business and to which the Company, its controlling shareholder or any of its subsidiaries or fellow subsidiaries was a party.
DIRECTORS’, SUPERVISORS’ AND SENIOR MANAGEMENT’S INTERESTS AND SHORT POSITIONS IN SHARES
As of 30 June 2021, none of the directors, supervisors and senior management of the Company or their respective associates had any other interests or short positions in the Shares, underlying Shares or debentures of the Company or any of its associated corporations (within the meaning of Part XV of the Securities and Futures Ordinance (hereinafter “SFO”)) as recorded in the register required to be kept under Section 352 of the SFO or as otherwise notified to the Company and HKSE pursuant to the Model Code.
Supplementary Information (continued)
China Oilfield Services Limited • Interim Report 2021 19
INTERESTS AND SHORT POSITIONS IN SHARES OF SUBSTANTIAL SHAREHOLDERS
So far as is known to any Director or senior management of the Company, as of 30 June 2021, the following persons had interests or short positions in the H Shares or underlying H Shares which would fall to be disclosed to the Company under the provisions of Divisions 2 and 3 of Part XV of the SFO or which were recorded in the register required to be kept under Section 336 of the SFO or were otherwise notified to the Company and HKSE:
Name of shareholder Shares heldNumber of shares in interest (share)
Approximate percentage of the interests (H)
in COSL (%)
Allianz SE Interest in controlled corporation 108,337,000 (L) 5.98 (L)
Notes:
(a) “L” means long position
(b) “S” means short position
(c) “P” means lending pool
Save as disclosed above, the directors are not aware of any other person who had an interest in the shares of the Company which were recorded in the register required to be keep under Section 336 of the SFO.
DIRECTORS’, SUPERVISORS’ AND SENIOR MANAGEMENT’S RIGHTS TO ACQUIRE SHARES OR DEBENTURES
At no time during the six months ended 30 June 2021 were rights to acquire benefits by means of acquisition of shares in or debentures of the Company granted to any directors, supervisors and senior management or their respective spouses or minor children, or were any such rights exercised by them; nor was the Company, its holding company, or any of its subsidiaries or fellow subsidiaries a party to any arrangement to enable the directors to acquire such rights in any other body corporate.
EMPLOYEE, REMUNERATION POLICY AND TRAINING PROGRAMME
As of 30 June 2021, the total number of in-service employees of the Company is 14,477. The Company strictly complied with the labor policies and relevant laws and regulations of China and the country where it operates and established a competitive remuneration system and performance appraisal system. The Company established a salary growth mechanism related to economic benefits and labor productivity, adhered to performance-oriented, clear reward and punishment, earnestly increase or reduce income and actively mobilize employee. The Company coordinated and standardized the employee welfare and insurance system and established a supplementary insurance system for enterprises that is compatible with social insurance to fully guarantee the stability of employees. The Company also provided employees with a number of welfare including health check, paid vacation, helping and assisting those with difficulties or major diseases and etc., taking efforts to address the worries of employees, so as to provide reliable and multi-layered protection for employees.
Training programme and development of the Company are closely related to the strategy of Employees’ career development of the Company. Based on the five-year development plan, the Company established a dimensional demand-oriented training model with layers and differentiation, which enhanced the training capability, highly promoted the internal teaching team’s construction, gradually improved the training system, fulfilled the requirement of the Company’s business development and built our core competitiveness.
20 China Oilfield Services Limited • Interim Report 2021
Supplementary Information (continued)
CHANGES IN DIRECTORS, SUPERVISORS AND SENIOR MANAGEMENT
Changes in Directors
On 1 June 2021, the Company convened the 2020 AGM, at which Mr. Fong Chung, Mark, an independent non-executive director, resigned for expiration of six years. The AGM considered and approved the appointment of Ms. Chiu Lai Kuen, Susanna as an independent non-executive director of the Company to fill in the vacancy to be left open by the resignation of Mr. Fong Chung, Mark for a term of three year starting from the date when the resolution was passed at the AGM and Ms. Chiu also serves as chairman of the audit committee of the Company and a member of the remuneration and assessment committee of the Company.
Changes in Senior Management
On 28 April 2021, Mr. Qi Meisheng resigned as the Chairman and the Chief Executive Officer of the Company and the member of nomination committee of the board of directors (the “Board”) due to the adjustment of his work arrangement, with effect from 28 April 2021. After this resignation, Mr. Qi Meisheng will remain as an Executive Director of the Company.
On 28 April 2021, the Board appointed Mr. Zhao Shunqiang to replace Mr. Qi Meisheng as the Chairman and the Chief Executive Officer of the Company and the member of nomination committee of the Board, with effect from 28 April 2021. At the same time, Mr. Zhao Shunqiang resigned as the President of the Company on 28 April 2021. The Chief Executive Officer of the Company is the chief executive and reports to the Board.
On 10 May 2021, Mr. Zheng Yonggang resigned as the CFO of the Company due to the adjustment of his work arrangement, with effect from 10 May 2021. The Board appointed Ms. Chong Xiaojie as the CFO of the Company, with effect from 11 May 2021.
On 25 August 2021, Mr. Liu Xiaogang was appointed as the Vice President of the Company, with effect from 25 August 2021.
PLACING OF H SHARES
On 15 January 2014, the Company completed the placing of an aggregate of 276,272,000 H shares, representing approximately 5.79% of the total number of issued shares (as enlarged by the allotment and issue of the placing shares) and approximately 15.25% of the total number of H shares in issue (as enlarged by the allotment and issue of the placing shares). After the placing, the total number of issued shares of the Company increased from 4,495,320,000 shares to 4,771,592,000 shares. The total number of issued H shares increased from 1,534,852,000 H shares to 1,811,124,000 H shares. For further details, please refer to the Company’s announcements dated 7 January 2014 and 15 January 2014, respectively. The net proceeds from the placing amounted to approximately HK$5,819,392,302.91 (after deduction of the commissions and estimated expense) and was used for general corporate purposes. The proceeds from the placing shares would be used according to the agreed use in the placing agreement. Approximately US$401,309.77 was not yet utilized as at 30 June 2021. The above balance of raised funds will continue to be used for general corporate purposes and in a timely manner.

Supplementary Information (continued)
China Oilfield Services Limited • Interim Report 2021 21
GEARING RATIO
As at 30 June 2021, the net current assets of the Company decreased to RMB7,672.6 million compared with RMB9,446.8 million as at 31 December 2020, while the current ratio decreased to 1.45 times, compared with 1.56 times as at 31 December 2020.
The Company monitors capital using the gearing ratio, which is net debt divided by the total capital plus net debt. The gearing ratios as at the end of each reporting period were as follows:
30 June 2021 31 December 2020RMB’000 RMB’000
Interest-bearing bank borrowings 203,972 209,437Financial liabilities included in trade and other payables 7,811,673 9,082,596Notes payable 1,539 –Salary and bonus payables 652,248 820,138Loan from a related party 2,261,546 2,284,336Long-term bonds 22,534,033 22,721,055Lease liabilities 842,684 590,588Less: Cash and cash equivalents and time deposits with maturity over three months (6,629,438) (6,583,742)
Net debt 27,678,257 29,124,408
Equity attributable to owners of the Company 38,504,942 38,509,930Non-controlling interests 184,157 178,878
Total Capital 38,689,099 38,688,808
Capital and net debt 66,367,356 67,813,216
Gearing ratio 42% 43%
PROGRESS OF BUSINESS PLAN
In the second quarter of 2021, the market remained cautious on upstream exploration and development expenses. At the same time, the oilfield service market was lagging and the market size was in slow recovery. The workload of the Company’s major segment was lower than that of the same period of last year, and the Company achieved a revenue of RMB12.72 billion and a net profit of RMB0.81 billion in the first half of the year. During the second quarter, the Company continued to implement cost reduction, quality improvement, efficiency enhancement, strengthen strategic cooperation, optimize industry structure, improve cost management. The Company achieved substantial increase in revenue margin and profit to cost ratio quarter-on-quarter. Given the trend of change in oil prices, it is expected that, in the second half of the year, upstream investments will be strengthened, oilfield service market opportunities may increase, new projects and operations will enter into a more stable phase, and the overall workload will be further improved. At the same time, affected by factors such as dedicated repair plans, scientific research that enter into the settlement stage and safety inspections, higher requirements will be put forward on cost control. The Company will continue to focus on research and development of key technologies, stabilize domestic market, expand foreign market, speed up launch and operation of projects and enhance the efficiency of projects under operation. It will also step up its efforts in improving quality and efficiency, and accelerate the construction of a systematic, structural, and long-term cost reduction mechanism, strive to achieve sustained profitability and better operating performance quarter-to-quarter in the third quarter.
FOREIGN CURRENCY RISK
The Company’s operation is affected by the exchange rate fluctuation of RMB against other foreign currencies. If the exchange rate fluctuation is significant, the Company’s net profit will be impacted to a certain extent. At the same time, if the exchange rate fluctuation is significant, it will also have an impact on cash receipts and payments including the foreign exchange receipts and payments, the US dollar debt repayment pressure and the cost of purchasing imported equipment of the Company. The management of the Company will continuously monitor such exposure.
22 China Oilfield Services Limited • Interim Report 2021
Supplementary Information (continued)
CHARGES ON ASSETS
As at 30 June 2021, the Company had no material charges against its assets.
The directors are of the opinion that there have been no material changes to the information published in its annual report for the year ended 31 December 2020, other than those disclosed in this interim report.
DISCLOSURE OF INFORMATION ON THE HKSE’S WEBSITE
All information required by paragraphs 46(1) to 46(6) of Appendix 16 of the Listing Rules will be published on the HKSE’s website (https://www.hkex.com.hk) and the Company’s website (https://www.cosl.com.cn) in due course.
By Order of the BoardChina Oilfield Services Limited
Wu YanyanCompany Secretary
25 August 2021
China Oilfield Services Limited • Interim Report 2021 23
Independent Review Report
Ernst & Young 27/F, One Taikoo Place 979 King’s Road Quarry Bay, Hong Kong
安永會計師事務所香港鰂魚涌英皇道979號太古坊一座27樓
Tel電話: +852 2846 9888 Fax傳真: +852 2868 4432 ey.com
To the board of directors of China Oilfield Services Limited(Incorporated in the People’s Republic of China with limited liability)
INTRODUCTION
We have reviewed the interim financial information set out on pages 24 to 63, which comprises the interim condensed consolidated statement of financial position of China Oilfield Services Limited (the “Company”) and its subsidiaries (the “Group”) as at 30 June 2021 and the related interim condensed consolidated statements of profit or loss, comprehensive income, changes in equity and cash flows for the six-month period then ended, and explanatory notes. The Rules Governing the Listing of Securities on The Stock Exchange of Hong Kong Limited require the preparation of a report on interim financial information to be in compliance with the relevant provisions thereof and Hong Kong Accounting Standard 34 Interim Financial Reporting (“HKAS 34”) issued by the Hong Kong Institute of Certified Public Accountants (“HKICPA”). The directors of the Company are responsible for the preparation and presentation of this interim financial information in accordance with HKAS 34. Our responsibility is to express a conclusion on this interim financial information based on our review. Our report is made solely to you, as a body, in accordance with our agreed terms of engagement, and for no other purpose. We do not assume responsibility towards or accept liability to any other person for the contents of this report.
SCOPE OF REVIEW
We conducted our review in accordance with Hong Kong Standard on Review Engagements 2410 Review of Interim Financial Information Performed by the Independent Auditor of the Entity issued by the HKICPA. A review of interim financial information consists of making inquiries, primarily of persons responsible for financial and accounting matters, and applying analytical and other review procedures. A review is substantially less in scope than an audit conducted in accordance with Hong Kong Standards on Auditing and consequently does not enable us to obtain assurance that we would become aware of all significant matters that might be identified in an audit. Accordingly, we do not express an audit opinion.
CONCLUSION
Based on our review, nothing has come to our attention that causes us to believe that the interim financial information is not prepared, in all material respects, in accordance with HKAS 34.
Ernst & YoungCertified Public Accountants
Hong Kong25 August 2021
24 China Oilfield Services Limited • Interim Report 2021
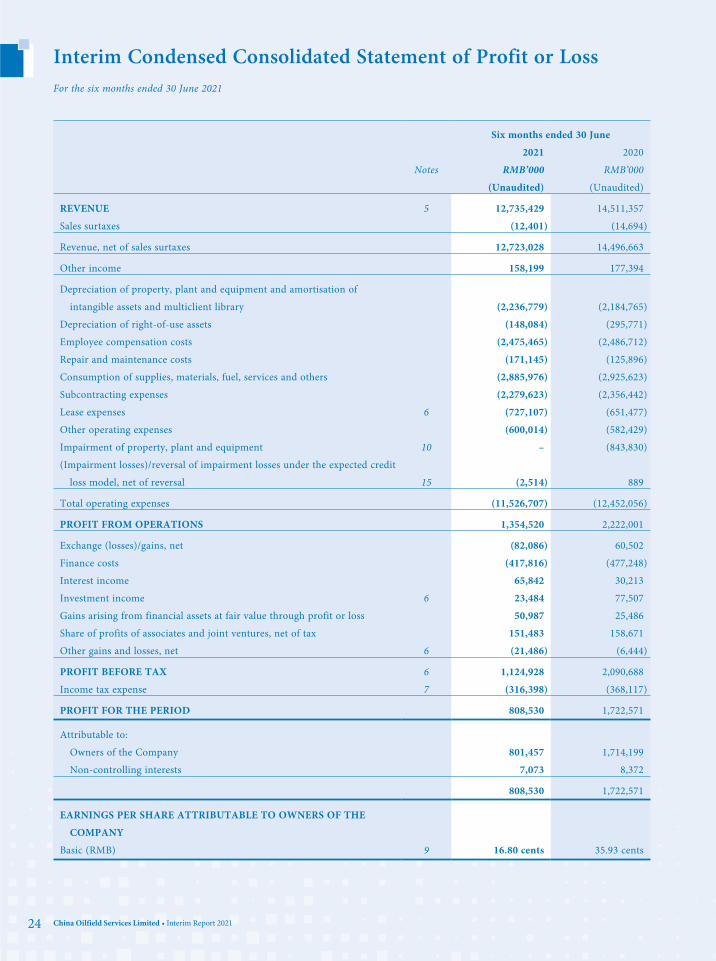
Interim Condensed Consolidated Statement of Profit or LossFor the six months ended 30 June 2021
Six months ended 30 June
2021 2020
Notes RMB’000 RMB’000
(Unaudited) (Unaudited)
REVENUE 5 12,735,429 14,511,357
Sales surtaxes (12,401) (14,694)
Revenue, net of sales surtaxes 12,723,028 14,496,663
Other income 158,199 177,394
Depreciation of property, plant and equipment and amortisation of
intangible assets and multiclient library (2,236,779) (2,184,765)
Depreciation of right-of-use assets (148,084) (295,771)
Employee compensation costs (2,475,465) (2,486,712)
Repair and maintenance costs (171,145) (125,896)
Consumption of supplies, materials, fuel, services and others (2,885,976) (2,925,623)
Subcontracting expenses (2,279,623) (2,356,442)
Lease expenses 6 (727,107) (651,477)
Other operating expenses (600,014) (582,429)
Impairment of property, plant and equipment 10 – (843,830)
(Impairment losses)/reversal of impairment losses under the expected credit
loss model, net of reversal 15 (2,514) 889
Total operating expenses (11,526,707) (12,452,056)
PROFIT FROM OPERATIONS 1,354,520 2,222,001
Exchange (losses)/gains, net (82,086) 60,502
Finance costs (417,816) (477,248)
Interest income 65,842 30,213
Investment income 6 23,484 77,507
Gains arising from financial assets at fair value through profit or loss 50,987 25,486
Share of profits of associates and joint ventures, net of tax 151,483 158,671
Other gains and losses, net 6 (21,486) (6,444)
PROFIT BEFORE TAX 6 1,124,928 2,090,688
Income tax expense 7 (316,398) (368,117)
PROFIT FOR THE PERIOD 808,530 1,722,571
Attributable to:
Owners of the Company 801,457 1,714,199
Non-controlling interests 7,073 8,372
808,530 1,722,571
EARNINGS PER SHARE ATTRIBUTABLE TO OWNERS OF THE
COMPANY
Basic (RMB) 9 16.80 cents 35.93 cents

China Oilfield Services Limited • Interim Report 2021 25
Interim Condensed Consolidated Statement of Comprehensive IncomeFor the six months ended 30 June 2021
Six months ended 30 June 2021 2020
RMB’000 RMB’000(Unaudited) (Unaudited)
PROFIT FOR THE PERIOD 808,530 1,722,571
OTHER COMPREHENSIVE INCOME
Other comprehensive income that may be reclassified to profit or loss in subsequent periods: Exchange differences on translation of financial statements of foreign operations (12,912) 54,417Share of other comprehensive income of joint ventures, net of related income tax 2,894 1,885Income tax effect relating to items that may be reclassified subsequently to profit or
loss 12,950 (24,198)
2,932 32,104
OTHER COMPREHENSIVE INCOME FOR THE PERIOD, NET OF TAX 2,932 32,104
TOTAL COMPREHENSIVE INCOME FOR THE PERIOD 811,462 1,754,675
Attributable to:Owners of the Company 806,183 1,743,639Non-controlling interests 5,279 11,036
811,462 1,754,675
26 China Oilfield Services Limited • Interim Report 2021
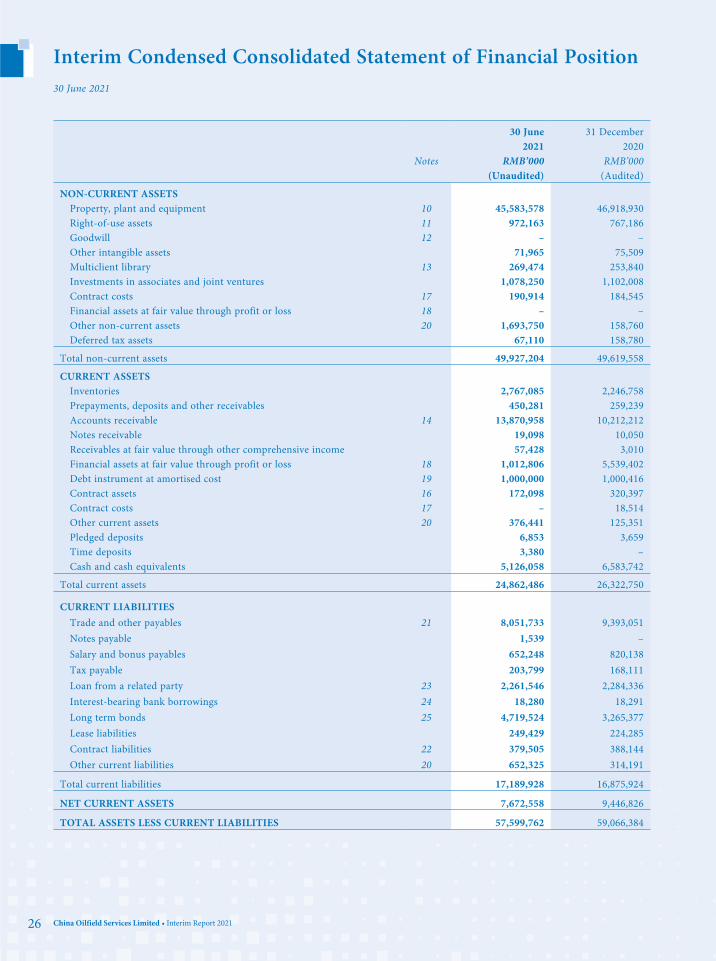
Interim Condensed Consolidated Statement of Financial Position 30 June 2021
30 June 2021
31 December 2020
Notes RMB’000 RMB’000(Unaudited) (Audited)
NON-CURRENT ASSETS Property, plant and equipment 10 45,583,578 46,918,930Right-of-use assets 11 972,163 767,186Goodwill 12 – –Other intangible assets 71,965 75,509Multiclient library 13 269,474 253,840Investments in associates and joint ventures 1,078,250 1,102,008Contract costs 17 190,914 184,545Financial assets at fair value through profit or loss 18 – –Other non-current assets 20 1,693,750 158,760Deferred tax assets 67,110 158,780
Total non-current assets 49,927,204 49,619,558
CURRENT ASSETSInventories 2,767,085 2,246,758Prepayments, deposits and other receivables 450,281 259,239Accounts receivable 14 13,870,958 10,212,212Notes receivable 19,098 10,050Receivables at fair value through other comprehensive income 57,428 3,010Financial assets at fair value through profit or loss 18 1,012,806 5,539,402Debt instrument at amortised cost 19 1,000,000 1,000,416Contract assets 16 172,098 320,397Contract costs 17 – 18,514Other current assets 20 376,441 125,351Pledged deposits 6,853 3,659Time deposits 3,380 –Cash and cash equivalents 5,126,058 6,583,742
Total current assets 24,862,486 26,322,750
CURRENT LIABILITIESTrade and other payables 21 8,051,733 9,393,051Notes payable 1,539 –Salary and bonus payables 652,248 820,138Tax payable 203,799 168,111Loan from a related party 23 2,261,546 2,284,336Interest-bearing bank borrowings 24 18,280 18,291Long term bonds 25 4,719,524 3,265,377Lease liabilities 249,429 224,285Contract liabilities 22 379,505 388,144Other current liabilities 20 652,325 314,191
Total current liabilities 17,189,928 16,875,924
NET CURRENT ASSETS 7,672,558 9,446,826
TOTAL ASSETS LESS CURRENT LIABILITIES 57,599,762 59,066,384
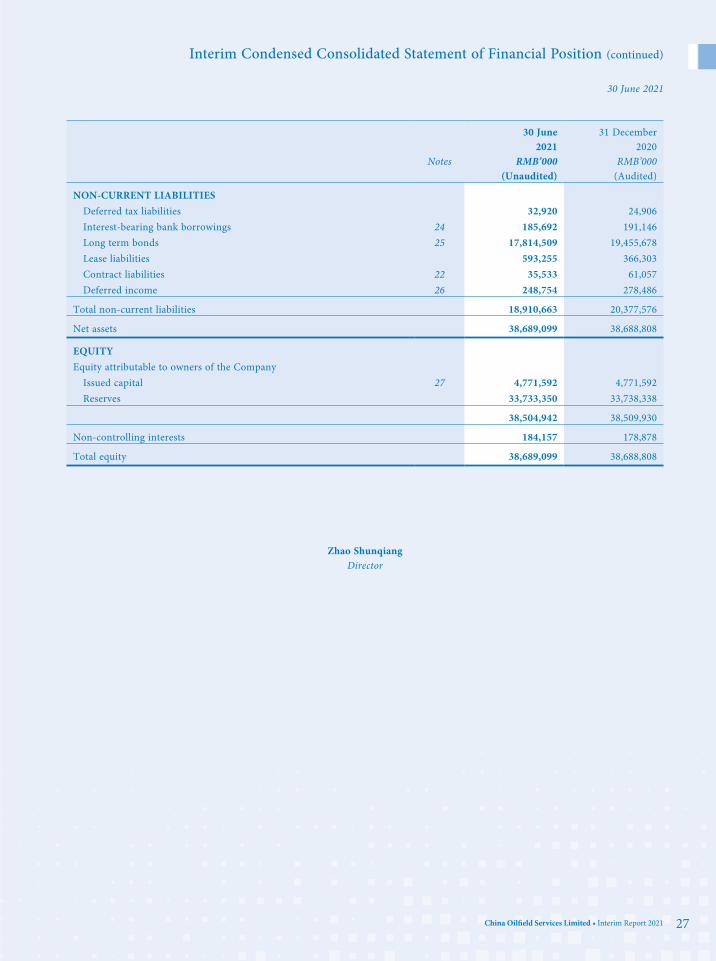
Interim Condensed Consolidated Statement of Financial Position (continued)
China Oilfield Services Limited • Interim Report 2021 27
30 June 2021
30 June 2021
31 December 2020
Notes RMB’000 RMB’000(Unaudited) (Audited)
NON-CURRENT LIABILITIES Deferred tax liabilities 32,920 24,906Interest-bearing bank borrowings 24 185,692 191,146Long term bonds 25 17,814,509 19,455,678Lease liabilities 593,255 366,303Contract liabilities 22 35,533 61,057Deferred income 26 248,754 278,486
Total non-current liabilities 18,910,663 20,377,576
Net assets 38,689,099 38,688,808
EQUITYEquity attributable to owners of the Company
Issued capital 27 4,771,592 4,771,592Reserves 33,733,350 33,738,338
38,504,942 38,509,930
Non-controlling interests 184,157 178,878
Total equity 38,689,099 38,688,808
Zhao ShunqiangDirector

28 China Oilfield Services Limited • Interim Report 2021
Interim Condensed Consolidated Statement of Changes in EquityFor the six months ended 30 June 2021
Equity attributable to owners of the parent
Issued capital
Capital reserve
Statutory reserve
fundsSpecial reserve
Remeasurement of defined
benefit pension plan
Exchange fluctuation
reserveRetained
profits
Proposed final
dividend Total
Non-controlling
interestsTotal
equityRMB’000 RMB’000 RMB’000 RMB’000 RMB’000 RMB’000 RMB’000 RMB’000 RMB’000 RMB’000 RMB’000
At 1 January 2021 (audited) 4,771,592 12,366,274 2,508,656 – – (256,472) 18,308,709 811,171 38,509,930 178,878 38,688,808
Profit for the period – – – – – – 801,457 – 801,457 7,073 808,530Other comprehensive income
for the period, net of tax – – – – – 4,726 – – 4,726 (1,794) 2,932
Total comprehensive income for the period – – – – – 4,726 801,457 – 806,183 5,279 811,462
Appropriation of safety fund – – – 16,103 – – – – 16,103 – 16,103Utilisation of safety fund – – – (16,103) – – – – (16,103) – (16,103) Final 2020 dividend paid
(Note 8) – – – – – – – (811,171) (811,171) – (811,171)
At 30 June 2021 (unaudited) 4,771,592 12,366,274 2,508,656 – – (251,746) 19,110,166 – 38,504,942 184,157 38,689,099
At 1 January 2020 (audited) 4,771,592 12,366,274 2,508,656 – (16,202) (92,479) 16,432,895 763,455 36,734,191 176,086 36,910,277
Profit for the period – – – – – – 1,714,199 – 1,714,199 8,372 1,722,571Other comprehensive income
for the period, net of income tax – – – – – 29,440 – – 29,440 2,664 32,104
Total comprehensive income for the period – – – – – 29,440 1,714,199 – 1,743,639 11,036 1,754,675
Appropriation of safety fund – – – 11,307 – – – – 11,307 – 11,307Utilisation of safety fund – – – (11,307) – – – – (11,307) – (11,307) Final 2019 dividend paid
(Note 8) – – – – – – – (763,455) (763,455) – (763,455)
At 30 June 2020 (unaudited) 4,771,592 12,366,274 2,508,656 – (16,202) (63,039) 18,147,094 – 37,714,375 187,122 37,901,497
China Oilfield Services Limited • Interim Report 2021 29
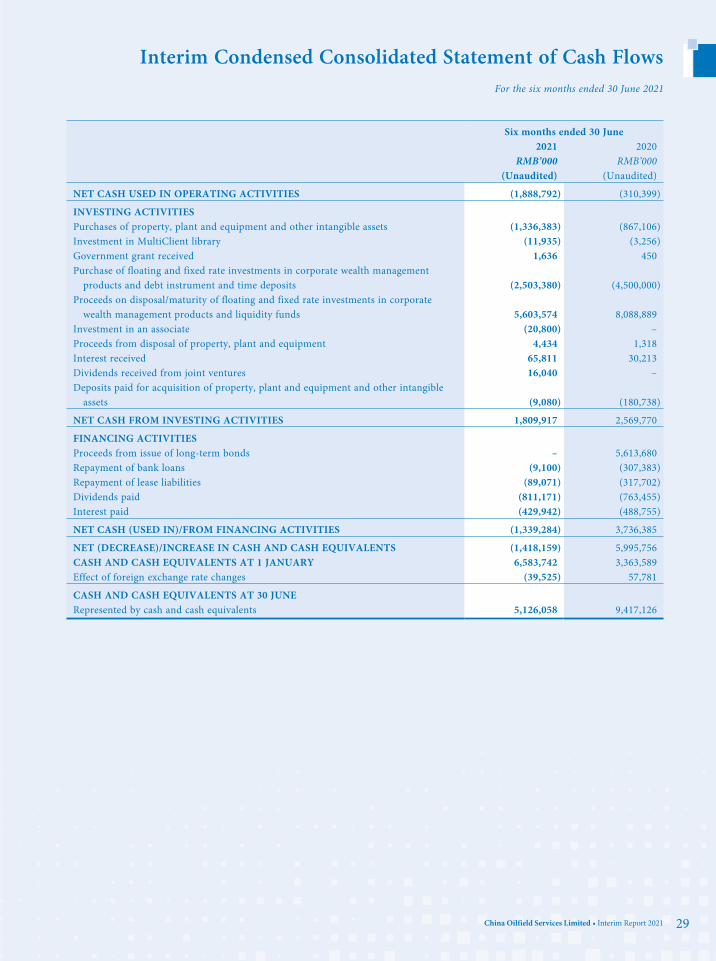
Interim Condensed Consolidated Statement of Cash FlowsFor the six months ended 30 June 2021
Six months ended 30 June 2021 2020
RMB’000 RMB’000(Unaudited) (Unaudited)
NET CASH USED IN OPERATING ACTIVITIES (1,888,792) (310,399)
INVESTING ACTIVITIES Purchases of property, plant and equipment and other intangible assets (1,336,383) (867,106) Investment in MultiClient library (11,935) (3,256) Government grant received 1,636 450Purchase of floating and fixed rate investments in corporate wealth management
products and debt instrument and time deposits (2,503,380) (4,500,000) Proceeds on disposal/maturity of floating and fixed rate investments in corporate
wealth management products and liquidity funds 5,603,574 8,088,889Investment in an associate (20,800) –Proceeds from disposal of property, plant and equipment 4,434 1,318Interest received 65,811 30,213Dividends received from joint ventures 16,040 – Deposits paid for acquisition of property, plant and equipment and other intangible
assets (9,080) (180,738)
NET CASH FROM INVESTING ACTIVITIES 1,809,917 2,569,770
FINANCING ACTIVITIESProceeds from issue of long-term bonds – 5,613,680Repayment of bank loans (9,100) (307,383) Repayment of lease liabilities (89,071) (317,702) Dividends paid (811,171) (763,455) Interest paid (429,942) (488,755)
NET CASH (USED IN)/FROM FINANCING ACTIVITIES (1,339,284) 3,736,385
NET (DECREASE)/INCREASE IN CASH AND CASH EQUIVALENTS (1,418,159) 5,995,756CASH AND CASH EQUIVALENTS AT 1 JANUARY 6,583,742 3,363,589Effect of foreign exchange rate changes (39,525) 57,781
CASH AND CASH EQUIVALENTS AT 30 JUNERepresented by cash and cash equivalents 5,126,058 9,417,126
30 China Oilfield Services Limited • Interim Report 2021
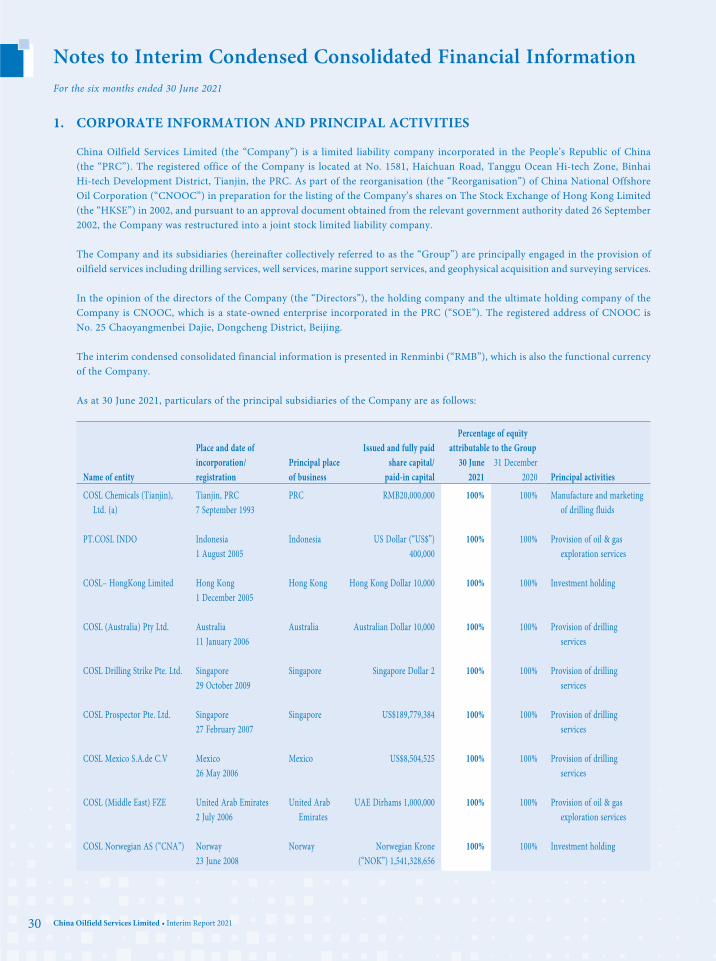
Notes to Interim Condensed Consolidated Financial Information For the six months ended 30 June 2021
1. CORPORATE INFORMATION AND PRINCIPAL ACTIVITIES
China Oilfield Services Limited (the “Company”) is a limited liability company incorporated in the People’s Republic of China (the “PRC”). The registered office of the Company is located at No. 1581, Haichuan Road, Tanggu Ocean Hi-tech Zone, Binhai Hi-tech Development District, Tianjin, the PRC. As part of the reorganisation (the “Reorganisation”) of China National Offshore Oil Corporation (“CNOOC”) in preparation for the listing of the Company’s shares on The Stock Exchange of Hong Kong Limited (the “HKSE”) in 2002, and pursuant to an approval document obtained from the relevant government authority dated 26 September 2002, the Company was restructured into a joint stock limited liability company.
The Company and its subsidiaries (hereinafter collectively referred to as the “Group”) are principally engaged in the provision of oilfield services including drilling services, well services, marine support services, and geophysical acquisition and surveying services.
In the opinion of the directors of the Company (the “Directors”), the holding company and the ultimate holding company of the Company is CNOOC, which is a state-owned enterprise incorporated in the PRC (“SOE”). The registered address of CNOOC is No. 25 Chaoyangmenbei Dajie, Dongcheng District, Beijing.
The interim condensed consolidated financial information is presented in Renminbi (“RMB”), which is also the functional currency of the Company.
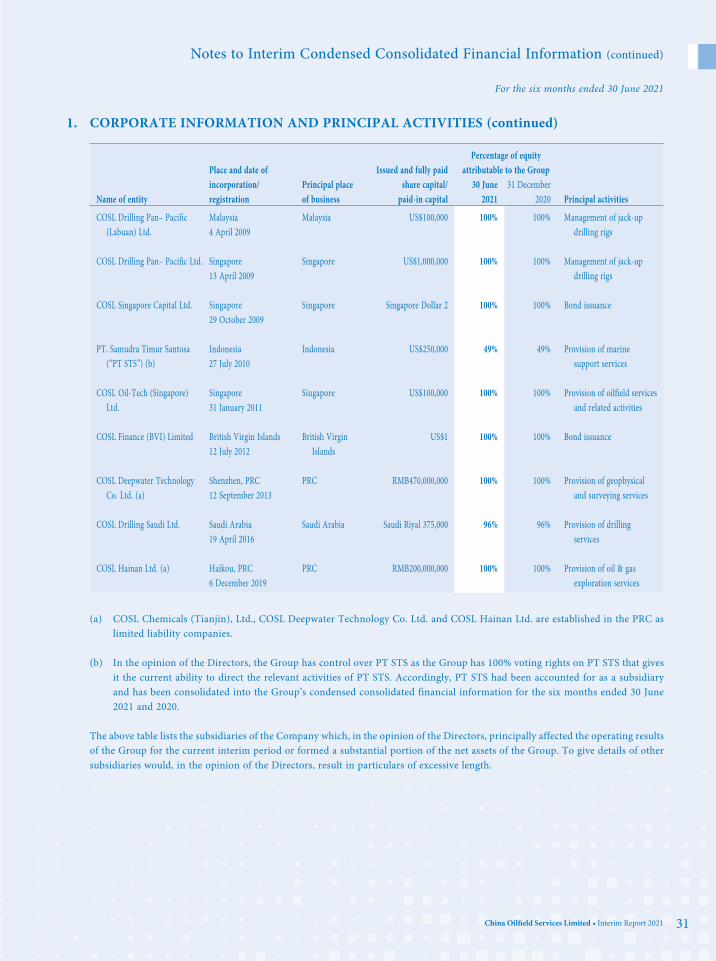
As at 30 June 2021, particulars of the principal subsidiaries of the Company are as follows:
Name of entity
Place and date of incorporation/registration
Principal place of business
Issued and fully paid share capital/
paid-in capital
Percentage of equity attributable to the Group
Principal activities30 June
202131 December
2020
COSL Chemicals (Tianjin), Ltd. (a)
Tianjin, PRC 7 September 1993
PRC RMB20,000,000 100% 100% Manufacture and marketing of drilling fluids
PT.COSL INDO Indonesia 1 August 2005
Indonesia US Dollar (“US$”) 400,000
100% 100% Provision of oil & gas exploration services
COSL– HongKong Limited Hong Kong 1 December 2005
Hong Kong Hong Kong Dollar 10,000 100% 100% Investment holding
COSL (Australia) Pty Ltd. Australia 11 January 2006
Australia Australian Dollar 10,000 100% 100% Provision of drilling services
COSL Drilling Strike Pte. Ltd. Singapore 29 October 2009
Singapore Singapore Dollar 2 100% 100% Provision of drilling services
COSL Prospector Pte. Ltd. Singapore 27 February 2007
Singapore US$189,779,384 100% 100% Provision of drilling services
COSL Mexico S.A.de C.V Mexico 26 May 2006
Mexico US$8,504,525 100% 100% Provision of drilling services
COSL (Middle East) FZE United Arab Emirates 2 July 2006
United Arab Emirates
UAE Dirhams 1,000,000 100% 100% Provision of oil & gas exploration services
COSL Norwegian AS (“CNA”) Norway 23 June 2008
Norway Norwegian Krone (“NOK”) 1,541,328,656
100% 100% Investment holding
Notes to Interim Condensed Consolidated Financial Information (continued)
China Oilfield Services Limited • Interim Report 2021 31
For the six months ended 30 June 2021
Name of entity
Place and date of incorporation/registration
Principal place of business
Issued and fully paid share capital/
paid-in capital
Percentage of equity attributable to the Group
Principal activities30 June
202131 December
2020
COSL Drilling Pan– Pacific (Labuan) Ltd.
Malaysia 4 April 2009
Malaysia US$100,000 100% 100% Management of jack-up drilling rigs
COSL Drilling Pan– Pacific Ltd. Singapore 13 April 2009
Singapore US$1,000,000 100% 100% Management of jack-up drilling rigs
COSL Singapore Capital Ltd. Singapore 29 October 2009
Singapore Singapore Dollar 2 100% 100% Bond issuance
PT. Samudra Timur Santosa (“PT STS”) (b)
Indonesia 27 July 2010
Indonesia US$250,000 49% 49% Provision of marine support services
COSL Oil-Tech (Singapore) Ltd.
Singapore 31 January 2011
Singapore US$100,000 100% 100% Provision of oilfield services and related activities
COSL Finance (BVI) Limited British Virgin Islands 12 July 2012
British Virgin Islands
US$1 100% 100% Bond issuance
COSL Deepwater Technology Co. Ltd. (a)
Shenzhen, PRC 12 September 2013
PRC RMB470,000,000 100% 100% Provision of geophysical and surveying services
COSL Drilling Saudi Ltd. Saudi Arabia 19 April 2016
Saudi Arabia Saudi Riyal 375,000 96% 96% Provision of drilling services
COSL Hainan Ltd. (a) Haikou, PRC 6 December 2019
PRC RMB200,000,000 100% 100% Provision of oil & gas exploration services
(a) COSL Chemicals (Tianjin), Ltd., COSL Deepwater Technology Co. Ltd. and COSL Hainan Ltd. are established in the PRC as limited liability companies.
(b) In the opinion of the Directors, the Group has control over PT STS as the Group has 100% voting rights on PT STS that gives it the current ability to direct the relevant activities of PT STS. Accordingly, PT STS had been accounted for as a subsidiary and has been consolidated into the Group’s condensed consolidated financial information for the six months ended 30 June 2021 and 2020.
The above table lists the subsidiaries of the Company which, in the opinion of the Directors, principally affected the operating results of the Group for the current interim period or formed a substantial portion of the net assets of the Group. To give details of other subsidiaries would, in the opinion of the Directors, result in particulars of excessive length.
1. CORPORATE INFORMATION AND PRINCIPAL ACTIVITIES (continued)
32 China Oilfield Services Limited • Interim Report 2021
Notes to Interim Condensed Consolidated Financial Information (continued)
For the six months ended 30 June 2021
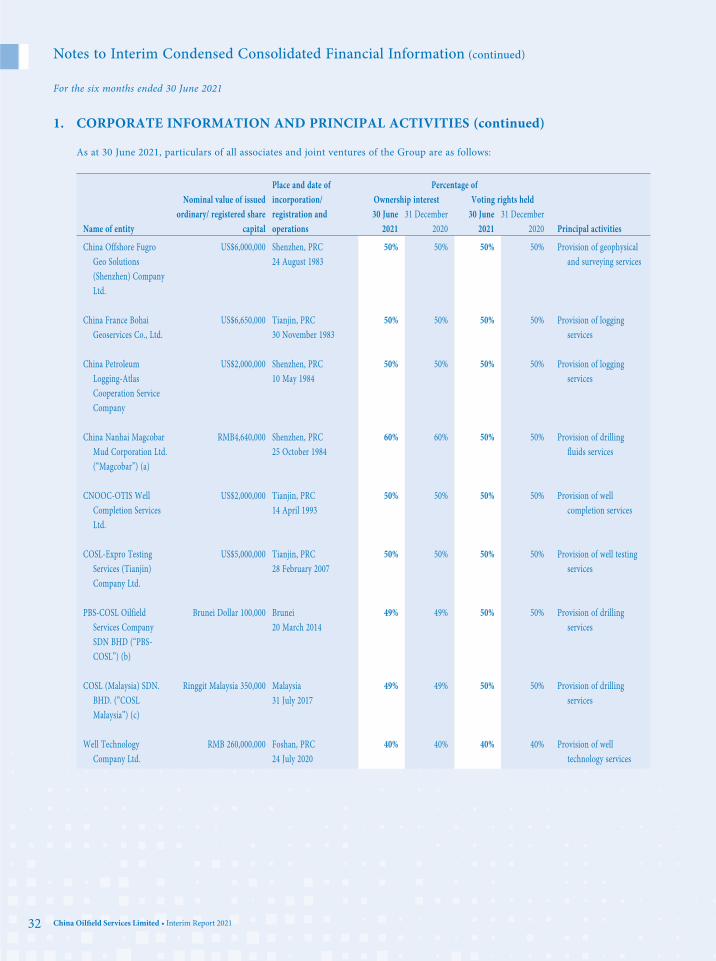
1. CORPORATE INFORMATION AND PRINCIPAL ACTIVITIES (continued)
As at 30 June 2021, particulars of all associates and joint ventures of the Group are as follows:
Name of entity
Nominal value of issued ordinary/ registered share
capital
Place and date of incorporation/ registration and operations
Percentage of
Principal activities
Ownership interest Voting rights held30 June
202131 December
202030 June
202131 December
2020
China Offshore Fugro Geo Solutions (Shenzhen) Company Ltd.
US$6,000,000 Shenzhen, PRC 24 August 1983
50% 50% 50% 50% Provision of geophysical and surveying services
China France Bohai Geoservices Co., Ltd.
US$6,650,000 Tianjin, PRC 30 November 1983
50% 50% 50% 50% Provision of logging services
China Petroleum Logging-Atlas Cooperation Service Company
US$2,000,000 Shenzhen, PRC 10 May 1984
50% 50% 50% 50% Provision of logging services
China Nanhai Magcobar Mud Corporation Ltd. (“Magcobar”) (a)
RMB4,640,000 Shenzhen, PRC 25 October 1984
60% 60% 50% 50% Provision of drilling fluids services
CNOOC-OTIS Well Completion Services Ltd.
US$2,000,000 Tianjin, PRC 14 April 1993
50% 50% 50% 50% Provision of well completion services
COSL-Expro Testing Services (Tianjin) Company Ltd.
US$5,000,000 Tianjin, PRC 28 February 2007
50% 50% 50% 50% Provision of well testing services
PBS-COSL Oilfield Services Company SDN BHD (“PBS- COSL”) (b)
Brunei Dollar 100,000 Brunei 20 March 2014
49% 49% 50% 50% Provision of drilling services
COSL (Malaysia) SDN.BHD. (“COSL Malaysia”) (c)
Ringgit Malaysia 350,000 Malaysia 31 July 2017
49% 49% 50% 50% Provision of drilling services
Well Technology Company Ltd.
RMB 260,000,000 Foshan, PRC 24 July 2020
40% 40% 40% 40% Provision of well technology services
Notes to Interim Condensed Consolidated Financial Information (continued)
China Oilfield Services Limited • Interim Report 2021 33
For the six months ended 30 June 2021
1. CORPORATE INFORMATION AND PRINCIPAL ACTIVITIES (continued)
(a) The Group has 60% of the equity interests in Magcobar, the remaining equity interests of which are held by the other sole investor. Pursuant to the articles of association of Magcobar, more than two-thirds of the voting rights in the board of directors are required for decisions on directing the relevant activities of this entity. The board of directors of Magcobar shall comprise five directors whereby the Company shall appoint three directors and the other sole investor shall appoint two directors. In the opinion of the Directors, the Group does not have control over Magcobar and the investment in this joint arrangement constitutes interest in a joint venture based on the rights and obligations of the parties to this joint arrangement.
(b) The Group has 49% of the equity interests in PBS-COSL, the remaining equity interests of which are held by the other sole investor. Pursuant to the articles of association of PBS-COSL, the board of directors of PBS-COSL shall comprise four directors whereby both the Company and the other sole investor shall appoint two directors each. Unanimous approvals by the directors of PBS-COSL are required for decisions on directing the relevant activities of PBS-COSL. In the opinion of the Directors, the Group does not have control over PBS-COSL and the investment in this joint arrangement constitutes interest in a joint venture based on the rights and obligations of the parties to this joint arrangement.
(c) The Group has 49% of equity interests in COSL Malaysia, the remaining equity interests of which are held by the other sole investor. Pursuant to the articles of association of COSL Malaysia, a majority of voting rights are required for decisions on directing the relevant activities of this entity. The board of directors of COSL Malaysia shall comprise five directors whereby the Group shall appoint two directors and the other sole investor shall appoint three directors, while the chairman of COSL Malaysia shall be appointed by the Group and the chairman has the right to veto any major decisions. As a result, unanimous consents by the Group and the other investor are required for decisions on directing the relevant activities of COSL Malaysia. In the opinion of the Directors, the Group does not have control over COSL Malaysia and the investment in this joint arrangement constitutes interest in a joint venture based on the rights and obligations of the parties to this joint arrangement. As at 30 June 2021, the Group has yet injected any capital into COSL Malaysia since the capital injection time according to the joint venture agreement has not due yet.
All of the above investments in associates and joint ventures are directly held by the Company except for COSL Malaysia, which is indirectly held through COSL Drilling Pan-Pacific Ltd.
The above associates and joint ventures are accounted for using the equity method in this condensed consolidated financial information.
2. BASIS OF PREPARATION
The condensed consolidated financial information for the six months ended 30 June 2021 has been prepared in accordance with HKAS 34 Interim Financial Reporting issued by the Hong Kong Institute of Certified Public Accountants (“HKICPA”) as well as with the applicable disclosure requirements of Appendix 16 to the Rules Governing the Listing of Securities on the HKSE.
The interim condensed consolidated financial information does not include all the information and disclosures required in the annual financial statements, and should be read in conjunction with the Group’s annual consolidated financial statements for the year ended 31 December 2020.

34 China Oilfield Services Limited • Interim Report 2021
Notes to Interim Condensed Consolidated Financial Information (continued)
For the six months ended 30 June 2021
3. CHANGES IN ACCOUNTING POLICIES
The accounting policies adopted in the preparation of the interim condensed consolidated financial information are consistent with those applied in the preparation of the Group’s annual consolidated financial statements for the year ended 31 December 2020, except for the adoption of the following revised Hong Kong Financial Reporting Standards (“HKFRSs”) for the first time for the current period’s financial information.
Amendments to HKFRS 9, HKAS 39, HKFRS 7, HKFRS 4 and HKFRS 16 Interest Rate Benchmark Reform – Phase 2
Amendment to HKFRS 16 Covid-19-Related Rent Concessions
The nature and impact of the revised HKFRSs are described below:
(a) Amendments to HKFRS 9, HKAS 39, HKFRS 7, HKFRS 4 and HKFRS 16 address issues not dealt with in the previous amendments which affect financial reporting when an existing interest rate benchmark is replaced with an alternative risk-free rate (“RFR”). The phase 2 amendments provide a practical expedient to allow the effective interest rate to be updated without adjusting the carrying amount of financial assets and liabilities when accounting for changes in the basis for determining the contractual cash flows of financial assets and liabilities, if the change is a direct consequence of the interest rate benchmark reform and the new basis for determining the contractual cash flows is economically equivalent to the previous basis immediately preceding the change. In addition, the amendments permit changes required by the interest rate benchmark reform to be made to hedge designations and hedge documentation without the hedging relationship being discontinued. Any gains or losses that could arise on transition are dealt with through the normal requirements of HKFRS 9 to measure and recognise hedge ineffectiveness. The amendments also provide a temporary relief to entities from having to meet the separately identifiable requirement when an RFR is designated as a risk component. The relief allows an entity, upon designation of the hedge, to assume that the separately identifiable requirement is met, provided the entity reasonably expects the RFR risk component to become separately identifiable within the next 24 months. Furthermore, the amendments require an entity to disclose additional information to enable users of financial statements to understand the effect of interest rate benchmark reform on an entity’s financial instruments and risk management strategy. These amendments had no material impact on the interim financial position and performance of the Group.
(b) Amendment to HKFRS 16 issued in April 2021 extends the availability of the practical expedient for lessees to elect not to apply lease modification accounting for rent concessions arising as a direct consequence of the covid-19 pandemic by 12 months. Accordingly, the practical expedient applies to rent concessions for which any reduction in lease payments affects only payments originally due on or before 30 June 2022, provided the other conditions for applying the practical expedient are met. The amendment is effective retrospectively for annual periods beginning on or after 1 April 2021 with any cumulative effect of initially applying the amendment recognised as an adjustment to the opening balance of retained profits at the beginning of the current accounting period. Earlier application is permitted. The amendment did not have any impact on the interim financial position and performance of the Group as there were no lease payments reduced or waived by the lessors as a result of the covid-19 pandemic during the period.
Notes to Interim Condensed Consolidated Financial Information (continued)
China Oilfield Services Limited • Interim Report 2021 35
For the six months ended 30 June 2021
4. OPERATING SEGMENT INFORMATION
The Group is organised into four business units based on the internal structure and management strategy, which is also the basis of information reported to the Group’s chief operating decision maker (i.e. the executive directors of the Company) for the purpose of making strategic decisions.
The Group has four reportable and operating segments as follows:
(a) the drilling services segment is engaged in the provision of oilfield drilling services;
(b) the well services segment is engaged in the provision of logging and downhole services, such as drilling fluids, directional drilling, cementing and well completion, the sale of well chemical materials and well workovers, and seismic data processing services;
(c) the marine support services segment is engaged in the transportation of materials, supplies and personnel to offshore facilities, moving and positioning drilling structures;
(d) the geophysical acquisition and surveying services segment is engaged in the provision of offshore seismic data collection and marine surveying.
Management monitors the results of the Group’s operating segments separately for the purpose of making decisions about resources allocation and performance assessment. Segment performance is evaluated based on reportable segment result, which is a measure of adjusted profit before tax. The adjusted profit before tax is measured consistently with the Group’s profit before tax except that interest income, finance costs, exchange gains/(losses), net, investment income and gains/(losses) arising from financial assets at fair value through profit or loss (“FVTPL”) are excluded from such measurement.
All assets are allocated to reportable segments other than certain cash and cash equivalents (funds managed by the corporate planning and finance department), pledged deposits, time deposits, certain other receivables, financial assets at FVTPL, debt instrument at amortised cost and deferred tax assets as these assets are managed on a group basis.
All liabilities are allocated to reportable segments other than loan from a related party, interest-bearing bank borrowings and long term bonds (funds managed by the corporate planning and finance department), certain other current liabilities, tax payable and deferred tax liabilities as these liabilities are managed on a group basis.
Intersegment sales and transfers are transacted with reference to the selling prices used for sales made to third parties at the prevailing market prices.
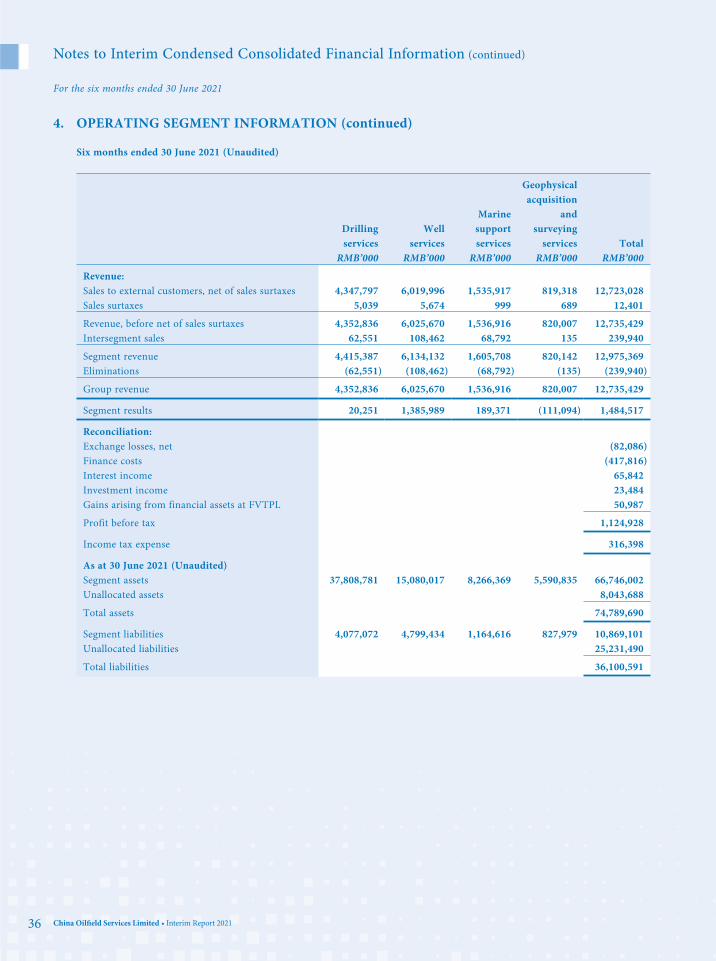
36 China Oilfield Services Limited • Interim Report 2021
Notes to Interim Condensed Consolidated Financial Information (continued)
For the six months ended 30 June 2021
4. OPERATING SEGMENT INFORMATION (continued)
Six months ended 30 June 2021 (Unaudited)
Drilling services
Well services
Marine support services
Geophysical acquisition
and surveying
services TotalRMB’000 RMB’000 RMB’000 RMB’000 RMB’000
Revenue:Sales to external customers, net of sales surtaxes 4,347,797 6,019,996 1,535,917 819,318 12,723,028Sales surtaxes 5,039 5,674 999 689 12,401
Revenue, before net of sales surtaxes 4,352,836 6,025,670 1,536,916 820,007 12,735,429Intersegment sales 62,551 108,462 68,792 135 239,940
Segment revenue 4,415,387 6,134,132 1,605,708 820,142 12,975,369Eliminations (62,551) (108,462) (68,792) (135) (239,940)
Group revenue 4,352,836 6,025,670 1,536,916 820,007 12,735,429
Segment results 20,251 1,385,989 189,371 (111,094) 1,484,517
Reconciliation:Exchange losses, net (82,086) Finance costs (417,816) Interest income 65,842Investment income 23,484Gains arising from financial assets at FVTPL 50,987
Profit before tax 1,124,928
Income tax expense 316,398
As at 30 June 2021 (Unaudited)Segment assets 37,808,781 15,080,017 8,266,369 5,590,835 66,746,002Unallocated assets 8,043,688
Total assets 74,789,690
Segment liabilities 4,077,072 4,799,434 1,164,616 827,979 10,869,101Unallocated liabilities 25,231,490
Total liabilities 36,100,591

Notes to Interim Condensed Consolidated Financial Information (continued)
China Oilfield Services Limited • Interim Report 2021 37
For the six months ended 30 June 2021
4. OPERATING SEGMENT INFORMATION (continued)
Six months ended 30 June 2020 (Unaudited)
Drilling services
Well services
Marine support services
Geophysical acquisition
and surveying
services TotalRMB’000 RMB’000 RMB’000 RMB’000 RMB’000
Revenue:Sales to external customers, net of sales surtaxes 6,171,011 6,050,385 1,534,262 741,005 14,496,663Sales surtaxes 2,932 9,495 1,667 600 14,694
Revenue, before net of sales surtaxes 6,173,943 6,059,880 1,535,929 741,605 14,511,357Intersegment sales 25,820 29,729 57,630 90 113,269
Segment revenue 6,199,763 6,089,609 1,593,559 741,695 14,624,626Eliminations (25,820) (29,729) (57,630) (90) (113,269)
Group revenue 6,173,943 6,059,880 1,535,929 741,605 14,511,357
Segment results 1,060,268 1,245,487 131,754 (63,281) 2,374,228
Reconciliation:Exchange gains, net 60,502Finance costs (477,248) Interest income 30,213Investment income 77,507Gains arising from financial assets at FVTPL 25,486
Profit before tax 2,090,688
Income tax expense 368,117
As at 31 December 2020 (Audited)Segment assets 38,748,467 12,572,299 7,747,673 4,402,933 63,471,372Unallocated assets 12,470,936
Total assets 75,942,308
Segment liabilities 3,912,895 5,801,358 1,363,215 768,187 11,845,655Unallocated liabilities 25,407,845
Total liabilities 37,253,500
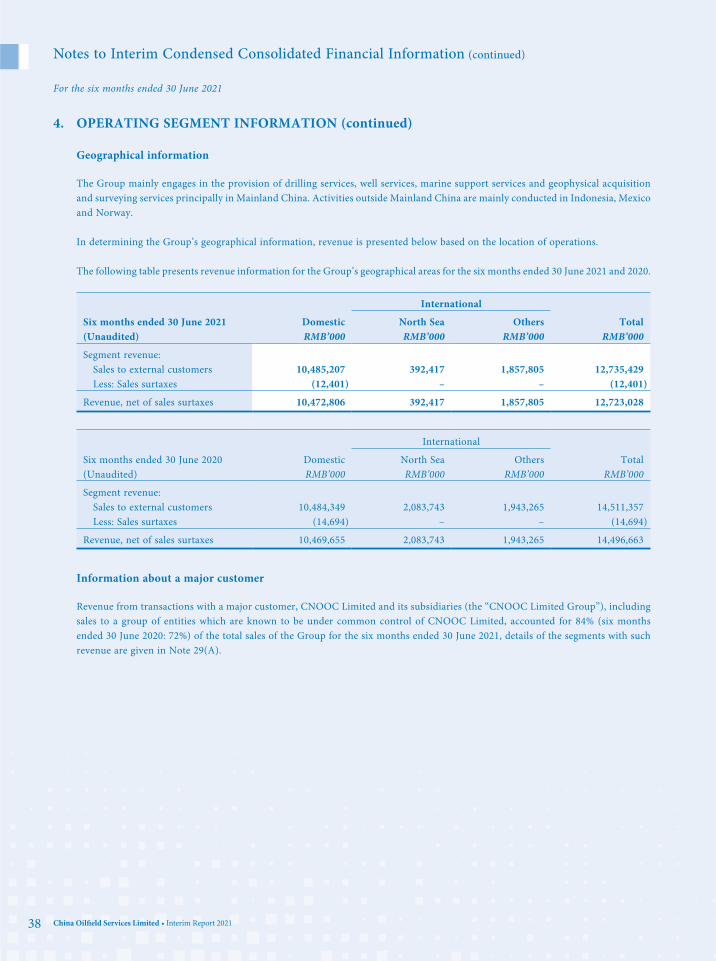
38 China Oilfield Services Limited • Interim Report 2021
Notes to Interim Condensed Consolidated Financial Information (continued)
For the six months ended 30 June 2021
4. OPERATING SEGMENT INFORMATION (continued)
Geographical information
The Group mainly engages in the provision of drilling services, well services, marine support services and geophysical acquisition and surveying services principally in Mainland China. Activities outside Mainland China are mainly conducted in Indonesia, Mexico and Norway.
In determining the Group’s geographical information, revenue is presented below based on the location of operations.
The following table presents revenue information for the Group’s geographical areas for the six months ended 30 June 2021 and 2020.
International
Six months ended 30 June 2021 (Unaudited)
Domestic North Sea Others TotalRMB’000 RMB’000 RMB’000 RMB’000
Segment revenue:Sales to external customers 10,485,207 392,417 1,857,805 12,735,429Less: Sales surtaxes (12,401) – – (12,401)
Revenue, net of sales surtaxes 10,472,806 392,417 1,857,805 12,723,028
International
Six months ended 30 June 2020 (Unaudited)
Domestic North Sea Others TotalRMB’000 RMB’000 RMB’000 RMB’000
Segment revenue:Sales to external customers 10,484,349 2,083,743 1,943,265 14,511,357Less: Sales surtaxes (14,694) – – (14,694)
Revenue, net of sales surtaxes 10,469,655 2,083,743 1,943,265 14,496,663
Information about a major customer
Revenue from transactions with a major customer, CNOOC Limited and its subsidiaries (the “CNOOC Limited Group”), including sales to a group of entities which are known to be under common control of CNOOC Limited, accounted for 84% (six months ended 30 June 2020: 72%) of the total sales of the Group for the six months ended 30 June 2021, details of the segments with such revenue are given in Note 29(A).

Notes to Interim Condensed Consolidated Financial Information (continued)
China Oilfield Services Limited • Interim Report 2021 39
For the six months ended 30 June 2021
5. REVENUE
Six months ended 30 June2021 2020
RMB’000 RMB’000(Unaudited) (Unaudited)
Revenue from contracts with customers 12,562,560 14,389,925Revenue arising from operating leases 172,869 121,432
12,735,429 14,511,357
Disaggregation of revenue from contracts with customers, before net of sales surtaxes for the six months ended 30 June 2021 and 2020
For the six months ended 30 June 2021 (Unaudited)
SegmentsDrilling services
Well services
Marine support services
Geophysical acquisition
and surveying
services TotalRMB’000 RMB’000 RMB’000 RMB’000 RMB’000
Timing of revenue recognitionGoods transferred at a point in time – 15,613 – 1,643 17,256Services transferred over time 4,179,967 6,010,057 1,536,916 818,364 12,545,304
Total 4,179,967 6,025,670 1,536,916 820,007 12,562,560
For the six months ended 30 June 2020 (Unaudited)
SegmentsDrilling services
Well services
Marine support services
Geophysical acquisition
and surveying
services TotalRMB’000 RMB’000 RMB’000 RMB’000 RMB’000
Timing of revenue recognitionGoods transferred at a point in time – 26,840 – 3,399 30,239Services transferred over time 6,052,511 6,033,040 1,535,929 738,206 14,359,686
Total 6,052,511 6,059,880 1,535,929 741,605 14,389,925
The Group’s most contracts with customers generally provide for payment on a day rate or operation volume basis. The Group elected to apply the practical expedient by recognising revenue in the amount to which the Group has right to invoice.
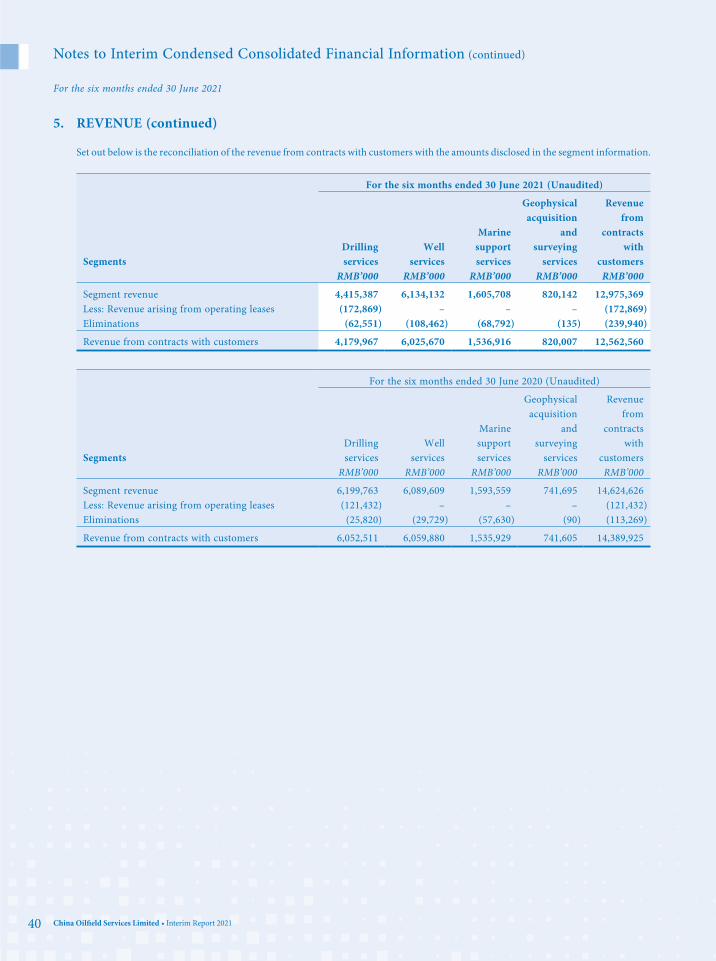
40 China Oilfield Services Limited • Interim Report 2021
Notes to Interim Condensed Consolidated Financial Information (continued)
For the six months ended 30 June 2021
5. REVENUE (continued)
Set out below is the reconciliation of the revenue from contracts with customers with the amounts disclosed in the segment information.
For the six months ended 30 June 2021 (Unaudited)
SegmentsDrilling services
Well services
Marine support services
Geophysical acquisition
and surveying
services
Revenue from
contracts with
customersRMB’000 RMB’000 RMB’000 RMB’000 RMB’000
Segment revenue 4,415,387 6,134,132 1,605,708 820,142 12,975,369Less: Revenue arising from operating leases (172,869) – – – (172,869) Eliminations (62,551) (108,462) (68,792) (135) (239,940)
Revenue from contracts with customers 4,179,967 6,025,670 1,536,916 820,007 12,562,560
For the six months ended 30 June 2020 (Unaudited)
SegmentsDrilling services
Well services
Marine support services
Geophysical acquisition
and surveying
services
Revenue from
contracts with
customersRMB’000 RMB’000 RMB’000 RMB’000 RMB’000
Segment revenue 6,199,763 6,089,609 1,593,559 741,695 14,624,626Less: Revenue arising from operating leases (121,432) – – – (121,432) Eliminations (25,820) (29,729) (57,630) (90) (113,269)
Revenue from contracts with customers 6,052,511 6,059,880 1,535,929 741,605 14,389,925
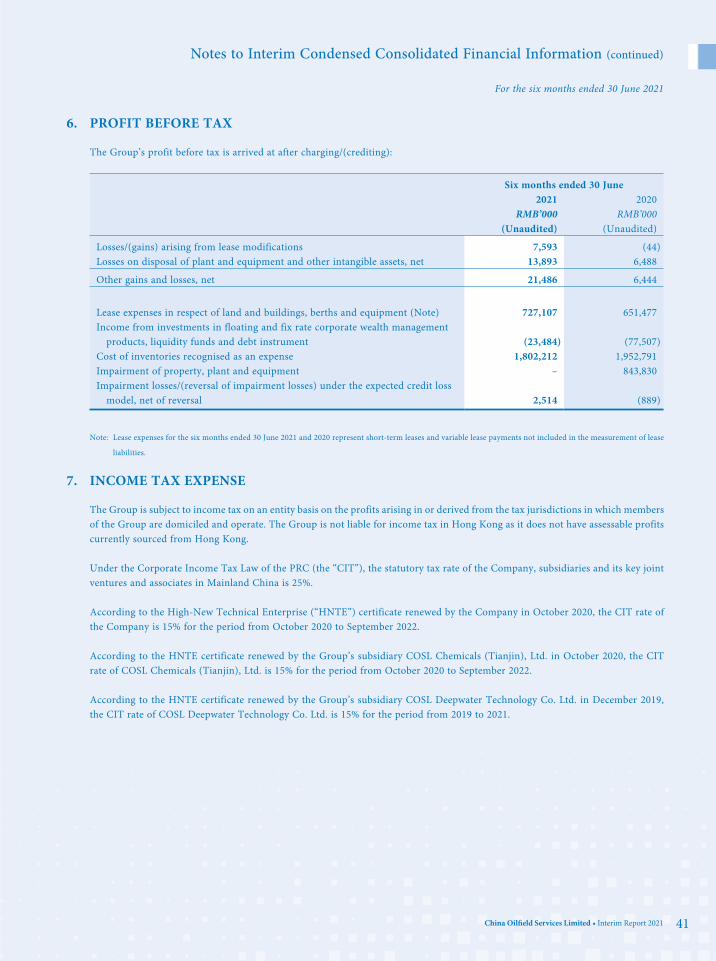
Notes to Interim Condensed Consolidated Financial Information (continued)
China Oilfield Services Limited • Interim Report 2021 41
For the six months ended 30 June 2021
6. PROFIT BEFORE TAX
The Group’s profit before tax is arrived at after charging/(crediting):
Six months ended 30 June2021 2020
RMB’000 RMB’000(Unaudited) (Unaudited)
Losses/(gains) arising from lease modifications 7,593 (44)Losses on disposal of plant and equipment and other intangible assets, net 13,893 6,488
Other gains and losses, net 21,486 6,444
Lease expenses in respect of land and buildings, berths and equipment (Note) 727,107 651,477Income from investments in floating and fix rate corporate wealth management
products, liquidity funds and debt instrument (23,484) (77,507) Cost of inventories recognised as an expense 1,802,212 1,952,791Impairment of property, plant and equipment – 843,830Impairment losses/(reversal of impairment losses) under the expected credit loss
model, net of reversal 2,514 (889)
Note: Lease expenses for the six months ended 30 June 2021 and 2020 represent short-term leases and variable lease payments not included in the measurement of lease
liabilities.
7. INCOME TAX EXPENSE
The Group is subject to income tax on an entity basis on the profits arising in or derived from the tax jurisdictions in which members of the Group are domiciled and operate. The Group is not liable for income tax in Hong Kong as it does not have assessable profits currently sourced from Hong Kong.
Under the Corporate Income Tax Law of the PRC (the “CIT”), the statutory tax rate of the Company, subsidiaries and its key joint ventures and associates in Mainland China is 25%.
According to the High-New Technical Enterprise (“HNTE”) certificate renewed by the Company in October 2020, the CIT rate of the Company is 15% for the period from October 2020 to September 2022.
According to the HNTE certificate renewed by the Group’s subsidiary COSL Chemicals (Tianjin), Ltd. in October 2020, the CIT rate of COSL Chemicals (Tianjin), Ltd. is 15% for the period from October 2020 to September 2022.
According to the HNTE certificate renewed by the Group’s subsidiary COSL Deepwater Technology Co. Ltd. in December 2019, the CIT rate of COSL Deepwater Technology Co. Ltd. is 15% for the period from 2019 to 2021.
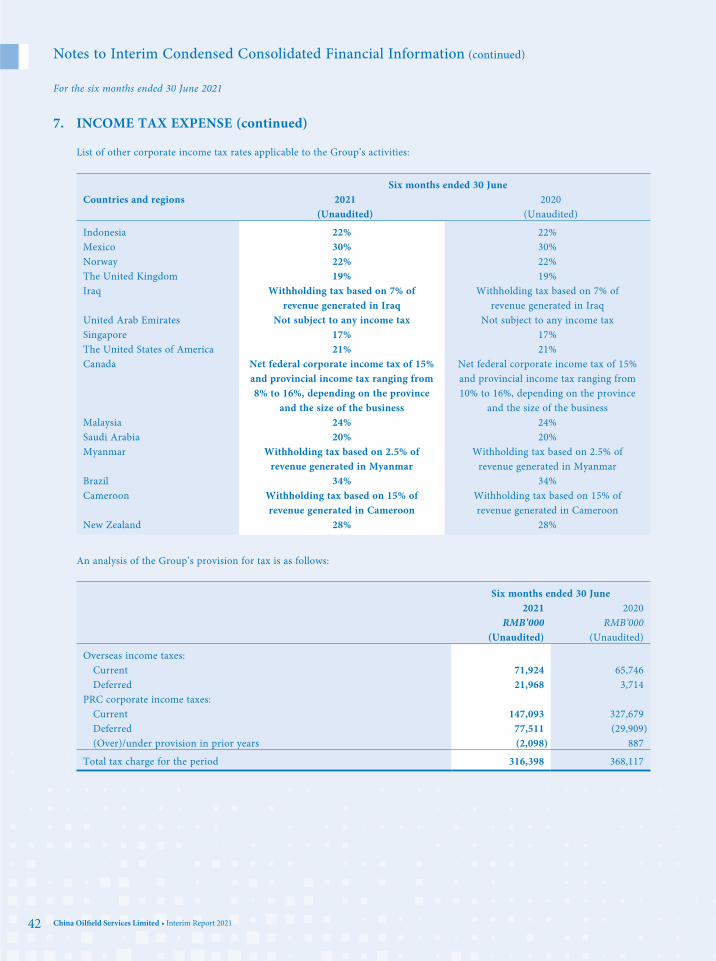
42 China Oilfield Services Limited • Interim Report 2021
Notes to Interim Condensed Consolidated Financial Information (continued)
For the six months ended 30 June 2021
7. INCOME TAX EXPENSE (continued)
List of other corporate income tax rates applicable to the Group’s activities:
Six months ended 30 JuneCountries and regions 2021 2020
(Unaudited) (Unaudited)
Indonesia 22% 22%Mexico 30% 30%Norway 22% 22%The United Kingdom 19% 19%Iraq Withholding tax based on 7% of
revenue generated in IraqWithholding tax based on 7% of
revenue generated in IraqUnited Arab Emirates Not subject to any income tax Not subject to any income taxSingapore 17% 17%The United States of America 21% 21%Canada Net federal corporate income tax of 15%
and provincial income tax ranging from 8% to 16%, depending on the province
and the size of the business
Net federal corporate income tax of 15% and provincial income tax ranging from 10% to 16%, depending on the province
and the size of the businessMalaysia 24% 24%Saudi Arabia 20% 20%Myanmar Withholding tax based on 2.5% of
revenue generated in MyanmarWithholding tax based on 2.5% of
revenue generated in MyanmarBrazil 34% 34%Cameroon Withholding tax based on 15% of
revenue generated in CameroonWithholding tax based on 15% of revenue generated in Cameroon
New Zealand 28% 28%
An analysis of the Group’s provision for tax is as follows:
Six months ended 30 June2021 2020
RMB’000 RMB’000(Unaudited) (Unaudited)
Overseas income taxes:Current 71,924 65,746Deferred 21,968 3,714
PRC corporate income taxes:Current 147,093 327,679Deferred 77,511 (29,909) (Over)/under provision in prior years (2,098) 887
Total tax charge for the period 316,398 368,117
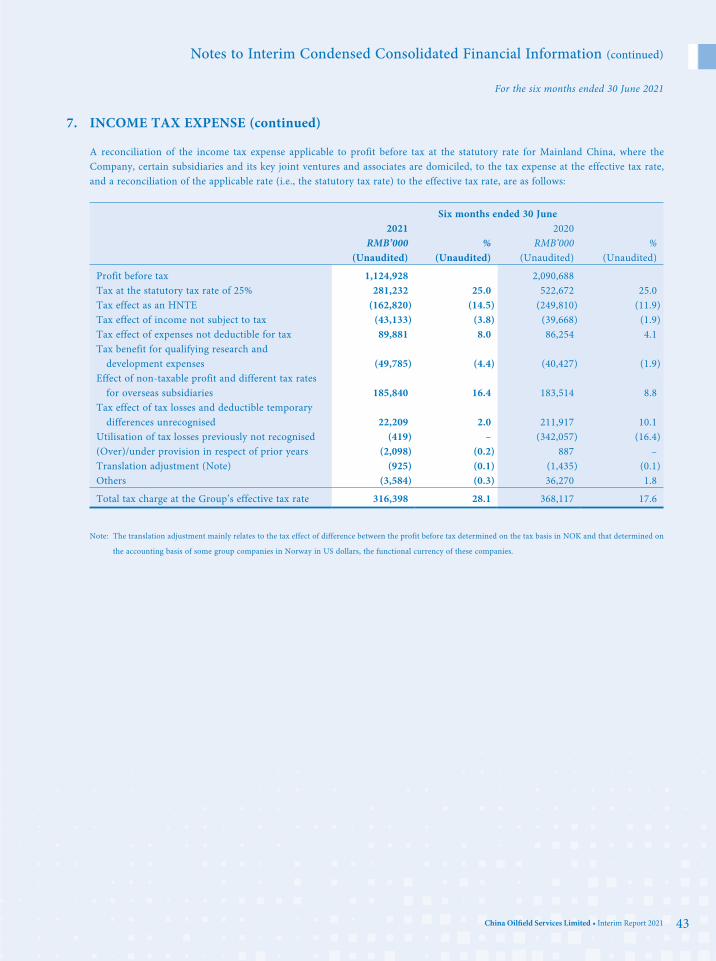
Notes to Interim Condensed Consolidated Financial Information (continued)
China Oilfield Services Limited • Interim Report 2021 43
For the six months ended 30 June 2021
7. INCOME TAX EXPENSE (continued)
A reconciliation of the income tax expense applicable to profit before tax at the statutory rate for Mainland China, where the Company, certain subsidiaries and its key joint ventures and associates are domiciled, to the tax expense at the effective tax rate, and a reconciliation of the applicable rate (i.e., the statutory tax rate) to the effective tax rate, are as follows:
Six months ended 30 June2021 2020
RMB’000 % RMB’000 %(Unaudited) (Unaudited) (Unaudited) (Unaudited)
Profit before tax 1,124,928 2,090,688Tax at the statutory tax rate of 25% 281,232 25.0 522,672 25.0Tax effect as an HNTE (162,820) (14.5) (249,810) (11.9) Tax effect of income not subject to tax (43,133) (3.8) (39,668) (1.9) Tax effect of expenses not deductible for tax 89,881 8.0 86,254 4.1Tax benefit for qualifying research and
development expenses (49,785) (4.4) (40,427) (1.9) Effect of non-taxable profit and different tax rates
for overseas subsidiaries 185,840 16.4 183,514 8.8Tax effect of tax losses and deductible temporary
differences unrecognised 22,209 2.0 211,917 10.1Utilisation of tax losses previously not recognised (419) – (342,057) (16.4) (Over)/under provision in respect of prior years (2,098) (0.2) 887 –Translation adjustment (Note) (925) (0.1) (1,435) (0.1) Others (3,584) (0.3) 36,270 1.8
Total tax charge at the Group’s effective tax rate 316,398 28.1 368,117 17.6
Note: The translation adjustment mainly relates to the tax effect of difference between the profit before tax determined on the tax basis in NOK and that determined on
the accounting basis of some group companies in Norway in US dollars, the functional currency of these companies.
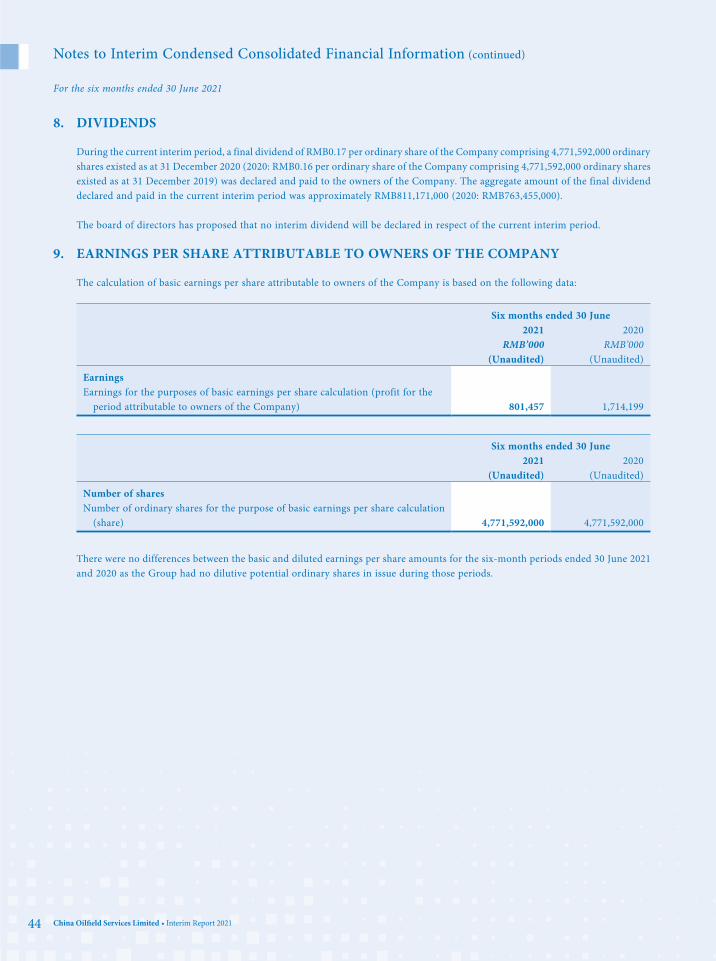
44 China Oilfield Services Limited • Interim Report 2021
Notes to Interim Condensed Consolidated Financial Information (continued)
For the six months ended 30 June 2021
8. DIVIDENDS
During the current interim period, a final dividend of RMB0.17 per ordinary share of the Company comprising 4,771,592,000 ordinary shares existed as at 31 December 2020 (2020: RMB0.16 per ordinary share of the Company comprising 4,771,592,000 ordinary shares existed as at 31 December 2019) was declared and paid to the owners of the Company. The aggregate amount of the final dividend declared and paid in the current interim period was approximately RMB811,171,000 (2020: RMB763,455,000).
The board of directors has proposed that no interim dividend will be declared in respect of the current interim period.
9. EARNINGS PER SHARE ATTRIBUTABLE TO OWNERS OF THE COMPANY
The calculation of basic earnings per share attributable to owners of the Company is based on the following data:
Six months ended 30 June2021 2020
RMB’000 RMB’000(Unaudited) (Unaudited)
EarningsEarnings for the purposes of basic earnings per share calculation (profit for the
period attributable to owners of the Company) 801,457 1,714,199
Six months ended 30 June2021 2020
(Unaudited) (Unaudited)
Number of sharesNumber of ordinary shares for the purpose of basic earnings per share calculation
(share) 4,771,592,000 4,771,592,000
There were no differences between the basic and diluted earnings per share amounts for the six-month periods ended 30 June 2021 and 2020 as the Group had no dilutive potential ordinary shares in issue during those periods.
Notes to Interim Condensed Consolidated Financial Information (continued)
China Oilfield Services Limited • Interim Report 2021 45
For the six months ended 30 June 2021
10. PROPERTY, PLANT AND EQUIPMENT
During the six months ended 30 June 2021, the Group acquired certain machinery equipment, vessels and drilling rigs with an aggregate cost amounting to approximately RMB1,206,355,000 (six months ended 30 June 2020: RMB928,087,000), of which approximately RMB857,957,000 was transferred from construction in progress (six months ended 30 June 2020: RMB580,365,000). Additions of construction in progress amounting to approximately RMB733,304,000 were recognised during the six months ended 30 June 2021 (six months ended 30 June 2020: RMB567,669,000). Drilling rigs, machinery and equipment with an aggregate net carrying amount of RMB18,327,000 (six months ended 30 June 2020: RMB10,115,000) were disposed of during the six months ended 30 June 2021, resulting in a loss on disposal of RMB13,893,000 (six months ended 30 June 2020: loss on disposal of RMB6,488,000).
Out of the total finance costs incurred, no finance costs (six months ended 30 June 2020: nil) was capitalised in property, plant and equipment in the six months ended 30 June 2021.
No impairment losses are recognised in the six months ended 30 June 2021 (six months ended 30 June 2020: RMB843,830,000) after the Group’s due impairment assessment in the light of the current economic environment in certain markets in which the Group operates as well as the slow recovery of oil price.
In the said impairment assessment, the recoverable amount of the relevant assets, each of which was identified as a cash-generating unit within the drilling services segment, marine support services segment and geophysical acquisition and surveying services segment, has been determined based on the higher of fair value less costs of disposal and value in use.
The fair value less costs of disposal is arrived at on the basis of valuation carried out by an independent property agent. The fair values of relevant assets are determined based on a variety of valuation methods, including the income approach and market approach, and the reasonableness of the assumptions and range of estimates indicated by those valuation methods were also considered by the Group. The income approach is by reference to the projected discounted cash flows over the remaining economic life of relevant assets. The market approach is by reference to the value that would be received from selling the asset in an orderly transaction between market participants at the measurement date. The above estimates of fair value required to use significant unobservable inputs representative of a level 3 fair value measurement, including historical contracted sales prices for similar assets, non-binding quotes from brokers and/or indicative bids, estimated utilisation rates, service prices, cost level and capital requirements.
In assessing value in use, the estimated future cash flows are discounted to their present value. The cash flow projection was based on financial budgets covering a five-year period approved by senior management. The cash flow beyond the five-year period is estimated based on the market trend and by reference to the relevant market trend report. The discount rate applied to the cash flow projection is 7.0%-9.4% (six months ended 30 June 2020: 7.0%-8.6%). The discount rate used is a long-term weighted-average cost of capital, which is based on management’s best estimation of the investment returns that market participants would require for the relevant assets. Other key assumptions for the value in use calculations reflect management’s judgements and expectation regarding the past performance of the relevant assets, as well as future industry conditions and operations, including estimated utilisation rates, day rates, cost level and capital requirements.
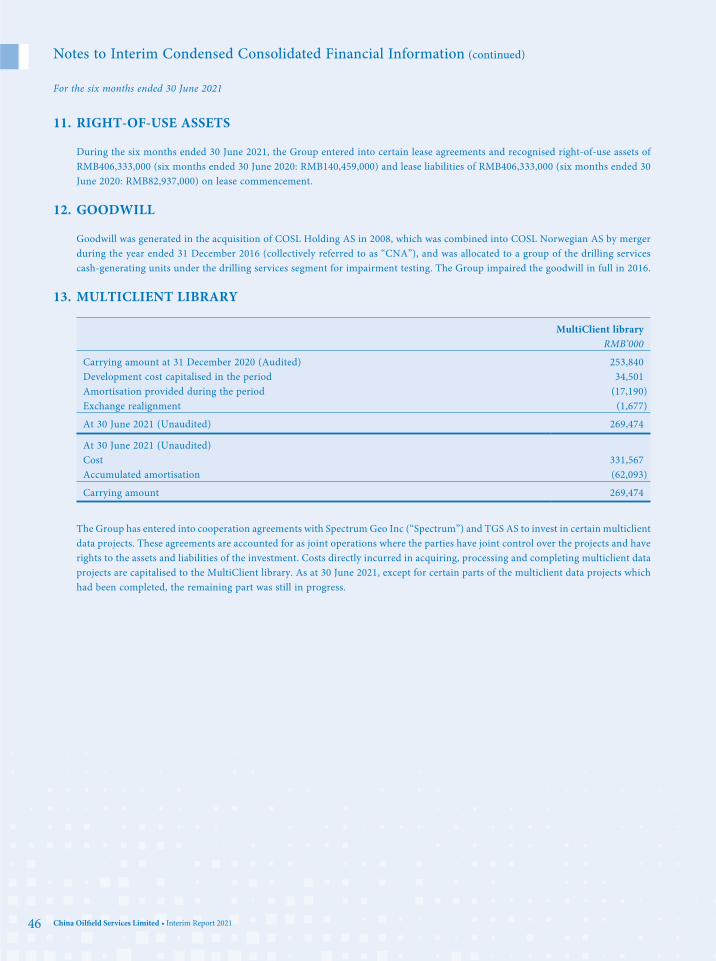
46 China Oilfield Services Limited • Interim Report 2021
Notes to Interim Condensed Consolidated Financial Information (continued)
For the six months ended 30 June 2021
11. RIGHT-OF-USE ASSETS
During the six months ended 30 June 2021, the Group entered into certain lease agreements and recognised right-of-use assets of RMB406,333,000 (six months ended 30 June 2020: RMB140,459,000) and lease liabilities of RMB406,333,000 (six months ended 30 June 2020: RMB82,937,000) on lease commencement.
12. GOODWILL
Goodwill was generated in the acquisition of COSL Holding AS in 2008, which was combined into COSL Norwegian AS by merger during the year ended 31 December 2016 (collectively referred to as “CNA”), and was allocated to a group of the drilling services cash-generating units under the drilling services segment for impairment testing. The Group impaired the goodwill in full in 2016.
13. MULTICLIENT LIBRARY
MultiClient libraryRMB’000
Carrying amount at 31 December 2020 (Audited) 253,840Development cost capitalised in the period 34,501Amortisation provided during the period (17,190) Exchange realignment (1,677)
At 30 June 2021 (Unaudited) 269,474
At 30 June 2021 (Unaudited)Cost 331,567Accumulated amortisation (62,093)
Carrying amount 269,474
The Group has entered into cooperation agreements with Spectrum Geo Inc (“Spectrum”) and TGS AS to invest in certain multiclient data projects. These agreements are accounted for as joint operations where the parties have joint control over the projects and have rights to the assets and liabilities of the investment. Costs directly incurred in acquiring, processing and completing multiclient data projects are capitalised to the MultiClient library. As at 30 June 2021, except for certain parts of the multiclient data projects which had been completed, the remaining part was still in progress.

Notes to Interim Condensed Consolidated Financial Information (continued)
China Oilfield Services Limited • Interim Report 2021 47
For the six months ended 30 June 2021
14. ACCOUNTS RECEIVABLE
The Group normally allows a credit period of 30 to 45 days to its trade customers in Mainland China and no more than 6 months to 1 year to its trade customers with good trading history overseas.
The following is an ageing analysis of accounts receivable net of allowance for credit losses, as at the end of the reporting period, presented based on the invoice dates.
30 June 2021
31 December 2020
RMB’000 RMB’000(Unaudited) (Audited)
Outstanding balances aged:Within six months 12,696,440 9,543,578Six months to one year 877,908 497,115One year to two years 200,065 125,692Over two years 96,545 45,827
13,870,958 10,212,212
15. IMPAIRMENT LOSSES UNDER THE EXPECTED CREDIT LOSS MODEL, NET OF REVERSAL
Six months ended 30 June2021 2020
RMB’000 RMB’000(Unaudited) (Unaudited)
Impairment losses recognised/(reversed) onAccounts receivable (812) 1,623Other receivables 3,326 (2,512)
2,514 (889)
The basis of determining the inputs and assumptions and the estimation techniques used in the condensed consolidated financial information for the six months ended 30 June 2021 are the same as those followed in the preparation of the Group’s annual financial statements for the year ended 31 December 2020.
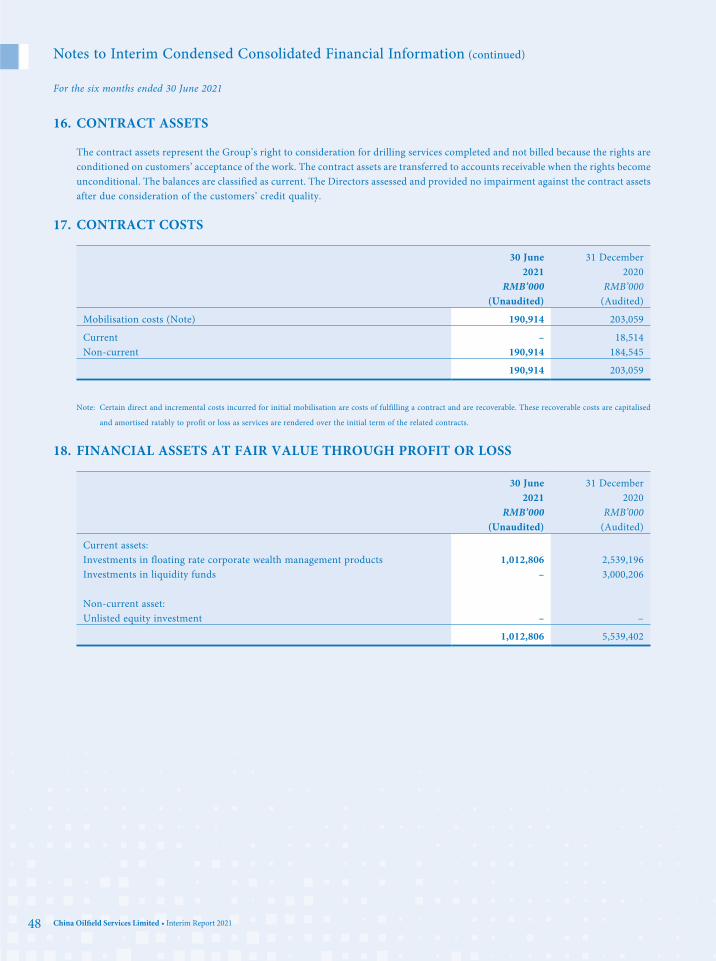
48 China Oilfield Services Limited • Interim Report 2021
Notes to Interim Condensed Consolidated Financial Information (continued)
For the six months ended 30 June 2021
16. CONTRACT ASSETS
The contract assets represent the Group’s right to consideration for drilling services completed and not billed because the rights are conditioned on customers’ acceptance of the work. The contract assets are transferred to accounts receivable when the rights become unconditional. The balances are classified as current. The Directors assessed and provided no impairment against the contract assets after due consideration of the customers’ credit quality.
17. CONTRACT COSTS
30 June 2021
31 December 2020
RMB’000 RMB’000(Unaudited) (Audited)
Mobilisation costs (Note) 190,914 203,059
Current – 18,514Non-current 190,914 184,545
190,914 203,059
Note: Certain direct and incremental costs incurred for initial mobilisation are costs of fulfilling a contract and are recoverable. These recoverable costs are capitalised
and amortised ratably to profit or loss as services are rendered over the initial term of the related contracts.
18. FINANCIAL ASSETS AT FAIR VALUE THROUGH PROFIT OR LOSS
30 June 2021
31 December 2020
RMB’000 RMB’000(Unaudited) (Audited)
Current assets:Investments in floating rate corporate wealth management products 1,012,806 2,539,196Investments in liquidity funds – 3,000,206
Non-current asset:Unlisted equity investment – –
1,012,806 5,539,402

Notes to Interim Condensed Consolidated Financial Information (continued)
China Oilfield Services Limited • Interim Report 2021 49
For the six months ended 30 June 2021
19. DEBT INSTRUMENT AT AMORTISED COST
The balance represents a debt instrument invested by the Group, carrying annual interest rate of 3.8% and maturing on 27 December 2021. The Group is going to hold the instrument until maturity and therefore measures it at amortised cost.
20. OTHER CURRENT ASSETS/LIABILITIES AND OTHER NON-CURRENT ASSETS
30 June 2021
31 December 2020
RMB’000 RMB’000(Unaudited) (Audited)
Value-added tax to be deducted and prepaid 376,441 90,178Value-added tax recoverable – 35,173
Other current assets 376,441 125,351
Output value-added tax to be recognised (652,325) (314,191)
Other current liabilities (652,325) (314,191)
Time deposits 1,500,000 –Deposits paid for the acquisition of property, plant and equipment 13,000 25,588Value-added tax recoverable 164,275 130,545Income tax recoverable 16,475 2,627
Other non-current assets 1,693,750 158,760
21. TRADE AND OTHER PAYABLES
30 June 2021
31 December 2020
RMB’000 RMB’000(Unaudited) (Audited)
Trade payables 7,574,397 8,846,958Other payables 477,336 546,093
8,051,733 9,393,051
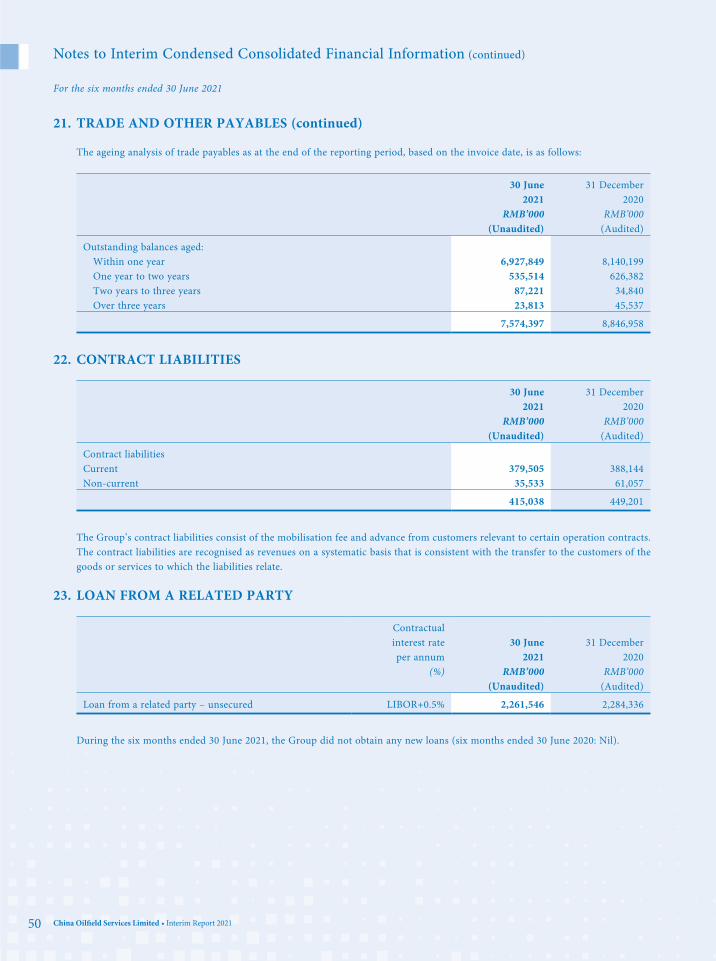
50 China Oilfield Services Limited • Interim Report 2021
Notes to Interim Condensed Consolidated Financial Information (continued)
For the six months ended 30 June 2021
21. TRADE AND OTHER PAYABLES (continued)
The ageing analysis of trade payables as at the end of the reporting period, based on the invoice date, is as follows:
30 June 2021
31 December 2020
RMB’000 RMB’000(Unaudited) (Audited)
Outstanding balances aged:Within one year 6,927,849 8,140,199One year to two years 535,514 626,382Two years to three years 87,221 34,840Over three years 23,813 45,537
7,574,397 8,846,958
22. CONTRACT LIABILITIES
30 June 2021
31 December 2020
RMB’000 RMB’000(Unaudited) (Audited)
Contract liabilitiesCurrent 379,505 388,144Non-current 35,533 61,057
415,038 449,201
The Group’s contract liabilities consist of the mobilisation fee and advance from customers relevant to certain operation contracts. The contract liabilities are recognised as revenues on a systematic basis that is consistent with the transfer to the customers of the goods or services to which the liabilities relate.
23. LOAN FROM A RELATED PARTY
Contractual interest rate per annum
30 June 2021
31 December 2020
(%) RMB’000 RMB’000(Unaudited) (Audited)
Loan from a related party – unsecured LIBOR+0.5% 2,261,546 2,284,336
During the six months ended 30 June 2021, the Group did not obtain any new loans (six months ended 30 June 2020: Nil).
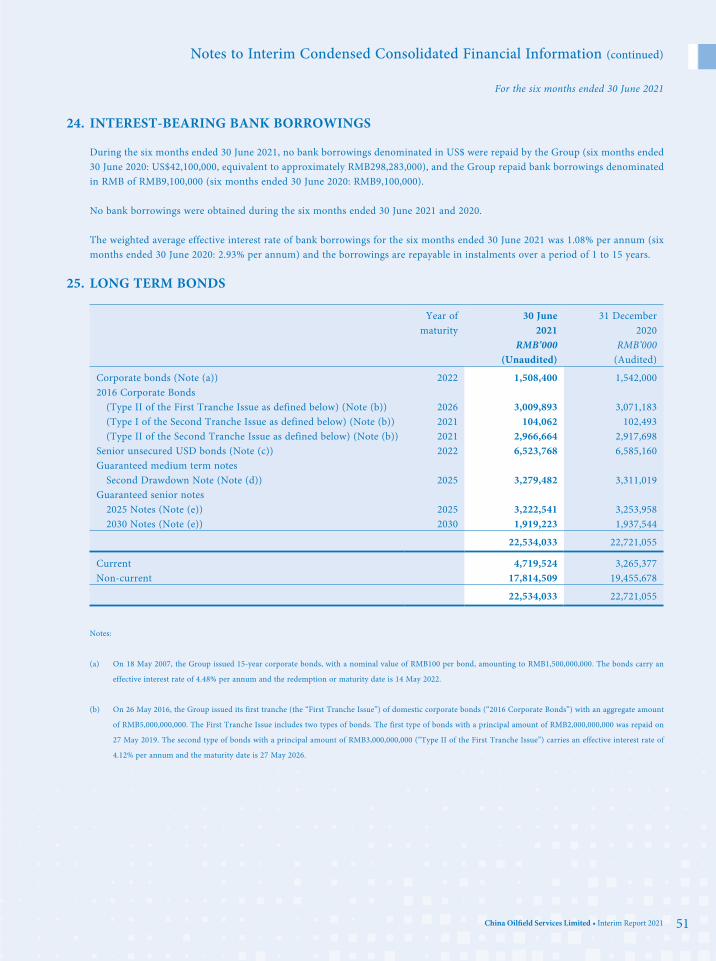
Notes to Interim Condensed Consolidated Financial Information (continued)
China Oilfield Services Limited • Interim Report 2021 51
For the six months ended 30 June 2021
24. INTEREST-BEARING BANK BORROWINGS
During the six months ended 30 June 2021, no bank borrowings denominated in US$ were repaid by the Group (six months ended 30 June 2020: US$42,100,000, equivalent to approximately RMB298,283,000), and the Group repaid bank borrowings denominated in RMB of RMB9,100,000 (six months ended 30 June 2020: RMB9,100,000).
No bank borrowings were obtained during the six months ended 30 June 2021 and 2020.
The weighted average effective interest rate of bank borrowings for the six months ended 30 June 2021 was 1.08% per annum (six months ended 30 June 2020: 2.93% per annum) and the borrowings are repayable in instalments over a period of 1 to 15 years.
25. LONG TERM BONDS
Year of maturity
30 June 2021
31 December 2020
RMB’000 RMB’000(Unaudited) (Audited)
Corporate bonds (Note (a)) 2022 1,508,400 1,542,0002016 Corporate Bonds
(Type II of the First Tranche Issue as defined below) (Note (b)) 2026 3,009,893 3,071,183(Type I of the Second Tranche Issue as defined below) (Note (b)) 2021 104,062 102,493(Type II of the Second Tranche Issue as defined below) (Note (b)) 2021 2,966,664 2,917,698
Senior unsecured USD bonds (Note (c)) 2022 6,523,768 6,585,160Guaranteed medium term notes
Second Drawdown Note (Note (d)) 2025 3,279,482 3,311,019Guaranteed senior notes
2025 Notes (Note (e)) 2025 3,222,541 3,253,9582030 Notes (Note (e)) 2030 1,919,223 1,937,544
22,534,033 22,721,055
Current 4,719,524 3,265,377Non-current 17,814,509 19,455,678
22,534,033 22,721,055
Notes:
(a) On 18 May 2007, the Group issued 15-year corporate bonds, with a nominal value of RMB100 per bond, amounting to RMB1,500,000,000. The bonds carry an
effective interest rate of 4.48% per annum and the redemption or maturity date is 14 May 2022.
(b) On 26 May 2016, the Group issued its first tranche (the “First Tranche Issue”) of domestic corporate bonds (“2016 Corporate Bonds”) with an aggregate amount
of RMB5,000,000,000. The First Tranche Issue includes two types of bonds. The first type of bonds with a principal amount of RMB2,000,000,000 was repaid on
27 May 2019. The second type of bonds with a principal amount of RMB3,000,000,000 (“Type II of the First Tranche Issue”) carries an effective interest rate of
4.12% per annum and the maturity date is 27 May 2026.
52 China Oilfield Services Limited • Interim Report 2021
Notes to Interim Condensed Consolidated Financial Information (continued)
For the six months ended 30 June 2021
25. LONG TERM BONDS (continued)
Notes: (continued)
(b) (continued)
On 21 October 2016, the Group issued its second tranche (the “Second Tranche Issue”) of 2016 Corporate Bonds with an aggregate amount of RMB5,000,000,000.
The Second Tranche Issue includes two types of bonds. The first type of bonds with a principal amount of RMB2,100,000,000 (“Type I of the Second Tranche
Issue”) is repayable on 24 October 2021. The Group has the right to adjust or not to adjust the coupon rate for the fourth and fifth years at the end of the third
year on 24 October 2019 by giving a notice to the bondholders. The bondholders have the right to require the Group to redeem Type I of the Second Tranche
Issue at a redemption price equal to 100% of the principal plus accrued and unpaid interest to such redemption date whether the Group chose to adjust the coupon
rate or not. The remaining bonds will be subject to the interest rate offered by the Group at the end of the third year until the maturity date. The effective interest
rate of Type I of the Second Tranche Issue is 3.13% per annum. During the year of 2019, the RMB1,998,100,000 principal of Type I of the Second Tranche was
redeemed as required by the bondholders. According to the market environment, the Group chose not to adjust the coupon rate for the fourth and fifth years,
that is, the coupon rate remains at 3.08% in the following interest-bearing years. The remaining Type I of the Second Tranche Issue of RMB101,900,000 will be
held until the maturity date on 24 October 2021.
The second type of bonds with a principal amount of RMB2,900,000,000 (“Type II of the Second Tranche Issue”) is repayable on 24 October 2023. The Group
has the right not to adjust or to adjust the coupon rate for the sixth and seventh years at the end of the fifth year on 24 October 2021 by giving a notice to the
bondholders. The bondholders may accordingly at their option to require the Group to redeem Type II of the Second Tranche Issue at a redemption price equal
to 100% of the principal plus accrued and unpaid interest to such redemption date. The remaining bonds will be subject to the interest rate offered by the Group
at the end of the fifth year until the maturity date. The effective interest rate of Type II of the Second Tranche Issue is 3.38% per annum.
(c) On 6 September 2012, COSL Finance (BVI) Limited, a subsidiary of the Company, issued 10-year senior unsecured USD bonds, with a US$1,000,000,000 principal
amount. The redemption or maturity date is 6 September 2022. The effective interest rate of the senior unsecured bonds is 3.38% per annum.
(d) On 20 July 2015, COSL Singapore Capital Ltd., a wholly-owned subsidiary of the Company, established the Euro medium term note programme (the “EMTN
Programme”). Under the EMTN Programme, COSL Singapore Capital Ltd. may issue drawdown notes in tranches up to an aggregate principal amount of
US$3,500,000,000. The Company has unconditionally and irrevocably guaranteed the due and punctual payment of the EMTN Programme.
On 30 July 2015, COSL Singapore Capital Ltd. issued the second tranche of drawdown note under the EMTN Programme with a nominal amount of US$500,000,000
(the “Second Drawdown Note”). The effective interest rate is 4.58% per annum after taking into consideration of initial transaction costs. The principal of the
Second Drawdown Note will be repaid on 30 July 2025.
(e) On 24 June 2020, COSL Singapore Capital Ltd., a wholly-owned subsidiary of the Company, issued two tranches of Guaranteed Senior Notes. The Company has
unconditionally and irrevocably guaranteed the due and punctual payment of the Guaranteed Senior Notes.
The first tranche of the notes (the “2025 Notes”) are 5-year guaranteed senior notes, with a US$500,000,000 principal amount. The redemption or maturity date
is 24 June 2025. The effective interest rate of the 2025 Notes is 1.94% per annum.
The second tranche of the notes (the “2030 Notes”) are 10-year guaranteed senior notes, with a US$300,000,000 principal amount. The redemption or maturity
date is 24 June 2030. The effective interest rate of the 2030 Notes is 2.62% per annum.
Notes to Interim Condensed Consolidated Financial Information (continued)
China Oilfield Services Limited • Interim Report 2021 53
For the six months ended 30 June 2021
26. DEFERRED INCOME
Deferred income consists of the contract value acquired in the process of the acquisition of CNA, government grants, and the difference between proceeds received from loans at a below-market rate granted by a wholly-owned subsidiary of a state-owned bank and the fair value of the loans at initial recognition based on the prevailing market interest rate (the “Others”). The deferred income acquired from contract value is amortised according to the related drilling contract periods and is credited to the revenue of the Group. The deferred income received from the government and the others are recognised according to the depreciable periods of the related assets and the periods in which the related costs are incurred, respectively, and are credited to other income of the Group.
Contract valueGovernment grant
related to assetsGovernment grant
related to income Others TotalRMB’000 RMB’000 RMB’000 RMB’000 RMB’000
At 1 January 2020 (Audited) 86,591 179,833 62,361 72,769 401,554Additions – 6,327 64,475 – 70,802Credited to profit or loss (75,541) (23,101) (86,033) (7,615) (192,290) Exchange realignment (1,520) – (60) – (1,580)
At 31 December 2020 (Audited) 9,530 163,059 40,743 65,154 278,486
Additions – – 15,946 – 15,946Credited to profit or loss (9,380) (6,822) (25,663) (3,646) (45,511) Exchange realignment (150) – (17) – (167)
At 30 June 2021 (Unaudited) – 156,237 31,009 61,508 248,754
27. ISSUED CAPITAL
30 June 2021
31 December 2020
RMB’000 RMB’000(Unaudited) (Audited)
Registered, issued and fully paid:H shares of RMB1.00 each 1,811,124 1,811,124A shares of RMB1.00 each 2,960,468 2,960,468
4,771,592 4,771,592
28. COMMITMENTS
Capital commitments
The Group had the following capital commitments, principally for construction and purchases of property, plant and equipment at the end of the reporting period:
30 June 2021
31 December 2020
RMB’000 RMB’000(Unaudited) (Audited)
Contracted, but not provided for 1,096,811 1,477,742

54 China Oilfield Services Limited • Interim Report 2021
Notes to Interim Condensed Consolidated Financial Information (continued)
For the six months ended 30 June 2021
29. RELATED PARTY TRANSACTIONS
As disclosed in Note 1, the Company is a subsidiary of CNOOC, which is a SOE subject to the control of the State Council of the PRC Government. The Group has extensive transactions and relationships with the members of CNOOC. The transactions were made on terms agreed among the parties. The Directors are of the opinion that the transactions with related parties were conducted in the ordinary course of business.
(A) Related party transactions and outstanding balances with related parties
In addition to the transactions and balances detailed elsewhere in these condensed consolidated financial information, the following is a summary of significant transactions carried out between the Group and (i) CNOOC Limited Group; (ii) CNOOC and its subsidiaries, excluding the CNOOC Limited Group (the “CNOOC Group’’); (iii) the Group’s associates and joint ventures; and (iv) associates invested by CNOOC.
a. Included in revenue
Six months ended 30 June2021 2020
RMB’000 RMB’000(Unaudited) (Unaudited)
i. CNOOC Limited GroupProvision of drilling services 3,267,393 3,029,551Provision of well services 5,187,379 5,466,345Provision of marine support services 1,348,124 1,407,964Provision of geophysical acquisition and surveying services 757,899 616,817
10,560,795 10,520,677
ii. CNOOC GroupProvision of drilling services 804 44,602Provision of well services 50,920 46,190Provision of marine support services 80,615 15,492Provision of geophysical acquisition and surveying services 24,357 15,092
156,696 121,376
iii. Associates and joint venturesProvision of well services 6,717 16,487Provision of geophysical acquisition and surveying services 2,856 –
9,573 16,487
iv. Associates invested by CNOOCProvision of drilling services – 1,742Provision of well services 1,871 6,608
1,871 8,350
Notes to Interim Condensed Consolidated Financial Information (continued)
China Oilfield Services Limited • Interim Report 2021 55
For the six months ended 30 June 2021
29. RELATED PARTY TRANSACTIONS (continued)
(A) Related party transactions and outstanding balances with related parties (continued)
b. Included in operating expenses
Six months ended 30 June2021 2020
RMB’000 RMB’000(Unaudited) (Unaudited)
i. CNOOC Limited GroupMaterials, utilities and other ancillary services 5,196 14,253Transportation services – 74
5,196 14,327
Property services 3,846 2,532
9,042 16,859
ii. CNOOC GroupMaterials, utilities and other ancillary services 690,827 561,986Transportation services 20,618 6,915Leasing of equipment 31,373 60,645Repair and maintenance services 4,623 4,029Management services 583 735Labour services 69 –
748,093 634,310
Property services 65,694 59,141
813,787 693,451
iii. Joint venturesMaterials, utilities and other ancillary services 90,223 119,548Leasing of equipment 14,574 13,621
104,797 133,169
iv. Associates invested by CNOOCMaterials, utilities and other ancillary services 9,429 21,964Management services – 1,431
9,429 23,395
56 China Oilfield Services Limited • Interim Report 2021
Notes to Interim Condensed Consolidated Financial Information (continued)
For the six months ended 30 June 2021
29. RELATED PARTY TRANSACTIONS (continued)
(A) Related party transactions and outstanding balances with related parties (continued)
c. Included in interest income
Six months ended 30 June2021 2020
RMB’000 RMB’000(Unaudited) (Unaudited)
CNOOC Finance Co., Ltd. (“CNOOC Finance”, a subsidiary of CNOOC)
Interest income 15,271 14,153
Deposits in CNOOC Finance carry interests at the applicable interest rate which is determined with reference to the prevailing bank rates published by the People’s Bank of China.
d. Dividend income from joint ventures
Six months ended 30 June2021 2020
RMB’000 RMB’000(Unaudited) (Unaudited)
Dividend income from joint ventures 198,928 23,201
e. Included in finance costs
During the six months ended 30 June 2021, the finance costs on the loan from a related party which has been disclosed in Note 23 are US$1,079,000 (six months ended 30 June 2020: US$2,667,000), which is equivalent to approximately RMB6,981,000 (six months ended 30 June 2020: RMB18,881,000).
During the six months ended 30 June 2021, the finance costs on the lease liabilities due to related parties are RMB3,426,000 (six months ended 30 June 2020: RMB799,000).
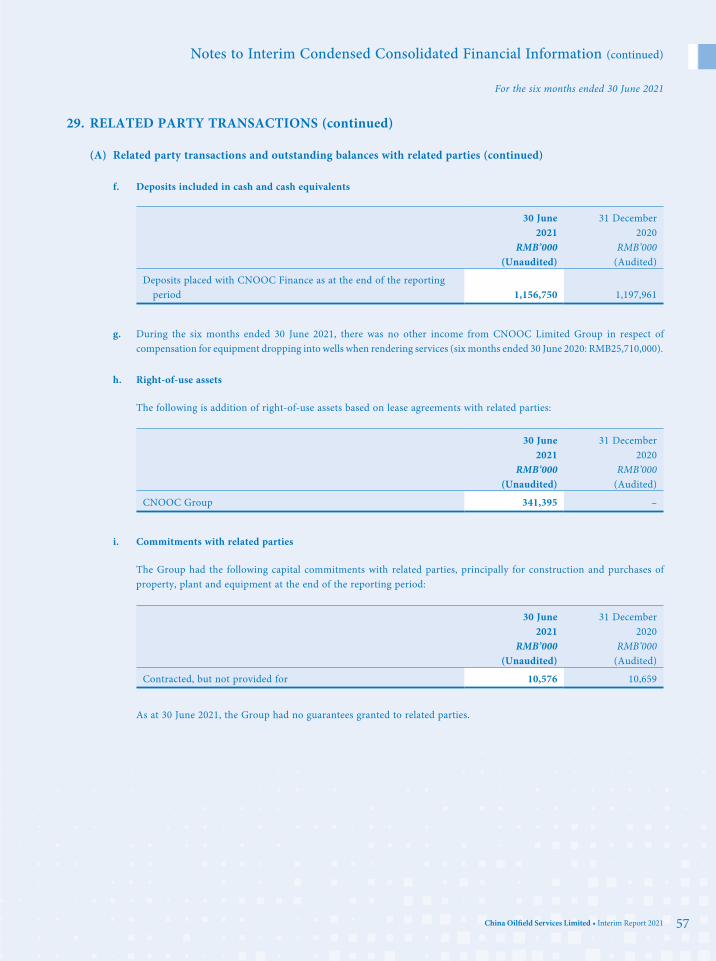
Notes to Interim Condensed Consolidated Financial Information (continued)
China Oilfield Services Limited • Interim Report 2021 57
For the six months ended 30 June 2021
29. RELATED PARTY TRANSACTIONS (continued)
(A) Related party transactions and outstanding balances with related parties (continued)
f. Deposits included in cash and cash equivalents
30 June 2021
31 December 2020
RMB’000 RMB’000(Unaudited) (Audited)
Deposits placed with CNOOC Finance as at the end of the reporting period 1,156,750 1,197,961
g. During the six months ended 30 June 2021, there was no other income from CNOOC Limited Group in respect of compensation for equipment dropping into wells when rendering services (six months ended 30 June 2020: RMB25,710,000).
h. Right-of-use assets
The following is addition of right-of-use assets based on lease agreements with related parties:
30 June2021
31 December2020
RMB’000 RMB’000(Unaudited) (Audited)
CNOOC Group 341,395 –
i. Commitments with related parties
The Group had the following capital commitments with related parties, principally for construction and purchases of property, plant and equipment at the end of the reporting period:
30 June 2021
31 December 2020
RMB’000 RMB’000(Unaudited) (Audited)
Contracted, but not provided for 10,576 10,659
As at 30 June 2021, the Group had no guarantees granted to related parties.
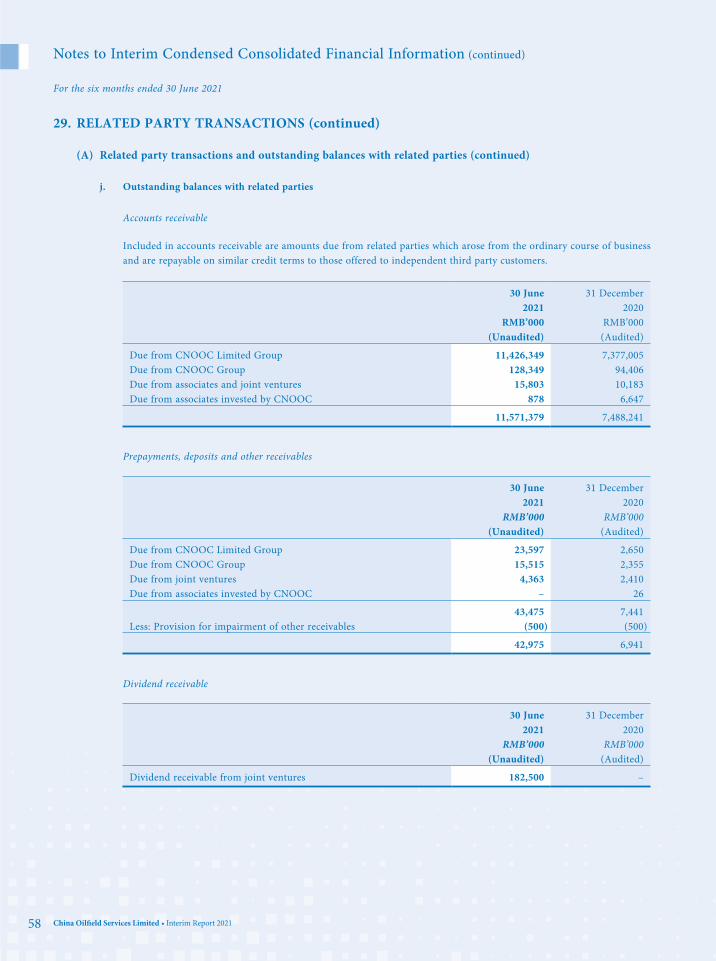
58 China Oilfield Services Limited • Interim Report 2021
Notes to Interim Condensed Consolidated Financial Information (continued)
For the six months ended 30 June 2021
29. RELATED PARTY TRANSACTIONS (continued)
(A) Related party transactions and outstanding balances with related parties (continued)
j. Outstanding balances with related parties
Accounts receivable
Included in accounts receivable are amounts due from related parties which arose from the ordinary course of business and are repayable on similar credit terms to those offered to independent third party customers.
30 June 2021
31 December 2020
RMB’000 RMB’000(Unaudited) (Audited)
Due from CNOOC Limited Group 11,426,349 7,377,005Due from CNOOC Group 128,349 94,406Due from associates and joint ventures 15,803 10,183Due from associates invested by CNOOC 878 6,647
11,571,379 7,488,241
Prepayments, deposits and other receivables
30 June 2021
31 December 2020
RMB’000 RMB’000(Unaudited) (Audited)
Due from CNOOC Limited Group 23,597 2,650Due from CNOOC Group 15,515 2,355Due from joint ventures 4,363 2,410Due from associates invested by CNOOC – 26
43,475 7,441Less: Provision for impairment of other receivables (500) (500)
42,975 6,941
Dividend receivable
30 June 2021
31 December 2020
RMB’000 RMB’000(Unaudited) (Audited)
Dividend receivable from joint ventures 182,500 –
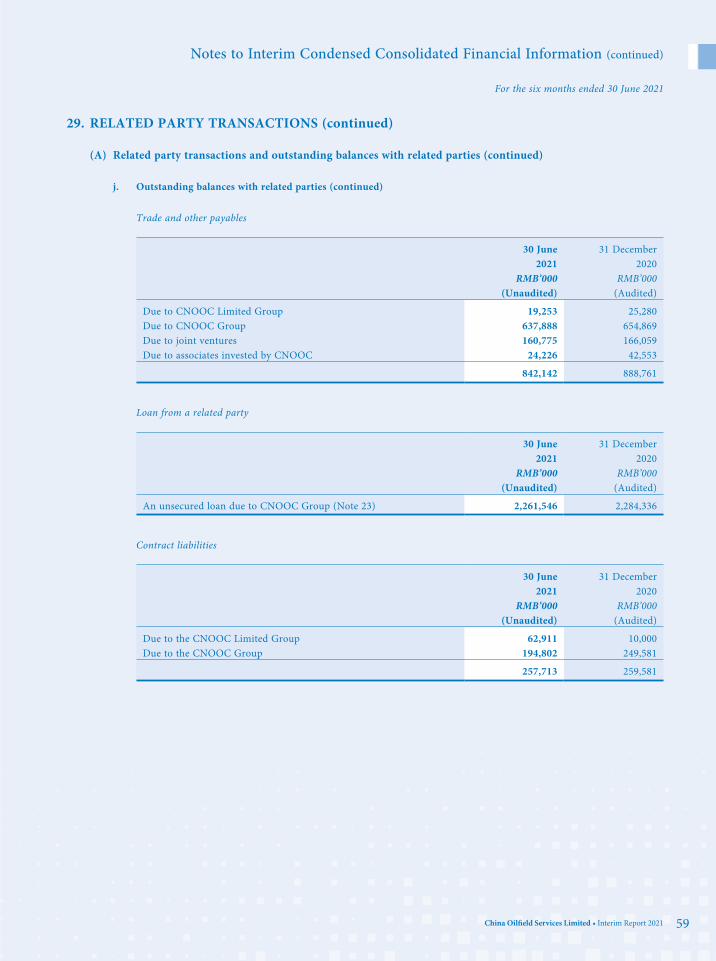
Notes to Interim Condensed Consolidated Financial Information (continued)
China Oilfield Services Limited • Interim Report 2021 59
For the six months ended 30 June 2021
29. RELATED PARTY TRANSACTIONS (continued)
(A) Related party transactions and outstanding balances with related parties (continued)
j. Outstanding balances with related parties (continued)
Trade and other payables
30 June 2021
31 December 2020
RMB’000 RMB’000(Unaudited) (Audited)
Due to CNOOC Limited Group 19,253 25,280Due to CNOOC Group 637,888 654,869Due to joint ventures 160,775 166,059Due to associates invested by CNOOC 24,226 42,553
842,142 888,761
Loan from a related party
30 June 2021
31 December 2020
RMB’000 RMB’000(Unaudited) (Audited)
An unsecured loan due to CNOOC Group (Note 23) 2,261,546 2,284,336
Contract liabilities
30 June 2021
31 December 2020
RMB’000 RMB’000(Unaudited) (Audited)
Due to the CNOOC Limited Group 62,911 10,000Due to the CNOOC Group 194,802 249,581
257,713 259,581

60 China Oilfield Services Limited • Interim Report 2021
Notes to Interim Condensed Consolidated Financial Information (continued)
For the six months ended 30 June 2021
29. RELATED PARTY TRANSACTIONS (continued)
(A) Related party transactions and outstanding balances with related parties (continued)
j. Outstanding balances with related parties (continued)
Lease liabilities
30 June 2021
31 December 2020
RMB’000 RMB’000(Unaudited) (Audited)
Due to the CNOOC Group 344,821 68
The Group and the above related parties are within the CNOOC Group and the CNOOC Limited Group and are under common control (except for the joint ventures of the Group and the associates invested by CNOOC) by the same ultimate holding company.
The balances with related parties at 30 June 2021 included in accounts receivable, prepayments, deposits and other receivables, dividend receivable, trade and other payables and contract liabilities of the Group are unsecured, interest-free, and have no fixed terms of repayment. Loan from a related party is charged at LIBOR+0.5% per annum and repayable on demand. Lease liabilities have fixed terms of repayment and are measured at the present value of lease payments that are unpaid using the incremental borrowing rate at the lease commencement date.
The Company entered into several agreements with the CNOOC Group and the CNOOC Limited Group which govern the employee benefit arrangements, the provision of materials, utilities and ancillary services, the provision of technical services, the leasing of properties and various other commercial arrangements.
The lease expenses relating to agreements with the CNOOC Group and the CNOOC Limited Group in respect of variable lease payments determined by utilisation days and day rates as well as short-term leases are disclosed in Note 29(A)b.
The Directors of the Company are of the opinion that the above transactions with related parties were conducted in the usual course of business.
k. Transactions with other SOEs in the PRC
The Group has entered into extensive transactions covering the sales of goods and rendering of services, receipt of construction services of vessels and drilling rigs, purchases of goods, services or property, plant and equipment in the PRC, other than the CNOOC Group and the CNOOC Limited Group, in the normal course of business on terms comparable to those with other non-SOEs. None of these transactions are material related party transactions, individually or collectively, that require separate disclosure.

Notes to Interim Condensed Consolidated Financial Information (continued)
China Oilfield Services Limited • Interim Report 2021 61
For the six months ended 30 June 2021
29. RELATED PARTY TRANSACTIONS (continued)
(A) Related party transactions and outstanding balances with related parties (continued)
k. Transactions with other SOEs in the PRC (continued)
In addition, the Group has certain of its cash and time deposits and outstanding interest-bearing bank borrowings with certain state-owned banks in the PRC, as summarised below:
30 June 2021
31 December 2020
RMB’000 RMB’000(Unaudited) (Audited)
Cash and cash equivalents 473,912 457,369Time deposits 1,501,380 –
1,975,292 457,369
Long-term bank loans 185,692 191,146Current portion of long-term bank loans 18,280 18,291
203,972 209,437
Deposit interest rates and loan interest rates are at the market rates.
Six months ended 30 June2021 2020
RMB’000 RMB’000(Unaudited) (Unaudited)
Finance costs 1,462 9,002
(B) Compensation of key management personnel of the Group
Six months ended 30 June2021 2020
RMB’000 RMB’000(Unaudited) (Unaudited)
Short-term employee benefits 3,202 2,001Post-employment benefits 645 260
Total compensation paid to key management personnel 3,847 2,261
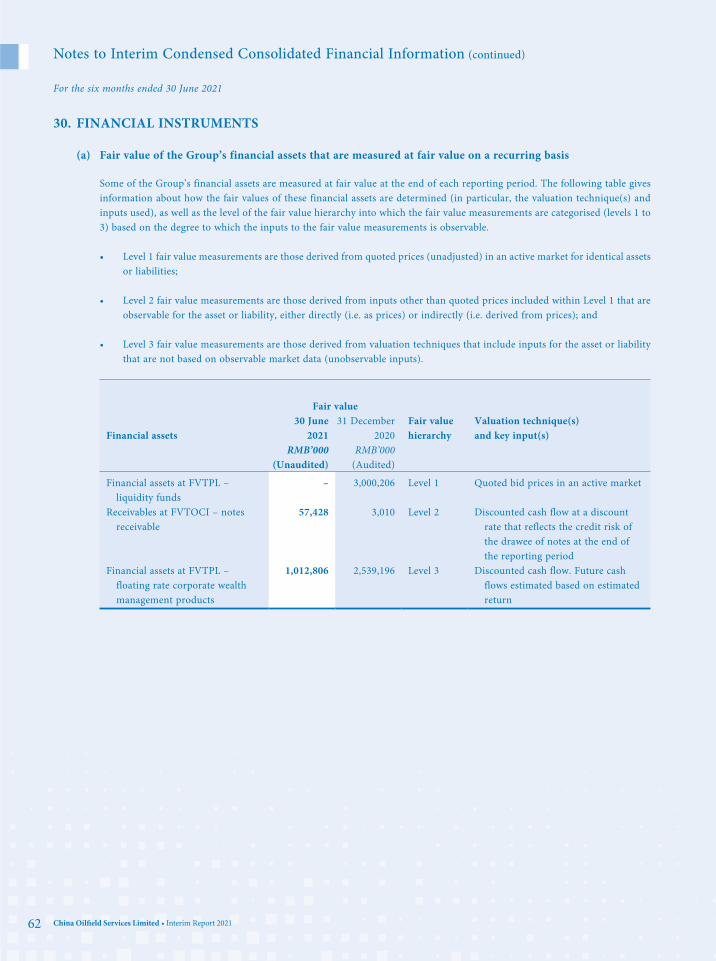
62 China Oilfield Services Limited • Interim Report 2021
Notes to Interim Condensed Consolidated Financial Information (continued)
For the six months ended 30 June 2021
30. FINANCIAL INSTRUMENTS
(a) Fair value of the Group’s financial assets that are measured at fair value on a recurring basis
Some of the Group’s financial assets are measured at fair value at the end of each reporting period. The following table gives information about how the fair values of these financial assets are determined (in particular, the valuation technique(s) and inputs used), as well as the level of the fair value hierarchy into which the fair value measurements are categorised (levels 1 to 3) based on the degree to which the inputs to the fair value measurements is observable.
• Level 1 fair value measurements are those derived from quoted prices (unadjusted) in an active market for identical assets or liabilities;
• Level 2 fair value measurements are those derived from inputs other than quoted prices included within Level 1 that are observable for the asset or liability, either directly (i.e. as prices) or indirectly (i.e. derived from prices); and
• Level 3 fair value measurements are those derived from valuation techniques that include inputs for the asset or liability that are not based on observable market data (unobservable inputs).
Financial assets
Fair valueFair value hierarchy
Valuation technique(s) and key input(s)
30 June 2021
31 December2020
RMB’000 RMB’000(Unaudited) (Audited)
Financial assets at FVTPL – liquidity funds
– 3,000,206 Level 1 Quoted bid prices in an active market
Receivables at FVTOCI – notes receivable
57,428 3,010 Level 2 Discounted cash flow at a discount rate that reflects the credit risk of the drawee of notes at the end of the reporting period
Financial assets at FVTPL – floating rate corporate wealth management products
1,012,806 2,539,196 Level 3 Discounted cash flow. Future cash flows estimated based on estimated return
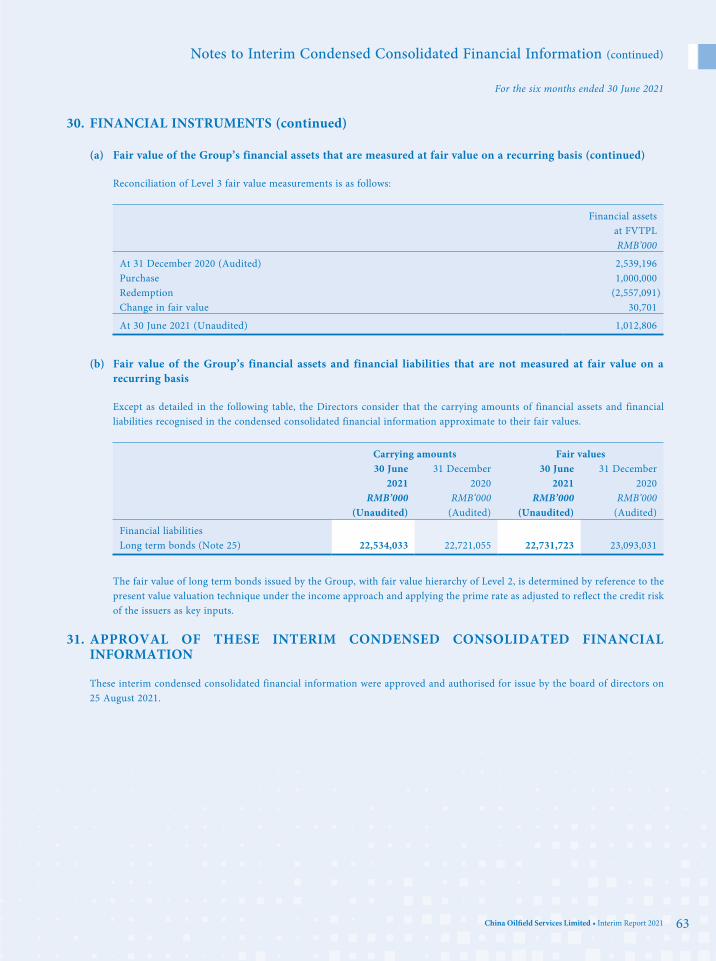
Notes to Interim Condensed Consolidated Financial Information (continued)
China Oilfield Services Limited • Interim Report 2021 63
For the six months ended 30 June 2021
30. FINANCIAL INSTRUMENTS (continued)
(a) Fair value of the Group’s financial assets that are measured at fair value on a recurring basis (continued)
Reconciliation of Level 3 fair value measurements is as follows:
Financial assets at FVTPLRMB’000
At 31 December 2020 (Audited) 2,539,196Purchase 1,000,000Redemption (2,557,091) Change in fair value 30,701
At 30 June 2021 (Unaudited) 1,012,806
(b) Fair value of the Group’s financial assets and financial liabilities that are not measured at fair value on a recurring basis
Except as detailed in the following table, the Directors consider that the carrying amounts of financial assets and financial liabilities recognised in the condensed consolidated financial information approximate to their fair values.
Carrying amounts Fair values30 June
202131 December
202030 June
202131 December
2020RMB’000 RMB’000 RMB’000 RMB’000
(Unaudited) (Audited) (Unaudited) (Audited)
Financial liabilities Long term bonds (Note 25) 22,534,033 22,721,055 22,731,723 23,093,031
The fair value of long term bonds issued by the Group, with fair value hierarchy of Level 2, is determined by reference to the present value valuation technique under the income approach and applying the prime rate as adjusted to reflect the credit risk of the issuers as key inputs.
31. APPROVAL OF THESE INTERIM CONDENSED CONSOLIDATED FINANCIAL INFORMATION
These interim condensed consolidated financial information were approved and authorised for issue by the board of directors on 25 August 2021.

64 China Oilfield Services Limited • Interim Report 2021
Company Directory
HeadquartersNo. 201 Haiyou AvenueYanjiao Economic & TechnologicalDevelopment ZoneSanhe CityHebei ProvincePeople’s Republic of ChinaTel: (8610) 8452 1687Fax: (8610) 8452 1325
Registration AddressNo. 1581, Haichuan RoadTanggu Ocean Hi-tech ZoneBinhai Hi-tech Development District TianjinPeople’s Republic of China
Hong Kong Office65/F, Bank of China Tower1 Garden RoadCentral, Hong KongTel: (852) 2213 2500Fax: (852) 2525 9322
RegisterComputershare Hong KongInvestor Services LimitedShops 1712-1716, 17/FHopewell Centre183 Queen’s Road EastWanchai, Hong KongTel: (852) 2862 8555Fax: (852) 2865 0990
AuditorsErnst & Young27/F, One Taikoo Place979 King’s Road, Quarry BayHong KongTel: (852) 2846 9888Fax: (852) 2868 4432
Legal CounselPRCJunHe LLP20/F, China Resources Building8 Jianguomenbei AvenueBeijingTel: (8610) 8519 1300Fax: (8610) 8519 1350
Hong KongClifford Chance27th Floor, Jardine HouseOne Connaught PlaceHong KongTel: (852) 2825 8888Fax: (852) 2825 8800
Public Relations CompanyWonderful Sky Financial Group9/F, The Center99 Queen’s Road CentralCentral, Hong KongTel: (852) 2851 1038Fax: (852) 3102 0210
PrinterHeterMedia Services Limited9/F, Infinitus Plaza199 Des Voeux Road CentralHong KongTel: (852) 2121 1551Fax: (852) 2121 1510
Stock CodesShanghai Stock Exchange: 601808The Stock Exchange of Hong Kong Limited: 2883
Board of DirectorsZhao Shunqiang (Chairman)
Qi MeishengWong Kwai Huen, Albert (Independent Non-Executive Director)
Lin Boqiang (Independent Non-Executive Director)
Chiu Lai Kuen, Susanna (Independent Non-Executive Director)
Xu YugaoZhao Baoshun
Audit CommitteeChiu Lai Kuen, Susanna (Chairman)
Wong Kwai Huen, AlbertLin Boqiang
Remuneration and Assessment CommitteeWong Kwai Huen, Albert (Chairman)
Lin BoqiangChiu Lai Kuen, SusannaXu Yugao
Nomination CommitteeLin Boqiang (Chairman)
Zhao ShunqiangWong Kwai Huen, Albert
Supervisory CommitteePeng Wen (Chairman)
Cheng XinshengZhao Bi
Senior ManagementZhao ShunqiangYu FengXu YingboLiu XiaogangLu TaoXiong MinYang DexingChong XiaojieWu Yanyan
2021