2. urban transport system in ulaanaatar city - un escap system_ulaanbaatar.pdf · urban transport...
TRANSCRIPT

MINISTRY OF ROADS AND TRANSPORTATION
Urban Transport System in Ulaanbaatar cityRegional Expert Group Meeting on Sustainable and Inclusive Transport
Development, 29 September -1 October 2014, Ahmedabad, India
Nerguibaatar Tsevegjav
Head, Road Transportation Division
MONGOLIA

MONGOLIA
•Location: land-locked country in the Central Asia•Territory: 1.5 million square kilometers•Population: 2.8 million, 1.25 million live in UB•Density: 16 persons per 1 square km•Vehicle population: 620 thousand

ULAANBAATAR- City data at Glance (as of 2013)
Area • Total Administrative Area : 4700 km2• Divided in 9 districts /including three remote districts/
Population • Population: around 1.2 Million (about 45% of total population)• Population density: 40 persons/hectare
Environment • Extremely cold climate: lowest temperature in winter -40°C• Annual average temperature: -2°C • Annual precipitation: about 250 mm • Situated at 1300m above the sea level

947 893 943 1020 1048
51 47 47 58 66
17091235 970 968 885
511
566658
734 649
0
500
1000
1500
2000
2500
3000
3500
2009 2010 2011 2012 2013
Number of vehicles in public transport
Taxi
Microbus
Trolleybus
Bus
Urban public transport service provider organizations integrate and improve the capacity of firms
by enlarging and fewer small bus strategy.
152.3 153.2 154.4156.2 193 199
220.7 234.7 236 262.8
0
50
100
150
200
250
300
2004 2005 2006 2007 2008 2009 2010 2011 2012 2013
Passenger of public transport (million people)
Passengers
Current situation of Urban transport

Urban transportation service starts at 06:30 AM to 22:30 PM along throughapproved routes and schedules.
52 5460
66 6667
53
44 4650
1319 19 20 18
0
10
20
30
40
50
60
70
80
2009 2010 2011 2012 2013
The number of public transport routes
Main routes Assisting routes /microbus/ Suburban routes
The number of urban transport routes

№ Data Value
2 Number of motor vehicles 375 000
3 Number of motor vehicles
Bus 1048Trolleybus 66Microbus 885Taxi 649Total 2648
4 Roads length /paved/ 427 km
5 Public transportation routes length 4414 km
6 Average route length 31.08 km
7 No. of bus station 596
8
Public transport fare
Bus 1 passenger – 500 ₮= 0.28 $
9 Trolleybus 1 passenger – 300 ₮= 0.17 $
10 Microbus 1 passenger – 500 ₮= 0.28 $
11 Taxi 1 km – 700 ₮= 0.4 $
12 Passengers per year 262 million.passengers/2013 year/
13 Passengers in a day 720.000
14 Highway, subway None
Current situation of Urban transport
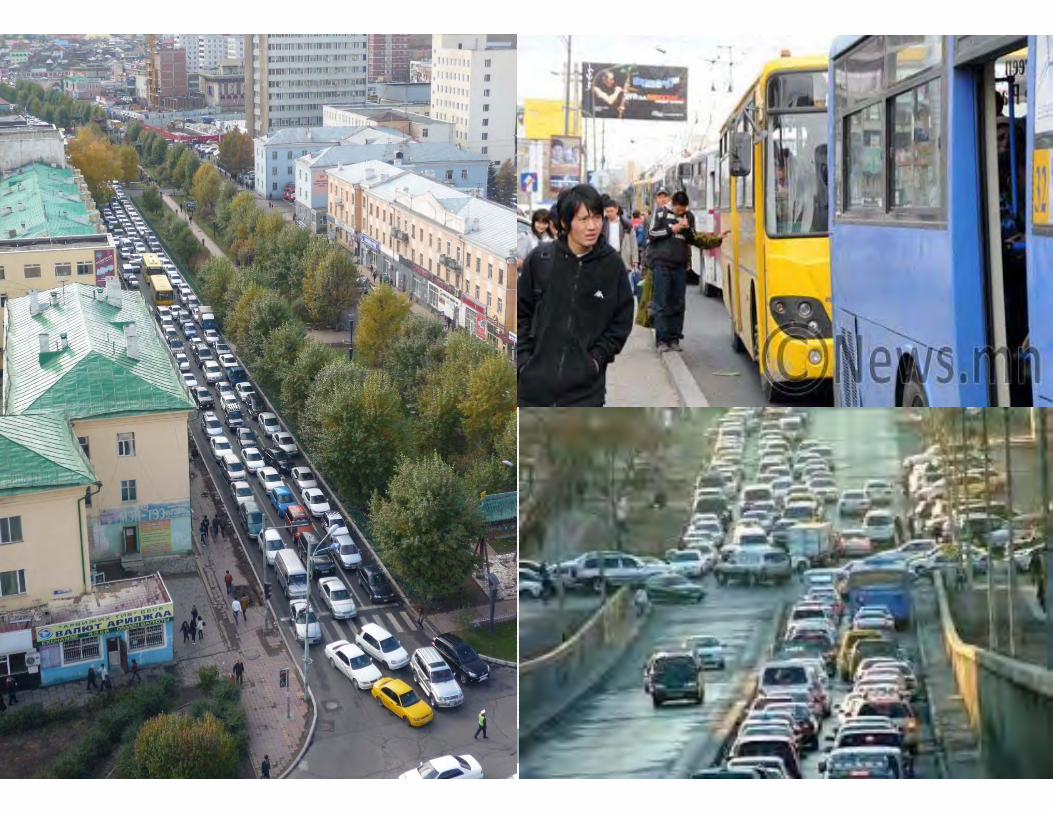

Microbuses occupy bus stops leading to congestion, conductors shout loudly inviting passengers.First lane of the central road became a parking

Average Daily Passenger Volume of Peace Avenue (SL-4) West-East
-1,0002,0003,0004,0005,0006,0007,0008,0009,000
10,000
6 7 8 9 10 11 12 13 14 15 16 17 18 19 20 21 22 23 24 1 2 3 4 5
Hour
Pass
enge
r
Cars Micro bus Small Bus Large Bus Small Rigid Truck
Average Daily Traffic Volume of Peace Avenue (West-East)
-
200
400
600
800
1,000
1,200
1,400
1,600
1,800
2,000
6 7 8 9 10 11 12 13 14 15 16 17 18 19 20 21 22 23 24 1 2 3 4 5
Hour
Uni
t
Cars Micro bus Small Bus Large Bus Light Truck
Current situation of Urban transport
passenger flow vehicles’ number
Indicator Public transport Private carsShare of vehicles on the roads 2 % 98%Share of passengers on the roads 60% 35%Road use ratio 5% 95%

Current situation of Urban transport
Rapid Increasing of Population & Vehicle ownership
42.6% of population in Mongolia are live in UB city.
63 % of Vehicles in the country were registered & run in UB city.
GDP per capita growth was 7% on average for decade
Growth rate for registered vehicles was 15 % on average for decade

Travel speed Decreased
Traffic volume has been doubled between 1998-2011 in UB.
• Average speed decreased in half in major roads.
• In 1998 it was 30-40 km/h, in 2011: 16-20 km/h
• During peak hours near city center: 5-8 km/h
Current situation of Urban transport

Inadequate Supply of Public Transport Services
Only 2 % are for public transport vehicles, 60% of residents commute by public transport.
70% of registered vehicles are over 10 years.
Inadequate public transport infrastructure & facility
Un-effective law enforcement
Lack of professional experts & efficient management
Current situation of Urban transport
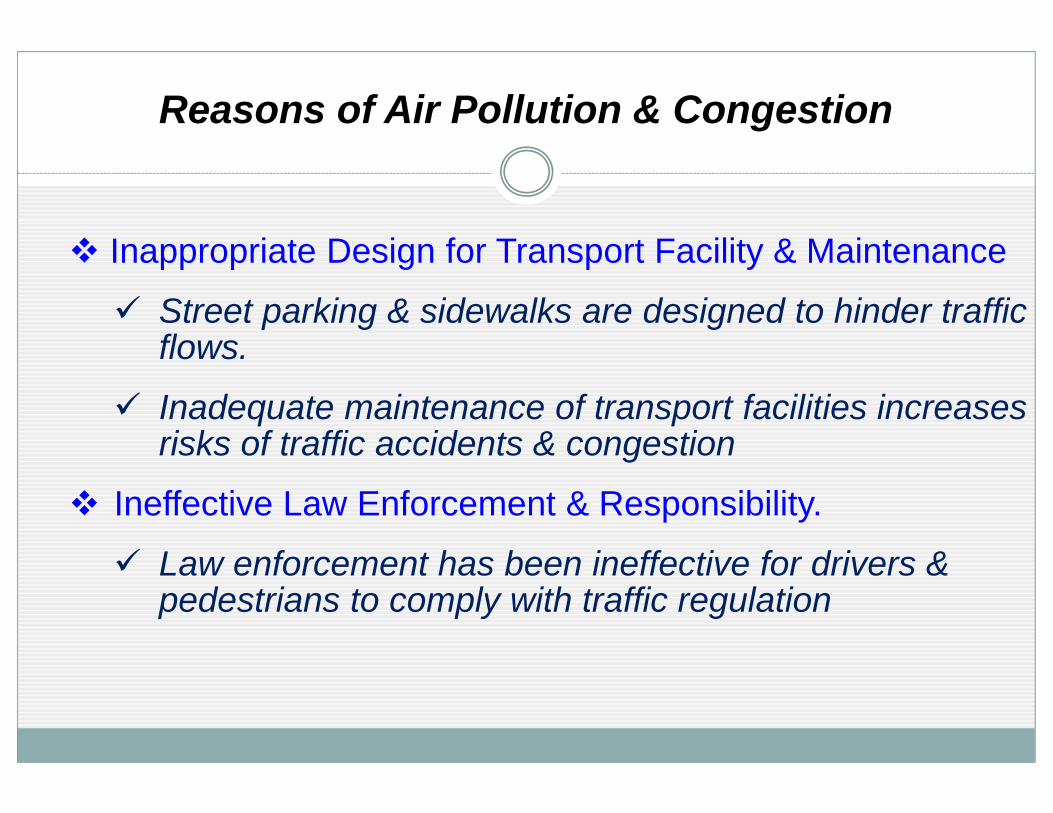
Inappropriate Design for Transport Facility & Maintenance
Street parking & sidewalks are designed to hinder traffic flows.
Inadequate maintenance of transport facilities increases risks of traffic accidents & congestion
Ineffective Law Enforcement & Responsibility.
Law enforcement has been ineffective for drivers & pedestrians to comply with traffic regulation
Reasons of Air Pollution & Congestion

By the end of 2013, 375,000 vehicles registered onlyin Ulaanbaatar city.
Daily, over 180,000 vehicles travels along city roads.It is expected to reach 970,000 vehicles by 2020IN CASE IF MUNICIPALITY DOESN’TTAKE ANY of INTERVENTION in the sector.
Current situation of Urban transport

Expected road, traffic congestion by 2020
Source: UBMP study team report, 2009.
Planned Mass Transit System in Ulaanbaatar city

Multi-tranche Financing by ADB - $ 217.4 million Phase 1 = $ 59.9 million Phase 2 = $ 78.0 million Phase 3 = $ 78.0 million
Project components Package-A. BRT Line-1 Project Package-B. BRT Fleet Expansion Project Package-C. Smart Bus Project (IC-card ticketing
system, automatic bus location system)
Planned BRT project

Phase 1: BRT Infrastructure & Vehicles (34 units) Electric wires, feeder cables & substations
Phase 2: Bus deports BRT Fleet Expansion (up to 53 units)
Phase 3: Further expansion of BRT system
Planned BRT project
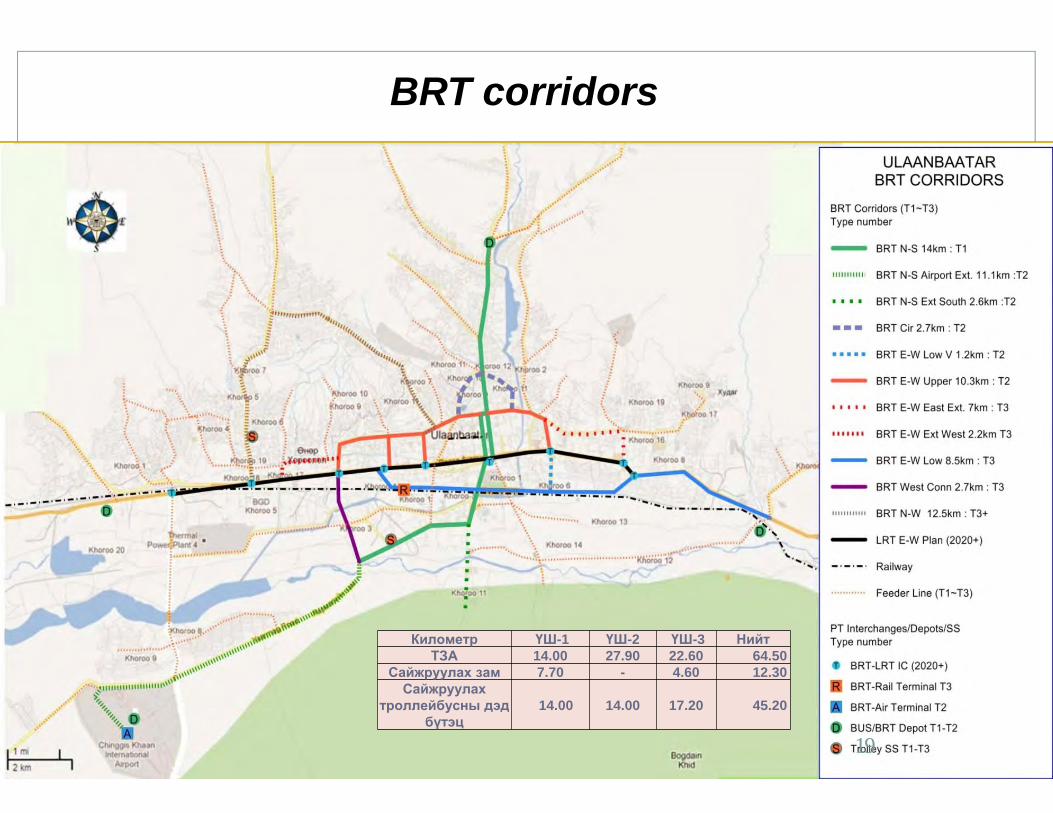
Километр ҮШ-1 ҮШ-2 ҮШ-3 НийтТЗА 14.00 27.90 22.60 64.50
Сайжруулах зам 7.70 - 4.60 12.30 Сайжруулах
троллейбусны дэд бүтэц
14.00 14.00 17.20 45.20
19
BRT corridors

Road Infrastructure Development

Now After intervention
Concept plan for BRT corridors

Concept plan for BRT corridors

New Master Plan of Ulaanbaatar city up to 2030. /Parliament Decree #23, by February 2013/
Strategy 1. Establishing competitive public transportation system to promote public-transportation-based urban development
Strategy 2. Effective Car using Management
Strategy 3. Develop and maintain high-quality transportation infrastructure
Urban Transport Development Plan

New Master Plan of Ulaanbaatar city up to 2030.
Strategy 5. Enhance transportation environment and disaster preparedness
Strategy 6. Provide Adequate institutional arrangements to support improved urban transportation development and management
Strategy 7. Promote social awareness of urban transportation problems and issue
Urban Transport Development Plan