1.which weather map symbol is associated with a) b) c) d) 2.the … · 2017-01-10 · 1.which...
TRANSCRIPT

A) B)
C) D)
1. Which weather map symbol is associated withextremely low air pressure?
A) air pressureB) dewpointC) relative humidityD) amount of precipitation
2. The diagram below represents a weather instrument.
Which weather variable was this instrument designedto measure?

Base your answers to questions 3 through 5 on the weather map below and on your knowledge of Earth Science. The map shows a low-pressuresystem with two fronts extending from its center (L). Points A, B, C, and D represents locations onEarth's surface. Two different air masses are labeled.
A) A and B B) B and C C) C and D D) D and B
3. Which locations are most likely experiencing precipitation?
A) B)
C) D)
4. Which cross section best represents the frontal boundary (fb) and general pattern of air movementsbetween locations C and D?
A) cool and dry B) cool and moistC) warm and dry D) warm and moist
5. Which atmospheric conditions describe the air mass that is influencing weather conditions at location C?
A) northwestern B) northeasternC) southwestern D) southeastern
6. A large rainstorm follows the usual direction ofmovement of a weather system across the UnitedStates. Which part of New York State will receiverain from the storm first?

A) warm B) stationary C) occluded D) cold
7. The weather map below shows a portion of a low-pressure system.
Which front will most likely pass over location A during the next two hours'?
A) B)
C) D)
8. The cross section of the atmosphere below represents the air motion near two frontal boundaries alongreference line XY on Earth's surface.
Which weather map correctly identifies these fronts and indicates the direction that these fronts aremoving?

9. Base your answer to the following question on the graph below, which shows air temperature,dewpoint, and present weather conditions for a 23-hour period at Dallas, Texas.
A) the arrival of a warm frontB) the arrival of a cold frontC) an increase in the difference between air temperature and dewpointD) an increase in both air temperature and dewpoint
The thunderstorm that occurred between 11 p.m. and 12 midnight was most likely the result of
A) sinking and cooling, causing water to evaporateB) sinking and warming, causing water to
evaporateC) rising and cooling, causing water vapor to
condenseD) rising and warming, causing water vapor to
condense
10. Weather along most fronts is usually cloudy withprecipitation because the warm air along most frontsis usually

Base your answers to questions 11 through 14 on the weather map below. The map shows alow-pressure system and some atmospheric conditions at weather stations A, B, and C.
A) B)
C) D)
11. Which cross section best represents the air masses, air movement, clouds, and precipitation occurringbehind and ahead of the warm front located between stations A and B?
A) moist and cool B) moist and warmC) dry and cool D) dry and warm
12. Which type of weather is usually associated with a cP air mass, as shown near weather station C?

A) B)
C) D)
13. The arrows on which map best represent the direction of surface winds associated with thislow-pressure system?
A) northeast B) northwest C) southeast D) southwest
14. If this weather system follows a normal storm track, the low-pressure center (L) will generally movetoward the
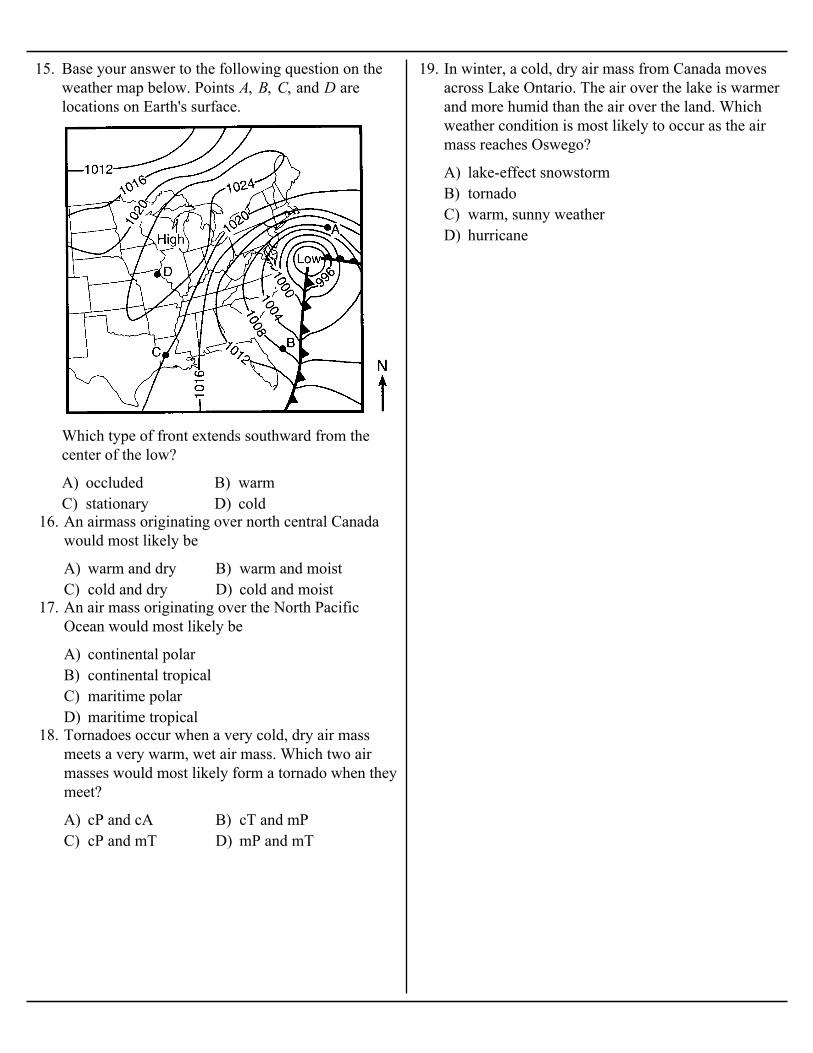
15. Base your answer to the following question on theweather map below. Points A, B, C, and D arelocations on Earth's surface.
A) occluded B) warmC) stationary D) cold
Which type of front extends southward from thecenter of the low?
A) warm and dry B) warm and moistC) cold and dry D) cold and moist
16. An airmass originating over north central Canadawould most likely be
A) continental polarB) continental tropicalC) maritime polarD) maritime tropical
17. An air mass originating over the North PacificOcean would most likely be
A) cP and cA B) cT and mPC) cP and mT D) mP and mT
18. Tornadoes occur when a very cold, dry air massmeets a very warm, wet air mass. Which two airmasses would most likely form a tornado when theymeet?
A) lake-effect snowstormB) tornadoC) warm, sunny weatherD) hurricane
19. In winter, a cold, dry air mass from Canada movesacross Lake Ontario. The air over the lake is warmerand more humid than the air over the land. Whichweather condition is most likely to occur as the airmass reaches Oswego?

A) B)
C) D)
20. Which map shows normal paths followed by low-pressure storm centers as they pass across theUnited States?
A) 0° and 30° N B) 0° and 60° SC) 30° N and 30° S D) 60° N and 60°S
21. Dry areas caused by sinking air and divergingsurface winds are located at which two latitudes?
A) B)
C) D)
22. In which map does the arrow show the generaldirection that most low-pressure storm systemsmove across New York State?

Base your answers to questions 23 through 25 on the weather map below and on your knowledge ofEarth science. The weather map shows a typical low-pressure system and associated weather frontslabeled A and B. The L indicates the center of the low-pressure system. A few New York State citiesare shown. Symbols cP and mT represent different air masses. The wind direction at Utica andRochester is shown on the station models.

A) B)
C) D)
23. Which map shows the regions that are most likely experiencing the precipitation associated with thisweather system?
A) B) C) D)
24. Which front symbols are drawn correctly, based on the air masses shown?
A) Buffalo B) Ithaca C) Utica D) Plattsburgh
25. If this weather system is following a normal storm track, the center of this low is most likely movingtoward which city?

Base your answers to questions 26 through 28 on the weather map below, which shows ahigh-pressure center (H) and a low-pressure center (L), with two fronts extending from thelow-pressure center. Points X and Y are locations on the map connected by a reference line.
A) stationary B) warm C) occluded D) cold
26. Which type of front is located between Buffalo and Detroit?
A) B)
C) D)
27. Which cross section best represents the fronts and air movements in the lower atmosphere along line XY?

A) B)
C) D)
28. Which map best shows the most probable areas of precipitation associated with these weathersystems?

A) an anticycloneB) an area of divergenceC) a low-pressure centerD) a high-pressure center
29. In the cartoon below, the large arrows representsurface winds.
What feature is found at the location to which themeteorologist is pointing?

A) B) C) D)
30. A cross section of a weather front is shown below.
Which symbol would be used to represent this front on a weather map?
A) cP B) cT C) mP D) mT
31. Which weather map symbol represents air massesthat normally form just south of the United Statesover the Caribbean Sea?

A) B)
C) D)
32. On which weather map do the front symbols best represent the direction of movement of the coldfront and warm front associated with the low-pressure system shown on the map?
A) warm land B) warm oceanC) cool land D) cool ocean
33. An air mass classified as mP usually forms overwhich type of Earth surface?

A) southeast B) northeastC) southwest D) northwest
34. The map below shows a low-pressure system locatedover an area in the south-central United States.
In the next few days, because of the prevailingwinds, the air mass will probably move toward the
A) northern Atlantic OceanB) central part of CanadaC) Gulf of MexicoD) Pacific Northwest
35. The weather map below shows a frontal system thathas followed a typical storm track.
The air mass located over point X most likelyoriginated over the
A) wind speed within the airmassB) characteristics of the surface over which the
airmass was formedC) size of the airmassD) rotation of the Earth
36. The properties of an airmass depend mainly on the
Base your answers to questions 37 through 39 on theweather map of North America below. The mapshows the location of a front and the air massinfluencing its movement.
A) wind direction B) cloud coverC) moisture content D) windspeed
37. The cP air mass is identified on the basis of itstemperature and
A) cold front moving northwestwardB) cold front moving southeastwardC) warm front moving northwestwardD) warm front moving southeastward
38. Which type of front and frontal movement is shownon the weather map?
A) central CanadaB) southwestern United StatesC) North Atlantic OceanD) Gulf of Mexico
39. Which region is the probable source of the air masslabeled cP on the map?
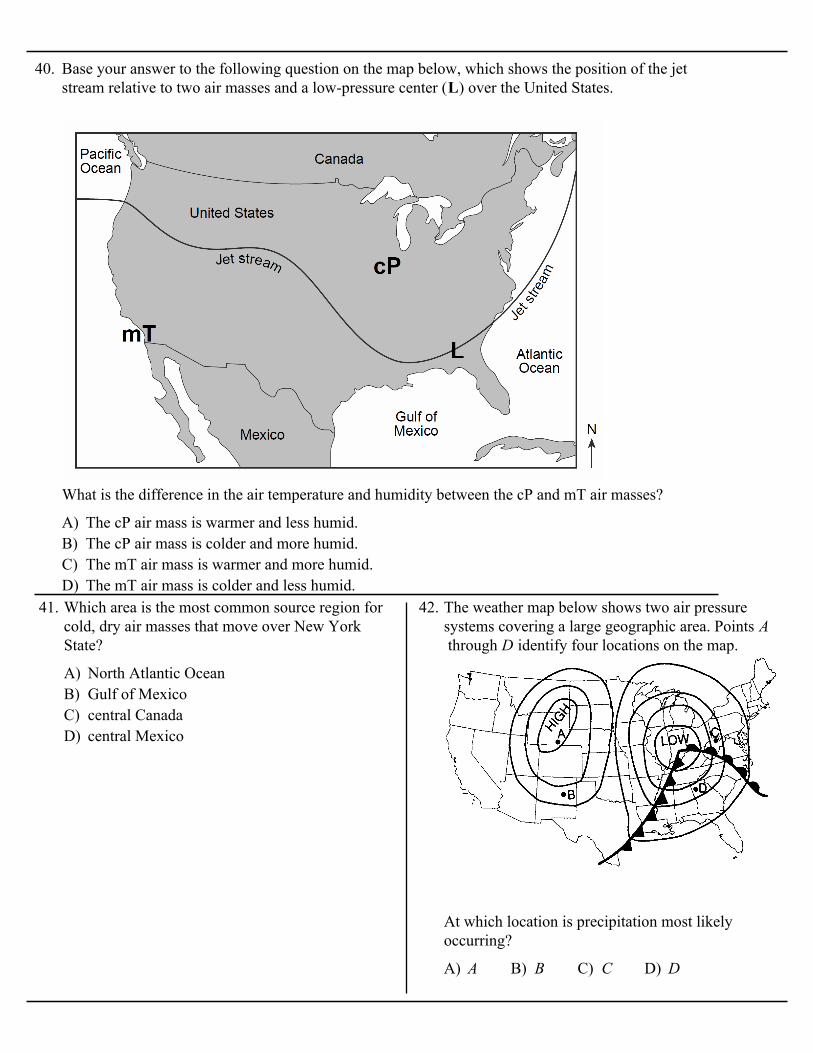
40. Base your answer to the following question on the map below, which shows the position of the jetstream relative to two air masses and a low-pressure center (L) over the United States.
A) The cP air mass is warmer and less humid.B) The cP air mass is colder and more humid.C) The mT air mass is warmer and more humid.D) The mT air mass is colder and less humid.
What is the difference in the air temperature and humidity between the cP and mT air masses?
A) North Atlantic OceanB) Gulf of MexicoC) central CanadaD) central Mexico
41. Which area is the most common source region forcold, dry air masses that move over New YorkState?
A) A B) B C) C D) D
42. The weather map below shows two air pressuresystems covering a large geographic area. Points A through D identify four locations on the map.
At which location is precipitation most likelyoccurring?

A) 15 B) 25 C) 35 D) 45
43. The map below shows the average number ofthunderstorms each year in the continental UnitedStates.
The average number of thunderstorms that occureach year in Albany, New York is approximately
A) continental polarB) continental tropicalC) maritime polarD) maritime tropical
44. The map of North America below shows the sourceregion of an air mass forming mostly over Mexico.
This air mass originating over Mexico is classifiedas
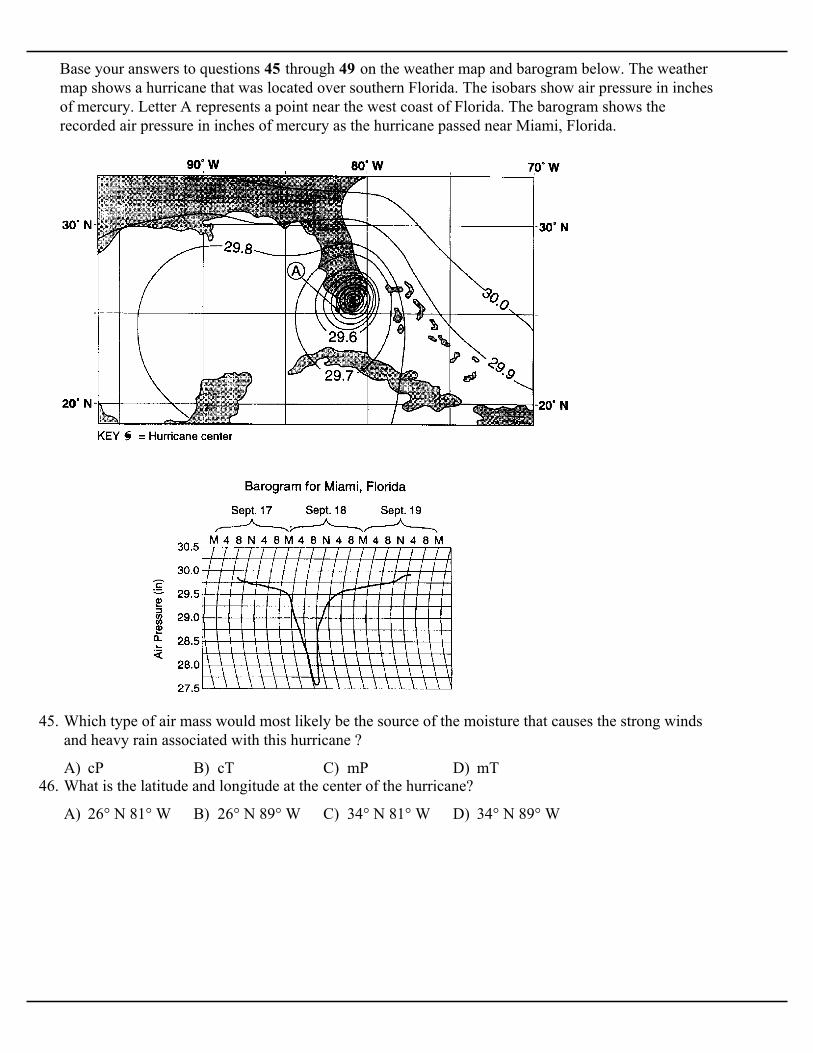
Base your answers to questions 45 through 49 on the weather map and barogram below. The weathermap shows a hurricane that was located over southern Florida. The isobars show air pressure in inchesof mercury. Letter A represents a point near the west coast of Florida. The barogram shows therecorded air pressure in inches of mercury as the hurricane passed near Miami, Florida.
A) cP B) cT C) mP D) mT
45. Which type of air mass would most likely be the source of the moisture that causes the strong windsand heavy rain associated with this hurricane ?
A) 26° N 81° W B) 26° N 89° W C) 34° N 81° W D) 34° N 89° W
46. What is the latitude and longitude at the center of the hurricane?

A) B)
C) D)
47. Which map shows the most likely track of this hurricane?
A) B) C) D)
48. Which station model best represents the weather conditions at point A?
A) 27.30 in B) 27.60 in C) 27.75 in D) 28.60 in
49. What was the lowest air pressure recorded on the barogram as the hurricane passed near Miami?
A) mT B) mP C) cT D) cP
50. Which symbol would be used to identify an airmassoriginating in central Canada?
A) an mT air mass B) a cT air massC) a cold front D) a warm front
51. The winds shift from southwest to northwest asheavy rains and hail begin to fall in Albany, NewYork. These changes are most likely caused by thearrival of
A) cooler and contains less moistureB) cooler and contains more moistureC) warmer and contains less moistureD) warmer and contains more moisture
52. Compared to a maritime tropical air mass, acontinental polar air mass is

Base your answers to questions 53 through 55 on the weather map below and on your knowledge of Earth science. The map of a portion of easternNorth America shows a high-pressure center (H) and a low-pressure center (L), frontal boundaries,and present weather conditions.
A) clockwise and outward B) clockwise and inwardC) counterclockwise and outward D) counterclockwise and inward
53. The general surface wind circulation associated with the high-pressure center (H) is most likely
A) New York State B) Pacific OceanC) Gulf of Mexico D) Canada
54. What was the most likely source region for the air mass over Pennsylvania?
A) fog B) snow C) haze D) thunderstorms
55. Which weather condition is shown along the cold front?

A)
B)
C)
D)
56. Which map best shows the general surface windpattern in a low-pressure system located over theeastern United States?
A) evaporate into a liquidB) reverse directionC) rise and form cloudsD) squeeze together to form a high-pressure
system
57. A map view of surface air movement in alow-pressure system is shown below.
The air near the center of this low-pressure systemusually will
A) B)
C) D)
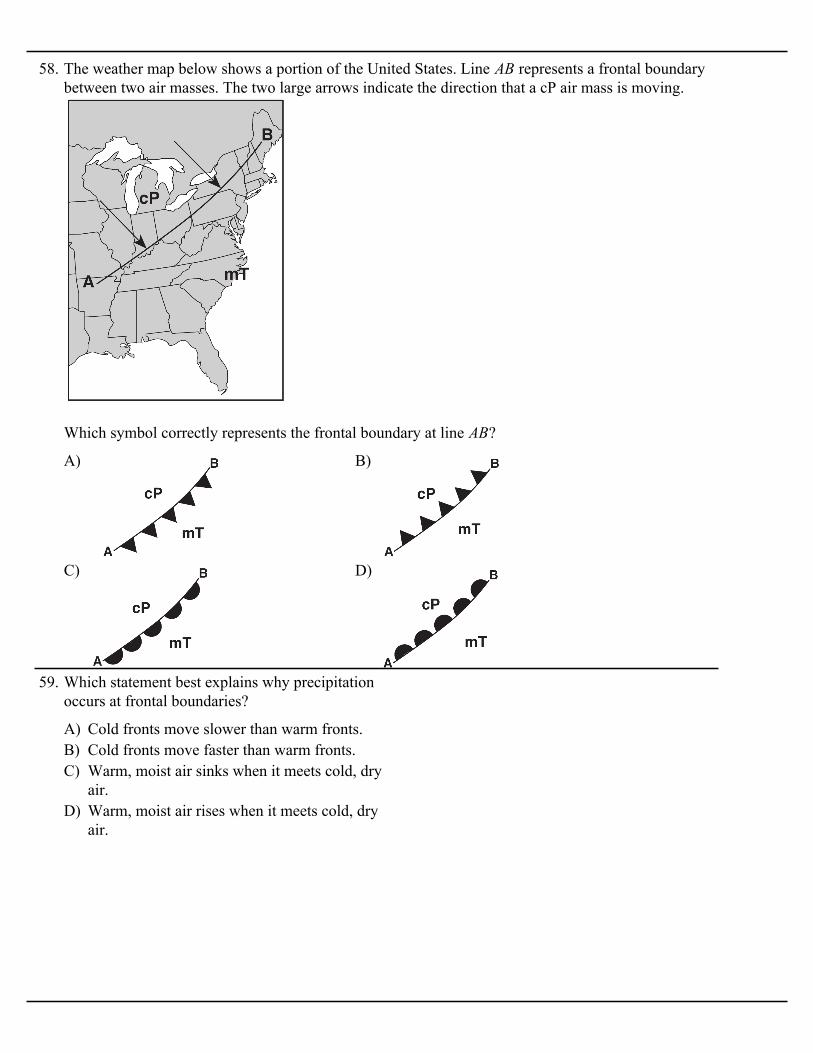
58. The weather map below shows a portion of the United States. Line AB represents a frontal boundarybetween two air masses. The two large arrows indicate the direction that a cP air mass is moving.
Which symbol correctly represents the frontal boundary at line AB?
A) Cold fronts move slower than warm fronts.B) Cold fronts move faster than warm fronts.C) Warm, moist air sinks when it meets cold, dry
air.D) Warm, moist air rises when it meets cold, dry
air.
59. Which statement best explains why precipitationoccurs at frontal boundaries?

A) B)
C) D)
60. Which map shows the two correctly labeled air masses that frequently converge in the central plainsto cause tornadoes?
A) type of precipitationB) wind velocityC) moisture contentD) atmospheric transparency
61. Air masses are identified on the basis of temperatureand
A) higher temperature and more water vaporB) higher temperature and less water vaporC) lower temperature and more water vaporD) lower temperature and less water vapor
62. Compared to a maritime tropical air mass, amaritime polar air mass has a
A) rate of Earth’s rotationB) direction of Earth’s surface windsC) source region where the air mass formedD) path the air mass follows along a land surface
63. The properties of an air mass are mostly determinedby the
A) B)
C) D)
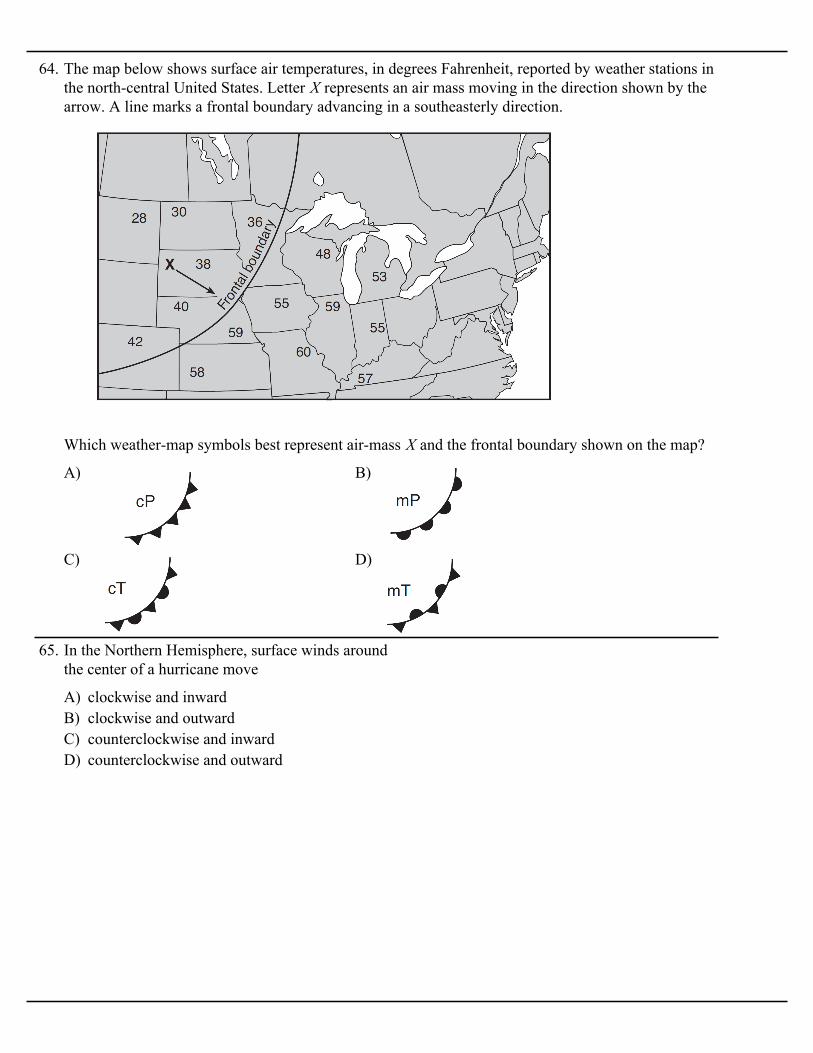
64. The map below shows surface air temperatures, in degrees Fahrenheit, reported by weather stations inthe north-central United States. Letter X represents an air mass moving in the direction shown by thearrow. A line marks a frontal boundary advancing in a southeasterly direction.
Which weather-map symbols best represent air-mass X and the frontal boundary shown on the map?
A) clockwise and inwardB) clockwise and outwardC) counterclockwise and inwardD) counterclockwise and outward
65. In the Northern Hemisphere, surface winds aroundthe center of a hurricane move

Base your answers to questions 66 through 69 on the weather map below, which shows a weathersystem that is affecting part of the United States.
A) B) C) D)
66. Which diagram shows the surface air movements most likely associated with the fronts?
A) B)
C) D)
67. Which map best shows the areas in which precipitation is most likely occurring? [Darkened areasrepresent precipitation.]
A) 1 B) 2 C) 3 D) 4
68. What is the total number of different kinds of weather fronts shown on this weather map?
A) warmer and more humid B) warmer and drierC) colder and more humid D) colder and drier
69. Compared to the air over most of the map region, the air mass centered over Alabama is

A) A B) B C) C D) D
70. The map below represents a section of a weathermap for locations in the eastern United States. Themap shows a low-pressure system, fronts, andweather stations A, B, C, and D.
At which weather station are weather conditionsprobably most unstable?
A) 28°C B) 6°C C) 3°C D) –9°C
71. What is the dewpoint when the dry-bulb temperatureis 8°C and the wet-bulb temperature is 2°C?
A) Cold air flows over warm air, causing the warmair to descend and cool.
B) Cold air flows under warm air, causing thewarm air to rise and cool.
C) Cold air contains more dust than warm air does.D) Cold air contains more water vapor than warm
air does.
72. Why do clouds usually form at the leading edge of acold airmass?
A) east to west B) west to eastC) north to south D) south to north
73. Jet stream winds over the United States generallymove from
A) southwestern United StatesB) central CanadaC) the north Pacific OceanD) the Gulf of Mexico
74. Which geographic area is a common source regionfor cP air masses that move into New Jersey?
A) cP B) cT C) mP D) mT
75. An air mass entering Alaska from the northernPacific Ocean would most likely be labeled on aweather map as
A) cool water B) cool landC) warm water D) warm land
76. An air mass classified as cT usually forms overwhich type of Earth surface?
A) southeast B) southwestC) northeast D) northwest
77. If a low-pressure system follows a typical stormtrack across New York State, it will move toward the
A) central MexicoB) the Gulf of MexicoC) northern CanadaD) the North Pacific Ocean
78. An mP air mass is located over the northwestern partof the United States. The source region of this airmass is most likely
A) cP B) cT C) mP D) mT
79. Which type of air mass is associated with warm, dryatmospheric conditions?
A) cT B) cP C) mT D) mP
80. Which type of air mass would most likely have lowhumidity and high air temperature?

A) B)
C) D)
81. The map below shows a position of the polar jet stream over North America in January.
Which map best shows the air-mass movements associated with this jet stream position?

A) a cycloneB) a cold frontC) a stationary frontD) a high-pressure center
82. The photograph below shows a spiral pattern ofclouds in the Earth's atmosphere. The spiral ishundreds of miles across.
Which type of weather does this photograph show?
A) cool land B) cool waterC) warm land D) warm water
83. An air mass classified as mT usually forms overwhich type of Earth surface?
A) warm, moist, and risingB) warm, dry, and risingC) cool, moist, and sinkingD) cool, dry, and sinking
84. Most of the air in the lower troposphere at theequatorial low-pressure belt is
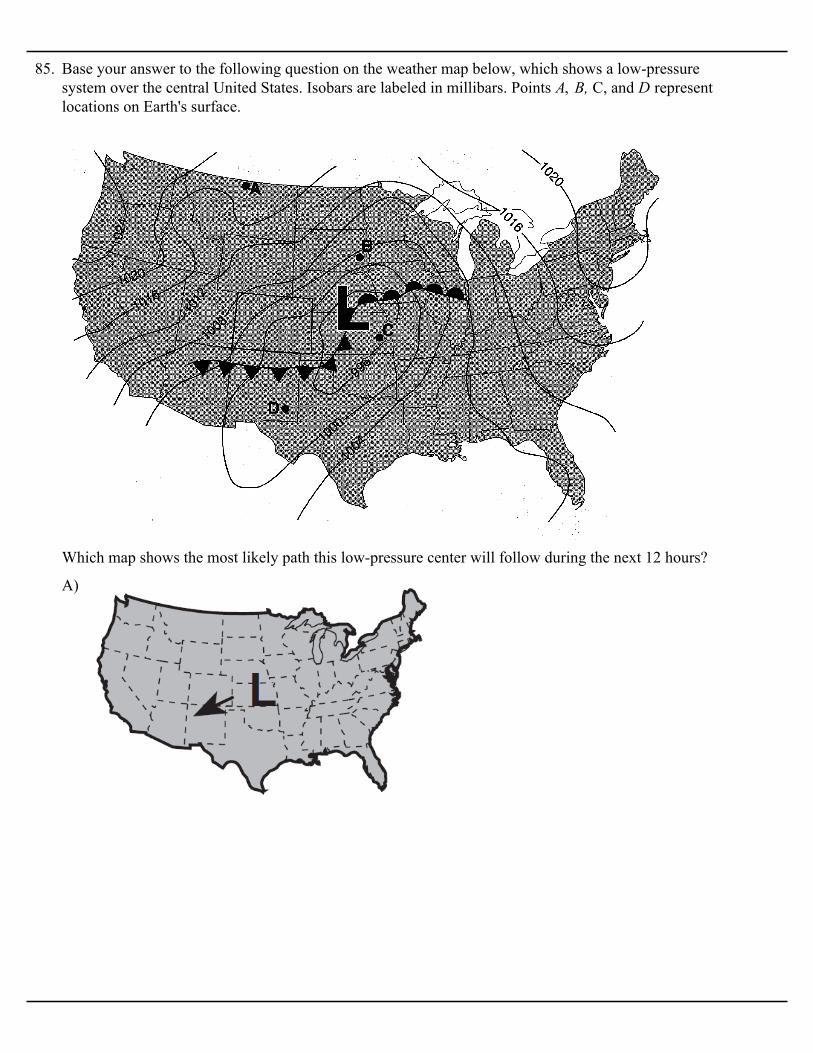
85. Base your answer to the following question on the weather map below, which shows a low-pressuresystem over the central United States. Isobars are labeled in millibars. Points A, B, C, and D representlocations on Earth's surface.
Which map shows the most likely path this low-pressure center will follow during the next 12 hours?
A)

B)
C)
D)

A) warm front B) cold frontC) occluded front D) stationery front
86. The cross section below shows a weather front. Thelarge arrow shows the direction of the movement ofthe cool air mass.
Which type of weather front is shown?
A) geographic originB) size and shapeC) rate of movementD) direction of movement
87. The weather characteristics of air mass resultprimarily from its
A) B)
C) D)
88. The diagram below represents a cross section of airmasses and frontal surfaces along line AB. Thedashed lines represent precipitation.
Which weather map best represents this frontalsystem?
A) B)
C) D)
89. The map below shows the boundary between two airmasses. The arrows show the direction in which theboundary is moving.
Which weather map uses the correct weather frontsymbol to illustrate this information?
A) cP is from the North Atlantic Ocean and mT isfrom the deserts of the southwestern UnitedStates.
B) cP is from northern Canada and mT is from thedeserts of the southwestern United States.
C) cP is from northern Canada and mT is from theGulf of Mexico.
D) cP is from the North Atlantic Ocean and mT isfrom the Gulf of Mexico.
90. In Connecticut, dry, cool air masses (cP) ofteninteract with moist, warm air masses (mT). Whichstatement correctly matches each air mass with itsusual geographic source region?

A) A — cT, B — cP, C — mP, D — mTB) A — cP, B — mP, C — mT, D — cTC) A — mP, B — mT, C — cT, D — cPD) A — mT, B — cT, C — cP, D — mP
91. The graph below shows changes in the atmosphereoccurring above typical air-mass source regions A,B, C, and D. Changes in air temperature and altitudeare shown as the graphed lines. Changes inwater-vapor content, in grams of vapor per kilogramof air, are shown as numbers on each graphed line.
Which list best identifies each air-mass sourceregion?
A) The warm air is forced over both frontalinterfaces.
B) The warm air is forced under both frontalinterfaces.
C) The warm air is forced over the cold frontalinterface but under the warm frontal interface.
D) The warm air is forced under the cold frontalinterface but over the warm frontal interface.
92. The diagram below represents a cross-sectional viewof airmasses associated with a low-pressure system.The cold frontal interface is moving faster than thewarm frontal interface. What usually happens to thewarm air that is between the two frontal surfaces?
A) mP B) mT C) cP D) cT
93. On a weather map, an airmass that is very warm anddry would be labeled
A) cP B) mP C) cT D) mT
94. An airmass originates with its center located at 25°N and 90° W.
Based on the map, this air mass would be classifiedas
A) cP B) cT C) mT D) mP
95. Which type of air mass most likely has highhumidity and high temperature?
A) maritime polarB) maritime tropicalC) continental polarD) continental tropical
96. Which air mass is associated with low relativehumidity and high air temperature?
A) cooler and drier B) cooler and wetterC) warmer and drier D) warmer and wetter
97. Locations A and B on the map of North Americabelow are source regions for air masses.
Compared to the air mass formed at location B, theair mass formed at location A will normally be
A) Central CanadaB) Central MexicoC) Gulf of MexicoD) North Pacific Ocean
98. In which geographic region are air masses mostoften warm with a high moisture content?

A) B)
C) D)
99. Which weather instrument is used to determine wind direction?
A) B)
C) D)
100. The diagram below shows a cross section of acumulus cloud. Line AB indicates the base of thecloud.
Which graph best represents the temperaturemeasured along line AB?
A) continental tropicalB) continental polarC) maritime tropicalD) maritime polar
101. An Earth science student observed the followingweather conditions in Albany, New York, for 2days: The first day was warm and humid withsoutherly winds. The second day, the temperaturewas 15 degrees cooler, the relative humidity haddecreased, and wind direction was northwest.Which type of air mass most likely had moved intothe area on the second day?
A) cP B) cT C) mT D) mP
102. Which abbreviation indicates a warm air mass thatcontains large amounts of water vapor?
A) A B) B C) C D) D
103. The map below represents a section of a surfaceweather map showing weather stations A through D.
At which weather station are the most unstableweather conditions occurring?

A) A B) B C) C D) D
104. Cities A, B, C, and D on the weather map beloware being affected by a low-pressure system(cyclone).
Which city would have the most unstableatmospheric conditions and the greatest chance ofprecipitation?
105. Base your answer to the following question on themap below which represents a section of a surfaceweather map. Letters A through F represent weatherstations.
A) northeast B) northwestC) southeast D) southwest
The warm front is moving toward the
A)
B)
C)
D)
106. The diagram below represents a cross section of airmasses and frontal surfaces along line AB. Thedashed lines represent precipitation.
Which weather map best represents this frontalsystem?
A) mP B) mT C) cP D) cT
107. An air mass that originates over the northernPacific Ocean and moves southward over theUnited States would most likely be labeled on aweather map as

108. Base your answer to the following question on the weather map below, which shows the location offronts and the temperature field on a given day in the United States.
A) Chicago and Boise B) Las Vegas and Salt Lake CityC) Kansas City and Minneapolis D) Detroit and Cincinnati
The passage of a cold front most recently influenced the weather of which two cities?
A) cold with low humidity and high air pressureB) cold with high humidity and low air pressureC) warm with high humidity and low air pressureD) warm with low humidity and high air pressure
109. A weather station model for a location in NewYork State is shown below.
The air mass over this location is best described as
A) mT B) mP C) cT D) cP
110. Which type of air mass usually contains the mostmoisture?
A) northern CanadaB) Gulf of MexicoC) Arctic OceanD) southwestern United States
111. Which geographic region is the most commonsource region for the mT air masses that move intoNew York State?
A) Pressure rises and temperature falls.B) Both pressure and temperature rise.C) Both pressure and temperature fall.D) Pressure falls and temperature rises.
112. As a cold front passes a New York weather station,which changes will usually be observed inbarometric pressure and air temperature?

A) cold, dry air massB) warm, dry air massC) low-pressure systemD) high-pressure system
113. The satellite photograph below shows a NorthernHemisphere cloud pattern.
The center of this cloud pattern is most likely thecenter of a
114. Base your answer to the following question on theimage below.
Locations A and B on the map of North Americabelow are source regions for air masses.
A) cooler and drierB) cooler and wetterC) warmer and drierD) warmer and wetter
Compared to the air mass formed at location B, theair mass formed at location A will normally be