1.surface ocean currents resulting from the prevailing … 4-a.pdf7.base your answer to the...
TRANSCRIPT
A) lithosphere to atmosphereB) hydrosphere to lithosphereC) atmosphere to hydrosphereD) stratosphere to troposphere
1. Surface ocean currents resulting from the prevailingwinds over the oceans illustrate a transfer of energyfrom
A) hydrosphere and lithosphereB) mesosphere and thermosphereC) hydrosphere and atmosphereD) lithosphere and atmosphere
2. Chemical weathering will occur most rapidly whenrocks are exposed to the
A) atmosphere B) troposphereC) lithosphere D) hydrosphere
3. The water sphere of the Earth is known as the
A) Soil moisture storage is recharged by vegetationalong the streams.
B) Ground water continues to move into the streamchannels.
C) An increase in potential evapotranspiration(evaporation from leaves and other surfaces)increases the stream runoff.
D) The porosity (spaces between soil particles)beneath the stream channels becomes higherthan normal.
4. Why do many streams continue to flow during longperiods when there is no precipitation?
A) lithosphere B) hydrosphereC) troposphere D) stratosphere
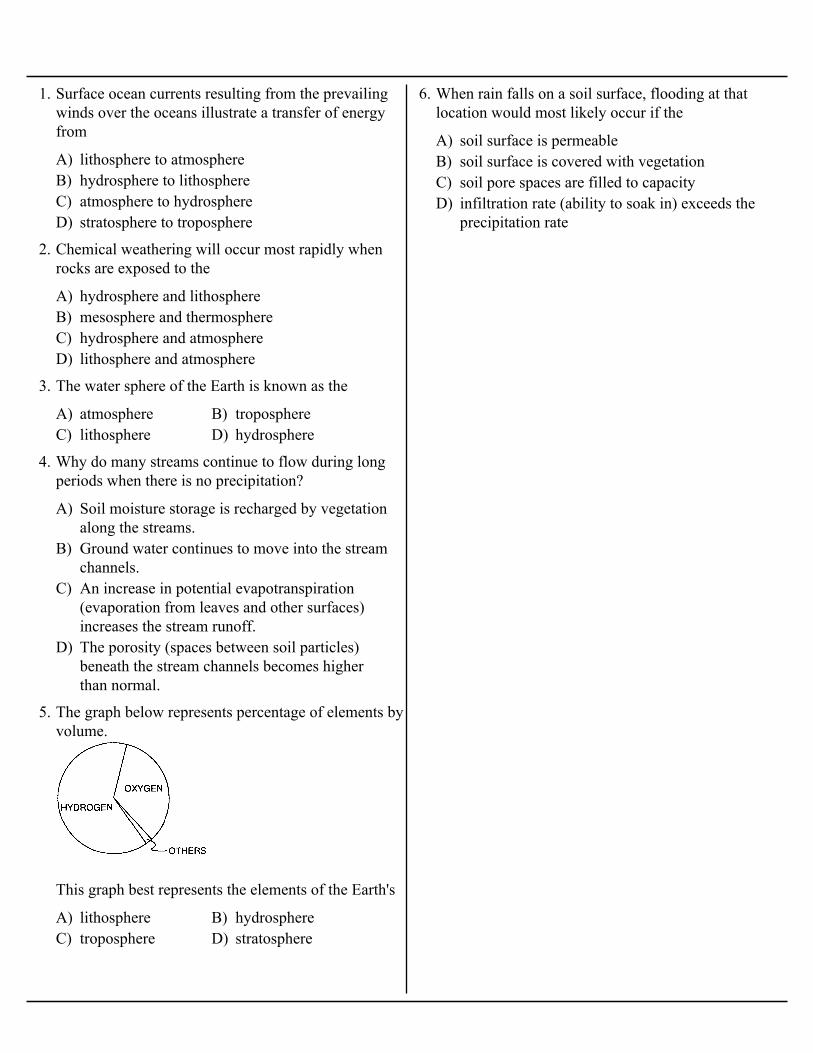
5. The graph below represents percentage of elements byvolume.
This graph best represents the elements of the Earth's
A) soil surface is permeableB) soil surface is covered with vegetationC) soil pore spaces are filled to capacityD) infiltration rate (ability to soak in) exceeds the
precipitation rate
6. When rain falls on a soil surface, flooding at thatlocation would most likely occur if the
7. Base your answer to the following question on the paragraph below, which describes some factors thataffect Earth's climate.
Earth's climate is in a delicate state of balance. Many factors affect climate. Any small changein the factors may lead to long-term cooling or warming of Earth's atmosphere. For example,during the last 100 years, measurements have shown a gradual increase in atmospheric carbondioxide. This change has been linked to an increase in Earth's average atmospheric temperature.Variations in the tilt of Earth's axis have been similarly linked to the occurrence of ice ages. Boththe increases in temperature and the occurrence of ice ages have been linked to changes in globalsea level.
A) Global warming melts glaciers, causing a rise in sea level.B) Increased precipitation causes a rise in sea level.C) Increased evaporation could lower sea level.D) Both A and C
How will the recent increase in average global temperature cause changes in ocean water level?
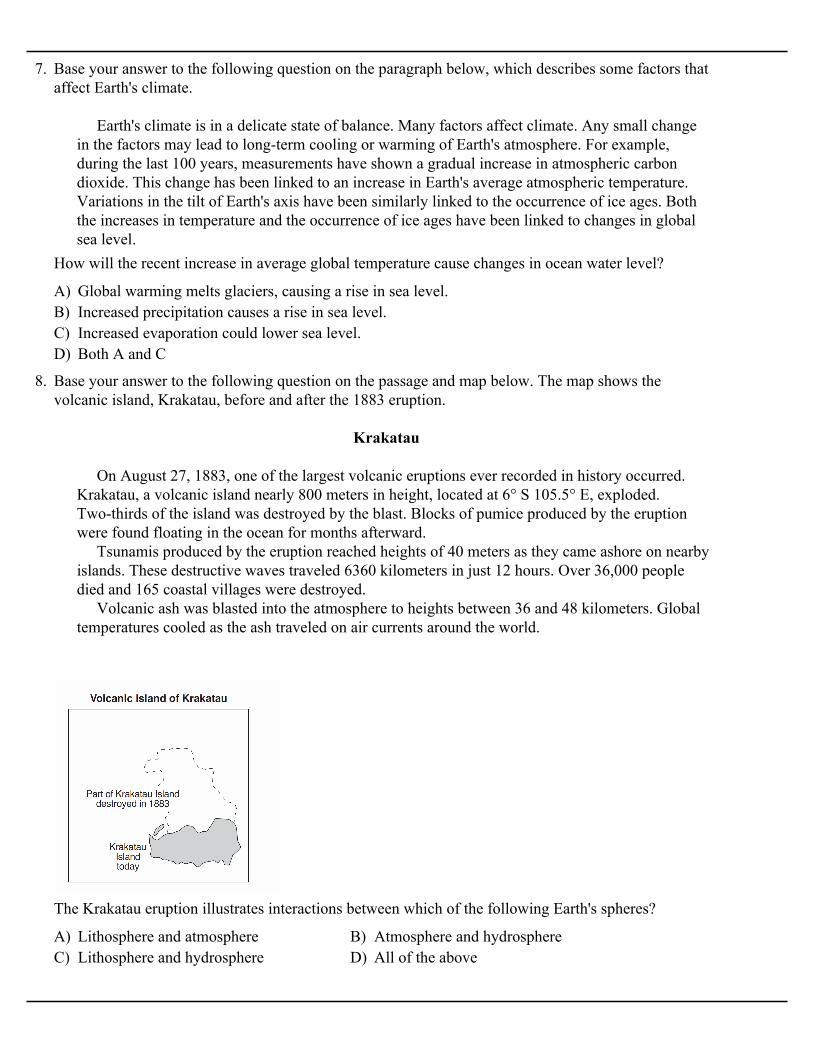
8. Base your answer to the following question on the passage and map below. The map shows thevolcanic island, Krakatau, before and after the 1883 eruption.
Krakatau
On August 27, 1883, one of the largest volcanic eruptions ever recorded in history occurred.Krakatau, a volcanic island nearly 800 meters in height, located at 6° S 105.5° E, exploded.Two-thirds of the island was destroyed by the blast. Blocks of pumice produced by the eruptionwere found floating in the ocean for months afterward. Tsunamis produced by the eruption reached heights of 40 meters as they came ashore on nearbyislands. These destructive waves traveled 6360 kilometers in just 12 hours. Over 36,000 peopledied and 165 coastal villages were destroyed. Volcanic ash was blasted into the atmosphere to heights between 36 and 48 kilometers. Globaltemperatures cooled as the ash traveled on air currents around the world.
A) Lithosphere and atmosphere B) Atmosphere and hydrosphereC) Lithosphere and hydrosphere D) All of the above
The Krakatau eruption illustrates interactions between which of the following Earth's spheres?
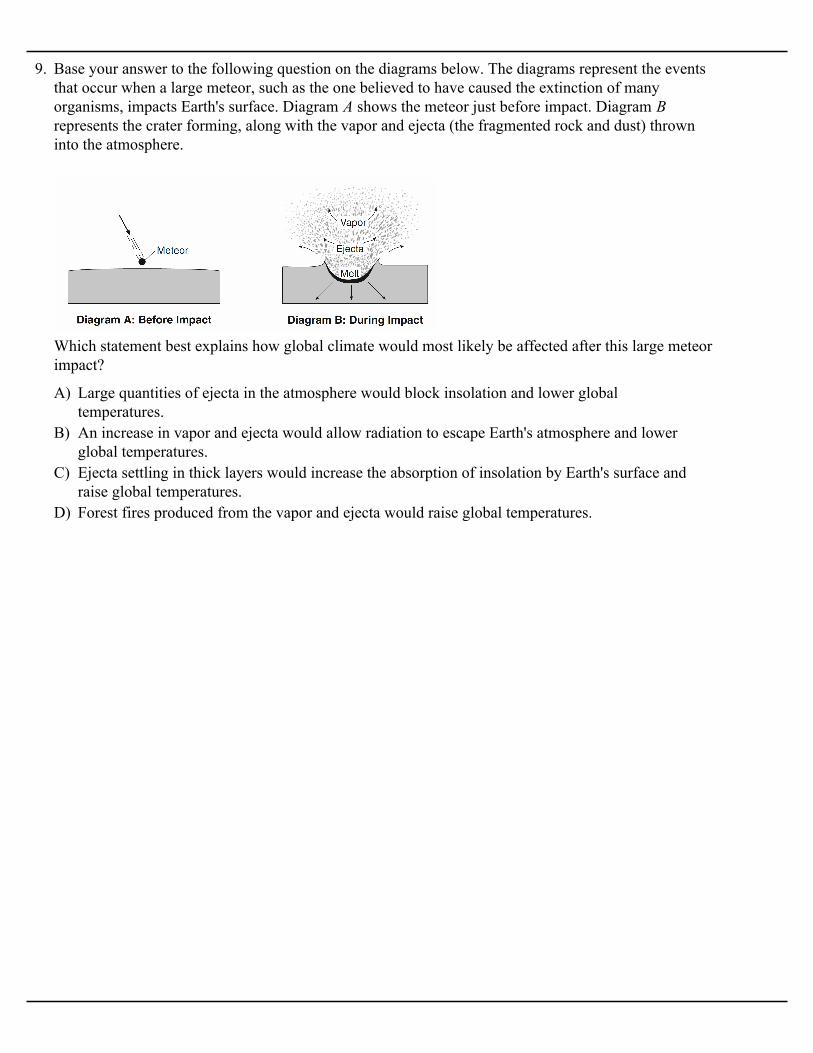
9. Base your answer to the following question on the diagrams below. The diagrams represent the eventsthat occur when a large meteor, such as the one believed to have caused the extinction of manyorganisms, impacts Earth's surface. Diagram A shows the meteor just before impact. Diagram B represents the crater forming, along with the vapor and ejecta (the fragmented rock and dust) throwninto the atmosphere.
A) Large quantities of ejecta in the atmosphere would block insolation and lower globaltemperatures.
B) An increase in vapor and ejecta would allow radiation to escape Earth's atmosphere and lowerglobal temperatures.
C) Ejecta settling in thick layers would increase the absorption of insolation by Earth's surface andraise global temperatures.
D) Forest fires produced from the vapor and ejecta would raise global temperatures.
Which statement best explains how global climate would most likely be affected after this large meteorimpact?
A) interaction of the hydrosphere with the movingatmosphere
B) interaction of the lithosphere with the movingtroposphere
C) absorption of short-wave radiation in thestratosphere
D) absorption of energy in the asthenosphere
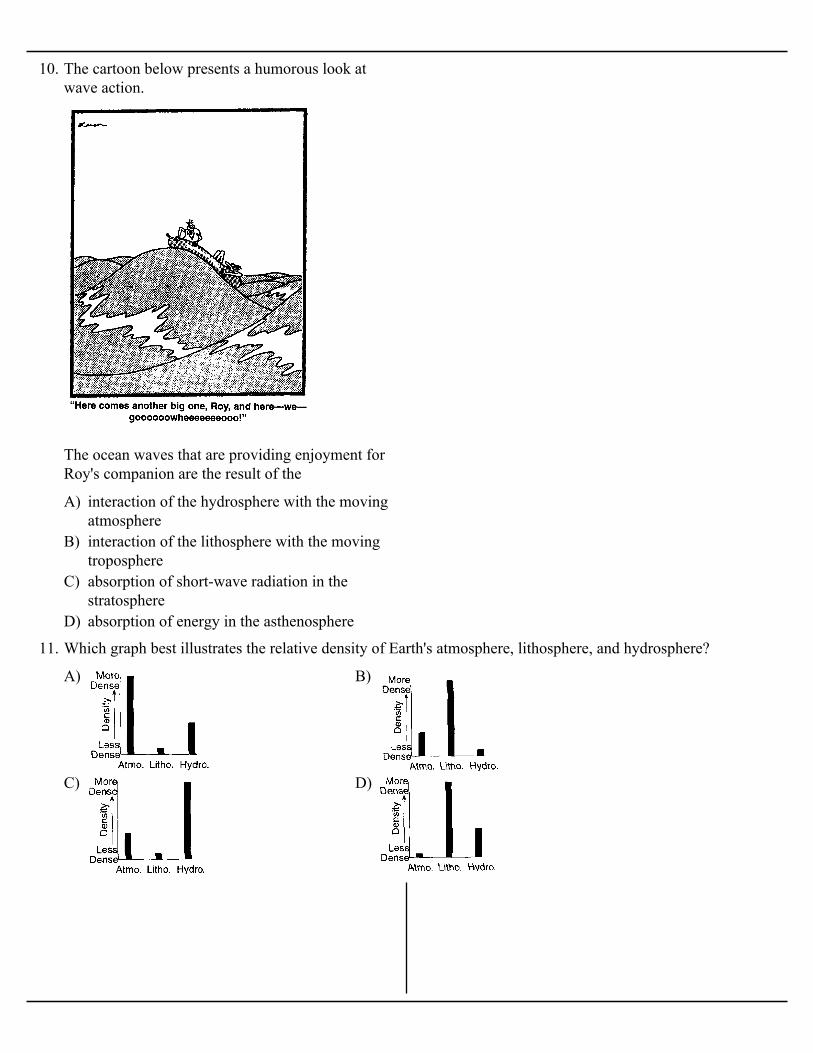
10. The cartoon below presents a humorous look atwave action.
The ocean waves that are providing enjoyment forRoy's companion are the result of the
A) B)
C) D)
11. Which graph best illustrates the relative density of Earth's atmosphere, lithosphere, and hydrosphere?
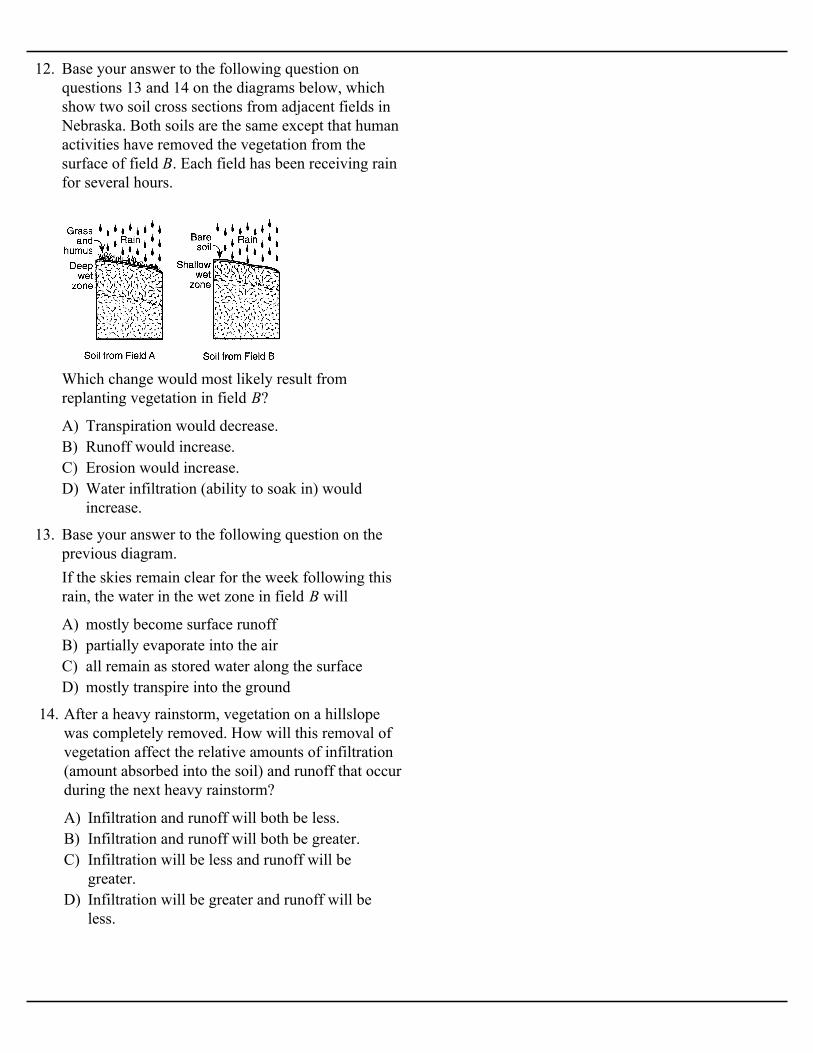
12. Base your answer to the following question onquestions 13 and 14 on the diagrams below, whichshow two soil cross sections from adjacent fields inNebraska. Both soils are the same except that humanactivities have removed the vegetation from thesurface of field B. Each field has been receiving rainfor several hours.
A) Transpiration would decrease.B) Runoff would increase.C) Erosion would increase.D) Water infiltration (ability to soak in) would
increase.
Which change would most likely result fromreplanting vegetation in field B?
13. Base your answer to the following question on theprevious diagram.
A) mostly become surface runoffB) partially evaporate into the airC) all remain as stored water along the surfaceD) mostly transpire into the ground
If the skies remain clear for the week following thisrain, the water in the wet zone in field B will
A) Infiltration and runoff will both be less.B) Infiltration and runoff will both be greater.C) Infiltration will be less and runoff will be
greater.D) Infiltration will be greater and runoff will be
less.
14. After a heavy rainstorm, vegetation on a hillslopewas completely removed. How will this removal ofvegetation affect the relative amounts of infiltration(amount absorbed into the soil) and runoff that occurduring the next heavy rainstorm?
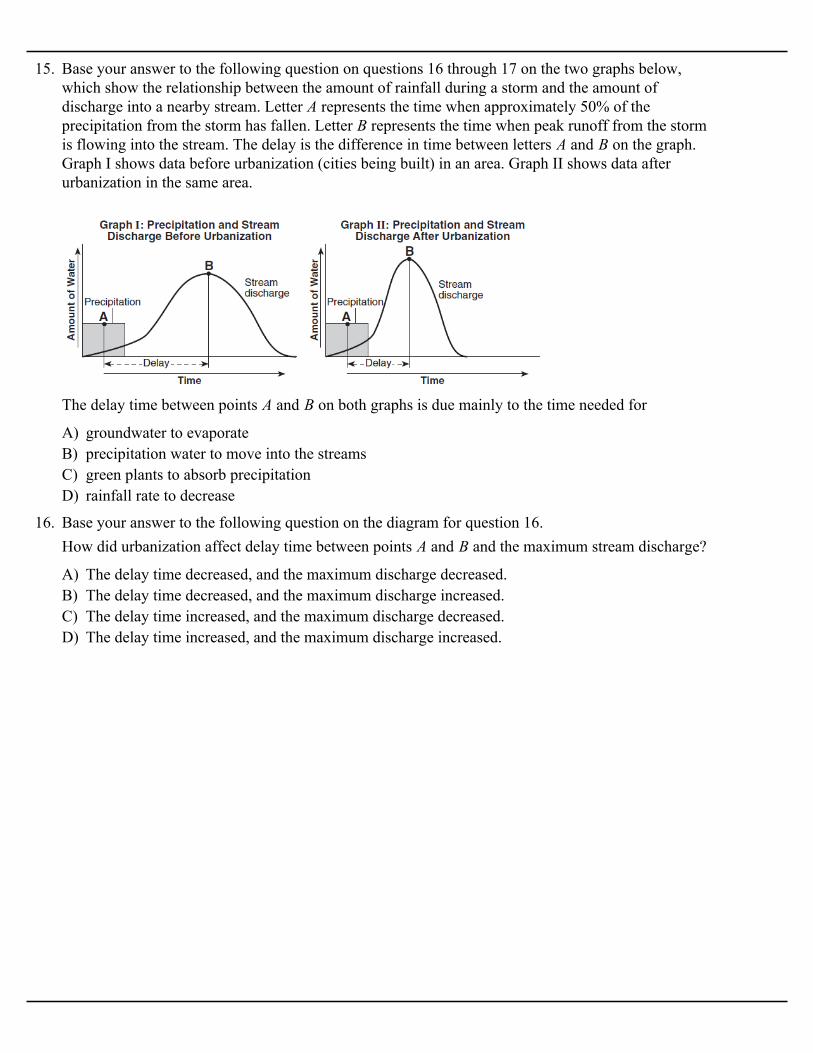
15. Base your answer to the following question on questions 16 through 17 on the two graphs below,which show the relationship between the amount of rainfall during a storm and the amount ofdischarge into a nearby stream. Letter A represents the time when approximately 50% of theprecipitation from the storm has fallen. Letter B represents the time when peak runoff from the stormis flowing into the stream. The delay is the difference in time between letters A and B on the graph.Graph I shows data before urbanization (cities being built) in an area. Graph II shows data afterurbanization in the same area.
A) groundwater to evaporateB) precipitation water to move into the streamsC) green plants to absorb precipitationD) rainfall rate to decrease
The delay time between points A and B on both graphs is due mainly to the time needed for
16. Base your answer to the following question on the diagram for question 16.
A) The delay time decreased, and the maximum discharge decreased.B) The delay time decreased, and the maximum discharge increased.C) The delay time increased, and the maximum discharge decreased.D) The delay time increased, and the maximum discharge increased.
How did urbanization affect delay time between points A and B and the maximum stream discharge?
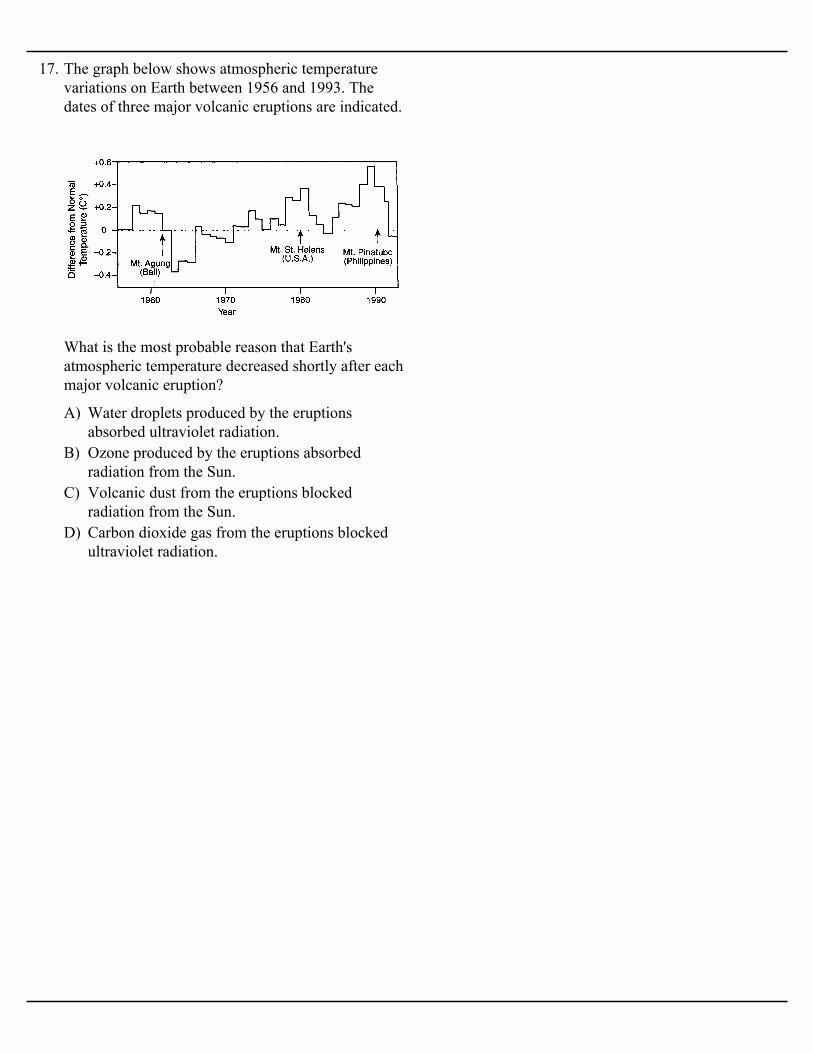
A) Water droplets produced by the eruptionsabsorbed ultraviolet radiation.
B) Ozone produced by the eruptions absorbedradiation from the Sun.
C) Volcanic dust from the eruptions blockedradiation from the Sun.
D) Carbon dioxide gas from the eruptions blockedultraviolet radiation.
17. The graph below shows atmospheric temperaturevariations on Earth between 1956 and 1993. Thedates of three major volcanic eruptions are indicated.
What is the most probable reason that Earth'satmospheric temperature decreased shortly after eachmajor volcanic eruption?
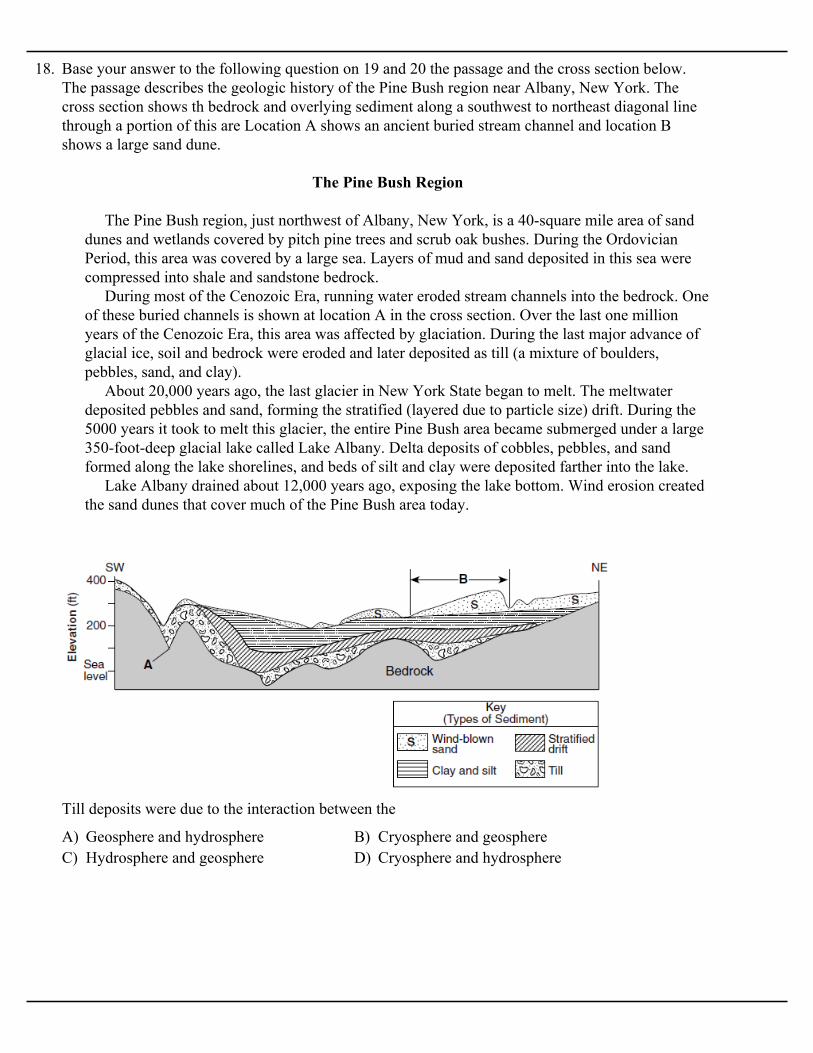
18. Base your answer to the following question on 19 and 20 the passage and the cross section below.The passage describes the geologic history of the Pine Bush region near Albany, New York. Thecross section shows th bedrock and overlying sediment along a southwest to northeast diagonal linethrough a portion of this are Location A shows an ancient buried stream channel and location Bshows a large sand dune.
The Pine Bush Region
The Pine Bush region, just northwest of Albany, New York, is a 40-square mile area of sanddunes and wetlands covered by pitch pine trees and scrub oak bushes. During the OrdovicianPeriod, this area was covered by a large sea. Layers of mud and sand deposited in this sea werecompressed into shale and sandstone bedrock. During most of the Cenozoic Era, running water eroded stream channels into the bedrock. Oneof these buried channels is shown at location A in the cross section. Over the last one millionyears of the Cenozoic Era, this area was affected by glaciation. During the last major advance ofglacial ice, soil and bedrock were eroded and later deposited as till (a mixture of boulders,pebbles, sand, and clay). About 20,000 years ago, the last glacier in New York State began to melt. The meltwaterdeposited pebbles and sand, forming the stratified (layered due to particle size) drift. During the5000 years it took to melt this glacier, the entire Pine Bush area became submerged under a large350-foot-deep glacial lake called Lake Albany. Delta deposits of cobbles, pebbles, and sandformed along the lake shorelines, and beds of silt and clay were deposited farther into the lake. Lake Albany drained about 12,000 years ago, exposing the lake bottom. Wind erosion createdthe sand dunes that cover much of the Pine Bush area today.
A) Geosphere and hydrosphere B) Cryosphere and geosphereC) Hydrosphere and geosphere D) Cryosphere and hydrosphere
Till deposits were due to the interaction between the
A) Hydrosphere and geosphereB) Cryosphere and hydrosphereC) Hydrosphere and atmosphereD) Atmosphere and geosphere
19. The stratified drift formed from the interactionbetween what spheres?
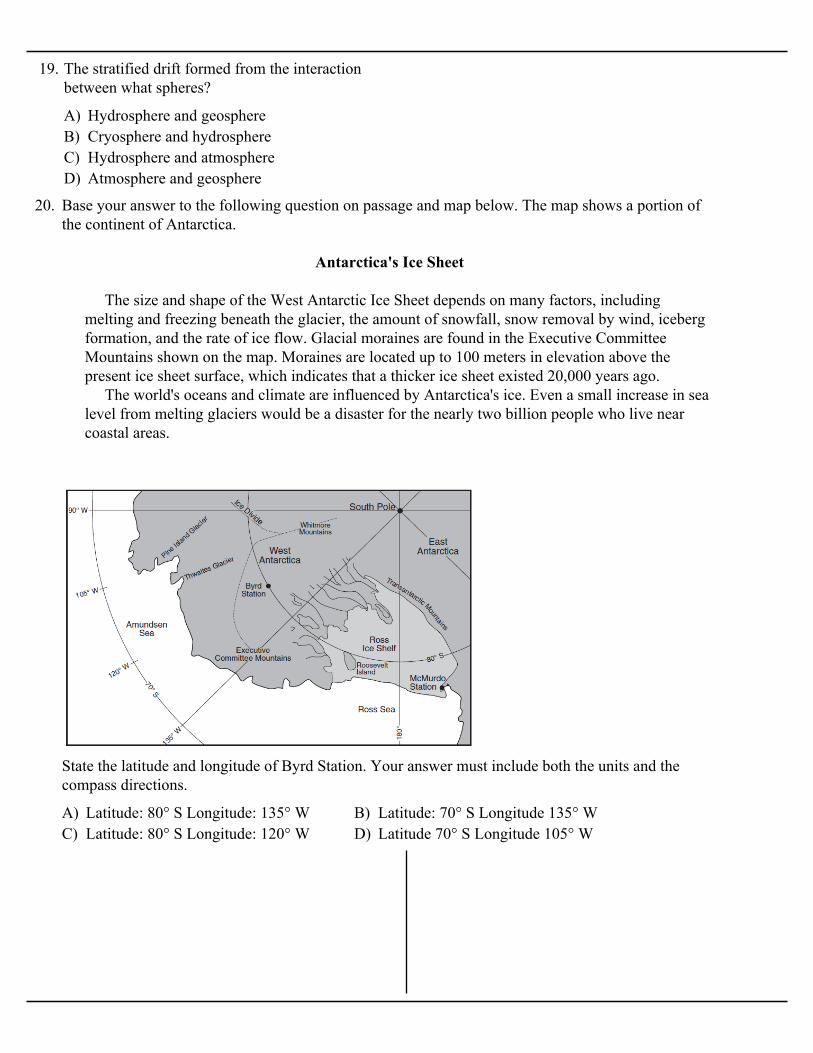
20. Base your answer to the following question on passage and map below. The map shows a portion ofthe continent of Antarctica.
Antarctica's Ice Sheet
The size and shape of the West Antarctic Ice Sheet depends on many factors, includingmelting and freezing beneath the glacier, the amount of snowfall, snow removal by wind, icebergformation, and the rate of ice flow. Glacial moraines are found in the Executive CommitteeMountains shown on the map. Moraines are located up to 100 meters in elevation above thepresent ice sheet surface, which indicates that a thicker ice sheet existed 20,000 years ago. The world's oceans and climate are influenced by Antarctica's ice. Even a small increase in sealevel from melting glaciers would be a disaster for the nearly two billion people who live nearcoastal areas.
A) Latitude: 80° S Longitude: 135° W B) Latitude: 70° S Longitude 135° WC) Latitude: 80° S Longitude: 120° W D) Latitude 70° S Longitude 105° W
State the latitude and longitude of Byrd Station. Your answer must include both the units and thecompass directions.
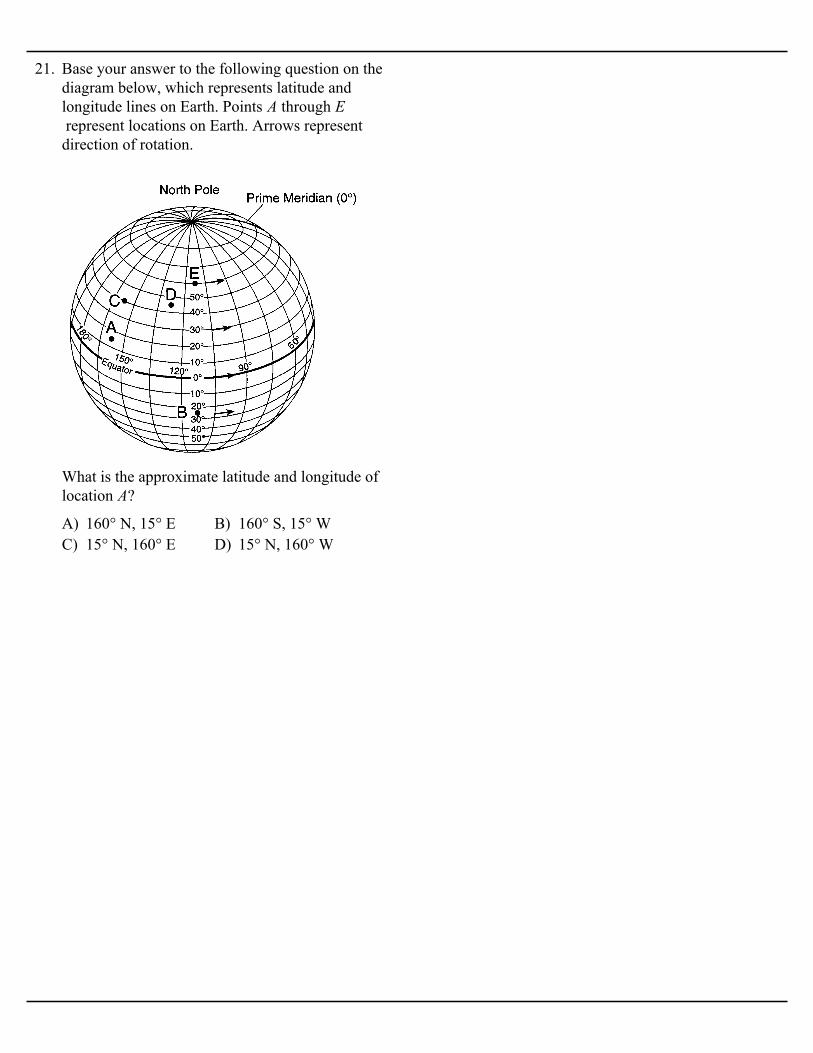
21. Base your answer to the following question on thediagram below, which represents latitude andlongitude lines on Earth. Points A through E represent locations on Earth. Arrows representdirection of rotation.
A) 160° N, 15° E B) 160° S, 15° WC) 15° N, 160° E D) 15° N, 160° W
What is the approximate latitude and longitude oflocation A?
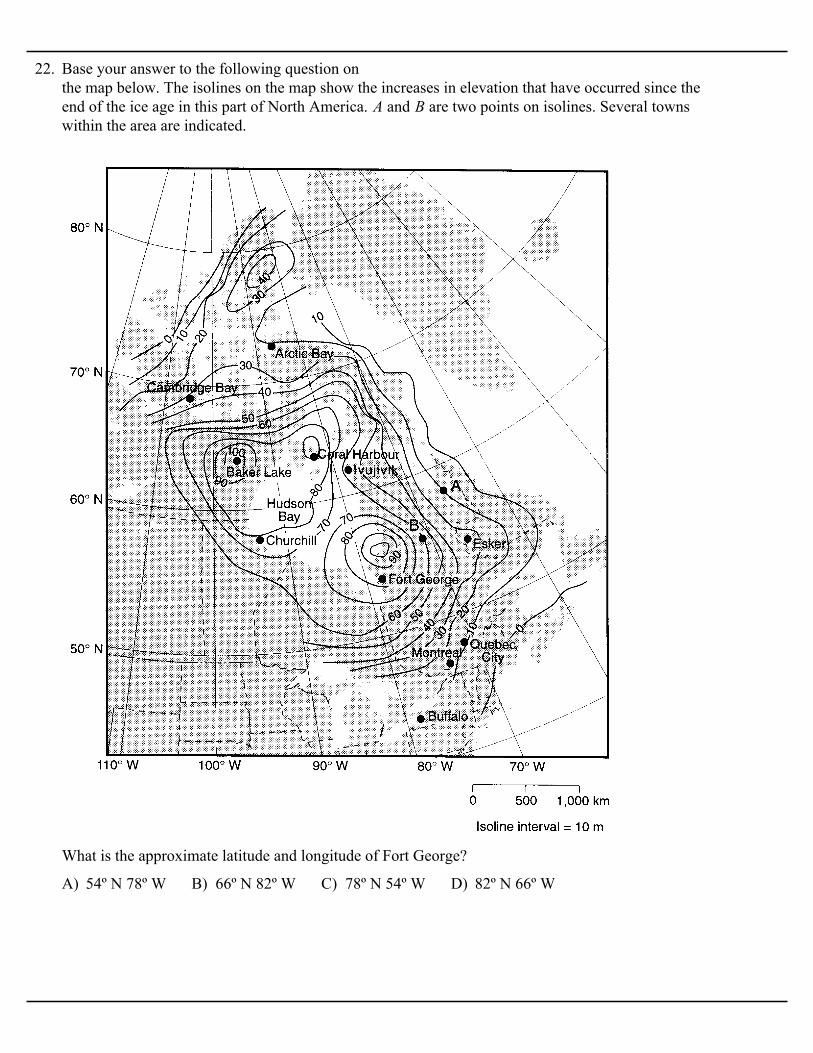
22. Base your answer to the following question on the map below. The isolines on the map show the increases in elevation that have occurred since theend of the ice age in this part of North America. A and B are two points on isolines. Several townswithin the area are indicated.
A) 54º N 78º W B) 66º N 82º W C) 78º N 54º W D) 82º N 66º W
What is the approximate latitude and longitude of Fort George?
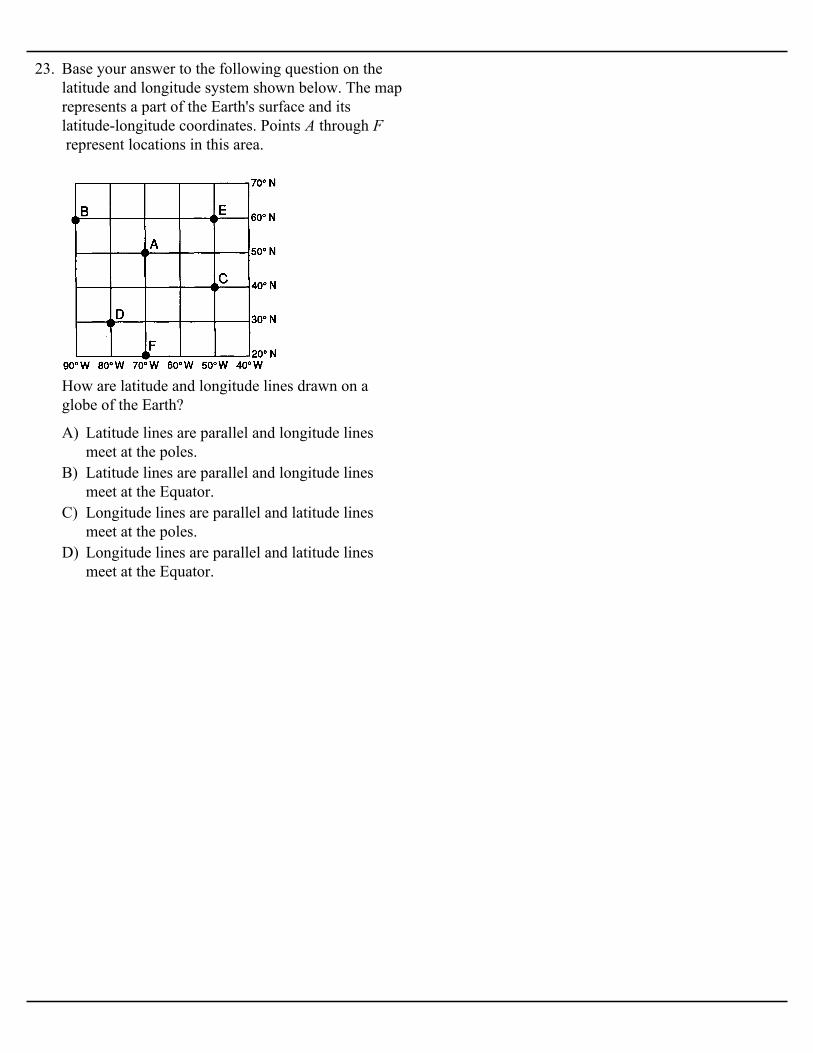
23. Base your answer to the following question on thelatitude and longitude system shown below. The maprepresents a part of the Earth's surface and itslatitude-longitude coordinates. Points A through F represent locations in this area.
A) Latitude lines are parallel and longitude linesmeet at the poles.
B) Latitude lines are parallel and longitude linesmeet at the Equator.
C) Longitude lines are parallel and latitude linesmeet at the poles.
D) Longitude lines are parallel and latitude linesmeet at the Equator.
How are latitude and longitude lines drawn on aglobe of the Earth?
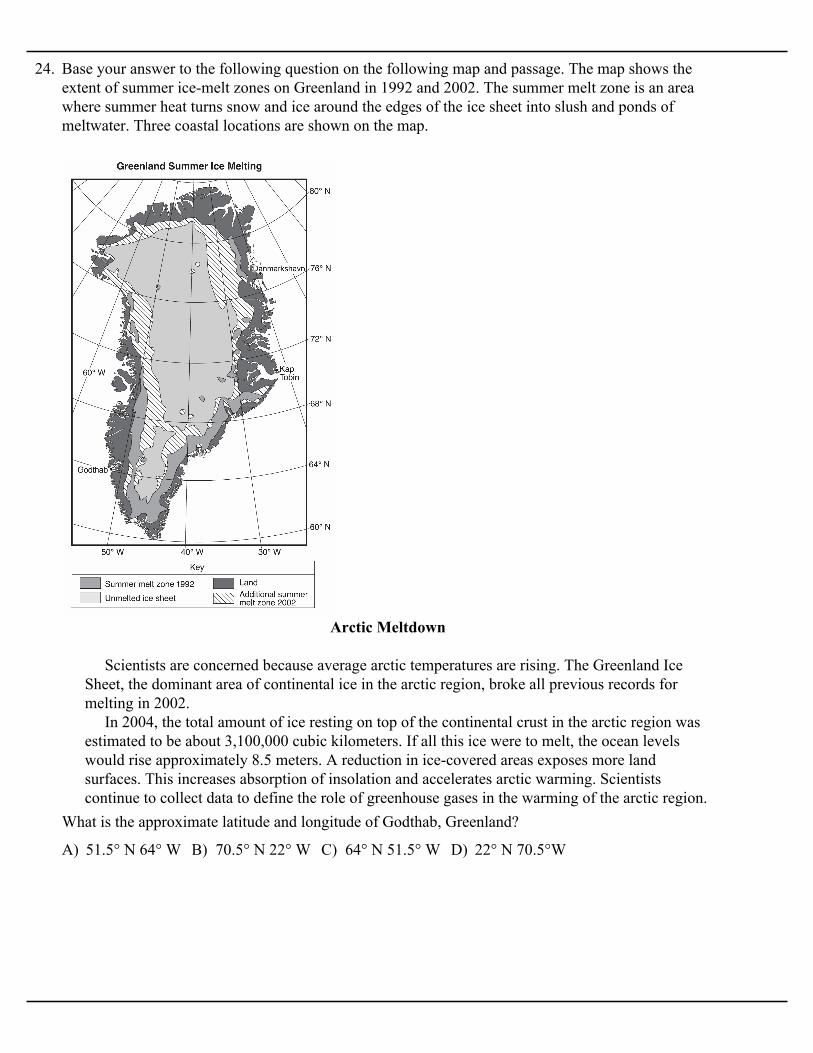
24. Base your answer to the following question on the following map and passage. The map shows theextent of summer ice-melt zones on Greenland in 1992 and 2002. The summer melt zone is an areawhere summer heat turns snow and ice around the edges of the ice sheet into slush and ponds ofmeltwater. Three coastal locations are shown on the map.
Arctic Meltdown
Scientists are concerned because average arctic temperatures are rising. The Greenland IceSheet, the dominant area of continental ice in the arctic region, broke all previous records formelting in 2002. In 2004, the total amount of ice resting on top of the continental crust in the arctic region wasestimated to be about 3,100,000 cubic kilometers. If all this ice were to melt, the ocean levelswould rise approximately 8.5 meters. A reduction in ice-covered areas exposes more landsurfaces. This increases absorption of insolation and accelerates arctic warming. Scientistscontinue to collect data to define the role of greenhouse gases in the warming of the arctic region.
A) 51.5° N 64° W B) 70.5° N 22° W C) 64° N 51.5° W D) 22° N 70.5°W
What is the approximate latitude and longitude of Godthab, Greenland?
A) B)
C) D)
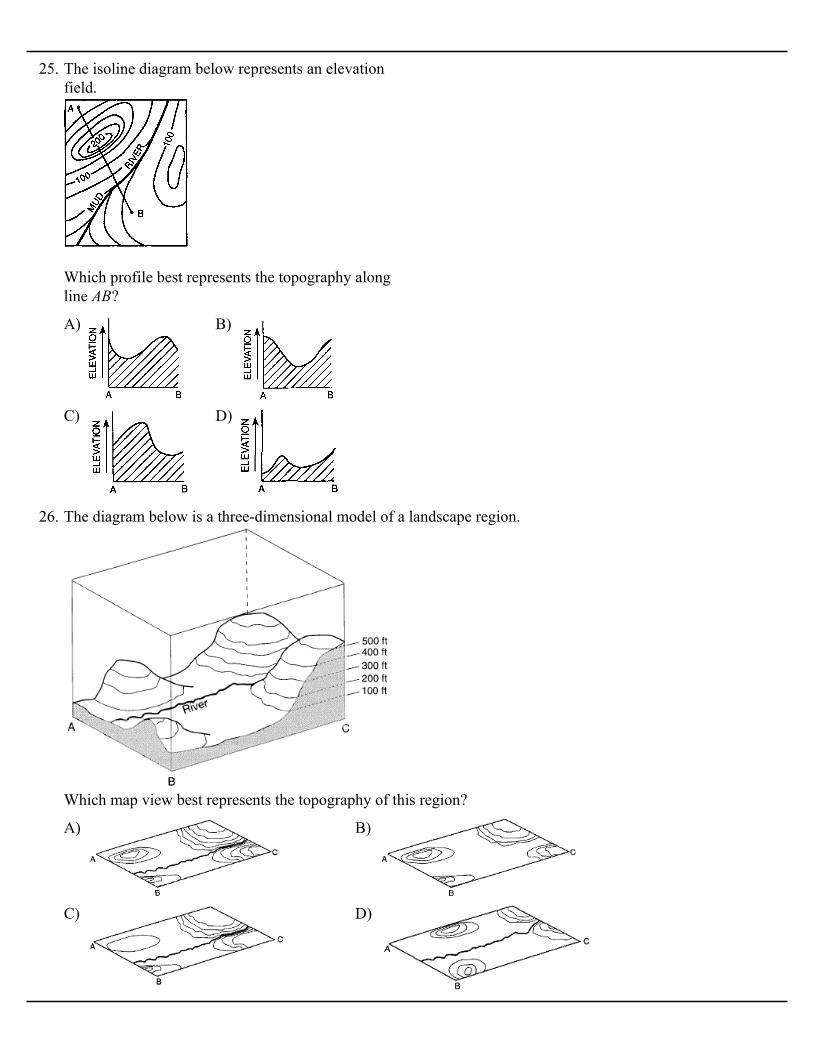
25. The isoline diagram below represents an elevationfield.
Which profile best represents the topography alongline AB?
A) B)
C) D)
26. The diagram below is a three-dimensional model of a landscape region.
Which map view best represents the topography of this region?
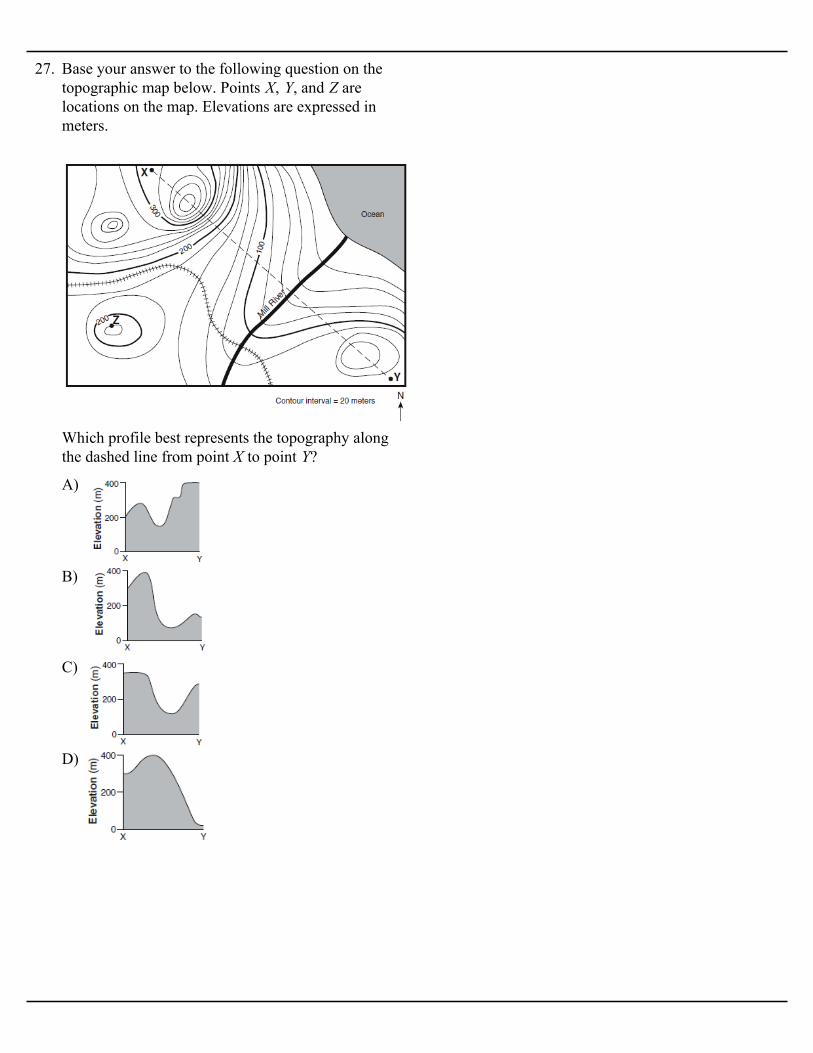
27. Base your answer to the following question on thetopographic map below. Points X, Y, and Z arelocations on the map. Elevations are expressed inmeters.
A)
B)
C)
D)
Which profile best represents the topography alongthe dashed line from point X to point Y?
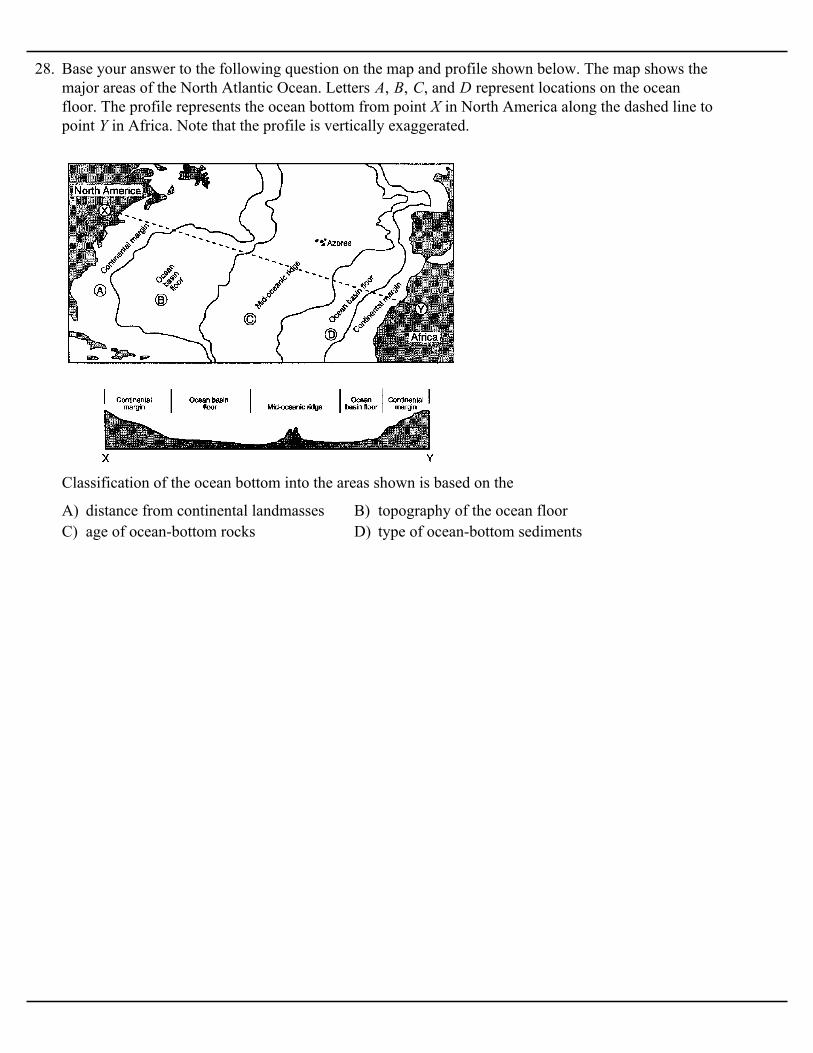
28. Base your answer to the following question on the map and profile shown below. The map shows themajor areas of the North Atlantic Ocean. Letters A, B, C, and D represent locations on the oceanfloor. The profile represents the ocean bottom from point X in North America along the dashed line topoint Y in Africa. Note that the profile is vertically exaggerated.
A) distance from continental landmasses B) topography of the ocean floorC) age of ocean-bottom rocks D) type of ocean-bottom sediments
Classification of the ocean bottom into the areas shown is based on the
Earth Science
Name _________________ Class _________________ Date _________
1.2.3.4.5.6.7.8.9.10.11.12.13.14.15.16.17.18.19.20.21.22.23.24.25.26.27.28.