1q/14 analyst meeting presentation - …investor.pttgcgroup.com/misc/presn/20140516-pttgc... · •...
TRANSCRIPT

1Q/14 Analyst Meeting Presentation
St. Regis Hotel, Bangkok May 16, 2014
Bowon Vongsinudom, President & CEO
Patiparn Sukorndhaman, EVP-Finance and Accounting
Saroj Putthammawong, VP-Supply Sourcing
Disclaimer
This presentation includes forward-looking statements that are subject to risks and uncertainties, including those pertaining to the anticipated benefits to be realized from the proposals described herein. This presentation contains a number of forward-looking statements including, in particular, statements about future events, future financial performance, plans, strategies, expectations, prospects, competitive environment, regulation and supply and demand. PTTGC has based these forward-looking statements on its views with respect to future events and financial performance. Actual financial performance of the entities described herein could differ materially from that projected in the forward-looking statements due to the inherent uncertainty of estimates, forecasts and projections, and financial performance may be better or worse than anticipated. Given these uncertainties, readers should not put undue reliance on any forward-looking statements. Forward-looking statements represent estimates and assumptions only as of the date that they were made. The information contained in this presentation is subject to change without notice and PTTGC does not undertake any duty to update the forward-looking statements, and the estimates and assumptions associated with them, except to the extent required by applicable laws and regulations.
2

Agenda
3
1Q/14 Business Highlights 1
Strategy and Excellence Projects Updates 2
1Q/14 Operating Results 3
Market Outlook 4

Agenda
4
1Q/14 Business Highlights 1
Strategy and Excellence Projects Updates 2
1Q/14 Operating Results 3
Market Outlook 4

1Q/14 Business Environments and Operations
5
Plants Maintenance Shutdown in 1Q/14
• Improving EURO Zone Economy out from recession
• Continuation of QE Tapering • US economic recovery
• IEA forecast global demand growth to 1.3 mb/d for 2014
• IMF Forecast World GDP to growth at 3.6% in 2014 and 3.9% in 2015
• Partly lift sanction against Iran
• Ease political situation in Libya
• Weak Economy from Political Unrest
• China Growth Stumble as Govt. reform from Export orientated to domestic Consumption
• Slight decline in oil price from increasing Non-OPEC Oil Supply but sustain at high level
• Easing of political situation in oil producing countries
• Ukraine/Russia Conflict over Crimea
Operation Oil Market
Economic Petrochemical Market
• Strong HDPE Price from well balanced market
• Squeezed PX spread from additional PX capacities and weak demand
• Soften MEG from weak demand, and high inventories
HDPE
PX

1Q/14 Business Highlights Performance Soften from Weak Aromatics Market and Key Performance Plant Shutdowns
(Unit: Million Baht) 1Q/13 4Q/13 1Q/14 Change YoY
Change QoQ
Sale Revenue 141,309 154,599 146,366 +4% -5%
EBITDA 16,419 14,089 10,999 -33% -22%
EBITDA Margin (%) 12% 9% 8% -35% -18%
Net Profit 12,075 7,421 6,296 -48% -15%
Earnings Per Share (Baht/share) 2.68 1.65 1.40 -48% -15%
Adjusted EBITDA 17,062 12,763 11,574 -32% -9%
Adjusted EBITDA Margin (%) 12% 8% 8% -35% -4%
6
% EBITDA Margin 1Q/2013 4Q/2013 1Q/2014Business Unit :
Refinery 3 3 3Aromatics 14 5 3Olefins and Derivative
30 24 24
Green 8 10 4HVS 4 1 3
Average 12 8 8

Agenda
7
1Q/14 Business Highlights 1
Strategy and Excellence Projects Updates 2
1Q/14 Operating Results 3
Market Outlook 4

ASEAN: Pertamina
CHINA: Sinochem
• Excellence program EBITDA uplift as of 1Q/14
• Debottlenecking projects construction progress
• JV plan on schedule • Business direction for
International Businesses
• R&D Center Progress • Integration of
Technology/Knowhow
Strategic Direction
Debottlenecking
Synergy Excellence
Marketing Excellence
Operational Excellence
NEW GEOGRAPHIES NEW PRODUCTS
System House: Compounding:
PC, PU, Nylon 6-6
1-STEP ADJACENCIES
EXCELLENCE EXECUTION
Olechemicals
PLA
Succinic Acid
PLA/PBS Compound
KNOW HOW
CORE UPLIFT PROJECTS
GREEN
+ R&D
Center
AUTOMOTIVE E&E CONSTRUCTION
EBITDA Uplift
15-30% (2012-2017)
1st Quartile Performance ROIC > 14%
Listed in Globally
Sustainability Index
8

Adjusted Target • Revised Operational Excellence target • Include only projects passed stage gates
* Debottleneck EBITDA uplift includes 1Q/14 BV project starts up 3Q/15 TOCGC Plant Improvement Project 4Q/15 PX Expansion starts up Not Including PTTPE Cracker Debottlenecking and LLDPE Expansion
Original Target
Excellence Programs Update 1Q/14 EBITDA UPLIFT
Core Uplift 1-Step Adjacencies Green Business
Excellence Programs
2014 Target (MUSD)
1Q/14 Actual (MUSD)
Synergy Excellence - Heavy Gas (Offgas) - Pure H2 via PSA - C3/C4 Stream - 3 Streams (Heavy Gasoline, LCB, CB) - Heavy Aromatics
83.0 6.5
Marketing Excellence - Customer Portfolio Management - Product Development - Pricing Excellence
80.0 20.4
Operational Excellence - Total 42 projects in 2014 - 29 Energy Saving Projects - 7 Plant Reliability Projects - 6 Cost Reduction/Optimization
Projects
31.0 6.4
Total 194.0 33.3
(MUSD)
(MUSD)
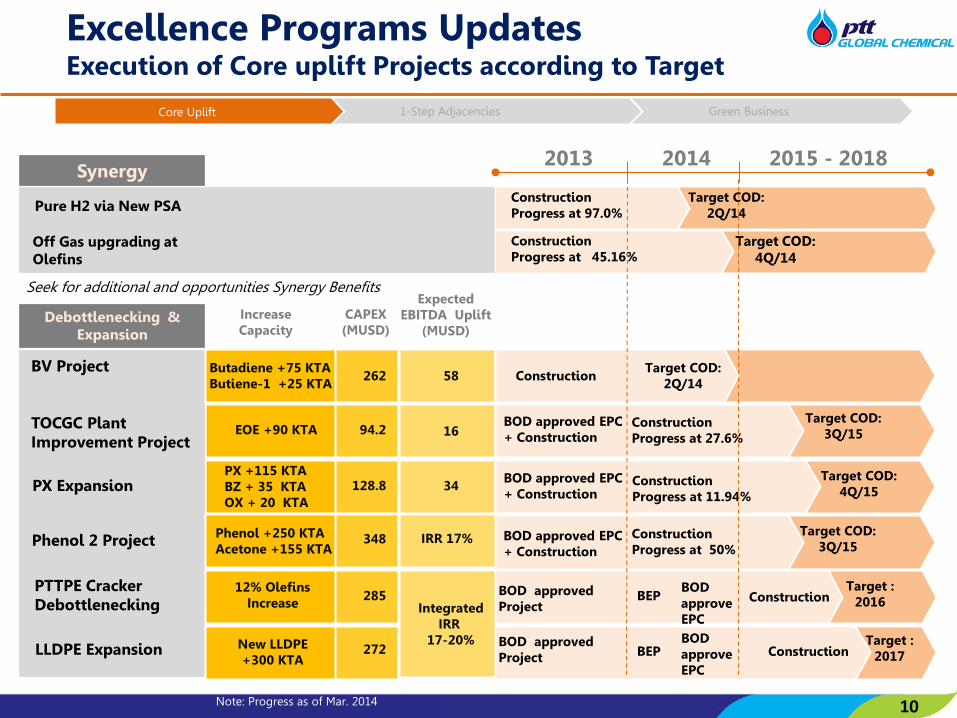
Target COD: 2Q/14
Target COD: 4Q/14
Construction Progress at 97.0%
Construction Progress at 45.16%
Phenol 2 Project
TOCGC Plant Improvement Project
Debottlenecking & Expansion
PTTPE Cracker Debottlenecking
PX Expansion
LLDPE Expansion
2013 2015 - 2018 2014 Synergy
Pure H2 via New PSA
Off Gas upgrading at Olefins
Target COD: 3Q/15
Target COD: 4Q/15
Target COD: 3Q/15
BEP
Target : 2016 BEP
Target : 2017
Construction Progress at 27.6%
Construction Progress at 11.94%
Construction Progress at 50%
BOD approved Project
BOD approved Project
BOD approve EPC BOD approve EPC
Construction
Construction
Seek for additional and opportunities Synergy Benefits
Note: Progress as of Mar. 2014
Excellence Programs Updates Execution of Core uplift Projects according to Target
10
Increase Capacity
CAPEX (MUSD)
Expected EBITDA Uplift
(MUSD)
EOE +90 KTA
PX +115 KTA BZ + 35 KTA OX + 20 KTA
Phenol +250 KTA Acetone +155 KTA
12% Olefins Increase
New LLDPE +300 KTA
94.2
128.8
348
285
272
Integrated IRR
17-20%
16
34
IRR 17%
BOD approved EPC + Construction
BOD approved EPC + Construction
BOD approved EPC + Construction
Target COD: 2Q/14
Butadiene +75 KTA Butiene-1 +25 KTA
262 58 BV Project
Construction
Core Uplift 1-Step Adjacencies Green Business
Business Direction
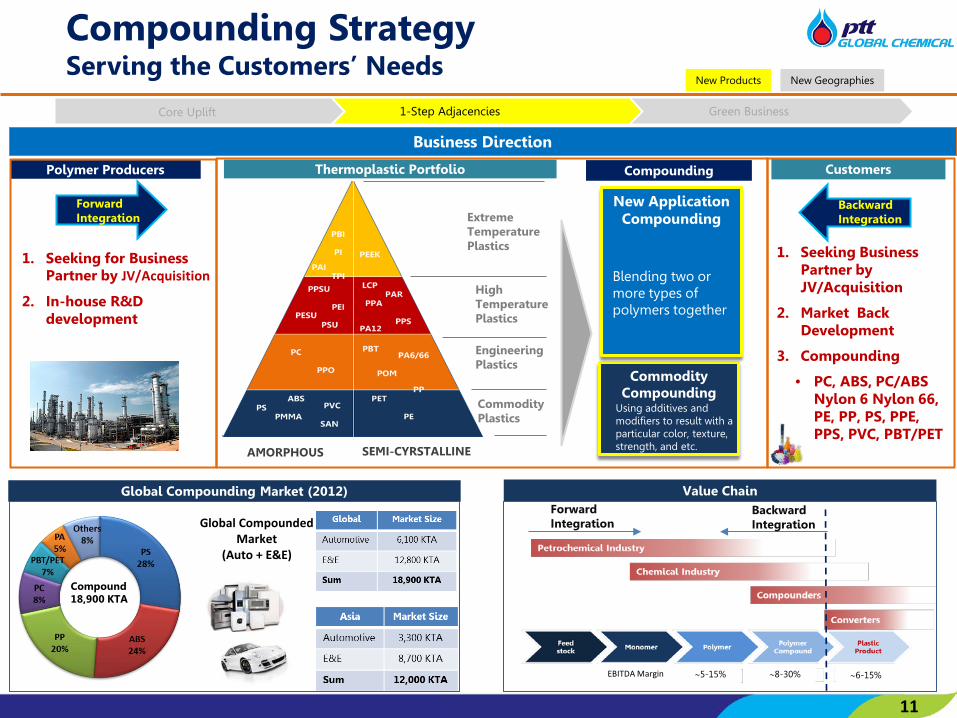
Compounding Strategy Serving the Customers’ Needs
11
Global Compounding Market (2012)
Compound 18,900 KTA
Global Compounded Market
(Auto + E&E)
Commodity Compounding
Using additives and modifiers to result with a particular color, texture, strength, and etc.
1. Seeking Business Partner by JV/Acquisition
2. Market Back Development
3. Compounding
• PC, ABS, PC/ABS Nylon 6 Nylon 66, PE, PP, PS, PPE, PPS, PVC, PBT/PET
Forward Integration Extreme
Temperature Plastics
High Temperature Plastics
Engineering Plastics
Commodity Plastics
AMORPHOUS SEMI-CYRSTALLINE
Thermoplastic Portfolio
New Application Compounding
Blending two or more types of polymers together
Compounding Polymer Producers Customers
Core Uplift 1-Step Adjacencies Green Business
New Geographies New Products
1. Seeking for Business Partner by JV/Acquisition
2. In-house R&D development
Value Chain Forward Integration
Backward Integration
∼5-15% ∼8-30% ∼6-15%
Backward Integration
EBITDA Margin

Vencorex Business Directions Focusing its activities toward specialty Isocyanates
12
Isocyanate
HDI
TDI
MDI
Transaction: • Investment transaction completed on May 31, 2012 • 51% stake – Investment capital to ₤121 million Objective: • To step into HVS (PU Chain) by using the technology and
knowhow (TDI & HDI) from Vencorex • Maintain existing business and expand business in Asia • Forward integration into downstream
51% 49%
Business Directions
1. Expand and enhance HDI Business
2. Continue R&D for TDI and HDI Process Improvement
3. Utilizing TDI technology in Asia where demand is growing
4. Stop TDI Production in France from maturing market
5. Seek for Business Partner of Isocyanates & PU to expand the Business in Asia
Rationale of Investment
Core Uplift 1-Step Adjacencies Green Business
New Geographies New Products
Polyols Propylene Oxide (PO)
Toluene
Benzene
Propylene
Butadiene
Propylene
HMDA
1
2
JV / Acquisition
JV / Acquisition
Bio-Polyols
Polyols
Formulation
Polyurethane Flexible & Rigid Foam (69%)
Polyurethane Coating and Paint (16%)
Polyurethane Elastomers and Others (15%)
Polyurethane
System House
3
Seeking for JV/Acquisition

Transformation of Myriant to PTTGC’s Biotechnology R&D Center
13
Transforming into World Class Biotechnology R&D Center
R&D Technology and Knowhow Transfer
Products in the Pipeline Progress
14 KTA Semi-Commercial Plant in operation at Lake Providence, Louisiana
R&D Phase I: Lab-level Economics
Licensed to Purac, business partner in Spain, and is producing at commercial scale.
R&D Phase I: Lab-level Economics
Applications
From R&D Products
Applications Market
Butanediol (BDO) (SAC)
Core Uplift 1-Step Adjacencies Green Business
Green Business Roadmap
Succinic Acid(SAC)
Butanediol (BDO)
Poly butylene Succinate (PBS)
PLA/PBSCompound
Lactic Acid(HLA)
Poly Lactic Acid(PLA)
Acrylic Acid
Corn/Sugars
CellulosicFeedstock Polyacrylic
Acid/Acrylic ester
PLA Resin
Muconic Acid Adipic Acid
• Located in Boston, Massachusetts which fully equipped with R&D Resources and Facilities
Agenda
14
1Q/14 Business Highlights 1
Strategy and Excellence Projects Updates 2
1Q/14 Operating Results 3
Market Outlook 4
Business Environment and Operations Recap
15
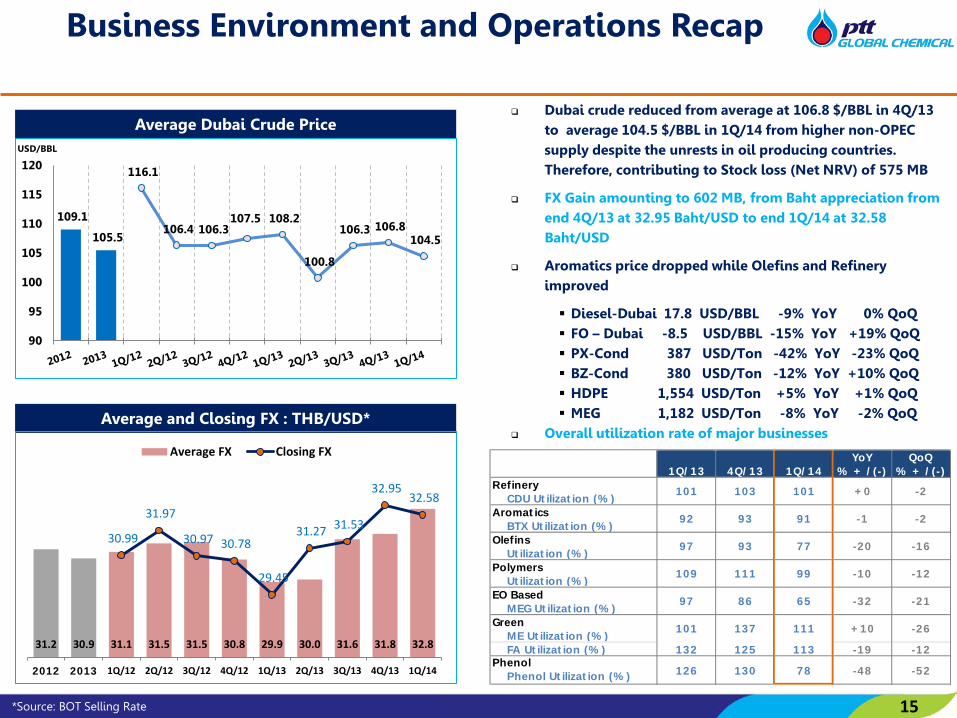
Dubai crude reduced from average at 106.8 $/BBL in 4Q/13 to average 104.5 $/BBL in 1Q/14 from higher non-OPEC supply despite the unrests in oil producing countries. Therefore, contributing to Stock loss (Net NRV) of 575 MB
FX Gain amounting to 602 MB, from Baht appreciation from end 4Q/13 at 32.95 Baht/USD to end 1Q/14 at 32.58 Baht/USD
Aromatics price dropped while Olefins and Refinery improved
Diesel-Dubai 17.8 USD/BBL -9% YoY 0% QoQ FO – Dubai -8.5 USD/BBL -15% YoY +19% QoQ PX-Cond 387 USD/Ton -42% YoY -23% QoQ BZ-Cond 380 USD/Ton -12% YoY +10% QoQ HDPE 1,554 USD/Ton +5% YoY +1% QoQ MEG 1,182 USD/Ton -8% YoY -2% QoQ
Overall utilization rate of major businesses
*Source: BOT Selling Rate
109.1
105.5
116.1
106.4 106.3 107.5 108.2
100.8
106.3 106.8 104.5
90
95
100
105
110
115
120
Average Dubai Crude Price USD/BBL
Average and Closing FX : THB/USD*
1Q/13 4Q/13 1Q/14YoY
% + /(-)QoQ
% + /(-)Refinery CDU Utilization (%)
101 103 101 +0 -2
Aromatics BTX Utilization (%)
92 93 91 -1 -2
Olefins Utilization (%)
97 93 77 -20 -16
Polymers Utilization (%)
109 111 99 -10 -12
EO Based MEG Utilization (%)
97 86 65 -32 -21
Green ME Utilization (%)
101 137 111 +10 -26
FA Utilization (%) 132 125 113 -19 -12Phenol Phenol Utilization (%) 126 130 78 -48 -52
31.2 30.9 31.1 31.5 31.5 30.8 29.9 30.0 31.6 31.8 32.8
30.99
31.97
30.97 30.78
29.45
31.27 31.53
32.95 32.58
2012 2013 1Q/12 2Q/12 3Q/12 4Q/12 1Q/13 2Q/13 3Q/13 4Q/13 1Q/14
Average FX Closing FX

Refinery Performance Improved Mkt GRM
16
ULG
95
- D
B
JET
- D
B
Die
sel
- D
B
FO -
DB
14.4 13.7 18.4
14.6 12.4 9.2 14.6
2012 2013 1Q/13 2Q/13 3Q/13 4Q/13 1Q/14
17.8 17.5 20.3
15.3 17.0 17.3 17.0
2012 2013 1Q/13 2Q/13 3Q/13 4Q/13 1Q/14
19.1 17.9
19.6
16.8 17.3 17.7 17.8
2012 2013 1Q/13 2Q/13 3Q/13 4Q/13 1Q/14
-3.4 -8.1 -7.4
-3.7
-10.7 -10.5
-8.5
2012 2013 1Q/13 2Q/13 3Q/13 4Q/13 1Q/14
Petroleum Product Spread (USD/BBL)
+58% QoQ -21% YoY
-2% QoQ -16% YoY
0% QoQ -9% YoY
+19% QoQ -15% YoY 4.71 3.52 4.37
2.38 3.48 3.42 4.48
(0.30)
0.84
(0.91)
(2.45)
4.21
1.11
(0.69)
0.35 0.78 0.27 1.23
0.98
0.78 0.33
4.76 5.14 3.73
1.16
8.67
5.31 4.12
(10.00) (8.00) (6.00) (4.00) (2.00) - 2.00 4.00 6.00 8.00
(4.00)
(2.00)
-
2.00
4.00
6.00
8.00
10.00
2012 2013 1Q/13 2Q/13 3Q/13 4Q/13 1Q/14
Market GRM Stock Gain/(Loss) Net NRV
Hedging Gain/(Loss) Accounting GRM
Gross Refinery Margin (USD/BBL)
2012 2013 1Q/13 2Q/13 3Q/13 4Q/13 1Q/14
Market GRM 4.71 3.52 4.37 2.38 3.48 3.42 4.48
GRM on CRS 2.97 2.87 3.08 2.38 2.90 2.98 2.85
GRM on CDU 5.84 4.37 5.50 2.73 4.31 4.31 5.52
Total Intake (KBD)
100% 91% 101% 63% 98% 103% 101%
Sales Volume (KBD)
-9% QoQ -3% YoY
CDU U-Rate
7% 8% 9% 5% 9% 8% 5% 13% 14% 15% 13% 15% 13% 14%
55% 51% 50% 54% 52% 49% 52%
9% 12% 11% 10% 12% 15% 13% 16% 14% 14% 16% 12% 15% 16%
194 166 180 111 176 196 185
2012 2013 1Q/13 2Q/13 3Q/13 4Q/13 1Q/14
Naphtha + Ref.
Jet
Diesel
Fuel Oil
Others
-5% QoQ +3% YoY
Note: In 2Q/13, Refinery had Planned Turnaround of 38 days
145.9 132.4 146.3 91.8
142.4 149.1 146.5
51.0 54.7 57.8
36.0
55.5 69.4 52.5
196.9 187.1 204.1
127.8
197.8 218.4 198.9
2012 2013 1Q/13 2Q/13 3Q/13 4Q/13 1Q/14
Crude Condenstate Residue & Others
946 922 948 871
930 937 917
1,484 1,479 1,618
1,409 1,440 1,440
1,304 1,207
1,301 1,379
1,286 1,258 1,283
1,297
800
1000
1200
1400
1600
1800
2012 2013 1Q/13 2Q/13 3Q/13 4Q/13 1Q/14
Condensate Erawan PX FECP BZ Spot Korea
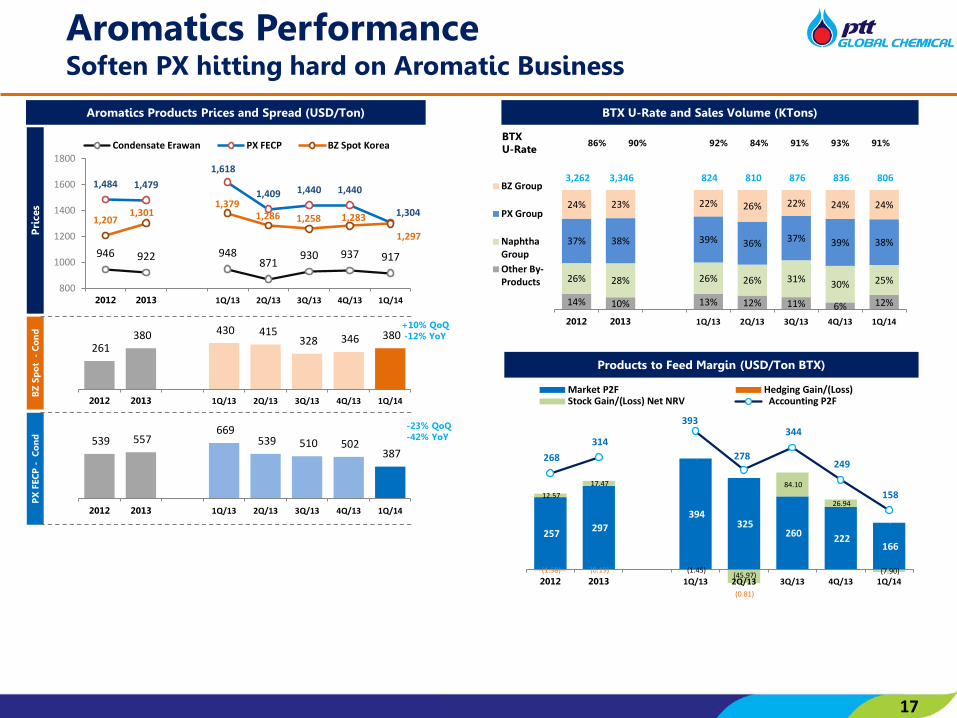
Aromatics Performance Soften PX hitting hard on Aromatic Business
Pri
ces
PX
FEC
P -
Co
nd
B
Z S
po
t -
Co
nd
Aromatics Products Prices and Spread (USD/Ton)
-23% QoQ -42% YoY
+10% QoQ -12% YoY
539 557 669
539 510 502 387
2012 2013 1Q/13 2Q/13 3Q/13 4Q/13 1Q/14
261 380 430 415
328 346 380
2012 2013 1Q/13 2Q/13 3Q/13 4Q/13 1Q/14
257 297 394
325 260 222
166
(1.58) (0.19)
-
(0.81)
- -
-
12.57 17.47
(1.45) (45.97)
84.10
26.94
(7.90)
268 314
393
278
344
249
158
(100)
-
100
200
300
400
(100)
-
100
200
300
400
500
2012 2013 1Q/13 2Q/13 3Q/13 4Q/13 1Q/14
Market P2F Hedging Gain/(Loss)Stock Gain/(Loss) Net NRV Accounting P2F
Products to Feed Margin (USD/Ton BTX)
14% 10% 13% 12% 11% 6% 12%
26% 28% 26% 26% 31% 30% 25%
37% 38% 39% 36% 37% 39% 38%
24% 23% 22% 26% 22% 24% 24%
3,262 3,346 824 810 876 836 806
2012 2013 1Q/13 2Q/13 3Q/13 4Q/13 1Q/14
BZ Group
PX Group
NaphthaGroupOther By-Products
BTX U-Rate and Sales Volume (KTons)
86% 90%
92% 84% 91% 93% 91% BTX U-Rate
17

Olefins and Derivatives Performance Strong HDPE Price but impact from shutdown and soften MEG
Pri
ces
MEG
AC
P –
0.6
5Eth
ylen
e H
DP
E -
Nap
hth
a
Olefins Derivatives Prices and Spread (USD/Ton)
-13% QoQ -35% YoY
+5% QoQ +19% YoY
Adjusted EBITDA Margin
U-Rate (%)
436 566 521 585 568 590 620
2012 2013 1Q/13 2Q/13 3Q/13 4Q/13 1Q/14
379 323
-
375 351 284 281 245
2012 2013 1Q/13 2Q/13 3Q/13 4Q/13 1Q/14
2012 2013 1Q/13 2Q/13 3Q/13 4Q/13 1Q/14HDPE (FILM) SEA 1,380 1,488 1,482 1,443 1,489 1,536 1,554LLDPE CFR SEA 1,354 1,487 1,477 1,433 1,490 1,549 1,560LDPE CFR SE Asia 1,362 1,534 1,459 1,444 1,569 1,664 1,639MEG ACP 1,179 1,202 1,282 1,173 1,143 1,208 1,182Naphtha MOPJ 943 921 961 858 920 946 935
1,380 1,488 1,482 1,443 1,489
1,536 1,554
1,179 1,202 1,282
1,173 1,143 1,208 1,182
943 921 961 858 920 946 935 700
800
900
1,000
1,100
1,200
1,300
1,400
1,500
1,600
1,700
HDPE (FILM) SEA LLDPE CFR SEA LDPE CFR SE Asia
MEG ACP Naphtha MOPJ
87% 90% 88% 90% 96% 88% 86%
13% 10% 12% 10% 4% 12% 14%
2012 2013 1Q/13 2Q/13 3Q/13 4Q/13 1Q/14
Gas Naphtha
27% 27% 30% 28% 26% 24% 24%
2012 2013 1Q/13 2Q/13 3Q/13 4Q/13 1Q/14
GAS : NAPHTHA
+1% QoQ +5% YoY
18
2012 2013 1Q/13 2Q/13 3Q/13 4Q/13 1Q/14Olefins 88% 90% 97% 93% 75% 93% 77%HDPE 99% 106% 109% 96% 106% 113% 93%LLDPE 100% 103% 113% 72% 113% 114% 99%LDPE 88% 76% 101% 99% 5% 101% 115%MEG 88% 94% 97% 100% 92% 86% 65%
Sales Volume (KTons)
2012 2013 1Q/13 2Q/13 3Q/13 4Q/13 1Q/14Olefins 748 756 200 218 147 190 134 HDPE 778 834 216 193 208 217 202 LLDPE 396 397 102 70 119 107 98 LDPE 273 218 75 71 25 47 72 MEG 249 372 83 104 95 89 71 Total 2,445 2,577 676 657 594 650 578

Phenol and BPA Performance U-rate Drop from Planned Shutdown
Pri
ces
BP
A-P
hen
ol
Ph
eno
l-B
Z
Phenol/ BPA Prices and Spread (USD/Ton) U-Rate and Sales Volume (KTons)
Phenol 119% 126% 126% 127% 124% 130% 78%
BPA 74% 100% 64% 116% 116% 104% 70%
1,207 1,301
1,379 1,286 1,258 1,283 1,297
1,445 1,416 1,523
1,402 1,352 1,387 1,424
1,678 1,708
1,880
1,719 1,630 1,605 1,610
800
1000
1200
1400
1600
1800
2000
2012 2013 1Q/13 2Q/13 3Q/13 4Q/13 1Q/14
Benzene Phenol BPAU-Rate
2012 2013 1Q/13 2Q/13 3Q/13 4Q/13 1Q/14 Phenol (CMP) 1,445 1,416 1,523 1,402 1,352 1,387 1,424 BPA (CMP) 1,678 1,708 1,880 1,719 1,630 1,605 1,638 Benzene 1,207 1,301 1,379 1,286 1,258 1,283 1,297
19
Sales Volume (Kton)
238
115 145 116 94 104 126
2012 2013 1Q/13 2Q/13 3Q/13 4Q/13 1Q/14
233 292
356 317 277 218 214
2012 2013 1Q/13 2Q/13 3Q/13 4Q/13 1Q/14

Overview of Business Units’ Performance Drop in Olefins and Derivatives’ Margin
20
47%
20%
21%
6% 6% 0% 19%
8%
65%
3% 2% 3%
146,366 MB
11,574 MB
Adjusted EBITDA Sales Revenue
1Q/2014
% EBITDA Margin 1Q/2013 4Q/2013 1Q/2014 Business Unit :
Refinery 3 3 3 Aromatics 14 5 3 Olefins and Derivative 30 24 24 Green 8 10 4 HVS 4 1 3
Average 12 8 8
Change in Olefins and Derivatives adj. EBITDA
Unit: MB
EBITDA margin
1Q/2013 1Q/2014 30% 24%
YOY Volume +/- %
Olefins -33% PE -5%
MEG -15%
YOY Price +/- %
Ethylene 3% HDPE 5% MEG -8%
9,574 9,334
7,744 7,382 7,301 7,301 7,547 7,547
240
1,589
362 81 360 114
6,000
6,500
7,000
7,500
8,000
8,500
9,000
9,500
10,000

Income Statement Soften from Lower Olefins U-Rate and PX Spreads
21
Note: Adjusted EBITDA = EBITDA – Stock Gain/(Loss) &NRV
MB % MB % MB % MB % MB %1 Sales Revenue 141,309 100 154,599 100 146,366 100 5,057 4 (8,233) (5)2 Feedstock Cost (112,119) (79) (128,428) (83) (121,151) (83) 8,805 8 (7,277) (6)3 Product to Feed Margin 29,190 21 26,172 17 25,215 17 (3,748) (13) (957) (4)4 Variable Cost (6,903) (5) (7,407) (5) (7,416) (5) 628 9 (38) (1)5 Fixed Cost (4,128) (3) (4,785) (3) (4,633) (3) 618 15 (106) (2)6 Stock Gain/(Loss) & NRV (643) 0 1,326 1 (575) (0) 68 11 (1,901) (143)7 Gain/(Loss) Hedging Commodity 148 0 499 0 194 0 47 32 (305) (61)8 Other Income 1,324 1 1,660 1 1,318 1 (6) 0 (342) (21)9 SG&A (2,569) (2) (3,375) (2) (3,104) (2) 535 21 (271) (8)
10 EBITDA 16,419 12 14,089 9 10,999 8 (5,420) (33) (3,090) (22)11 Depreciation & Amortization (3,952) (3) (4,381) (3) (4,202) (3) 250 6 (179) (4)12 EBIT 12,467 9 9,708 6 6,797 5 (5,670) (45) (2,911) (30)13 Financing Expenses (1,115) (1) (1,146) (1) (1,141) (1) 26 2 (5) 0 14 FX Gain/(Loss) 1,986 1 (794) (1) 602 0 (1,384) (70) 1,396 176 15 Shares of gain/(loss) (18) 0 16 0 240 0 258 1,433 224 1,442 16 Corporate Income Tax (1,220) (1) (557) (0) (373) (0) (847) (69) (184) (33)17 Net Profit After Income Tax 12,100 9 7,227 5 6,126 4 (5,974) (49) (1,101) (15)
Portion of Net Profit: 18 Shareholders 12,075 9 7,421 5 6,296 4 (5,779) (48) (1,125) (15)19 Minorities 25 0 (194) (0) (170) (0) (195) (780) 24 12
20 Adjusted EBITDA 17,062 12 12,763 8 11,574 8 (5,488) (32) (1,189) (9)
4Q/131Q/2013 1Q/14 Change YoY Change QoQ

Strong Financial Position
22
Key Financial Ratios
As of Mar. 31, 2014 As of Dec. 31, 2013
THB 432 Bn THB 432 Bn
Cash + ST Investment
CA
PPE
Non CA
Share holders’ Equity
IBD
Liab.
Statements of Financial Position Interest Rate Currencies
64 % Fixed 52 % THB
36 % Float 48 % USD & Others
Loan Type
• Cost of long term debts ~ 4.79% (Include W/H Tax)
• Average loan life after refinancing - 4.88 Years
Treasury policy Net IBD to Equity ratio of ≤ 0.7x Net IBD to EBITDA ratio of ≤ 2.4x
THB 119 Bn
THB Bn
* After Refinance
41 41
231 231
116 112
44 48
245 251
120 119
67 62
15.36
8.94 9.86 14.93 14.43
7.83 11.76
0.68
32.63
0.28
2014 2015 2016 2017 2018 2019 2020 2021 2022 2023
PTTGC PPCL Others
1.30 1.34
0.31 0.28
0.0x0.3x0.6x0.9x1.2x1.5x
31 Dec. 13 31 Mar. 14
Net IBD / EBITDANet IBD/Equity
14.44%
11.51% 9.42% 7.97%
5%
10%
15%
20%
31 Dec. 13 31 Mar. 14
ROE ROA
Maturity of Financial Debt* as at Mar. 31, 2014 Key Financial Ratios

CAPEX to Support Growth Approved and Uncommitted CAPEX Plan for year 2013 - 2017
23
5 Years Investment CAPEX
193 246 247 256 234 234
175 59 35
325 410
103
3 0 0
19 49
46
95
15 25
26
25
32
4
738
790
463
357
249 260
545 544
216
101 15 25
2013A 2014 2015 2016 2017 2018
Green1-stepCore upliftPhenolAnnual MaintenanceTotalTotal Growth Project
Approved CAPEX Plan 2014 -2018 Unit: USD mn
*
* Including the 40% acquisition of Phenol and Phenol 2 Project

Agenda
24
1Q/14 Business Highlights 1
Strategy and Excellence Projects Updates 2
1Q/14 Operating Results 3
Market Outlook 4
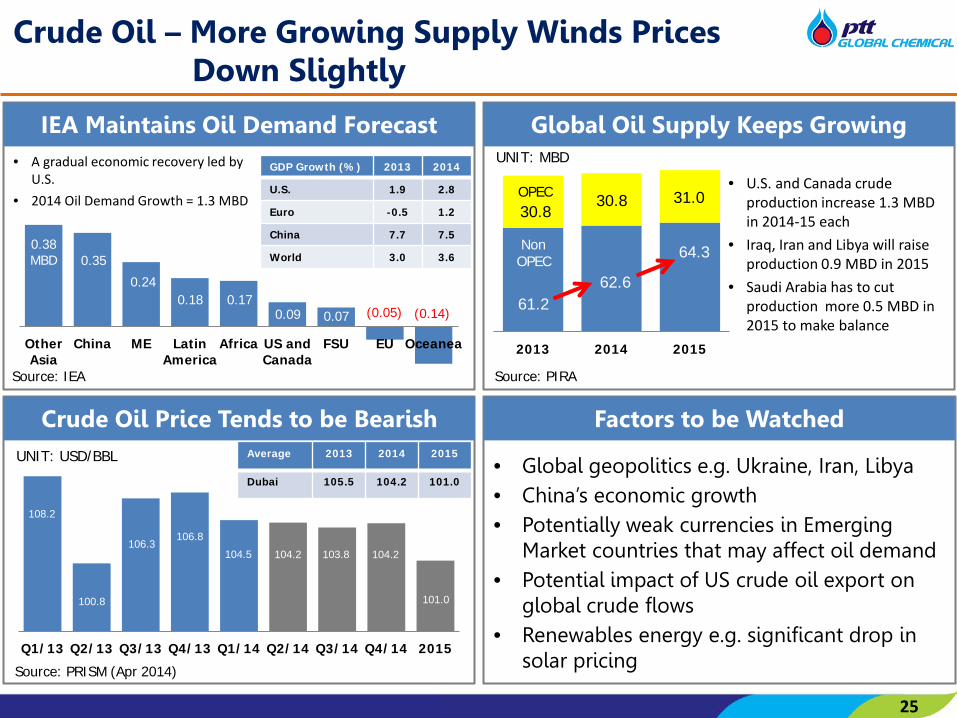
Crude Oil – More Growing Supply Winds Prices Down Slightly
• Global geopolitics e.g. Ukraine, Iran, Libya • China’s economic growth • Potentially weak currencies in Emerging
Market countries that may affect oil demand • Potential impact of US crude oil export on
global crude flows • Renewables energy e.g. significant drop in
solar pricing
IEA Maintains Oil Demand Forecast Global Oil Supply Keeps Growing
Crude Oil Price Tends to be Bearish Factors to be Watched
Q1/13 Q2/13 Q3/13 Q4/13 Q1/14 Q2/14 Q3/14 Q4/14 2015
OtherAsia
China ME LatinAmerica
Africa US andCanada
FSU EU Oceanea
Source: IEA
2013 2014 2015
Source: PIRA
Non OPEC
OPEC
GDP Growth (%) 2013 2014
U.S. 1.9 2.8
Euro -0.5 1.2
China 7.7 7.5
World 3.0 3.6
• A gradual economic recovery led by U.S.
• 2014 Oil Demand Growth = 1.3 MBD • U.S. and Canada crude
production increase 1.3 MBD in 2014-15 each
• Iraq, Iran and Libya will raise production 0.9 MBD in 2015
• Saudi Arabia has to cut production more 0.5 MBD in 2015 to make balance
0.38 MBD 0.35
0.24 0.18 0.17
0.09 0.07 (0.05) (0.14)
108.2
100.8
106.3 106.8
104.5 104.2 103.8 104.2
101.0
UNIT: USD/BBL
UNIT: MBD
61.2
30.8 30.8 31.0
62.6
64.3
Source: PRISM (Apr 2014)
Average 2013 2014 2015
Dubai 105.5 104.2 101.0
25

Refinery – Better-than-Expected Margin This Year due to Capacity Shutdowns and Delays
Capacity Additions Shift to 2015 Mid Dist. Lead Global Demand Growth
2014 Crack Spreads Improve Factors to be Watched
• China’s economic growth • Potentially weak currencies in Emerging
Market countries that may affect oil demand • Alternative fuel e.g. CNG, bio-fuel • More stringent environmental regulation e.g.
clean fuel policy
Source: PRISM (Apr 2014)
-200
-100
0
100
200
300
400
500
2012 2013 2014 2015
Gasoline
Jet/Kero
Diesel
Fuel Oil
Source: JBC
UNIT: KBD
-12-8-4048
12162024
Q1/13 Q2/13 Q3/13 Q4/13 Q1/14 Q2/14 Q3/14 Q4/14
Diesel
Gasoiline
Fuel Oil GRM 2013 (A) = $6.7/bbl GRM 2014 (F) = $7.1/bbl
UNIT: USD/BBL
-1,500
-1,000
-500
0
500
1,000
1,500
2,000
2,500
2012 2013 2014 2015 2016
Source: JBC
26
• 750 KBD capacity shutdown in Japan (420) and Australia (330) in 2014-15
• 760 KBD expansion in China shifted to 2015
Source: JBC
Demand Growth
UNIT: KBD

PX Demand/Supply Balance
BZ Demand from U.S. Supports Margin
60%65%70%75%80%85%90%
0.01.02.03.04.05.06.0
2012 2013 2014 2015 2016
Capacity Addition
Demand Growth
Aromatics – Competitiveness is Crucial for Survival
BZ Demand/Supply Balance
Global PX Cash Cost Curve
UNIT: MT Operating Rate Asian O/R
Global O/R
27
Source: IHS
Source: IHS Source: IHS
10%20%30%40%50%60%70%80%
-0.50.00.51.01.52.02.53.0
2012 2013 2014 2015 2016
Capacity Addition
Demand Growth
UNIT: MT Operating Rate Asian O/R
Global O/R

Asian Demand Grows Much Faster High Operating Rate in Asia
Global Ethylene Cash Cost Curve Ethylene Cash Margin is Rising
Ethylene – Firm Asian Demand Supports Profitability
28
Source: IHS

New Asian Capacity from PDH & CTO China Becomes More Self-sufficient
But China Relies on Propane Import China PDH is Higher Cash Cost
Propylene – New Capacity from On-purpose but We Can Compete
Average Demand Growth 4 MT pa.
29
Source: IHS
Source: IHS
China PDH

• Add value to mixed C4 • Save cost of purchasing butene-1 • Provide flexibility to maximize butadiene or
butene-1
Mobility Drives Demand Growth BD Demand/Supply Balance
China’s Importing is Still Growing BD Project Increases Value and Flexibility
Butadiene – Value Added to Mixed C4 with More Flexibility
58%
62%
66%
70%
74%
78%
82%
-0.4
0.0
0.4
0.8
1.2
1.6
2.0
2012 2013 2014 2015 2016 2017 2018
America Europe Middle EastChina Other Asia Demand Growth
UNIT: MT Operating Rate
Global O/R
30
Source: IHS
Source: IHS Naphtha Mixed C4
Butadiene
Butene-1
Max BD Mode BD 75 KTA B-1 20 KTA
Max B-1 Mode BD 45 KTA B-1 40 KTA

China Dominates MEG Demand in 2013
High Operating Rate at 89%
MEG – High Operating Rate from Unreliable Coal-based Plants
31
New Capacity Comes from Coal-based
Source: IHS
Source: IHS
Expecting Low O/R from Coal-based MEG
Margin will Return H2/14 Onwards
• Quality getting better but still not accepted by polyester fiber
• Unproven logistics capability – Can they deliver on-spec on time?
%
0.00.51.01.52.02.53.0
2013 2014
Capacity Addition
Demand Growth
0.00.51.01.52.02.53.0
2013 2014
Capacity Addition
Demand Growth
0.00.51.01.52.02.53.0
2013 2014
Capacity Addition
Demand Growth
32
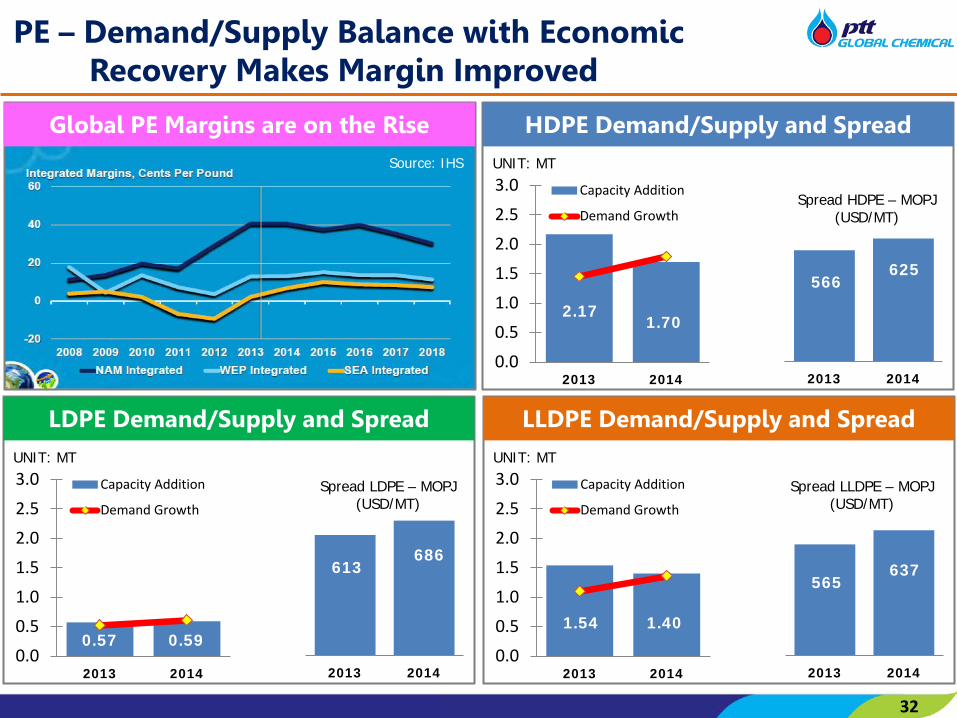
PE – Demand/Supply Balance with Economic Recovery Makes Margin Improved
Global PE Margins are on the Rise
2013 2014
LLDPE Demand/Supply and Spread
UNIT: MT
Spread LLDPE – MOPJ (USD/MT)
2013 2014
LDPE Demand/Supply and Spread
UNIT: MT
Spread LDPE – MOPJ (USD/MT)
2013 2014
HDPE Demand/Supply and Spread
UNIT: MT
Spread HDPE – MOPJ (USD/MT)
Source: IHS
566 625
613 686
565 637
2.17 1.70
1.54 1.40 0.57 0.59

BPA Demand/Supply Balance
UNIT: MT Operating Rate
Phenol Demand/Supply Balance
This Will Make Acetone Price High
Phenol/BPA – Acetone Will Be Great Contributor to Phenol Chain
20%30%40%50%60%70%80%90%
0.00.20.40.60.81.01.2
2012 2013 2014 2015 2016
Other Asia
China
UNIT: MT Operating Rate
Global O/R
Demand Growth
20%30%40%50%60%70%80%90%
0.00.10.20.30.40.50.6
2012 2013 2014 2015 2016
Other Asia
China
Global O/R
Demand Growth
33
Low O/R Makes Acetone Tight Supply

34
For further information & enquiries, please contact our Investor Relations Team at [email protected]
Thank You
1 Thitipong Jurapornsiridee VP - Corporate Finance & IR [email protected] +662-265-85742 Puvadol Vasudhara IR Manager [email protected] +662-140-87123 Panugorn Puengpradit IR Analyst [email protected] +662-140-87144 Prang Chudasring IR Analyst [email protected] +662-265-83275 Supika Charudhanes IR Analyst [email protected] +662-265-85336 Chutima Jarikasem IR Coordinator [email protected] +662-140-8713