1q 2013 - tesmec - investor relations - tesmec spa
TRANSCRIPT

Tesmec Group First Quarter 2013 Analyst Presentation, 10 May 2013
Corporate

2/18
Agenda
2013 – Business update P. Mosconi, GM
2013 – First Quarter Financials A.Bramani, CFO
Outlook 2013 A.Caccia Dominioni, CEO
Appendix

3/18
Business overview
Railway Lines
Railway Electrification
& Maintenance
RAILWAY EQUIPMENT
Overhead & Underground Power Lines
Transmission & Distribution
Networks
STRINGING EQUIPMENT
Grids efficiency
INTEGRATED SYSTEMS
Transmission & Distribution
Networks
Pipelines Telecom
Bulk Excavation
Trenching Services
TRENCHERS
Urban Construction
MULTIPURPOSE MACHINES
Road Jobs Construction
Utilities
Special Contracting
Civil Infrastructure
TRENCHERS
Urban Construction
MULTIPURPOSE MACHINES
Road Jobs Construction
Utilities
Overhead & Underground Power Lines
Transmission & Distribution Networks
STRINGING EQUIPMENT
Pipelines Telecom
Bulk Excavation
Civil Infrastructure
TRENCHERS
MISSION: to operate in strategic markets for the growth and the modernization of every
country in the world
From IPO .. To ..
CROSS SELLING: new opportunities

4/18
Group Structure at March 31,2013
Tesmec S.p.A.
Tesmec Balkani (100%)
Tesmec Service (100%)
I-Light and AMC2
Tesmec USA
(75%)*
Fully Consolidated
Tesmec Peninsula
(49%)
East Trenchers
(91%)
Condux Tesmec (50%)
Locavert (39%)
Equity Method
* The remaining 25% is held by Simest S.p.A. Since Tesmec has an obligation to buy it back from Simest S.p.A., from an accounting
point of view the participation of the Parent Company in Tesmec S.p.A. is consolidated on a 100% basis.
Opera
ting C
om
panie
s
Effect on EBITDA
and Pre-Tax Profit
Effect on Pre-Tax Profit
Tesmec S.A.
(100%)
Tesmec Rus
(100%)
Bertel (40%)
Equity Method

5/18
Agreement with FSK in Russia: Tesmec continues to work with FSK with good first
results
New technologies for RFI in Italy
Business Update
GRIDS EFFICIENCY Advanced systems for
predictive maintenance on power lines
RAILWAY New vehicles for maintenance & diagnostic operations
STRINGING EQUIPMENT Big machines for top projects
(big river crossing..)
First constant tension stringing unit for maintenance operation in China

6/18
Good performance in International Markets
TRENCHER STRINGING
+9% +12% 96%
EXPORT

7/18
1Q 2013 Economics Results
25,9
5,1
20%
3,6
14%
3,8
15%
2,4
9%
23,3
4,9 21%
3,4 15%
1,4
6%
0,9 4%
Revenues
EBITDA % On Revenues
EBIT % On Revenues
Profit Before taxes % On Revenues
NET INCOME % On Revenues
+11%
+4%
+6%
+165%
+167%
1Q 2013 1Q 2012
Delta % 1Q
2013 vs 2012 INCOME STATEMENT
(Euro Mln)
Revenues % Increase vs LY
EBITDA % on Revenues
16,6 +12%
3,8 23%
9,3 +9%
1,3 13%
14,8 -
2,9 20%
8,5
2 24%
STRINGING
2013
TRENCHER
2013
TRENCHER
2012
STRINGING
2012

8/18
10%
22%
12%24%
11%
21%6%14%
20%
33%
5%
24%
Revenues: international scale and exposure to growing economies
Italy Europe Middle East BRICs and Oceania Africa North-Central America
1Q 2012 1Q 2013
9/18
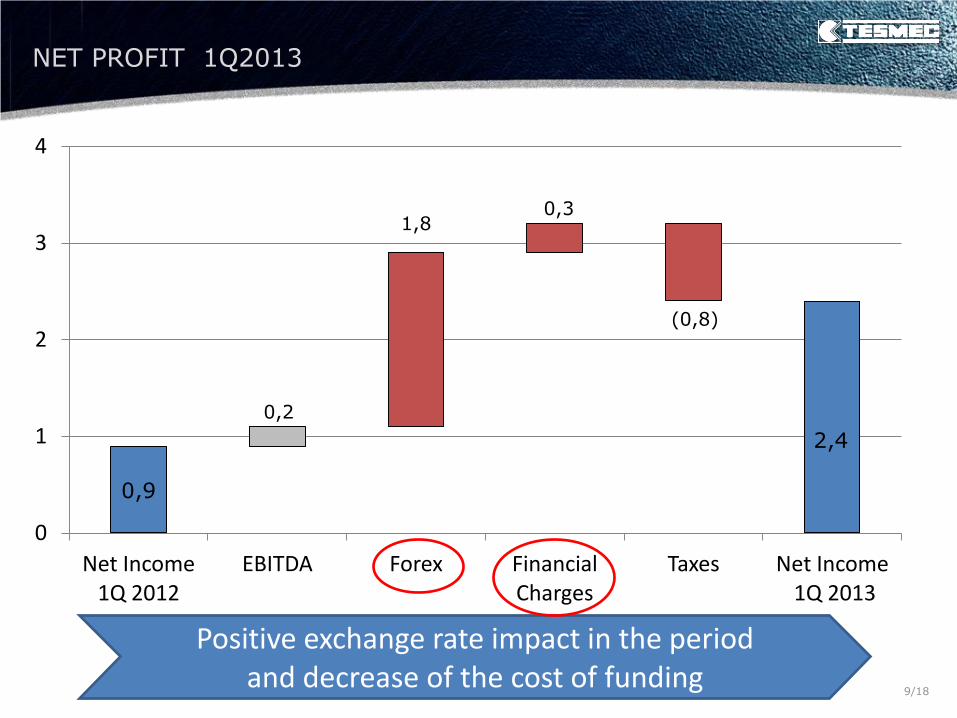
NET PROFIT 1Q2013
0,9
0,2
1,8 0,3
(0,8)
2,4
0
1
2
3
4
Net Income 1Q 2012
EBITDA Forex Financial Charges
Taxes Net Income 1Q 2013
Positive exchange rate impact in the period and decrease of the cost of funding

10/18
1Q 2013 Financial Results
54,7
50,8
2,0
107,5
NWC
Non current assets
Other LT assets/(Liabilities)
NET INVESTED CAPITAL
1Q 2013
FY 2012
1Q 2012
Financial Information
(Euro Mln)
NFP
EQUITY
TOTAL SOURCES OF FINANCING
48,8
49,6
1,0
99,4
50,7
48,2
2,2
101,1
61,7
45,8
107,5
56,5
42,9
99,4
61,9
39,2
101,1
11/18
48,854,7
8,0
(4,6)
1,3 1,2
0
20
40
60
FY2012Net Working
capital
Inventories Trade Receivables
Trade Payables
Other current ass. / liab.
1Q 2013Net Working
capital
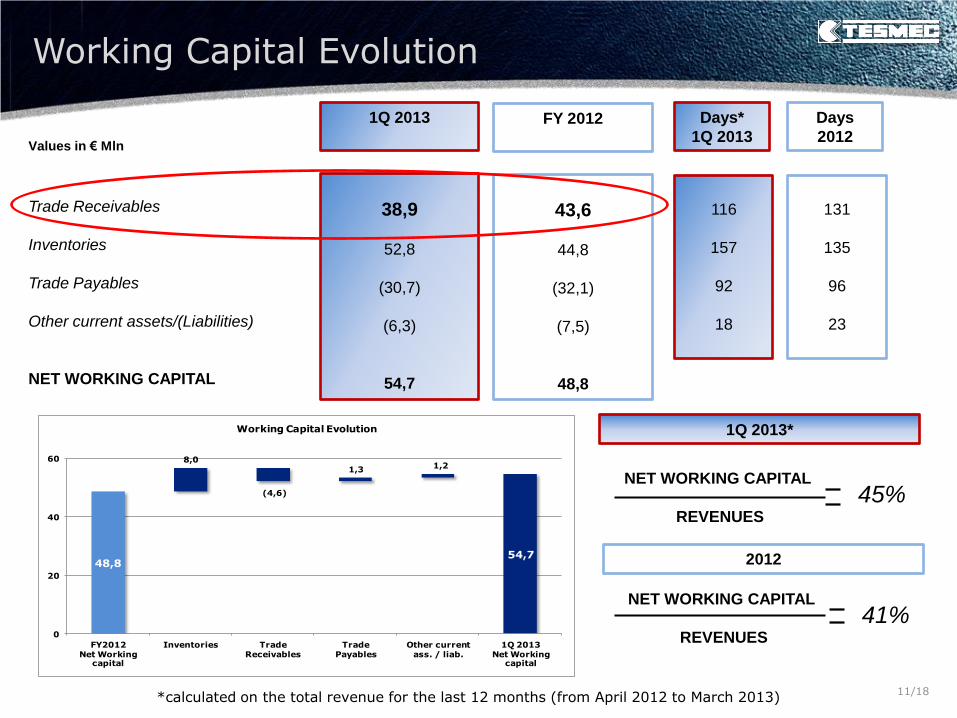
Working Capital Evolution
Working Capital Evolution
Values in € Mln
Trade Receivables
Inventories
Trade Payables
Other current assets/(Liabilities)
NET WORKING CAPITAL
1Q 2013
FY 2012
38,9
52,8
(30,7)
(6,3)
54,7
43,6
44,8
(32,1)
(7,5)
48,8
Days*
1Q 2013
116
157
92
18
131
135
96
23
Days
2012
NET WORKING CAPITAL
REVENUES
45%
1Q 2013*
NET WORKING CAPITAL
REVENUES
41%
2012
*calculated on the total revenue for the last 12 months (from April 2012 to March 2013)

12/18
Net Financial Position Evolution
35,8 35,8
20,7
(IAS 17)
(5,0)
5,9 0,8 1,4 0,7 1,6
41,2
20,5 61,7
0
10
20
30
40
50
60
70
NFP
FY 2012
Operating
NFP
FY 2012
OFCF NWC Inv.
Ass.
Comp.
Other
capex Net
Int.exp.
net
Taxes Operating
NFP
1Q 2013
Capex
(IAS 17)
NFP
1Q 2013
56,5
Operating Net Financial Position
excluding IAS 17 Figurative Debt Accounting
2012 NFP affected by increase in NWC 1Q
2013

13/18
Exchange exposure 1Q 2013
56% 44%
Revenues
Euro
USD 88%
12%
Operating Costs
Euro
USD
45% 54%
1%
Trade Receivables
Euro
USD
Other Currency
91%
9%
Trade Payables
Euro
USD

14/18
Order Book
23,1 32,7
16,6 11,5
0
20
40
Order book
FY 2012
1Q 2013 Revenues
Order Intake
Order book
1Q 2013
23,1 29,4
9,3 15,6
0
20
40
Order book 2012
1Q 2013 Revenues
Order Intake
Order book 1Q 2013
STRINGING EQUIPMENT
TRENCHERS
ORDER BOOK YEAR END 2012 – 1Q 2013
Stringing Equipment Trenchers
€ mln
€ mln
€ mln
0
20
40
60
2012 1Q 2013
37,8
32,7
23,1 29,4
62,1 60,9
+2%

15/18
Outlook 2013
After the positive results achieved in first quarter 2013 Tesmec confirms the guidelines for the year in terms of: - revenues;
- profitability;
- net financial position.
It is worth to be noted that revenues of the Group are linked to the investment cycle of the infrastructural business and are historically stronger in the second part of the year
Single digit increase in Stringing and Trencher:
-> North American Market will be one of the main market.
16/18
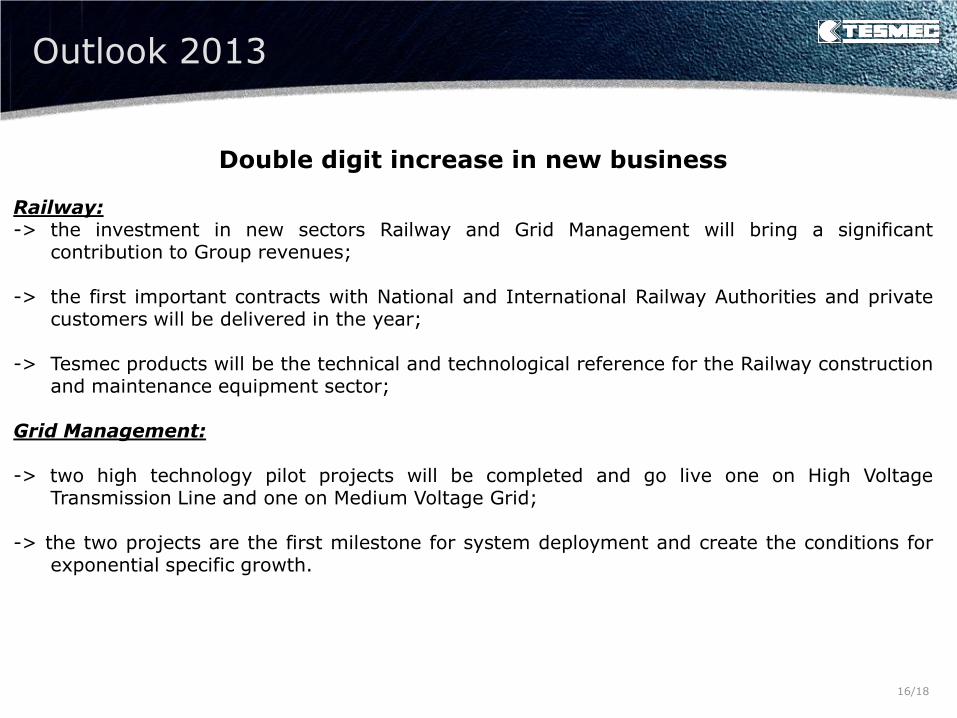
Outlook 2013
Double digit increase in new business Railway: -> the investment in new sectors Railway and Grid Management will bring a significant
contribution to Group revenues; -> the first important contracts with National and International Railway Authorities and private
customers will be delivered in the year; -> Tesmec products will be the technical and technological reference for the Railway construction
and maintenance equipment sector; Grid Management: -> two high technology pilot projects will be completed and go live one on High Voltage
Transmission Line and one on Medium Voltage Grid; -> the two projects are the first milestone for system deployment and create the conditions for
exponential specific growth.

17/18
Shareholding Structure
3T Finanziaria S.p.A.
7,45%
TTC S.r.l.
30,30%
FI.IND S.p.A.
12,54%
Shares directly owned
by Directors0,29%
Free float
38,37%
Lazard Freres Gestion
S.A.S. 2,07%
Albemarle AM
2,10% Treasury Share
1,54%
Italiana Alimenti
5,34%

18/18
Profit & Loss Account (€ mln) 1Q 2013 1Q 2012Delta vs
2012Delta %
Net Revenues 25,9 23,3 2,6 11%
Raw materials costs (-) (10,4) (8,9) (1,5) 17%
Cost for services (-) (4,9) (4,9) 0,0 0%
Personnel Costs (-) (5,9) (4,9) (1,0) 20%
Other operating revenues/costs (+/-) (0,5) (0,6) 0,1 -17%
Portion of gain/(losses)
from equity investments evaluated
using the equity method
0,2 0,1 0,1 100%
Capitalized R&D expenses 0,7 0,8 (0,1) -13%
Total operating costs (20,8) (18,4) (2,4) 13%
% on Net Revenues (80%) (79%)
EBITDA 5,1 4,9 0,2 4%
% on Net Revenues 20% 21%
Depreciation, amortization (-) (1,5) (1,5) 0,0 0%
EBIT 3,6 3,4 0,2 6%
% on Net Revenues 14% 15%
Net Financial Income/Expenses (+/-) 0,2 (2,0) 2,2 -110%
Taxes (-) (1,4) (0,5) (0,9) 180%
Minorities - - - -
Net Income (Loss) 2,4 0,9 1,5 167%
% on Net Revenues 9% 6%
Appendix A - Summary 1Q 2013 Profit & Loss statement

19/18
Inventory 52,8 44,8
Accounts receivable 38,9 43,6
Accounts payable (-) (30,7) (32,1)
Op. working capital 61,0 56,3
Other current assets (liabilities) (6,3) (7,5)
Net working capital 54,7 48,8
Tangible assets 39,9 39,8
Intangible assets 7,7 7,6
Financial assets 3,2 2,2
Fixed assets 50,8 49,6
Net long term liabilities 2,0 1,0
Net invested capital 107,5 99,4
Cash & near cash items (-) (7,7) (17,1)
Short term financial assets (-) (8,4) (5,2)
Short term borrowing 31,9 29,6
Medium-long term borrowing 46,0 49,3
Net financial position 61,7 56,5
Equity 45,8 42,9
Funds 107,5 99,4
Balance Sheet (€ mln) 1Q 2013 2012
Appendix B - Summary Balance Sheet
TESMEC S.p.A - Headquarters via Zanica, 17/O - 24050 Grassobbio (BG) - Italy
Tel. +39.035.423 2911 - Fax +39.035.4522444 Management and Administration Fax +39.035.4522445 Stringing Equipment Division - Fax +39.035.335664 Trencher Division
www.tesmec.com - [email protected]
The Manager responsible for preparing the company’s financial reports, Andrea Bramani, declares, pursuant to paragraph 2 of Article 154-bis of the Consolidated Law on Finance, that
the accounting information contained in this presentation corresponds to the document results, books and accounting records.
Grassobbio, May 10, 2013 The Manager responsible for preparing
the company’s financial reports
Andrea Bramani