1h12 investor presentation final - rns · pdf fileinvestor presentation note: information in...
TRANSCRIPT

10 May 2012
National Australia Bank Limited ABN 12 004 044 937
Cameron Clyne, Group Chief Executive OfficerMark Joiner, Executive Director Finance
Investor presentation
Note: Information in this document is presented on a cash earnings basis, unless otherwise stated.
Cash earnings is a key financial performance measure used by NAB, the investment community and NAB’s Australian peers with a similar business portfolio. NAB also uses cash earnings for its internal management reporting as it better reflects what NAB considers to be the underlying performance of the Group. It is not a statutory financial measure and is not presented in accordance with Australian Accounting Standards nor audited or reviewed in accordance with Australian Auditing Standards. “Cash earnings” is calculated by excluding some items which are included within the statutory net profit attributable to owners of the company. A definition of cash earnings is set out on page [150] of the 2012 Half Year Results Announcement. A discussion of non-cash earnings items and a full reconciliation of the cash earnings to statutory net profit attributable to owners of the Company for the March 2012 half year is included on pages 22 and 141 of the 2012 Half Year Results Announcement. The Group's financial statements, prepared in accordance with the Corporations Act 2001 (Cth) and Australian Accounting Standards, and reviewed by the auditors in accordance with Australian Auditing Standards, are included in section 5 of the 2012 Half Year Results Announcement.
Disclaimer: This document is a presentation of general background information about the Group’s activities current at the date of the presentation, 10 May 2012. It is information in a summary form and does not purport to be complete. It is to be read in conjunction with the National Australia Bank Limited Half Year Results filed with the Australian Securities Exchange on 10 May 2012. It is not intended to be relied upon as advice to investors or potential investors and does not take into account the investment objectives, financial situation or needs of any particular investor. These should be considered, with or without professional advice, when deciding if an investment is appropriate.
This announcement contains certain "forward-looking statements". The words "anticipate", "believe", "expect", "project", "forecast", "estimate", “outlook”, “upside”, "likely", "intend", "should", "could", "may", "target", "plan" and other similar expressions are intended to identify forward-looking statements. Indications of, and guidance on, future earnings and financial position and performance are also forward-looking statements. Such forward-looking statements are not guarantees of future performance and involve known and unknown risks, uncertainties and other factors, many of which are beyond the control of the Group, that may cause actual results to differ materially from those expressed or implied in such statements. There can be no assurance that actual outcomes will not differ materially from these statements.
For further information visit www.nab.com.au or contact:
Ross Brown Brian WalshExecutive General Manager, Investor Relations General Manager, Media and Public AffairsMobile | +61 (0) 477 302 010 Mobile | +61 (0) 411 227 585
Craig Horlin Meaghan TelfordSenior Manager, Investor Relations Head of Group MediaMobile | +61 (0) 417 372 474 Mobile | +61 (0) 457 551 211

Solid result and progress against strategy
7.2%4,8087.1%4,8125,156Underlying profit ($m)
(15.5%)2,428(26.5%)2,7912,052Statutory net profit attributable to owners ($m)
(10bps)15.1%(20bps)15.2%15.0%Cash ROE
Change (%)Change (%)
84
7.12%
2,668
8,799
2.3%
45bps
1.3%
3.6%
Half year to
7.1%8890Dividend (100% franked cps)
Mar 12 Sep 11 Mar 11
Revenue ($m) 9,108 8,795 3.5%
Cash earnings ($m) 2,828 2,792 6.0%
Core Tier 1 ratio 8.03% 7.58% 91bps
3
March 2008 onwards 1930s
Mid 1970s
Early 1990s
Early 1980s
90
92
94
96
98
100
102
104
106
1Q 2Q 3Q 4Q 5Q 6Q 7Q 8Q 9Q 10Q 11Q 12Q 13Q 14Q 15Q
Environment remains challenging
(1) Previous peak = 100. Source: NAB Economics, UK Office of Budget Responsibility4
Key global reformsBasel III Capital & LiquiditySystemically Important Financial InstitutionsRecovery & Resolution – ‘Living Wills’Reforms for Over-The-Counter derivatives (inc. clearing arrangements)
Key domestic reformsFinancial Claims SchemeFuture of Financial AdviceSuperannuation ReformsLife Insurance and General Insurance Capital FrameworkNational Consumer Credit Protection Phase II
Other key international reformsDodd-Frank reforms (US)Foreign Account Tax Compliance Act (US)Independent Commission on Banking – Business Models (UK)International Financial Reporting Standards 9 – Financial Instruments
Ongoing full regulatory agenda Quarterly real output path during UK recessions1
Increased cost of funding an Australian variable rate mortgage
(%)
System credit growth % change year-on-year
-4
-2
0
2
4
6
8
10
12
14
16
18
Jan 90 Jan 93 Jan 96 Jan 99 Jan 02 Jan 05 Jan 08 Jan 11 Jan 14
Australia
New Zealand
United Kingdom
(F)
RBA, RBNZ, Bank of England, NAB Forecasts
0
20
40
60
80
100
120
140
160
Pre-crisis Dec 07 Jun 08 Dec 08 Jun 09 Dec 09 Jun 10 Dec 10
Term Funding
Customer Deposits
Bank Bill/Overnight Index Swap Spread
Dec 11 Mar 12
Recovery via repricing
Liquidity Portfolio Costs
Funding cost over the RBA cash rate (bps)
Jun 11
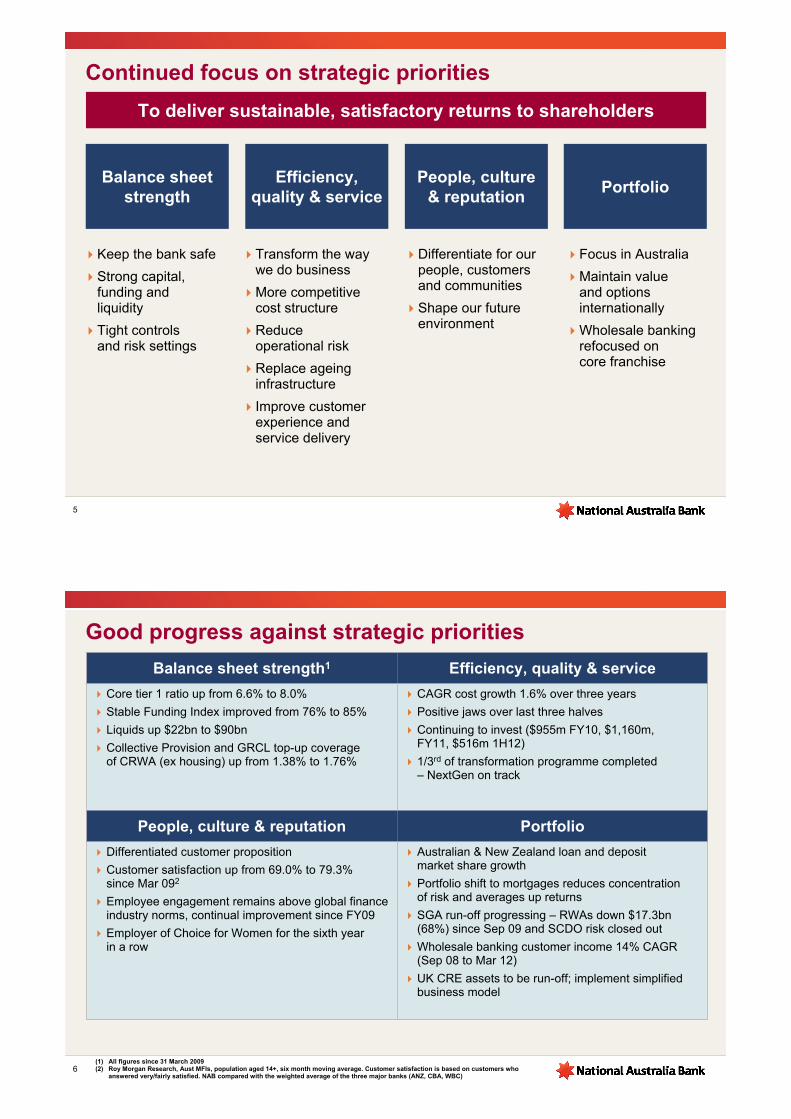
Continued focus on strategic priorities
Efficiency, quality & service
Transform the way we do business
More competitive cost structure
Reduce operational risk
Replace ageing infrastructure
Improve customer experience and service delivery
Balance sheet strength
Keep the bank safe
Strong capital, funding and liquidity
Tight controls and risk settings
People, culture & reputation
Differentiate for our people, customers and communities
Shape our future environment
Portfolio
Focus in Australia
Maintain valueand options internationally
Wholesale banking refocused on core franchise
To deliver sustainable, satisfactory returns to shareholders
5
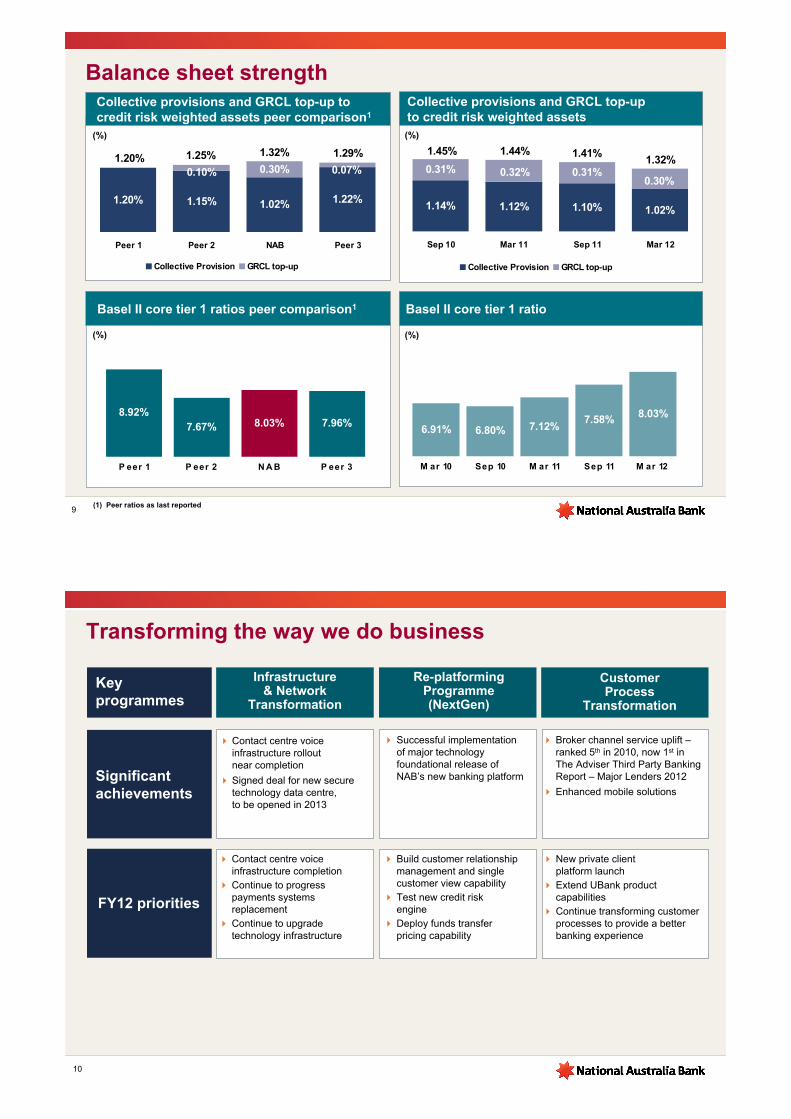
Good progress against strategic priorities
Australian & New Zealand loan and deposit market share growth
Portfolio shift to mortgages reduces concentration of risk and averages up returns
SGA run-off progressing – RWAs down $17.3bn (68%) since Sep 09 and SCDO risk closed out
Wholesale banking customer income 14% CAGR (Sep 08 to Mar 12)
UK CRE assets to be run-off; implement simplified business model
Differentiated customer proposition
Customer satisfaction up from 69.0% to 79.3% since Mar 092
Employee engagement remains above global finance industry norms, continual improvement since FY09
Employer of Choice for Women for the sixth year in a row
PortfolioPeople, culture & reputation
CAGR cost growth 1.6% over three years
Positive jaws over last three halves
Continuing to invest ($955m FY10, $1,160m, FY11, $516m 1H12)
1/3rd of transformation programme completed – NextGen on track
Core tier 1 ratio up from 6.6% to 8.0%
Stable Funding Index improved from 76% to 85%
Liquids up $22bn to $90bn
Collective Provision and GRCL top-up coverage of CRWA (ex housing) up from 1.38% to 1.76%
Efficiency, quality & serviceBalance sheet strength1
6(1) All figures since 31 March 2009(2) Roy Morgan Research, Aust MFIs, population aged 14+, six month moving average. Customer satisfaction is based on customers who
answered very/fairly satisfied. NAB compared with the weighted average of the three major banks (ANZ, CBA, WBC)

77
Australian housing lending market share1
New Zealand market share3Australian household deposit market share2
77
Australian business lending market share1
Market share gains
12.8%13.3%
13.8%14.5% 14.7%
12.8%
Sep 09 M ar 10 Sep 10 M ar 11 Sep 11 M ar 12
21.5% 22.1% 22.2% 22.4% 22.9%20.5%
Sep 09 M ar 10 Sep 10 M ar 11 Sep 11 M ar 12
13.4% 13.6%14.1% 14.2% 14.5%
13.1%
Sep 09 M ar 10 Sep 10 M ar 11 Sep 11 M ar 12
12%
14%
16%
18%
20%
22%
Sep 09 M ar 10 Sep 10 M ar 11 Sep 11 M ar 12
Ho using A g rib usiness R et ail d ep o sit s
(1) RBA Financial System(2) APRA Banking System (3) RBNZ (historical market share rebased with latest revised RBNZ published data)
Transfer UK CRE assets to NAB and put into run-off
(£bn)
UK CRE run-off profile – contractual maturity1
(1) Reflects contractual maturity which is subject to ability of customers to refinance or repay on maturity(2) This includes 191 transferred roles to NAB associated with the CRE portfolio and excludes current year initiatives8
-
1.0
2.0
3.0
4.0
5.0
6.0
7.0
2012 2013 2014 2015 2016 2017 2018
Rationalise Financial Solutions Centres (FSC) footprint
Scotland13 FSCs
Current: 16
West14 FSCs
Current: 17
East8 FSCs
Current: 9
South9 FSCs
Current: 31
Forecast Benefits (£m) FY13 FY14 FY15
Actual 35 63 74
Cumulative FTE2 831 958 987
bps(£m)(£m)
Group CapitalTotalTotal costs and impact on Group capital ratio
Restructuring 195 (159) (7)
Goodwill write-off 141 - -
PPI 120 (120) (5)
Total 456 (279) (12)
Costs and benefits profile Total UK CRE provision coverage – Mar 12
2.6%
7.5%
11.9%
4.4%
2.5%
2.4%
SpecificProvision
CollectiveProv
UK CREoverlay
Total prov Partial Write-offs
ImpliedCRE
Coverage
Balance sheet strengthCollective provisions and GRCL top-up to credit risk weighted assets peer comparison1
(%)
9(1) Peer ratios as last reported
Collective provisions and GRCL top-up to credit risk weighted assets(%)
Basel II core tier 1 ratios peer comparison1
(%)
8.92%7.67% 8.03% 7.96%
P eer 1 P eer 2 N A B P eer 3
Basel II core tier 1 ratio
(%)
8.03%
6.91% 6.80% 7.12%7.58%
M ar 10 Sep 10 M ar 11 Sep 11 M ar 12
1.20% 1.15% 1.02% 1.22%
0.30% 0.07%0.10%
Peer 1 Peer 2 NAB Peer 3
Collective Provision GRCL top-up
1.20% 1.25% 1.32% 1.29%
1.14% 1.12% 1.10% 1.02%
0.31% 0.31%0.30%
0.32%
Sep 10 Mar 11 Sep 11 Mar 12
Collective Provision GRCL top-up
1.45% 1.44% 1.41%1.32%
Transforming the way we do business
10
Key programmes
Infrastructure & Network
Transformation
Re-platforming Programme (NextGen)
Customer Process
Transformation
FY12 priorities
Contact centre voice infrastructure completionContinue to progress payments systems replacementContinue to upgrade technology infrastructure
New private client platform launchExtend UBank product capabilities Continue transforming customer processes to provide a better banking experience
Build customer relationship management and single customer view capabilityTest new credit risk engineDeploy funds transfer pricing capability
Contact centre voice infrastructure rollout near completion
Signed deal for new secure technology data centre, to be opened in 2013
Broker channel service uplift –ranked 5th in 2010, now 1st in The Adviser Third Party Banking Report – Major Lenders 2012
Enhanced mobile solutions
Significant achievements
Successful implementation of major technology foundational release of NAB’s new banking platform

Recognition
Reputation and Corporate Responsibility
Lowest SVR of the major banks since June 2009
First to abolish overdrawn and monthly account service fees on personal transaction accounts
Customer satisfaction reached a 15 year high during 1H121
Net new transaction accounts have grown 12 fold since 1H09
Microfinance program continues to grow with $130m committed to helping Australians with low incomes
CustomerPersonal Banking MFI customer satisfaction1
(%)
Mar 09 Sep 09 Mar 10 Sep 10 Mar 11 Sep 11 Mar 12
Weighted average of three major bank peers NAB
-5.1%
78.5
79.3
69.0
74.1
0.8%
Investment in education through NAB Schools First which supports school/community partnerships
Total days volunteered 25,633 during 2011
Australia’s #1 arranger of project finance to Renewable Power, having arranged over $1.3bn across wind farms, biomass and landfill gas projects over last six years2
One of two launch signatories to the United Nations Environment Program, Finance Initiative ‘Natural Capital Declaration’
People and Community
(1) Roy Morgan Research, Aust MFIs, population aged 14+, six month moving average. Customer satisfaction is based on customers who answered very/fairly satisfied.NAB compared with the weighted average of the three major banks (ANZ, CBA, WBC)
(2) NAB analysis ranking against four major domestic banks - cumulative volume. Data Source: Project Finance International 2006-2011 APAC MLA League Tables US$ Project Allocation
11
Global macro outlook still challenging – likely to remain so
Balance sheet strength and cost discipline provide strong foundation
Good progress on our strategic priorities but still more to do
– execute on UK business model change
– continue to advance technology deployment
– maintain momentum in Australian franchise
– further develop NAB’s reputation with customers, employees and community
Focused on improving returns
12
Summary

1H12 Financials
Group financial result
6.8%1.7%459.2482.1490.4Spot GLAs ($bn)
91bps45bps7.12%7.58%8.03%Core Tier 1 ratio
(6bps)(11bps)2.23%2.28%2.17%NIM
(10bps)(20bps)15.1%15.2%15.0%Cash ROE
6.0%1.3%2,6682,7922,828Cash earnings
(14.5%)(35.6%)(988)(834)(1,131)B&DDs
7.2%7.1%4,8084,8125,156Underlying profit
Change on Mar 11
Mar 11
0.8%
3.6%
19.6%
(1.2%)
(3,991)
8,799
2,495
6,304
Half year to
1.0%(3,983)(3,952)Operating expenses
($m) Mar 12 Sep 11 Change on Sep 11
Net interest income 6,708 6,788 6.4%
Other operating income (incl NAB Wealth) 2,400 2,007 (3.8%)
Net operating income 9,108 8,795 3.5%
14

Strong Wholesale Bank performance offset by UK
2,792 2,828
(297)
(80) (45) 34
393 31
Sep 11 NII OOI Costs B&DD Tax Other Mar 12
(1) Other comprises Group Funding, Group Business Services, other supporting units, Asia Banking and GWB
Cash earnings – attribution analysis by business (constant currency)
Cash earnings – attribution analysis by P&L line items
15
($m)
($m)
2,792 2,828
0(32)
(204)
(36) 55 (3)(39)25144
Sep 11 BusinessBanking
PersonalBanking
WholesaleBanking
UK Banking
NZ Banking
NAB Wealth
SGA Other FX Mar 121
2.19%
2.17%
1.80%
2.00%
2.20%
2.40%
2.60%
Mar08
Sep08
Mar09
Sep09
Mar10
Sep10
Mar11
Sep11
Mar12
Group NIM Group NIM (ex markets & treasury)
3bps6bps2.41NZ Banking
(6bps)(11bps)2.17Group
(%) Mar 12Margin
change onSep 11
Customer margin1
change on Sep 11
Business Banking 2.56 (10bps) (9bps)
Personal Banking 2.02 (15bps) (12bps)
UK Banking 2.09 (24bps) (17bps)
Net interest margin impacted by funding costs
Group net interest margin – half-on-half attribution analysis
Business unit net interest margin
16
2.28%2.17%
(0.01%)(0.03%)(0.03%)
(0.05%)(0.04%)
0.02%
0.03%
Sep 11 LendingMargin
Deposits Funding &Liquidity
Costs
Lending Mix Markets &Treasury
Liquids(volumes)
Other Mar 12
Group net interest margin
Customer margin down 6bps
(1) Customer margin comprises lending margin, deposit and funding costs and liability mix

45,198 45,293 44,645 43,399
Sep 10 Mar 11 Sep 11 Mar 12
Jaws momentum (ex SCDO and FX)
1H11 v 2H102H10 v 1H10
-2.9%
Revenue growth
Expense growth
4.2%
1.3%
5.0%
1.7%
2H11 v 1H11
+3.3% 2.3%
0.6%
1H12 v 2H11
+1.7%
17
Investment spend
8% 11%
25% 25% 23%
58% 65% 60%
13%
4% 2% 6%
Mar 11 Sep 11 Mar 12
522 638 516($m)
Other
Infrastructure
Efficiency and Revenue
Compliance
Maintaining positive jaws and continuing to invest
2.4%
-0.7%
+3.1%
Full time equivalent employees
(#)
1,434 1,489
908 754 747 613 703
377515
322279 241
221428
Mar 09 Sep 09 Mar 10 Sep 10 Mar 11 Sep 11 Mar 12
Group B&DD charge (ex UK Banking) UK Banking B&DD charge
Group B&DD increase reflects UK/SGA
UK Banking B&DDs
(£m)
10857 69 95 97
197
145
126 95 56 48
85
Sep 09 Mar 10 Sep 10 Mar 11 Sep 11 Mar 12
CRE Non CRE
B&DD charge
1,8112,004
1,2301,033 988
1,131
834
($m)
0.82% 0.87%
0.51%0.43% 0.46%
0.57%
0.38%
Mar 09 Sep 09 Mar 10 Sep 10 Mar 11 Sep 11 Mar 12
B&DD charge to GLAs – compared to norms
NAB benign period average 1994 - 2007 (24bps)
NAB long term average 1980 - 2011 (42bps)
B&DD charges as a % of GLAs (annualised)
B&DD charges as % of GLAs (ex UK Banking) (annualised)
18
B&DDs by business (constant currency)
834
1,131
52212
63
31 14
(30)
(45)
Sep 11 B usinessB anking
Perso nalB anking
W ho lesaleB anking
U KB anking
SGA Ot hero f f sho re
Ot her &F X
M ar 12
($m)
253
183164 151 145
282

Asset quality and coverage ratios
19
Categorised assets by balance
0
4,000
8,000
12,000
16,000
20,000
24,000
28,000
Mar 09 Sep 09 Mar 10 Sep 10 Mar 11 Sep 11 Mar 120.0%
1.0%
2.0%
3.0%
4.0%
5.0%
6.0%
7.0%
Watch Loans 90+ Days Past Due
Impaired Assets Categorised Assets as % of GLAs
($bn)
0
4
8
12
16
20
24
28
Coverage ratios (including GRCL top-up)
1.14% 1.12% 1.10% 1.02%
0.31% 0.32% 0.31% 0.30%
0.0%
0.5%
1.0%
1.5%
Sep 10 Mar 11 Sep 11 Mar 12
0%
10%
20%
30%
40%
50%1.45% 1.44% 1.41% 1.32%
GRCL top-up (pre-tax) as a % of Credit Risk Weighted Assets (LHS)
Collective Provisions as a % of Credit Risk Weighted Assets (LHS)
Specific Provisions as a % of Gross Impaired Assets (RHS)
Collective provision
($m)
3,3983,058
10 (43)(160)
12 (159)
Sep
11
Ret
ail
No
n R
etai
l(i
ncl
ud
ing
loan
s at
fai
rva
lue)
SC
DO
ove
rlay
uti
lisa
tio
n
Der
ivat
ives
at
fair
val
ue
FX
Imp
act/
Oth
er
Mar
12
90+ DPD & impaired assets as a % of gross loans and acceptances by product
0.0%
0.5%
1.0%
1.5%
2.0%
Sep 08 Mar 09 Sep 09 Mar 10 Sep 10 Mar 11 Sep 11 Mar 12
Imp
aire
d9
0+D
PD
Mortgages Impaired
Business Impaired
Mortgages 90+ DPD
Business 90+ DPD
Retail Unsecured 90+ DPD
157190
263
154
Sep 10 Mar 11 Sep 11 Mar 12
129.1130.1
132.2
0.7 (0.1)
0.1
0.4
1.4 0.6
Business Banking
Business lending volumes1
($bn)
(1) Updated to reflect transfers of customers between business units(2) RBA Financial System/NAB(3) SME business data reflects the nabbusiness segment of Business Banking which supports business customers with lending
typically up to $25m, excluding the Specialised Businesses
Net interest margin
(%)
20
SME3 B&DD charge
($m)
(21%)
(38%)41%
Business lending market share2
22.922.1 22.2 22.4
Sep 10 Mar 11 Sep 11 Mar 12
(%)
Mar
11
Co
rpo
rate
, In
sti
tuti
on
al &
S
pec
iali
sed
B
anki
ng
nab
bu
sin
ess
Wo
rkin
g
Cap
ital
S
ervi
ces
Sep
11
Co
rpo
rate
, In
sti
tuti
on
al &
S
pec
iali
sed
B
anki
ng
nab
bu
sin
ess
Wo
rkin
g
Cap
ital
S
ervi
ces
Mar
12
2.502.57
2.662.56
Sep 10 Mar 11 Sep 11 Mar 12

0.0%
0.5%
1.0%
1.5%
2.0%
2.5%
3.0%
3.5%
4.0%
4.5%
0 3 6 9 12 15 18 21 24
2006 2007 2008 2009 2010 2011 2012
116
163138
169
231220
262
Mar 09 Sep 09 Mar 10 Sep 10 Mar 11 Sep 11 Mar 12
Personal Banking
Sequential margin analysis
21
Home loan multiple of system growth1
(x)
2.2
3.3
1.1
2.7
3.4
Mar 10 Sep 10 Mar 11 Sep 11 Mar 12
B&DD charge
($m)
(1) RBA Financial System/NAB
Australian mortgages - cumulative 30+ DPD
Months on books
2.02%
2.17%
(0.02%) (0.04%)
0.07%
0.01%
Sep 11Lending Margin
DepositsFunding & Liquidity Costs
Liability MixLending Mix
OtherMar 12
(0.06%)
(0.11%)
Customer margin down 12bps
16
(12)
33
47
Sep 10 Mar 11 Sep 11 Mar 12
270476
318 256 206 26867
295
92
429
420
148 169158
107
200
Sep 08 Mar 09 Sep 09 Mar 10 Sep 10 Mar 11 Sep 11 Mar 12
0
5
10
15
20
520 571 685 724
426 174
495
375
Sep 10 Mar 11 Sep 11 Mar 12
C usto mer R isk
2222
B&DD charge
Cash earnings and underlying profit Steady growth in customer income
Wholesale Banking
302 393268
518428
754541
400
Sep 10 Mar 11 Sep 11 Mar 12C ash earnings Underlying pro f it
($m)
($m)
• Customer comprises Sales, Asset Servicing, Specialised Finance and Financial Institutions Group• Risk comprises FICC and Treasury
($m)
895997
859
1,219
Risk income
Treasury FICC VaR (traded) (RHS)
362
905
738
375404 426
174
495
($m)

162 167
2114 (8)
(4)
Sep 11 A nnuit yExp erience( incl M t M
invest .Pro f it s)
F U M /vo lumes
U nd erlyingM arg ins
( B usinessM ix &
Pricing )
Privat eW ealt h
vo lumes &marg ins
Ot her M ar 12
Investments cash earnings
($m)
NAB Wealth
Insurance cash earnings
($m)
72
93
44
76
Sep 11 P IF C laims P o licyho lderM ix &
Lapses
A llo catedF inancialP lannerrevenue
M ar 12
23
Premiums inforce
Sep 10 Mar 11 Sep 11 Mar 12
($m)2.1% 2.1% 1.8%
1,407 1,436 1,466 1,493
Movement in FUM1
($bn)
119.0110.3
123.5
(0.4)
7.0
(1.5)7.70.1 (8.4)
Mar 11 Net flows InvestmentEarnings
Other Sep 11 Net flows InvestmentEarnings
Other Mar 12
(1) FUM based on a proportional ownership basis
67%72%73%
% % Retail FUM
New Zealand
24
Cash earnings and underlying profit
(NZ$m)
269 283 329 385494 496 532 569
Sep 10 Mar 11 Sep 11 Mar 12
Cash earnings Underlying profit
B&DD charge
99 95
5634
Sep 10 Mar 11 Sep 11 Mar 12
(NZ$m)
Net interest margin
(%)
2.24 2.242.35 2.41
Sep 10 Mar 11 Sep 11 Mar 12
861 865 910 944
367 369 378 375
Sep 10 Mar 11 Sep 11 Mar 12Revenue Expenses
Revenue v expense growth
(NZ$m)
41.5%42.7% 39.7%
% Cost to income ratio
42.6%
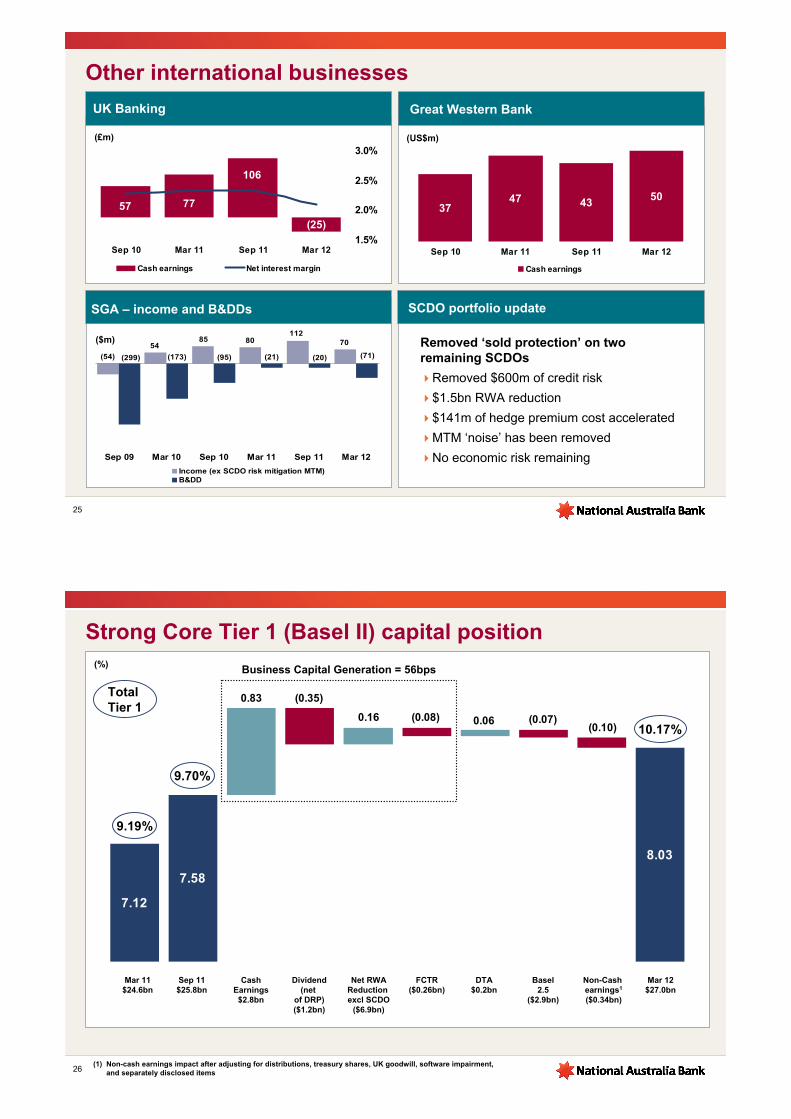
Other international businesses
Great Western Bank
(US$m)
25
3747 43
50
Sep 10 Mar 11 Sep 11 Mar 12
Cash earnings
SGA – income and B&DDs
($m)
UK Banking
(£m)
70
(20)
808554
(54) (299) (21)
112
(95)(173) (71)
Sep 09 Mar 10 Sep 10 Mar 11 Sep 11 Mar 12
Income (ex SCDO risk mitigation MTM)B&DD
57 77
106
(25)
Sep 10 Mar 11 Sep 11 Mar 121.5%
2.0%
2.5%
3.0%
Cash earnings Net interest margin
SCDO portfolio update
Removed ‘sold protection’ on two remaining SCDOs
Removed $600m of credit risk
$1.5bn RWA reduction
$141m of hedge premium cost accelerated
MTM ‘noise’ has been removed
No economic risk remaining
26
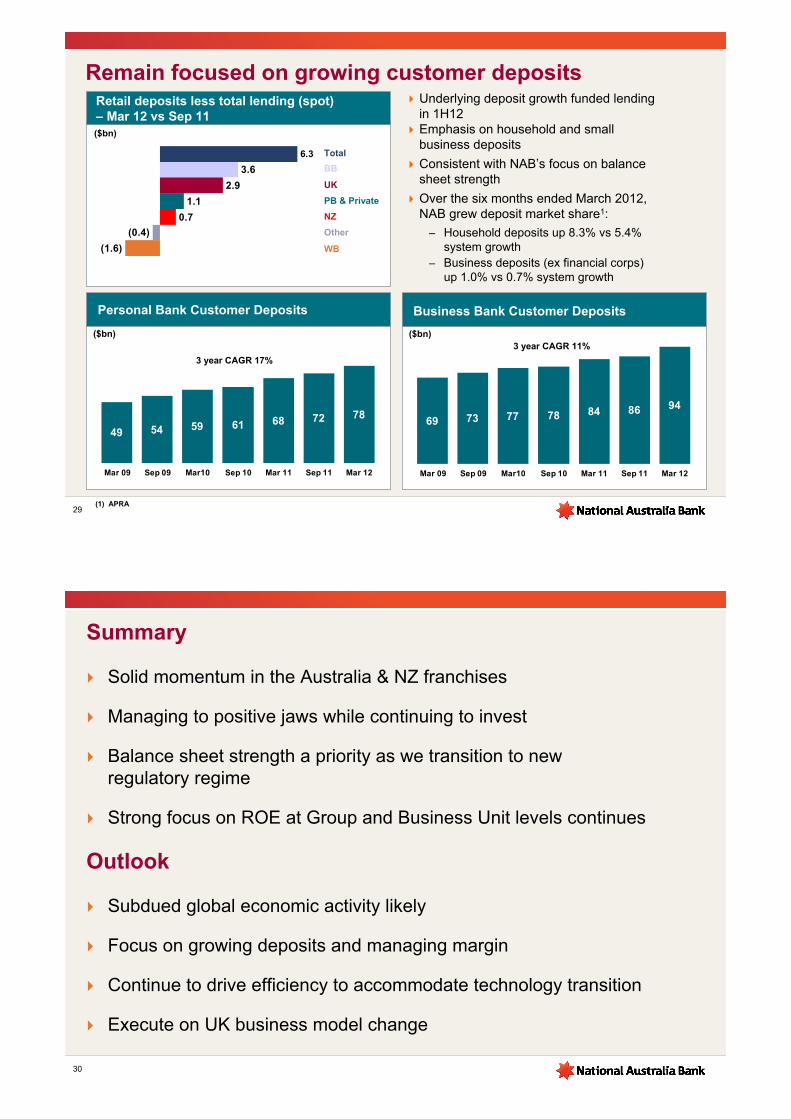
Strong Core Tier 1 (Basel II) capital position
(1) Non-cash earnings impact after adjusting for distributions, treasury shares, UK goodwill, software impairment, and separately disclosed items
(%)
7.12
7.58
8.03
(0.10)0.06
0.83
0.16 (0.08)
(0.35)
(0.07)
Business Capital Generation = 56bps
CashEarnings$2.8bn
Dividend(net
of DRP)($1.2bn)
Net RWAReduction excl SCDO
($6.9bn)
DTA$0.2bn
FCTR($0.26bn)
Sep 11$25.8bn
Non-Cash earnings1
($0.34bn)
Mar 12$27.0bn
Basel2.5
($2.9bn)
Mar 11$24.6bn
10.17%
9.70%
9.19%
Total Tier 1

27
Regulatory reform – status update
Note: Supervisory confirmation required
APRA proposed Basel III liquidity package delivered in November 2011
Clarification of various items and some positive developments
Key items remain unresolved, particularly the size and composition of the RBA Committed Liquidity Facility
Industry has reviewed proposed standards and given feedback
Timing for release of final standards by APRA remains uncertain
Funding and Liquidity reformsCapital reforms
Key impacts to NAB from APRA’s March 2012 draft capital standards:
– Hybrids will be subject to transitional arrangements (including NIS)
– Investments into non-consolidated subsidiaries to be fully deducted
– Requirements for Basel III compliant hybrids
Consultation will continue with APRA throughout 2012
Implementation phased from January 2013, earlier than Basel requires
Well placed to manage capital impact, with strong core capital generation
Core Tier 1
8.03%
9.28%
7.58%
Basel II act. Basel III est. (BISAlignment)
Basel III est. underAPRA proposed
measures
7.0% Basel III minimum*
* Includes the capital conservation buffer, to be implemented from 1 January 2016
42 3755 47
30 35
4017 21
21 16
43
Sep 10 Mar 11 Sep 11 Mar 12Go vernment, C ash & C entral B ank B ank, C o rpo rate & Other
Internal R M B S (co ntingent liquidity)
89 93
116106
2828
Liquid asset holdings Term funding – volume of new issuance
Funding and liquidity
($bn)
2828
($bn)
Term funding – tenor of issuance
Weighted average maturity (years) of term funding issuance
4.7 4.84.1 4.2
Sep 10 Mar 11 Sep 11 Mar 12
12.815.1
11.9 9.9
0.3
1.63.0
4.6
Sep 10 Mar 11 Sep 11 Mar 12Senior and Sub Debt Secured Funding
13.1
16.714.9 14.5
Group Stable Funding Index (SFI)
56% 59% 64% 65% 65%
16% 19% 20% 20% 20%
Sep 08 Sep 09 Sep 10 Sep 11 Mar 12
Customer Funding Index Term Funding Index
84% 85% 85%72% 78%
Remain focused on growing customer deposits
(1) APRA29
Underlying deposit growth funded lending in 1H12Emphasis on household and small business deposits
Consistent with NAB’s focus on balance sheet strength
Over the six months ended March 2012, NAB grew deposit market share1:
– Household deposits up 8.3% vs 5.4% system growth
– Business deposits (ex financial corps) up 1.0% vs 0.7% system growth
(1.6)
(0.4)
0.7
1.1
2.9
3.6
6.3
Retail deposits less total lending (spot) – Mar 12 vs Sep 11
Total
BB
UK
PB & Private
NZ
Other
WB
($bn)
49 54 59 61 68 72 78
Mar 09 Sep 09 Mar10 Sep 10 Mar 11 Sep 11 Mar 12
Personal Bank Customer Deposits
($bn)
69 73 77 78 84 86 94
Mar 09 Sep 09 Mar10 Sep 10 Mar 11 Sep 11 Mar 12
Business Bank Customer Deposits
($bn)
3 year CAGR 17%
3 year CAGR 11%
Summary
Solid momentum in the Australia & NZ franchises
Managing to positive jaws while continuing to invest
Balance sheet strength a priority as we transition to new regulatory regime
Strong focus on ROE at Group and Business Unit levels continues
30
Outlook
Subdued global economic activity likely
Focus on growing deposits and managing margin
Continue to drive efficiency to accommodate technology transition
Execute on UK business model change

Questions
Additional Information
Business BankingPersonal BankingWholesale BankingNAB WealthNZ BankingUK BankingGreat Western BankSpecialised Group AssetsAsia Asset QualityCapital and FundingEconomic Outlook

129 129 130 132
Sep 10 M ar 11 Sep 11 M ar 12
78 84 86 94
Sep 10 M ar 11 Sep 11 M ar 12
Business Banking
Business lending Customer deposits Housing lending
X% Cost to income ratio
0.0%($bn) ($bn) ($bn)
7.2%
0.8%2.5%
55 57 59 60
Sep 10 M ar 11 Sep 11 M ar 12
3.6% 3.5%
871 879 885 875
Sep 10 Mar 11 Sep 11 Mar 12
30.7% 29.9%
Costs
($m)
28.5%
Cash earnings on average assets
1.18% 1.25% 1.31% 1.29%
Sep 10 Mar 11 Sep 11 Mar 12
28.7%
10.0% 1.7%1.5%
33
Business Banking
Enterprise cross-sell focus –Total Customer Returns
2.35%
1.05%
2.30% 2.37%
1.01% 1.03%
3.31%3.60%3.40%
Mar 11 Sep 11 Mar 12 Target StateTCR
Lending TCR Non-Lending TCR
3.40%
2.502.57
2.66
2.56
Sep 10 Mar 11 Sep 11 Mar 12
Net interest margin
(%)
* Figures have been adjusted to include additional products cross-sold not previously captured
34
Business lending market share2
(%)
22.922.1 22.2 22.4
Sep 10 Mar 11 Sep 11 Mar 12
129.1130.1
132.2
0.7 (0.1)
0.1
0.4
1.4 0.6
Business lending volumes1
($bn)
Mar
11
Co
rpo
rate
, In
sti
tuti
on
al &
S
pec
iali
sed
B
anki
ng
nab
bu
sin
ess
Wo
rkin
g
Cap
ital
S
ervi
ces
Sep
11
Co
rpo
rate
, In
sti
tuti
on
al &
S
pec
iali
sed
B
anki
ng
nab
bu
sin
ess
Wo
rkin
g
Cap
ital
S
ervi
ces
Mar
12
(1) Updated to reflect transfers of customers between business units(2) RBA Financial System/NAB

Business Banking: Net interest marginBusiness Banking: Net interest marginBusiness Banking: Net interest margin
35
Business Banking: Net interest margin
35
2.57% 2.56%
(0.04%)
(0.09%)
0.03%0.01%
0.08%
Mar 11 Lending Margin Deposits Funding &Liquidity Costs
Liability Mix Other Mar 12
2.66%2.56%
(0.07%)
(0.06%)
0.03%
0.01% (0.01%)
Sep 11 Lending Margin Deposits Funding &Liquidity Costs
Liability Mix Other Mar 12
Customer margin down 9bps
March 12 v September 11
March 12 v March 11
Customer margin down 4bps
Business Banking
Cash earningsB&DD charge
1,181 1,264 1,2641,098
Sep 10 Mar 11 Sep 11 Mar 12
7.6%($m) 7.0%
385 417 372410
Sep 10 Mar 11 Sep 11 Mar 12
6.1% (8.3%)
2,352 2,446 2,587 2,530
485 492514 517
3,0473,1012,837 2,938
Sep 10 Mar 11 Sep 11 Mar 12
Revenue
3.6%($m) 5.5%
OOI
NII2,059 2,216 2,172
1,966
Sep 10 Mar 11 Sep 11 Mar 12
Underlying profit
4.7%
($m) 7.6%
($m)
(1.7%) (2.0%)
10.8%
0.0%
36

Housing 31%
Business 69%
Retail Trade7%
Accommodation, Cafes, Pubs & Restaurants
5%
Manufacturing7%
Other18%
Construction4%
Agriculture Forestry and Fishing13%
Wholesale Trade5%
Property & Business Services41%
Business Banking: Total
Well secured – business products
Portfolio quality*Diverse assets^
0
200
400
600
Sep 10 Mar 11 Sep 11 Mar 120.00%
0.15%
0.30%
0.45%
0.60%
0.75%
B&DD charge B&DD/GLAs (annualised) (RHS)
B&DD charge
($m)
32% 33% 28% 27%
68% 67% 72% 73%
Sep 10 M ar 11 Sep 11 M ar 12
Investment grade equivalentSub- Investment grade
60% 61% 61% 61%
27% 25% 25% 25%
14%13% 14% 14%
Sep 10 M ar 11 Sep 11 M ar 12
F ully Secured** P art ially Secured Unsecured
^ Based on product split* Based upon expected loss ** Based upon security categories in internal ratings systems
PD Model Upgrades
37
Construction8%
Retail Trade8%
Manufacturing6%
Wholesale Trade6%
Finance & Insurance5%
Other13%
Accommodation, Cafes, Pubs & Restaurants
8%
Property & Business Services46%
Business Banking: SME Business*
Well secured – business products
Portfolio quality**Diverse assets^
0
50
100
150
200
250
300
Sep 10 Mar 11 Sep 11 Mar 120.00%
0.15%
0.30%
0.45%
0.60%
B&DD charge B&DD/GLAs (annualised) (RHS)
B&DD charge
($m)
38% 41% 38% 34%
62% 59% 62% 66%
Sep 10 M ar 11 Sep 11 M ar 12
Investment grade equivalentSub- Investment grade
69% 70% 70% 72%
25% 24% 24% 23%
5%6%6%6%
Sep 10 M ar 11 Sep 11 M ar 12
F ully Secured*** P art ia lly Secured Unsecured
^ Based on customer split* SME business data reflects the nabbusiness segment of Business Banking which supports business
customers with lending typically up to $25m, excluding the Specialised Businesses** Based upon expected loss*** Based upon security categories in internal ratings systems
Personal 36%
Business 64%
PD Model Upgrade
38

Additional InformationBusiness Banking
Personal BankingWholesale BankingNAB WealthNZ BankingUK BankingGreat Western BankSpecialised Group AssetsAsia Asset QualityCapital and FundingEconomic Outlook
Personal Banking
Home loan multiple of system growth3 Net transaction account growth
(1) Roy Morgan Research, Aust MFIs, population aged 14+, six month moving average. Customer satisfaction is based on customers who answered very/fairly satisfied. NAB compared with the weighted average ofthe three major banks (ANZ, CBA, WBC)
(2) Sweeney Research Brand Tracker(3) RBA Financial System/NAB
Sweeney research brand tracker2
(x) (#)
2.2
3.3
1.1
2.7
3.4
Mar 10 Sep 10 Mar 11 Sep 11 Mar 12
152,121 154,499
79,911
123,173143,700
Mar 10 Sep 10 Mar 11 Sep 11 Mar 12
NAB vsPeers
39%
40%
41%
39%
36%
43%
41%
38%
42%
40%
40%
41%
37%
40%
39%
Sep 11 Mar 12
Peer Average
34%
36%
39%
34%
37%
Open and upfront
Transparent with fees and charges
Customers are at an advantage
A bank for people like me
A leader in making banking fairerMar 09 Sep 09 Mar 10 Sep 10 Mar 11 Sep 11 Mar 12
Weighted average of three major bank peers NAB
MFI customer satisfaction1
(%)
-5.1%
78.5
79.3
69.0
74.1
0.8%
40

426 432500 464
Sep 10 Mar 11 Sep 11 Mar 12
Personal Banking
1,589 1,669 1,747 1,731
Sep 10 Mar 11 Sep 11 Mar 12
Revenue
($m)
Costs
902900891866
Sep 10 Mar 11 Sep 11 Mar 12
($m)
52.1%54.5%
Cost to income ratioX%
Net interest margin
(%)
Cash earnings
2.02
2.282.22 2.17
Sep 10 Mar 11 Sep 11 Mar 12
53.4%
5.0%
51.5%
($m)
1.4%15.7% 4.7%(7.2%)
(0.9%)
41
Sep 10 Mar 11 Sep 11 Mar 12
Household deposits market share2Housing loan market share1
Personal Banking
68 72 7861
Sep 10 Mar 11 Sep 11 Mar 12
104115
125 133
Sep 10 Mar 11 Sep 11 Mar 12
Customer deposits
($bn)
Housing loans
($bn)
(1) RBA Financial System, NAB
(2) APRA Banking System, NAB
10.5%11.5%
8.7% 5.9%
Sep 10 Mar 11 Sep 11 Mar 12
6.4% 8.3%
13.3%
13.8%
14.5%14.7%
42
13.6%
14.1% 14.2%14.5%

169138163116
Sep 10 M ar 11 Sep 11 M ar 12
Personal Banking: Asset quality
Mortgage 90+ DPD and impaired
B&DD charge
($m)
Cards & personal loans 90+ DPD
Total 90+ DPD and impaired
($m)
(40.5%) 15.3% (22.5%) 1.15%
0.98%
1.16%
1.09%
Sep 10 Mar 11 Sep 11 Mar 12
0.56%0.67%
0.61%0.53%
Sep 10 Mar 11 Sep 11 Mar 12
873836 851 789
Sep 10 Mar 11 Sep 11 Mar 12
43
2.22%
2.02%
(0.08%)
(0.06%)
(0.10%)
(0.08%)
0.04%
0.08%
Mar 11 Lending Margin Deposits Funding &Liquidity Costs
Liability Mix Lending Mix Other Mar 12
Personal Banking: Net interest margin
44
2.02%
2.17%
(0.02%)(0.04%)
0.07%
0.01%
Sep 11 Lending Margin Deposits Funding &Liquidity Costs
Liability Mix Lending Mix Other Mar 12
(0.06%)(0.11%)
Customer margin down 12bps
March 12 v September 11
March 12 v March 11
Customer margin down 16bps
0.0%
0.5%
1.0%
1.5%
2.0%
2.5%
3.0%
3.5%
4.0%
4.5%
0 3 6 9 12 15 18 21 24
2006 2007 2008 2009 2010 2011 2012
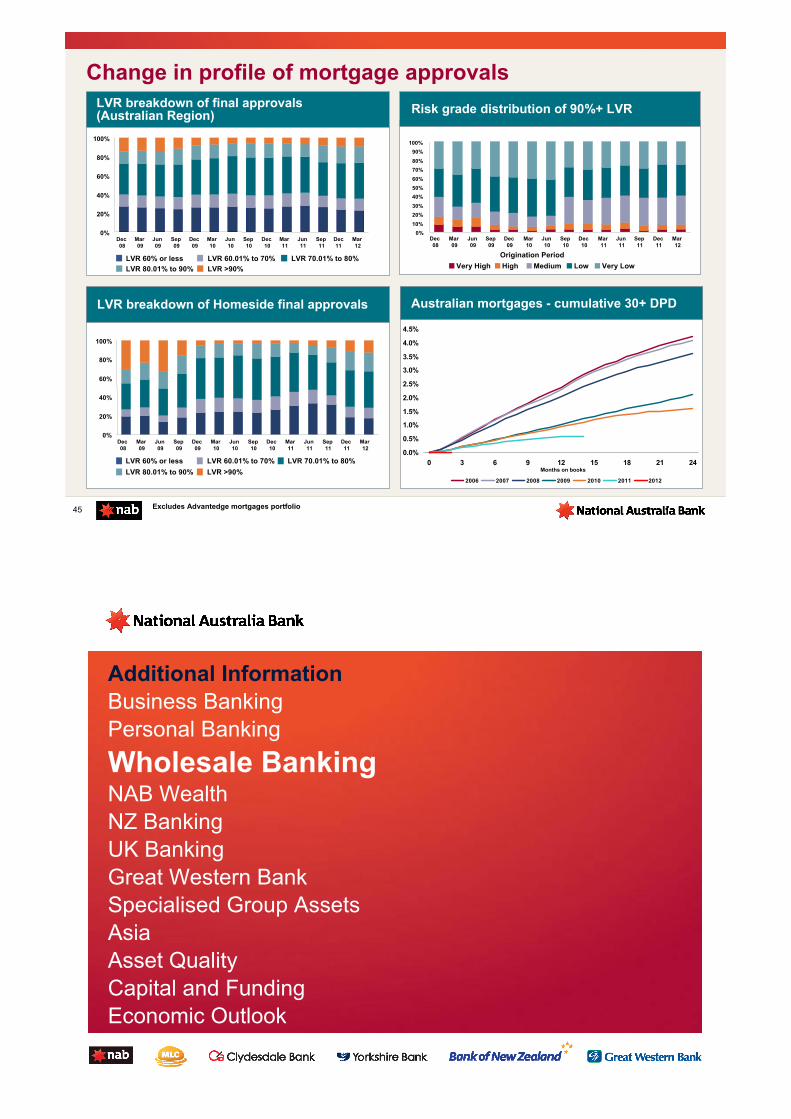
LVR breakdown of final approvals(Australian Region) Risk grade distribution of 90%+ LVR
Change in profile of mortgage approvals
LVR breakdown of Homeside final approvals
Excludes Advantedge mortgages portfolio45
0%
20%
40%
60%
80%
100%
Dec 08
Mar 09
Jun 09
Sep 09
Dec 09
Mar 10
Jun 10
Sep 10
Dec 10
Mar 11
Jun 11
Sep 11
Dec11
Mar 12
LVR 60% or less LVR 60.01% to 70% LVR 70.01% to 80%
LVR 80.01% to 90% LVR >90%
0%
20%
40%
60%
80%
100%
Dec 08
Mar09
Jun 09
Sep 09
Dec 09
Mar 10
Jun 10
Sep 10
Dec 10
Mar 11
Jun 11
Sep 11
Dec 11
Mar 12
LVR 60% or less LVR 60.01% to 70% LVR 70.01% to 80%
LVR 80.01% to 90% LVR >90%
0%
10%
20%
30%
40%
50%
60%
70%
80%
90%
100%
Dec 08
Mar 09
Jun 09
Sep 09
Dec 09
Mar 10
Jun 10
Sep 10
Dec 10
Mar 11
Jun 11
Sep 11
Dec 11
Mar 12
Very High High Medium Low Very Low
Origination Period
Australian mortgages - cumulative 30+ DPD
Months on books
Additional InformationBusiness BankingPersonal Banking
Wholesale BankingNAB WealthNZ BankingUK BankingGreat Western BankSpecialised Group AssetsAsia Asset QualityCapital and FundingEconomic Outlook

Best advice in Interest Rate Risk Management (Corporate/Institutional: peer group ranking) 2
Lead Interest Rate provider where the relevant bank is lead credit provider (Corporate /Institutional: peer group ranking) 2
Provider of Interest Rate Swaps (% primary relationship – Corporate) 3
Provider of Spot Foreign Exchange (% primary relationship – Corporate) 3
Interest Rate Derivatives Market Share 6
Market Share in Cross Currency Interest Rate Swaps 6
Most Competitive Swap Quotes 6
Most Valuable/Tailored Foreign Exchange advice to Financial Institutions (Australia Financial Institutions: peer group ranking) 7
Infrastructure and natural resources Debt capital solutions
Wholesale Banking
NAB Asset Servicing
Largest Asset Servicing business1 in Australia with ~30% market share (by volume)
561 599701 653 703
600 660
Sep07
Sep08
Sep09
Sep10
M ar11
Sep11
M ar12
($bn)
Assets under custody & administration
47
#1 ranked Bookrunner in AU Securitisation league table 4
#2 ranked in Australian Bookrunner Ranking for Syndicated Loans 5
#1 arranger of project finance to Australian Infrastructure Public Private Partnership (PPP) projects 8
#1 arranger of project finance to Australian Renewable Power projects 9
#1
#1
#1
#2
#1
#1
#1
#5
na
#4
#2
#1
#=1
#3
#1 #3
Current ranking
12 mthprior
Woolworths
$1.2bnSyndicate Loan Facility
Joint Lead Manager
October 2011
SSE PLC
$700mUSPP
Joint Agent
February 2012
Apollo Series 2011-1
$1.25bnAustralian RMBS Issue
Joint Lead Manager
November 2011
Bank of China
$600mFloating Rate
Offering
Joint Lead Manager
March 2012
Associated British Ports
£1.86bn 3, 5 & 7 year
Syndicated Facilities
Mandated Lead Arranger, Bond Bookrunner
December 2011
Victorian Comprehensive Cancer Centre Project
$940m Construction & Term
Loan Facility
Lender and Mandated Lead Arranger, Swap Provider, Underwriter, Coordinating Bank & Original Acct Bank
December 2011
Sandfire Resources NL
$380mSenior Project Facility
Mandated Lead Arranger
January 2012
Woolnorth Wind Farms
$ 170mTerm Facilities, Working Capital and L/C Provider
Sole MLA, Underwriter, Bookrunner, Facility Agent
& Security Trustee
February 2012
Customer sales performance
(1) Australian Custodial Services Association, Total Assets Under Custody for Australian Investors, December 2011; (2) Peter Lee Associates - Large Corporate & Institutional Relationship Banking Australia Survey 2011. Ranking against the four major domestic banks; (3) East & Partners Australian Corporate Banking Market Survey, January 2012; (4) Kanganews, Dec 27th 2011 AU Securitisation League Table, AUD tranches only – excl. Self-Led deals; (5) Dealogic Loans Review – Full Year 2011; (6) Peter Lee Associates - Interest Rate Derivatives Australia Survey 2011; (7) Peter Lee Associates - Foreign Exchange Australia Survey 2011, Financial Institutions. Ranking against the four major domestic banks; (8) Project Finance International 2009-2011 APAC MLA League Tables US$ Project Allocation, NAB analysis ranking against four major domestic banks - cumulative volume; (9) NAB analysis ranking against four major domestic banks - cumulative volume. Data Source: Project Finance International 2006-2011 APAC MLA League Tables US$ Project Allocation
Current ranking
Previous ranking
520 571 685 724
426 174
495
375
Sep 10 Mar 11 Sep 11 Mar 12
Customer Risk
4848
B&DD charge
Cash earnings and underlying profit Revenue by line of business
Wholesale Banking
302393
268
518428
754
541400
Sep 10 Mar 11 Sep 11 Mar 12
Cash Earnings Underlying Profit
($m)
($m)
• Customer comprises Sales, Asset Servicing, Specialised Finance and Financial Institutions Group• Risk comprises FICC1 and Treasury
($m)
895997
859
Customer income up on the September 11 half reflecting continued cross-sell momentum in Corporate & Business Sales
Risk income (FICC1 and Treasury) significantly improved during the half resulting from an improved trading environment with higher customer flows
B&DD charge driven by two provisions raised, asset quality remains sound
1,219
16
(12)
33
47
Sep 10 Mar 11 Sep 11 Mar 12
(1) Fixed Income, Currencies & Commodities

389
196
224232
274
263298
296308
416
273257355338
407
268
Sep 08 Mar 09 Sep 09 Mar 10 Sep 10 Mar 11 Sep 11 Mar 12
Sales Other
Wholesale Banking: Income
Customer income
($m)
464
631685
570629
520571
724
Customer income compound annual growth rate from September 2008 to March 2012 is 13.6%, driven by continued success in the franchise focus strategy, investing in capabilities to provide innovative risk management solutions to the Group’s customers
Risk income (FICC and Treasury) has significantly improved on the September 2011 half as a result of good client flows and increased trading opportunities through improved market conditions
49
Risk income
($m)
270476
318 256 206 26867
295
92
429
420
148 169158
107
200
Sep 08 Mar 09 Sep 09 Mar 10 Sep 10 Mar 11 Sep 11 Mar 12
0
5
10
15
20
Treasury FICC VaR (traded) (RHS)
362
905
174
738
404 375 426495
5050
Gross impaired assets ratio
Collective provisions
0
100
200
300
400
Mar 10 Sep 10 Mar 11 Sep 11 Mar 120.0%
0.5%
1.0%
1.5%
2.0%
2.5%
3.0%
Gross impaired assets Gross impaired assets as % of GLAs
Wholesale Banking: Asset quality
($m)
Portfolio asset quality is stable with over 90% at investment grade equivalent
Gross impaired assets were broadly stable on the September 2011 and March 2011 half year
233 209159
222 212
Mar 10 Sep 10 Mar 11 Sep 11 Mar 12
($m)

Additional InformationBusiness BankingPersonal BankingWholesale Banking
NAB WealthNZ BankingUK BankingGreat Western BankSpecialised Group AssetsAsia Asset QualityCapital and FundingEconomic Outlook
162 162 167
(4)12 21446 (6) (8)
(6)
Mar 11 Private Wealthvolumes &margins
MtM annuitiesinvest. profits
Expenses Loss onnabInvest seed
funds
Lower B&DDs Sep 11 AnnuityExperience
(incl MtMinvest. Profits)
FUM/ volumes UnderlyingMargins
(Business Mix& Pricing)
Private Wealthvolumes &margins
Other Mar 12
Investments cash earnings
($m)
NAB Wealth
Insurance cash earnings
($m)
10893
72
76
7
44
2
(4)(8)
(12)
(21)
Mar 11 PIF Earnings on theAssets backingthe Insurance
Portfolio
PolicyholderMix
Claims AllocatedFinancialPlanningrevenue
Other Sep 11 PIF Claims PolicyholderMix & Lapses
AllocatedFinancialPlanningrevenue
Mar 12
52

0.85%0.86% 0.85%
(0.02%)
(0.00%)
0.04% (0.03%)
(0.01%) (0.01%)
Mar 11Annuity investment profits
nabInvest investment earnings on seed funds
Plum new client costs
FUM Mix
Sep 11Annuity Experience
Business Mix & Pricing Changes
OtherMar 12
0.02%
NAB Wealth
Movement in investments margin
Premiums inforce
Sep 10 Mar 11 Sep 11 Mar 12
($m) 2.1% 2.1%
53
1.8%
1,407 1,436 1,466 1,493
Movement in FUM1
($bn)
119.0110.3
123.5
(0.4)
7.0
(1.5)7.70.1 (8.4)
Mar 11 Net flows InvestmentEarnings
Other Sep 11 Net flows InvestmentEarnings
Other Mar 12
67%72%73%
% % Retail FUM
(1) FUM based on a proportional ownership basis
Movements in FTEs
Movements in operating expenses
NAB Wealth
(13)
567561571
128
13(6)10
(14)
Mar 11 IntegrationBenefits
Growth inAdvisors &
Support Staff
Seasonality Sep 11 New Products& Services
nabInvestAcquisitions
IntegrationBenefits
Seasonality &Other
Mar 12
4,555 4,632 4,695 4,510
440 534 385 351719 758 829 774
Sep 10 Mar 11 Sep 11 Mar 12
BAU FTEs Project FTEs Salaried adviser FTEs
(#)
($m)
5,714 5,924 5,909
54
5,635

Investment sales by channel Insurance sales by channel
Channel and adviser growth
27% 29% 34% 34%
29% 30% 30% 32%
44% 41% 36% 34%
Sep 10* Mar 11 Sep 11 Mar 12
Bank Aligned IFA
Wealth adviser movement analysis
1,5551,727
1,864 1,842
(195)312
(119)
173
178 113
Sep 10Recruits
ExitsMeritum
Mar 11Recruits
ExitsSep 11
Recruits
ExitsMar 12
(175)(#)
* IFA sales were re-stated in 2010 to include Aviva* IFA sales were re-stated in 2010 to include Aviva
39% 40% 41% 43%
15% 19% 20% 22%
46% 41% 39% 35%
Sep 10* Mar 11 Sep 11 Mar 12
Bank Aligned IFA
55
Additional InformationBusiness BankingPersonal BankingWholesale BankingNAB Wealth
NZ BankingUK BankingGreat Western BankSpecialised Group AssetsAsia Asset QualityCapital and FundingEconomic Outlook

2.24 2.242.35 2.41
Sep 10 Mar 11 Sep 11 Mar 12
57
B&DD charge
269 283329
385
Sep 10 Mar 11 Sep 11 Mar 12
Net interest marginCash earnings
(NZ$m)
5.2%
(%)
New Zealand Banking
99 95
5634
Sep 10 Mar 11 Sep 11 Mar 12
(NZ$m)
16.3%
17.0%
861 865 910 944
367 369 378 375
Sep 10 Mar 11 Sep 11 Mar 12Revenue Expenses
Revenue v expense growth
(NZ$m)
41.5%42.7% 39.7%
% Cost to income ratio
42.6%
58
CostsRetail deposits
Retail lendingBusiness lending
367 369 378 375
Sep 10 Mar 11 Sep 11 Mar 12
58
New Zealand Banking
41.5%42.6%
26.9 27.0 27.3 28.0
Sep 10 Mar 11 Sep 11 Mar 12
Cost to income ratio
0.4%
42.7%
(NZ$bn)
(NZ$m)
27.627.026.426.0
1.51.51.5 1.5
Sep 10 Mar 11 Sep 11 Mar 12H o using Unsecured P erso nal
(NZ$bn)
X%
14.6 15.2 15.5 15.9
14.2 15.2 16.3 17.6
Sep 10 Mar 11 Sep 11 Mar 12
B N Z P artners B N Z R etail
28.8 30.4
(NZ$bn)
31.8
5.6%
1.5%
27.5 27.9 28.51.1%
4.6%
2.2%2.6% 2.1%29.1
33.5
5.3%
39.7%
2.35%2.41%
0.02%0.02% 0.02% 0.01%
0.04%(0.05%)
Sep 11 Lending Margin Deposits Funding & LiquidityCosts
Liability Mix Lending Mix Other Mar 12
5959
March 12 v September 11
March 12 v March 11
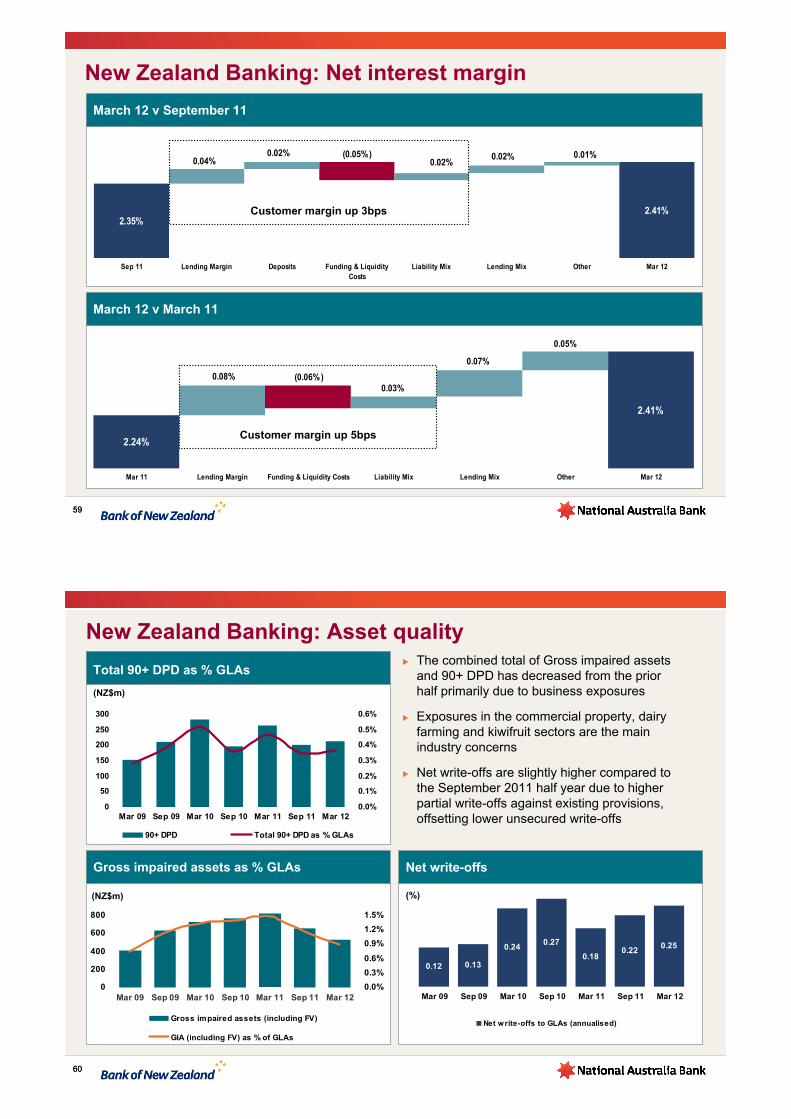
New Zealand Banking: Net interest margin
2.41%
2.24%
0.03%
0.07%
0.08% (0.06%)
0.05%
Mar 11 Lending Margin Funding & Liquidity Costs Liability Mix Lending Mix Other Mar 12
Customer margin up 3bps
Customer margin up 5bps
60
Total 90+ DPD as % GLAs
Net write-offsGross impaired assets as % GLAs
60
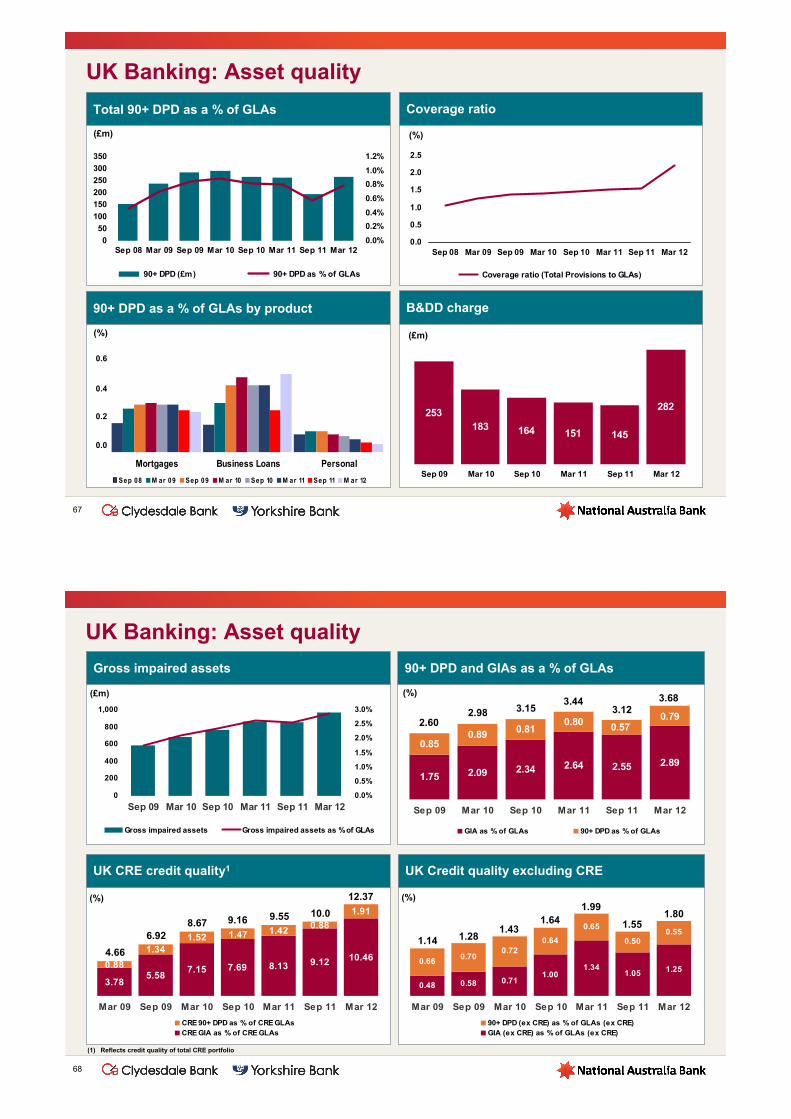
The combined total of Gross impaired assets and 90+ DPD has decreased from the prior half primarily due to business exposures
Exposures in the commercial property, dairy farming and kiwifruit sectors are the main industry concerns
Net write-offs are slightly higher compared to the September 2011 half year due to higher partial write-offs against existing provisions, offsetting lower unsecured write-offs
New Zealand Banking: Asset quality
0
50
100
150
200
250
300
Mar 09 Sep 09 Mar 10 Sep 10 Mar 11 Sep 11 Mar 120.0%
0.1%
0.2%
0.3%
0.4%
0.5%
0.6%
90+ DPD Total 90+ DPD as % GLAs
(NZ$m)
0
200
400
600
800
Mar 09 Sep 09 Mar 10 Sep 10 Mar 11 Sep 11 Mar 120.0%
0.3%
0.6%
0.9%
1.2%
1.5%
Gross impaired assets (including FV)
GIA (including FV) as % of GLAs
0.250.22
0.18
0.270.24
0.130.12
Mar 09 Sep 09 Mar 10 Sep 10 Mar 11 Sep 11 Mar 12
Net write-offs to GLAs (annualised)
(NZ$m) (%)

Additional InformationBusiness BankingPersonal BankingWholesale BankingNAB WealthNZ Banking
UK BankingGreat Western BankSpecialised Group AssetsAsia Asset QualityCapital and FundingEconomic Outlook
UK Banking
(£m)
Net interest marginCosts
363 363 348359
Sep 10 Mar 11 Sep 11 Mar 12
59.0% 56.4%59.2%2.09
2.28 2.33 2.33
Sep 10 Mar 11 Sep 11 Mar 12
(%)(£m)
62
X% Cost to Income Ratio
58.8%
Business lending
(£bn)
11.3 11.4 11.6 11.8
6.8 6.5 6.3 6.1
Sep 10 Mar 11 Sep 11 Mar 12
Other business Commercial property
18.1 17.9
(1.1%)
17.9
0.0%
17.9
0.0%
Personal lending
(£bn)
12.6 12.9 13.6 14.3
1.51.72.0 1.8
Sep 10 Mar 11 Sep 11 Mar 12
Housing Unsecured
14.6 14.7
0.7%
15.3
4.1%
15.8
3.3%
Retail deposits
(£bn)
23.7 23.4 23.3 24.2
Sep 10 Mar 11 Sep 11 Mar 12
(1.3%)(0.4%) 3.9%

6363
UK Banking: Net interest margin
2.33%
2.09%
(0.03%)
(0.21%)
0.21%
Mar 11 Lending Margin Deposits Funding & Liquidity Costs Liability Mix Lending Mix Mar 12
(0.14%)
(0.07%)
2.09%
2.33% (0.01%)(0.05%)
0.07%
(0.01%)
Sep 11 Lending Margin Deposits Funding & LiquidityCosts
Liability Mix Lending Mix Liquids (volumes) Other Mar 12
(0.11%)
(0.09%)
(0.04%)
March 12 v September 11
March 12 v March 11
Customer margin down 17bps
Customer margin down 17bps
Stable funding index
Funding mix
85.2% 81.9% 84.9% 87.2%
20.1%11.9% 11.8% 9.9%
73% 71%70%75%
Sep 10 Mar 11 Sep 11 Mar 12
CFI TFI Retail cover ratio
105.3%93.8% 96.7% 97.1%
Stable funding index (SFI) based on spot balances
64

134142
(4)(2)
14
Mar 11 PPI Refunds in prior period
Fees andcommissions
Other Mar 12
153142
(14)
(5)
8
Sep 11 Profit Share Fees andcommissions
Other Mar 12
March 12 v March 11 Other operating income
Operating expenses
UK Banking: Other operating income and expenses
358 359
325
344353
359 363 363
348
Mar 08 Sep 08 Mar 09 Sep 09 Mar 10 Sep 10 Mar 11 Sep 11 Mar 12
(£m)
(£m)
(£m)
65
March 12 v September 11Other operating income
Unsecured 5%
Business 42%
Mortgages 53%
66
Gross Loans & Acceptances
£33.5bn
100%
Business Lending
£17.5bn
52%
Mortgages
£14.6bn
44%
Unsecured
£1.4bn
4%
Commercial Property£6.0bn
34%
NonProperty£11.5bn
66%
Residential£11.7bn
80%
IHL£2.9bn
20%
PL£0.7bn
47%
Cards£0.5bn
33%
Other£0.2bn
20%
Investment
£5.1bn
85%
Development
£ 0.9bn
15%
March 2012 Total portfolio composition
UK Banking portfolio composition
Unsecured 4%
Business 52%
Mortgages 44%
£33.5 bn
Pro forma portfolio composition (post CRE transfer to NAB)
£27.3 bn
Total 90+ DPD as a % of GLAs Coverage ratio
90+ DPD as a % of GLAs by product
0
50
100
150
200
250
300
350
Sep 08 Mar 09 Sep 09 Mar 10 Sep 10 Mar 11 Sep 11 Mar 120.0%
0.2%
0.4%
0.6%
0.8%
1.0%
1.2%
90+ DPD (£m) 90+ DPD as % of GLAs
UK Banking: Asset quality
0.0
0.5
1.0
1.5
2.0
2.5
Sep 08 Mar 09 Sep 09 Mar 10 Sep 10 Mar 11 Sep 11 Mar 12
Coverage ratio (Total Provisions to GLAs)
(£m)
B&DD charge
253183 164 151 145
282
Sep 09 Mar 10 Sep 10 Mar 11 Sep 11 Mar 12
(£m)
67
(%)
Mortgages Business Loans Personal
Sep 08 M ar 09 Sep 09 M ar 10 Sep 10 M ar 11 Sep 11 M ar 12
0.6
0.4
0.2
0.0
(%)
0.48 0.58 0.711.00
1.341.05 1.25
0.65
0.640.72
0.700.66
0.500.55
Mar 09 Sep 09 Mar 10 Sep 10 Mar 11 Sep 11 Mar 12
90+ DPD (ex CRE) as % of GLAs (ex CRE)GIA (ex CRE) as % of GLAs (ex CRE)
0
200
400
600
800
1,000
Sep 09 Mar 10 Sep 10 Mar 11 Sep 11 Mar 120.0%
0.5%
1.0%
1.5%
2.0%
2.5%
3.0%
Gross impaired assets Gross impaired assets as % of GLAs
UK Banking: Asset quality
Gross impaired assets
(£m)
90+ DPD and GIAs as a % of GLAs
2.892.552.642.342.091.75
0.79
0.850.89 0.81
0.80 0.57
Sep 09 Mar 10 Sep 10 Mar 11 Sep 11 Mar 12
GIA as % of GLAs 90+ DPD as % of GLAs
2.602.98 3.15
3.443.12
68
(%) 3.68
10.469.12
3.785.58
7.15 7.69 8.13
1.91
1.421.52
1.34
0.88
0.88
Mar 09 Sep 09 Mar 10 Sep 10 Mar 11 Sep 11 Mar 12
CRE 90+ DPD as % of CRE GLAsCRE GIA as % of CRE GLAs
1.47
1.47
UK CRE credit quality1
(%)
4.66
6.928.67 9.16 9.55 10.0
12.37
(1) Reflects credit quality of total CRE portfolio
UK Credit quality excluding CRE
(%)
1.14 1.281.43
1.641.99
1.551.80

7.5%
5.1%
NAB UK Banking CRE RBS UK Property
UK Banking CRE provisioning increased
UK CRE impaired loan coverage
Provision coverage of NPL assets1
61%
36% 37%30%
43%
NAB UKBanking CRE
RBS UKProperty
Lloyds CREBSU
LloydsCommercial
Barclays
Commercial real estate Total commercial lending
Note: Total provision over impaired and 90DPD loans
69(1) Source of peer comparison is 2011 audited financial statements(2) Includes UK CRE overlay of £150m – excluding overlay coverage is 41%
Provision coverage of CRE assets1
Note: Total provision over total loans
25%
48%
11%
23%
14%
Spec Provcoverage
Sep 11
1H12provisioning
Spec Provcoverage
Mar 12
Partial write-offs
Implied CREimpairedcoverage
2
Note: CRE specific provision over CRE impaired assets
Total UK CRE provision coverage – Mar 12
2.6%
7.5%
11.9%
4.4%
2.5%
2.4%
SpecificProvision
CollectiveProv
UK CREoverlay
Total prov Partial write-offs
ImpliedCRE
Coverage
Additional InformationBusiness BankingPersonal BankingWholesale BankingNAB WealthNZ BankingUK Banking
Great Western BankSpecialised Group AssetsAsia Asset QualityCapital and FundingEconomic Outlook

31 3227
14
0.0%0.5%1.0%1.5%2.0%2.5%3.0%3.5%
Sep 10 Mar 11 Sep 11 Mar 12
B&DDs 90DPD + GIAs to GLAs (ex covered loans)
0.8 0.9 1.1 1.2
4.6 4.3 4.1 4.2
0%
5%
10%
15%
20%
25%
Sep 10 Mar 11 Sep 11 Mar 12
Agri Other Agri as % of total
7171
B&DDs and asset quality metrics
(US$m)
Loan portfolio composition
(US$bn)
Cash earnings
(US$m)
Great Western Bank
37
4743
50
Sep 10 Mar 11 Sep 11 Mar 12
Gross loans & acceptances
(US$bn)
4.94.54.24.3
0.50.71.01.1
Sep 10 M ar 11 Sep 11 M ar 12
GLA s ( ex acq wo rko ut ) A cq uired wo rko ut lo ans
Additional InformationBusiness BankingPersonal BankingWholesale BankingNAB WealthNZ BankingUK BankingGreat Western Bank
Specialised Group AssetsAsia Asset QualityCapital and FundingEconomic Outlook

Specialised Group Assets
73
RWAs
($bn)
25.3 24.320.5
18.0
8.0
15.0
Sep 09 Mar 10 Sep 10 Mar 11 Sep 11 Mar 12
Cash earnings & underlying profit
($m)
(217) (45)
77
(127)33
(3)
69
(6)
115
(319) 3(135)
Sep 09 Mar 10 Sep 10 Mar 11 Sep 11 Mar 12
Cash Earnings Underlying Profit
B&DD charge
($m)
173
95
21 2071
299
Sep 09 Mar 10 Sep 10 Mar 11 Sep 11 Mar 12
Portfolio income1
($m)(84) (108) 18 139 28 87
104125 100(30)
(162)(67)
63
(84)(80)
(65)
(14)
48
12759 17
80
(4)
(101)
(6)
(1)
Sep 09 Mar 10 Sep 10 Mar 11 Sep 11 Mar 12SCDO Risk Mitigation MTM Markets Counterparty Credit Val Adj
Non Franchise Asset Income CDS Hedging MTM volatility
(1) Sept 11 income includes recovery for equity workout
7
74
0
50
100
150
200
Sep 09 Mar 10 Sep 10 Mar 11 Sep 11 Mar 120%
10%
20%
30%
40%
Specific provisions (LHS)
Specific provisions to gross impaired assets (RHS)
Gross loans & acceptances (average)
0
2
4
6
8
10
12
Sep 09 Mar 10 Sep 10 Mar 11 Sep 11 Mar 12
($m)
90+ DPD and GIAs as % of GLAs
Specific provisions to gross impaired assets Collective provisions1 as a % of credit RWAs
($bn)
($m) ($m)
0
100
200
300
400
500
600
Sep 09 Mar 10 Sep 10 Mar 11 Sep 11 Mar 120.0%
1.0%
2.0%
3.0%
Collective provisions (LHS)Collective provisions as a % of credit RWAs (RHS)
(1) Prior periods include $160m overlay. Fully utilised at March 2012.
0
200
400
600
800
Sep 09 Mar 10 Sep 10 Mar 11 Sep 11 Mar 120.0%
2.0%
4.0%
6.0%
8.0%
10.0%
12.0%
90+ DPD and GIAs (LHS) 90+ DPD and GIAs as % of GLAs (RHS)
Specialised Group Assets: Asset quality

75
Specialised Group Assets - SCDO updateIn 1H12, removed the ‘sold protection’ on the last two remaining SCDOs
What we have doneExited the ‘sold protection’ of the last two remaining SCDOs
Terminated one original CLN note and novated the corresponding hedge (at no cost to NAB)
ImpactRemoved $600m of credit risk
$1.5bn RWA reduction
$141m of hedge premium cost accelerated
MTM ‘noise’ has been removed
Regarding the remaining SCDOsTwo fully hedged positions remain with one credit event during the first half
As at 31 March, there is no longer any unhedged SCDO risk
During the current half the final SCDO MTM was a positive $17 million
The recognition of remaining hedge costs related to the SCDO risk mitigation trades have been accelerated by expensing the carrying value of these hedge costs to non-cash earnings
During the March 2012 half year, $141 million ($99 million after tax) of such costs were expensed through non-cash earnings
The $160 million provision overlay for conduits and derivatives has been used to absorb the residual costs
76
Mar 2012
A$3.7bn2
SGA Conduit Portfolio Summary1
(1) Includes Group’s exposures (drawn and available to be drawn) initially funded by NAB sponsored and third party sponsored asset backed commercial paper conduits and SPE purchased assets
(2) Specialised Group Assets has removed the economic risk associated with the six sold protection SCDO derivative exposures
Movements between September 2011 and March 2012
(A$0.1bn)
(A$1.6bn)
Decrease in exposure due to foreign currency exchange
rate movements
A$5.4bn
Mortgages A$0.2bn
Subscription loans A$0.4bn
Leveraged Loans A$1.4bn
Credit Wrapped Bonds A$0.5bn
Infrastructure Bonds A$0.2bn
CMBS A$0.6bn
Credit Wrapped ABS A$0.6bn
Corporates (SCDOs) A$1.3bn
Asset Backed CDO A$0.2bn
Decrease due to repayments, maturities and terminations
Sep 2011
Mortgages A$0.2bn
Leveraged Loans A$1.3bn
Credit Wrapped Bonds A$0.5bn
Infrastructure Bonds A$0.2bn
CMBS A$0.5bn
Credit Wrapped ABS A$0.5bn
Corporates (SCDOs) A0.5bn

77
Credit Wrapped ABS – $0.5bnStructured Asset Management
* Note that this includes Subprime, Prime, Alternative A, 2nd Lien and HELOC RMBS
NAB owns a pro-rata share of two RMBS/ABS portfolios with concentrations to US residential mortgage-backed securities
At issue, all bonds in the portfolios were rated AAA/Aaa by S&P and Moody’s either directly or as the result of an insurance policy
In addition to the bond-level policies covering a portion of each portfolio, there is a portfolio-wide policy from MBIA on Portfolio 1 that serves as insurance against loss. The AMBAC portfolio-wide policy was terminated by mutual agreement in October 2011
The provision held against the portfolios has not materially changed
Following a change in treatment, the RWA for the Credit Wrapped ABS has been reduced by $3.2bn, with a corresponding increase in capital deductions of $229m
Portfolio 1 Portfolio 2
Current NAB Exposure $305m $209m
(US$318m) (US$217m)
Average Portfolio Rating (excludes Portfolio Policy, includes Bond Level Policies)
B3 / B Caa1/ CCC+
Portfolio Guarantor MBIA (B3 / B)AMBAC (NR / NR) – Policy
terminated Oct 2011% of Underlying Asset with Wrap 43.4% 30.7%
Asset Breakdown
Residential Mortgage Backed Security* 34.1% 47.8%
Commercial Mortgage Backed Security 0.0% 5.2%
Insurance 15.6% 3.5%
Student Loan 7.1% 32.1%
Collateralised Debt Obligation 27.4% 0.0%
Transportation & Other ABS 15.9% 11.4%
Total Commitments
(A$bn)
Total Provisions (specific & collective)
(A$m)
Average Contractual
Tenor(years)
RWAs(A$bn)
Number of Clients
Close Review Commitments
(A$bn)
Leveraged Finance UK
0.8 94 2.9 1.5 28 0.2
Corporate UK1 1.5 116 1.6 2.3 33 0.9
Structured Asset Finance UK
1.3 15 14.7 0.9 16 0.0
Private Portfolio USA
0.6 7 8.5 0.6 23 0.0
Total Loans & Advances
4.2 232 n/a 5.3 100 1.1
Structured Asset Management2 3.7 91 11.0 2.7 27 0.5
Total 7.9 323 8.8 8.0 127 1.6
78
Portfolio Composition as at 31 March 2012
(1) Of which:
Property UK 0.4 68 0.8 0.9 15 0.3
Leveraged F inance UK10%
C o rpo rate UK19%
Structured A sset F inance UK16%
Structured A sset
M anagement 47%
P rivate P o rtfo lio USA
8%
(2) Hold To Maturity Assets

79
Portfolio Composition - Credit profile
(A$m)
Leveraged Finance UK 0 181 325 198 103
Corporate UK 277 270 428 298 212
Structured Asset Finance UK 1,036 229 0 0 40
Private Lending USA 464 24 92 12 14
Total Loans & Advances 1,777 704 845 508 369
Structured Asset Management12,797 97 0 545 307
Total Commitments 4,574 801 845 1,053 676
Total RWAs 3,000 1,210 1,694 1,602 503Total Provisions 1 6 50 42 224
Number of Accounts 49 19 29 23 19
Number of Close Review Accounts 0 0 6 15 19
58% of commitments relate to Investment Grade equivalent clients or transactions
InvestmentGrade
AAA/BBB-
Non-Investment
GradeBB+/BB
Non-Investment
GradeBB-/B+
Non-Investment
GradeB+/CCC-
Default or restructure
D
(1) Hold to Maturity Assets
All data as at 31 March 2012
Investment grades equivalent of external ratings
80
Portfolio CompositionContractual Maturity Profile - Commitments
Actual commitments have decreased from September 2009 largely through repayments and decreased commitments as well as the weakening of both USD and GBP against the AUD
The contractual maturity profile differs to the estimated maturity profile due to potential refinancing risks for a number of clients. The weighted average contracted maturity of the portfolio is 8.8 years
Total Commitments would be A$6.0bn by Sep 2014 on a contractual basis, assuming constant FX rates
SGA committed lending 5 year maturity profile
81
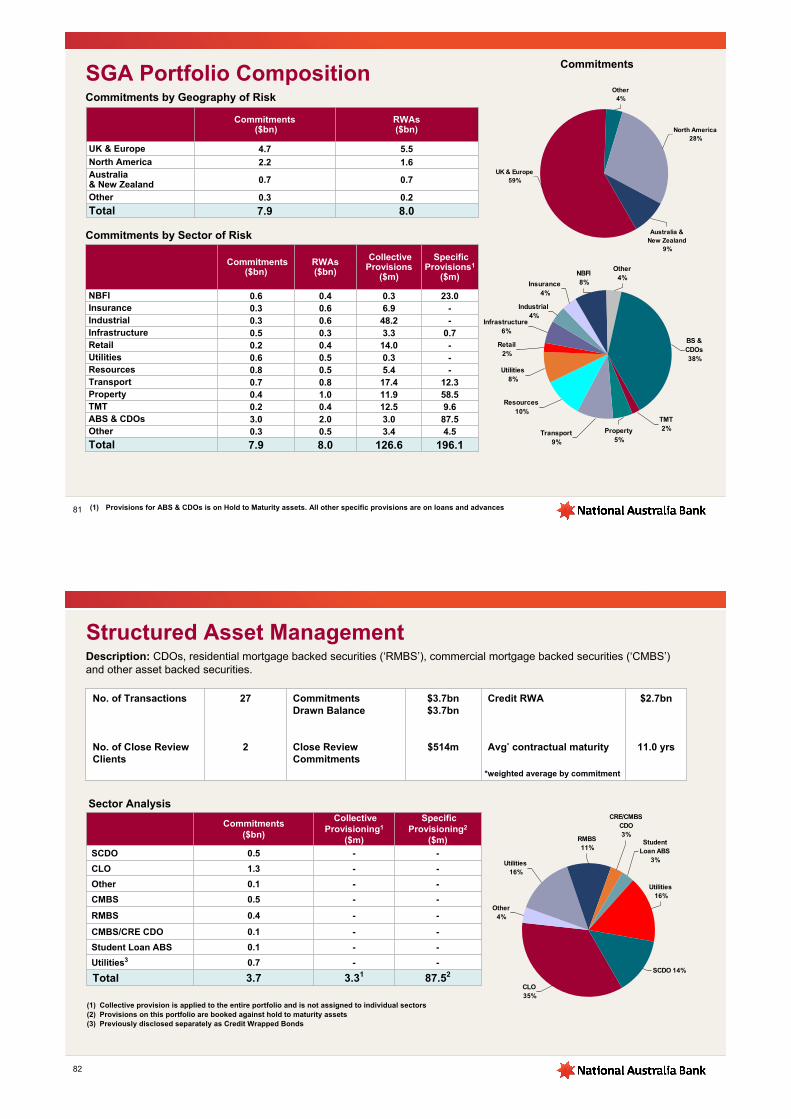
SGA Portfolio CompositionCommitments by Geography of Risk
Commitments($bn)
RWAs($bn)
Collective Provisions
($m)
Specific Provisions1
($m)
NBFI 0.6 0.4 0.3 23.0Insurance 0.3 0.6 6.9 -Industrial 0.3 0.6 48.2 -Infrastructure 0.5 0.3 3.3 0.7Retail 0.2 0.4 14.0 -Utilities 0.6 0.5 0.3 -Resources 0.8 0.5 5.4 -Transport 0.7 0.8 17.4 12.3Property 0.4 1.0 11.9 58.5TMT 0.2 0.4 12.5 9.6ABS & CDOs 3.0 2.0 3.0 87.5Other 0.3 0.5 3.4 4.5
Total 7.9 8.0 126.6 196.1
Commitments by Sector of Risk
Commitments ($bn)
RWAs($bn)
UK & Europe 4.7 5.5
North America 2.2 1.6Australia & New Zealand 0.7 0.7
Other 0.3 0.2
Total 7.9 8.0
Commitments
(1) Provisions for ABS & CDOs is on Hold to Maturity assets. All other specific provisions are on loans and advances
Industrial 4%
Insurance4%
NBFI 8%
BS &CDOs 38%
Other 4%
Infrastructure 6%
Retail 2%
Property 5%
TMT 2%
Transport 9%
Resources 10%
Utilities 8%
Australia & New Zealand
9%
North America 28%
UK & Europe 59%
Other 4%
82
Structured Asset ManagementDescription: CDOs, residential mortgage backed securities (‘RMBS’), commercial mortgage backed securities (‘CMBS’) and other asset backed securities.
No. of Transactions
No. of Close Review Clients
27
2
CommitmentsDrawn Balance
Close Review Commitments
$3.7bn$3.7bn
$514m
Credit RWA
Avg* contractual maturity
$2.7bn
11.0 yrs
Commitments($bn)
Collective Provisioning1
($m)
SpecificProvisioning2
($m)
SCDO 0.5 - -
CLO 1.3 - -
Other 0.1 - -
CMBS 0.5 - -
RMBS 0.4 - -
CMBS/CRE CDO 0.1 - -
Student Loan ABS 0.1 - -
Utilities3 0.7 - -
Total 3.7 3.31 87.52
Sector Analysis
*weighted average by commitment
SCDO 14%
CRE/CMBS CDO 3%
RMBS 11%
Utilities 16%
CLO 35%
Other 4%
Student Loan ABS
3%
Utilities 16%
(1) Collective provision is applied to the entire portfolio and is not assigned to individual sectors(2) Provisions on this portfolio are booked against hold to maturity assets(3) Previously disclosed separately as Credit Wrapped Bonds

Additional InformationBusiness BankingPersonal BankingWholesale BankingNAB WealthNZ BankingUK BankingGreat Western BankSpecialised Group Assets
Asia Asset QualityCapital and FundingEconomic Outlook
84
NAB’s operational focus in Asia
Product Focus
Customer Focus
Geographic Focus
Trading partners of Japan, China, India and IndonesiaLiquidity hubs of Singapore and Hong KongLinking the flows of these markets with Australia and New Zealand
Corporates and institutions in key industriesAustralian corporates linked to Asia, and Asian corporates with interests in AustraliaWealthy individuals and families with links between NAB’s home markets and AsiaLocal cash rich deposit customers
Corporate finance and trade finance FX products, interest rate and commodity risk managementMulti-currency mortgagesInstitutional and retail deposits
Beijing NAB and MLC representative officesShanghai branch (Corporate and Business focus)Fuzhou/Shanghai 16.8% stake in China Industrial Trust
Mumbai branch (Corporate and Business focus)
Tokyo & Osaka branches> Institutional, Trade,
Deposit Offers
Hong Kong 2 branches, > Markets, Institutional,
Trade, Business Banking, Healthcare, Personal Banking & Deposit Offers, Calibre Asset Management (financial planning)
Singapore branch> Institutional, Trade,
Business Banking, Healthcare, Personal Banking & Deposit Offers
Indonesia representative office> Supporting offshore trade,
wholesale banking and personal banking
Branch(es)Representative office(s)
Additional InformationBusiness BankingPersonal BankingWholesale BankingNAB WealthNZ BankingUK BankingGreat Western BankSpecialised Group AssetsAsia
Asset QualityCapital and FundingEconomic Outlook
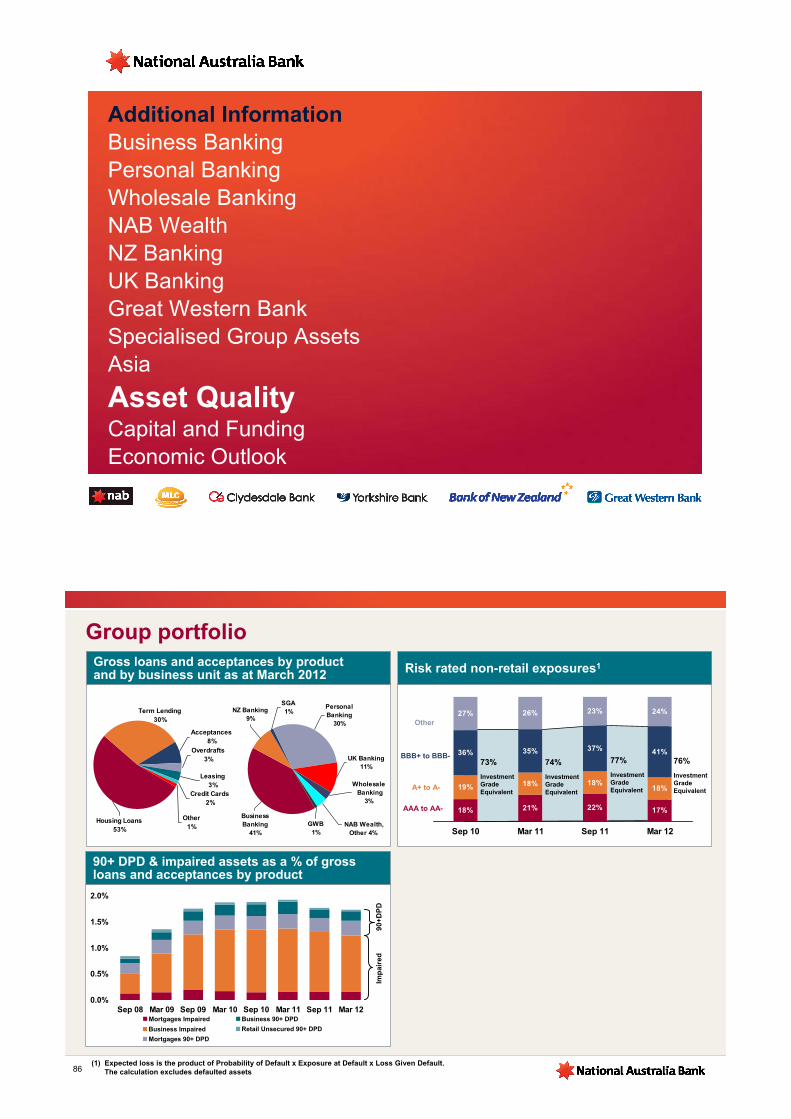
17%
19% 18% 18%18%
36% 35% 37% 41%
26% 23% 24%
22%21%18%
27%
Sep 10 Mar 11 Sep 11 Mar 12
SGA1%
NAB Wealth, Other 4%
Wholesale Banking
3%
NZ Banking9%
Business Banking
41%
Personal Banking
30%
UK Banking11%
GWB1%
Gross loans and acceptances by product and by business unit as at March 2012 Risk rated non-retail exposures1
Group portfolio
Term Lending30%
Credit Cards2%
Other1%
Acceptances8%
Housing Loans53%
Overdrafts3%
Leasing3%
(1) Expected loss is the product of Probability of Default x Exposure at Default x Loss Given Default. The calculation excludes defaulted assets
AAA to AA-
A+ to A-
BBB+ to BBB-
Other
73%
Investment GradeEquivalent
74%
Investment GradeEquivalent
77%
Investment GradeEquivalent
86
90+ DPD & impaired assets as a % of gross loans and acceptances by product
0.0%
0.5%
1.0%
1.5%
2.0%
Sep 08 Mar 09 Sep 09 Mar 10 Sep 10 Mar 11 Sep 11 Mar 12
Imp
aire
d9
0+D
PD
Mortgages Impaired
Business Impaired
Mortgages 90+ DPD
Business 90+ DPD
Retail Unsecured 90+ DPD
76%
Investment GradeEquivalent

0 40 80 120 160 200 240 280
Real estate - mortgage
Commercial property services
Other commercial and industrial
Agriculture, forestry, fishing & mining
Financial, investment and insurance
Asset and lease financing
Personal lending
Manufacturing
Real estate - construction
Government and public authorities Mar 11
Mar 12
Group asset composition – growth byproduct segment
Industry balances Gross loans and acceptances by geography
Group gross loans and acceptances
Non Retail
Retail - unsecured
Retail - secured
-15 -10 -5 0 5 10 15 20
Mar 10 Sep 10 Mar 11 Sep 11 Mar 12
Asia 0.9% Australia
76.7%
New Zealand 9.3%
United States 1.2%
Europe 11.9%
($bn)
($bn)
Note: These charts use spot exchange rates. Change in exchange rates relative to the Australian dollar since 2008 has partly affected growth rates
Retail portfolio – outstandings volume
87
0
50
100
150
200
250
300
Sep
08
De
c 0
8
Mar
09
Jun
09
Sep
09
De
c 0
9
Mar
10
Jun
10
Sep
10
De
c 1
0
Mar
11
Jun
11
Sep
11
De
c 1
1
Mar
12
-2%0%
2%4%6%
8%10%
12%14%
Group Retail Outstandings 12 Month Rolling Growth Rate
($bn)
March 2012 – Gross loans and acceptances by product
Group portfolio – change over three year period
Term Lending30%
Credit Cards2%
Other1%
Acceptances8%
Housing Loans53%
Overdrafts3%
Leasing3%
March 2012 – Gross loans and acceptances by geography
Australia 76.7%
Asia 0.9%
Europe 11.9%
United States 1.2%
New Zealand 9.3%
March 2009 – Gross loans and acceptances by geography
Asia 0.7%
Australia 68.5%
New Zealand 10.2%
United States 1.9%
Europe 18.7%
Term Lending30%
Credit Cards2%
Other 2%
Acceptances13%
Housing Loans45%
Overdrafts4%
Leasing4%
March 2009 – Gross loans and acceptances by product
88

Collective provision balances
Group provision balances and coverage ratios
($m)
3,570 3,4883,398
3,058
Sep 10 Mar 11 Sep 11 Mar 12
1,204 1,337
180162
118
1,092954
142
179
155172428
Sep 10 Mar 11 Sep 11 Mar 12
Business ≤$25m Retail Single Names >$25m
1,5241,419
1,546 1,634
($m)
89
Coverage ratios
0.0%
0.5%
1.0%
1.5%
2.0%
Mar 10 Sep 10 Mar 11 Sep 11 Mar 12
GRCL top up (pre-tax) as a % of Credit Risk Weighted Assets (ex Housing)
Collective Provisions as a % of Credit Risk Weighted Assets (ex Housing)
Total Provisions as a % of Gross Loans and Acceptances
Specific provision balances
Specific provision
Collective provision
Group provision movements
($m)
($m)
3,398
3,058
12
10 (43)(150)
(159)
Sep 11 Retail Non Retail(including loans at
fair value)
SCDO overlayutilisation
Derivatives at fairvalue
FX Impact/Other Mar 12
1,546 1,634
492 101 (493)(2)(10)
Sep 11 Non-Retail Large(>$10m)
Mortgages* Retail Other* Non Retail Other* Net W/Offs Large(>$10m)
Mar 12
# Specific provision as a % of impaired assets* Net of write-offs
90
24.2% #26.8% #
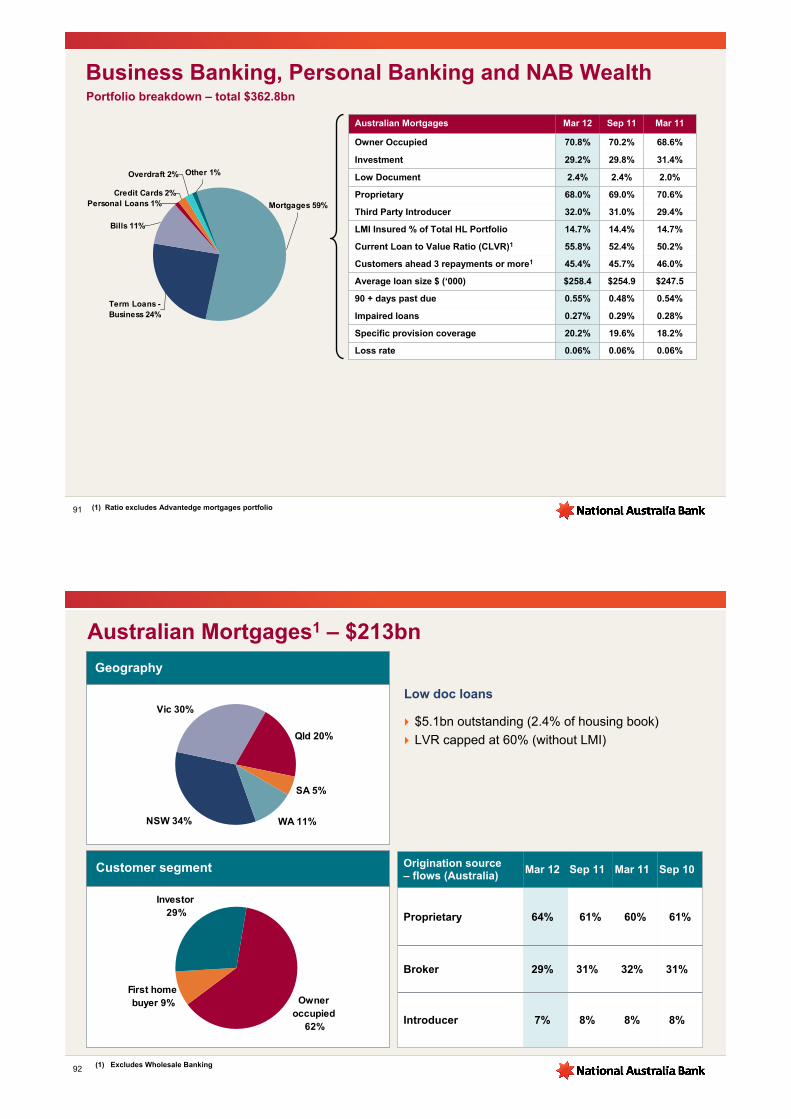
Term Loans - Business 24%
Credit Cards 2%
Other 1%
Personal Loans 1% Mortgages 59%
Bills 11%
Overdraft 2%
Business Banking, Personal Banking and NAB Wealth
(1) Ratio excludes Advantedge mortgages portfolio
Portfolio breakdown – total $362.8bn
18.2%19.6%20.2%Specific provision coverage
$247.5$254.9$258.4Average loan size $ (‘000)
0.06%
0.27%
0.55%
45.4%
55.8%
14.7%
32.0%
68.0%
2.4%
29.2%
70.8%
Mar 12
46.0%45.7%Customers ahead 3 repayments or more1
31.4%29.8%Investment
50.2%52.4%Current Loan to Value Ratio (CLVR)1
0.06%0.06%Loss rate
0.28%0.29%Impaired loans
0.54%0.48%90 + days past due
2.0%2.4%Low Document
14.7%14.4%LMI Insured % of Total HL Portfolio
29.4%31.0%Third Party Introducer
70.6%69.0%Proprietary
68.6%70.2%Owner Occupied
Mar 11Sep 11Australian Mortgages
91
Australian Mortgages1 – $213bn
Geography
NSW 34%
Qld 20%
SA 5%
WA 11%
Vic 30%
Customer segment
Owner occupied
62%
First home buyer 9%
Investor 29%
$5.1bn outstanding (2.4% of housing book)
LVR capped at 60% (without LMI)
Low doc loans
(1) Excludes Wholesale Banking
8%
32%
60%
Mar 11
8%
31%
61%
Sep 10Origination source – flows (Australia)
Mar 12 Sep 11
Proprietary 64% 61%
Broker 29% 31%
Introducer 7% 8%
92

UK Mortgages Mar 12 Sep 11 Mar 11
Owner Occupied 79.7% 79.6% 79.6%
Investment 20.3% 20.4% 20.4%
Low Document 0.0% 0.0% 0.0%
Proprietary 72.0% 72.8% 75.1%
Third Party Introducer 28.0% 27.2% 24.9%
LMI Insured % of Total HL Portfolio 1.3% 1.4% 1.5%
Loan to Value (at Origination) 62.7% 64.0% 62.5%
Loan to Value Indexed 53.5% 53.4% 53.5%
Average loan size £ (‘000) 97 94 90
90 + days past due 0.57% 0.62% 0.76%
Impaired loans 0.43% 0.44% 0.38%
Specific provision coverage 21.4% 30.1% 22.8%
Loss rate 0.11% 0.06% 0.05%
Portfolio breakdown – total £33.5bn
Commercial Property
18%
Other Business
34%
Mortgages44%
Unsecured4%
UK Banking
93
9494
NZ Banking
New Zealand Mortgages Mar 12 Sep 11 Mar 11
Low Document Loans 0.26% 0.24% 0.22%
Proprietary (Distributed by Bank) 100% 100% 100%
Third Party Introducer 0.0% 0.0% 0.0%
Insured % of Total HL Portfolio1 11.4% 10.7% 10.0%
Loan to Value (at origination) 63.5% 63.0% 61.7%
Average loan size NZ$ (‘000) 252 248 242
90 + days past due 0.31% 0.29% 0.35%
Impaired loans 0.46% 0.51% 0.58%
Specific provision coverage 38.7% 37.0% 35.0%
Loss rate 0.09% 0.08% 0.07%
Mortgages 48%
Commercial Property 12%
Other Commercial
11%
Personal Lending 3%
Manufacturing 4%
Retail and Wholesale Trade 4%
Agriculture, Forestry and Fishing 18%
Portfolio breakdown – total NZ$58.1bn
(1) Insured includes both LMI and Low Equity Premium

95
(0.9)0.4(0.4)(0.2)(0.1)(0.7)0.1Increase/(decrease) on Sep 11 (A$bn)
(0.4%)6.2%(6.3%)(2.4%)(0.3%)(0.6%)(0.3%)Change in % on Sep 11
TotalAsia/OtherSGAUSA2NZUK2Aus
12.2%17.4%10.2%21.3%11.9%17.8%11.4%% of GLAs
TOTAL CRE (A$bn) 43.0 9.2 5.4 1.2 0.4 0.8 60.0
Total $60.0bn12.2% of Gross Loans & Acceptances
Commercial Real Estate – Group Summary1
(1) Measured as balance outstanding at March 2012 per APRA Commercial Property ARF definitions(2) Excludes SGA
Group Commercial Property by type Group Commercial Property by geography
Office 27%
Tourism & Leisure 5%
Residential 14%
Industrial 15% Other 6%
Land 9%
Retail 24%
Australia 72%
United Kingdom
15%
New Zealand 9%
USA 2%Asia 1%
SGA 1%
Total $42.9bn11.4% of Australian geography Gross Loans & Acceptances
Commercial Real Estate – Business Banking
16.4%25.1%16.0%19.3%15.6%Specific provision coverage
3.0 3.13.02.53.4Average loan size $m
79%15%17%22%25%Security Level1 – Fully Secured
14%2%4%4%4%Partially Secured
7%1%1%0%5%Unsecured
0.06%
0.02%
1%
2%
15%
11%
2%
5%
18%
Other
5%1%1%2%Loan tenor > 5 yrs
0.26%
0.08%
3%
22%
12%
4%
10%
26%
VIC
1.52%
0.08%
2%
19%
12%
3%
7%
22%
QLD
2.91%
0.31%
13%
82%
55%
13%
32%
100%
Total
1.07%
0.13%
6%
26%
20%
4%
10%
34%
NSW
Loan tenor > 3 < 5 yrs
Loan Balance < $5m
Loan tenor < 3 yrs
Impaired loans
90+ days past due
Loan Balance > $5m < $10m
Loan Balance > $10m
Location %
State
16.6%14.7%16.4%Specific Provision Coverage
2.80%3.12%2.91%Impaired Loans
0.43%0.20%0.31%90+ days past due
Mar 11Sep 11Mar 12TrendQld 22%
NSW 34%
Vic 26%
Other 18%
Industrial 16%
Other 6%
Land 9%
Retail 26%
Office 29%
Residential 10%
Tourism & Leisure 4%
(1) Fully Secured represents loans of up to 70% of the Market Value of Security. Partially Secured are over 70%, but not Unsecured. Unsecured is primarily Negative Pledge lending96

97
Commercial Real Estate - UK Banking
(1) Fully secured represents loans of up to 70% of the market value of security. Partially secured are over 70%, but not unsecured. Unsecured is primarily negative pledge lending9797
Region North East South West Total
Location % 28% 29% 16% 27% 100%
Loan Balance < £2m 14% 13% 8% 14% 49%
Loan Balance > £2m < £5m 6% 6% 3% 6% 21%
Loan Balance > £5m 8% 10% 5% 7% 30%
Average loan tenor < 3 yrs 19% 16% 11% 15% 61%
Average loan tenor > 3 < 5 yrs 3% 4% 2% 5% 14%
Average loan tenor > 5 yrs 6% 9% 3% 7% 25%
Average loan size £0.75m £0.84m £1.00m £0.76m £0.81m
Security Level1 Fully Secured 13% 14% 11% 15% 53%
Partially Secured 14% 15% 5% 12% 46%
Unsecured 1% 0% 0% 0% 1%
Trend Mar 12 Sep 11 Mar 11 Sep 10
90+ days past due 1.91% 0.88% 1.42% 1.47%
Impaired Loans 10.46% 9.12% 8.13% 7.69%
Specific Provision Coverage 25.21% 11.2% 9.1% 4.8%
Off ice 16%
T o urism & Leisure 7%
Land 8%
R esident ia l 37%
Industria l 10%
Other 3%
R etail 19%
Total £6.0bn17.8% of Gross Loans & Acceptances
9898
Commercial Real Estate – NZ BankingTotal NZ$6.9bn11.9% of Gross Loans & Acceptances
(1) Fully Secured represents loans of up to 70% of the Market Value of Security. Partially Secured are over 70%, but not Unsecured. Unsecured is primarily Negative Pledge lending
Off ice 36%
T o urism & Leisure 5%
Land 9%
R esident ia l 6%Industria l 17%
Other 6%
R etail 21%
Region Auckland Other Regions Total
Location % 38% 62% 100%
Loan Balance < NZ$5m 10% 26% 36%
Loan Balance > NZ$5m<NZ$10m 5% 9% 14%
Loan Balance > NZ$10m 23% 27% 50%
Loan tenor < 3 yrs 35% 51% 86%
Loan tenor > 3 < 5 yrs 1% 6% 7%
Loan tenor > 5 yrs 2% 5% 7%
Average loan size NZ$m 4.5 2.8 3.3
Security Level1 Fully Secured 23% 44% 67%
Partially Secured 11% 12% 23%
Unsecured 4% 6% 10%
90+ days past due 0.37% 0.19% 0.56%
Impaired Loans 0.16% 1.18% 1.34%
Specific Provision Coverage 24.1% 16.3% 17.2%
Trend Mar 12 Sep 11 Mar 11
90+ days past due 0.56% 0.50% 0.89%
Impaired Loans 1.34% 1.66% 2.03%
Specific Provision Coverage 17.2% 24.6% 21.3%

Additional InformationBusiness BankingPersonal BankingWholesale BankingNAB WealthNZ BankingUK BankingGreat Western BankSpecialised Group AssetsAsia Asset Quality
Capital and FundingEconomic Outlook
Credit RWA movement September 2011 to March 2012
Credit RWA movement
($bn)
100
308.6 300.2
(3.4)
(9.1)
(1.2)
5.3
Sep 11 Net growth Methodologychanges and optimisation
Credit quality FX Mar 12

101
Estimated impacts of Basel III: March 2012
Estimated based on APRA response paper on Basel III capital reforms, released 30 March 2012.* Counterparty credit risk (CCR) is estimated to add an additional $13 billion of risk weighted assets. APRA intends to release its proposed approaches
to the implementation of the Basel III reforms relating to CCR once the Basel Committee has finalised these particular reforms. # Other consists of equity investments (-10bps), 1,250% securitisation risk weighting and other immaterial movements.^ Assumes no change to the treatment of treasury shares.
(%)
9.28
7.58
0.36
8.03
(0.30)(0.04)
(0.15)
(0.25)
(0.07)
0.66
1.04
EL>EP Credit RiskRWAs*
DeferredTax
Assets
Other#Dividend(net of DRP
Participation)
RWAAdjustments
Investmentin WM NTAs
WM NTAs, DTA, EquityInvestments
& Other
Basel IIICore Tier 1
(BIS)^
Basel IIICore Tier 1
(APRAproposals)
Basel III Core Tier 1
(Act)
102102
Group capital ratios
(%)

Life Insurance Liabilities
103103
Balance sheet
Asset funding
103
Shareholders Equity¹
Core Assets
Life Insurance Assets
CFI 65%
TFI 20%
SFI 85%
Liquid Assets
Other Assets
Assets Liabilities & Equity
757 757
496
90
103
68
Term Funding < 12 Months 20
(1) Shareholder equity excludes preference shares and other contributed equity(2) Other liabilities comprises mainly trading derivatives
($bn)
Customer Deposits
Term Funding > 12 Months
Short Term Funding
Life Insurance Liabilities
Other Liabilities²
Short Term Funding of Core Assets
96
67
56
100
56
324
38
Term funding maturity profile
104
Funding profile remains robust
The weighted average remaining maturity of the Group’s term funding index qualifying (includes debt with > 12 months remaining term to maturity, excludes debt with < 12 months) senior and subordinated debt is 3.2 years (3.5 years as at September 2011)
The weighted average remaining maturity of the Group’s senior and subordinated debt is 2.8 years (2.9 years as at September 2011)
The FY12 term funding requirement is largely driven by the need to refinance term debt that has less than 12 months remaining term to maturity during FY12
FY12 Term Refinancing Requirement
Government Guaranteed (Total $11bn)
Non-Government Guaranteed
Term Wholesale Funding Maturity Profile as at March 2012
Sep 12 Mar 13 Sep 13 Mar 14 Sep 14 Mar 15 Sep 15 Mar 16 Sep 16 Mar 17 Sep 17 Mar 18 Sep 18 Beyond
($bn)
20
15
10
5
0
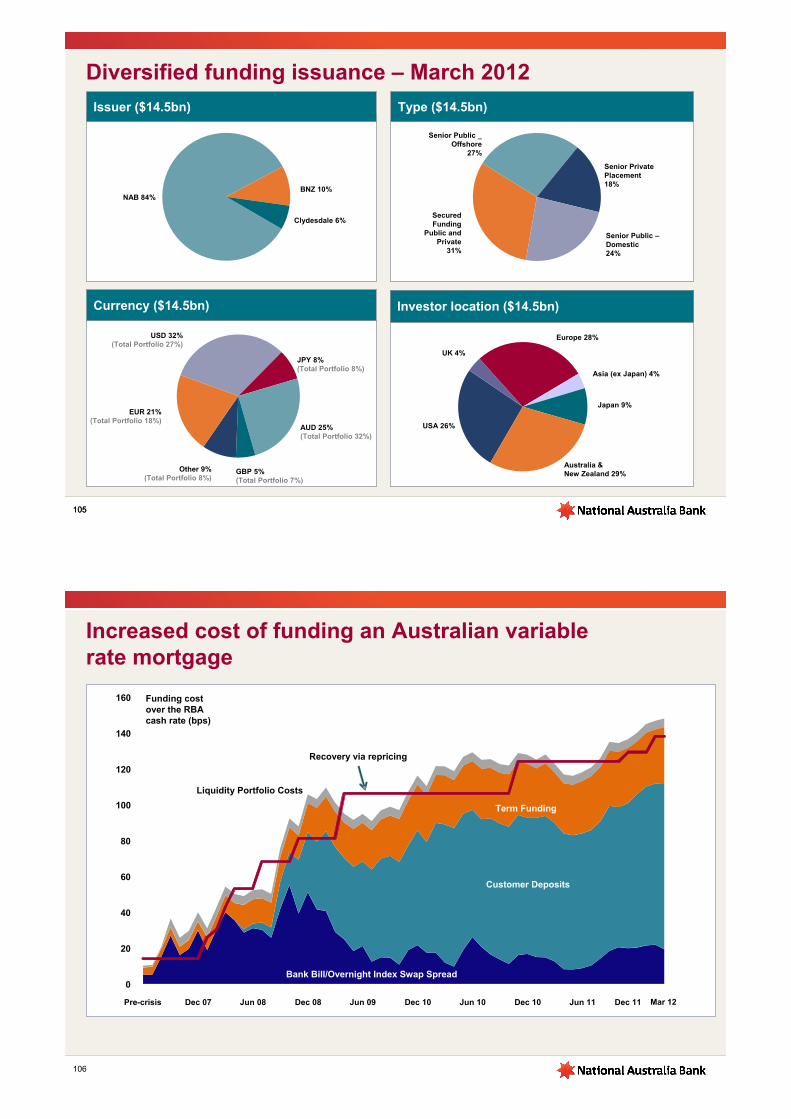
Australia & New Zealand 29%
Japan 9%
Asia (ex Japan) 4%
Europe 28%
UK 4%
USA 26%
105105
Diversified funding issuance – March 2012
Issuer ($14.5bn) Type ($14.5bn)
Investor location ($14.5bn)Currency ($14.5bn)
GBP 5%(Total Portfolio 7%)
USD 32%(Total Portfolio 27%)
JPY 8%(Total Portfolio 8%)
EUR 21%(Total Portfolio 18%)
AUD 25%(Total Portfolio 32%)
Other 9%(Total Portfolio 8%)
BNZ 10%
Clydesdale 6%
NAB 84%
Senior Private Placement18%
Senior Public –Domestic24%
Senior Public _Offshore
27%
SecuredFunding
Public and Private
31%
Mar 12
106
Increased cost of funding an Australian variable rate mortgage
0
20
40
60
80
100
120
140
160
Pre-crisis Dec 07 Jun 08 Dec 08 Jun 09 Dec 10 Jun 10 Dec 10 Jun 11 Dec 11
Term Funding
Customer Deposits
Bank Bill/Overnight Index Swap Spread
Recovery via repricing
Liquidity Portfolio Costs
Funding cost over the RBA cash rate (bps)

UK FSA Capital Comparison – Basel IISummarised below are details of current key differences as pertinent to the Group and identified by the ongoing Australian Bankers’ Association (ABA) study “Comparison of Regulatory Capital Frameworks – APRA and FSA”.1
IncreaseAPRA requires Wealth Net Tangible Assets (NTA) to be deducted 50/50 from Tier 1 and Tier 2 capital. The FSA allows embedded value (including NTA) to be included in Tier 1 capital and deducted from Total capital under transitional rules to 31 December 2012 (when it will revert to a 50/50 deduction from Tier 1 and Tier 2).
Investments in Non-Consolidated Controlled Entities
IncreaseThe scheme continues to be in deficit as at 31 March 2011. Under FSA rules, the bank’s deficit reduction amount may be substituted for a defined benefit liability. No deficit reduction amounts are presently being paid, therefore the liability can be reversed from reserves (net of tax) and no liability is required to be substituted at this time.
UK Defined Benefit Pension Scheme
IncreaseAPRA requires Deferred Tax Assets (DTA) to be deducted from Tier 1 capital, except for any DTA associated with collective provisions which are eligible to be included in the General Reserve for Credit Losses. Under FSA rules, DTA are risk weighted at 100%.
DTA (excluding DTA on the collective provision for doubtful debts)
IncreaseThis amount represents the value of business in force (VBIF) at acquisition of MLC, which is an intangible asset. VBIF is deducted from Tier 1 capital under APRA guidelines, whereas under FSA rules, it is deducted from Total capital.
Wealth Value of Business in Force at acquisition
IncreaseAPRA requires Loss Given Default estimate for loans secured by mortgages to be a minimum of 20% compared to a 10% minimum under FSA rules. This results in lower RWA under FSA rules.
RWA Treatment –Mortgages
IncreaseAPRA rules require the inclusion of IRRBB within Pillar 1 calculations. This is not required by the FSA and results in lower RWA under FSA rules.
Interest Rate Risk in the Banking Book (IRRBB)
IncreaseAPRA requires a deduction from Tier 1 capital for up-front costs associated with a debt issuance. The FSA requires costs associated with debt issuance not used in the capital calculations to follow the accounting treatment.
Capitalised Expenses
DecreaseAPRA requires certain deferred fee income to be included in Tier 1 capital. The FSA does not allow this deferred fee income to be included in Tier 1 capital, which results in lower capital under FSA rules.
Eligible Deferred Fee Income
IncreaseThe FSA requires dividends to be deducted from regulatory capital when declared and/or approved. APRA requires dividends to be deducted on an anticipated basis, which is partially offset by APRA making allowance for expected shares to be issued under a dividend re-investment plan. This difference results in higher capital under FSA rules.
Estimated Final Dividend
Impact on Bank’s Tier 1 capital ratio if FSA rules applied
Details of differences Item
(1) The above comparison is based on public information on the FSA approach to calculating Tier 1. Some items cannot be quantified where the FSA may have entered into bi-lateral agreements on specific items, which are not generally in the public domain
107
0.03%0.03%UK Defined Benefit Pension
0.00%0.27%Investments in non-consolidated controlled entities (net of intangible component)
0.19%0.19%DTA (excluding DTA on the collective provision for doubtful debts)
0.00%0.47%Wealth Value of Business in Force (VBIF) at acquisition2
0.28%0.25%IRRBB (RWA)
1.24%1.10%RWA treatment – Mortgages1
11.52%10.17%31 March 2012 – APRA basis
13.59%
2.07%
0.04%
(0.07%)
0.36%
Total Capital %
12.81%31 March 2012 – Normalised for UK FSA differences
2.64%Total Adjustments
0.04%Capitalised expenses3
(0.07%)Eligible deferred fee income
0.36%Estimated final dividend (net of estimated reinvestment under DRP / BSP)
Tier 1 Capital %
UK FSA Capital Comparison – Basel IIEstimated Impact on NAB’s capital position
The following table illustrates the impact on the Group’s capital position considering these key differences between APRA and UK FSA Basel II guidelines
This reflects only a partial list of the factors requiring adjustment
(1) RWA treatment for mortgages is based on APRA 20% loss given default (LGD) floor compared to FSA LGD floor of 10% aligned to the Basel II Framework(2) This ignores any potential accounting differences between IFRS and UK GAAP(3) Capitalised expenses associated with debt raisings only
108

Basel II Risk Weighted Assets
7,1986,281IRRBB RWAs
38%
79%
63%
43%
21%
43%
RWA/EAD %
47%172,208168,534Corporate & Business
41%308,648300,185Total Credit RWAs
341,069335,553Total RWAs
22,25523,810Operational RWAs
2,9685,277Market RWAs
21%51,62056,351Mortgages
82%8,7008,022Other Assets
61%59,92252,253Standardised1
46%16,19815,025Retail
RWA/EAD %RWAs RWAs
30 September 201131 March 2012Asset Class ($m)
(1) The majority of the Group’s standardised portfolio is the UK Clydesdale PLC banking operations
109
Additional InformationBusiness BankingPersonal BankingWholesale BankingNAB WealthNZ BankingUK BankingGreat Western BankSpecialised Group AssetsAsia Asset QualityCapital and Funding
Economic Outlook
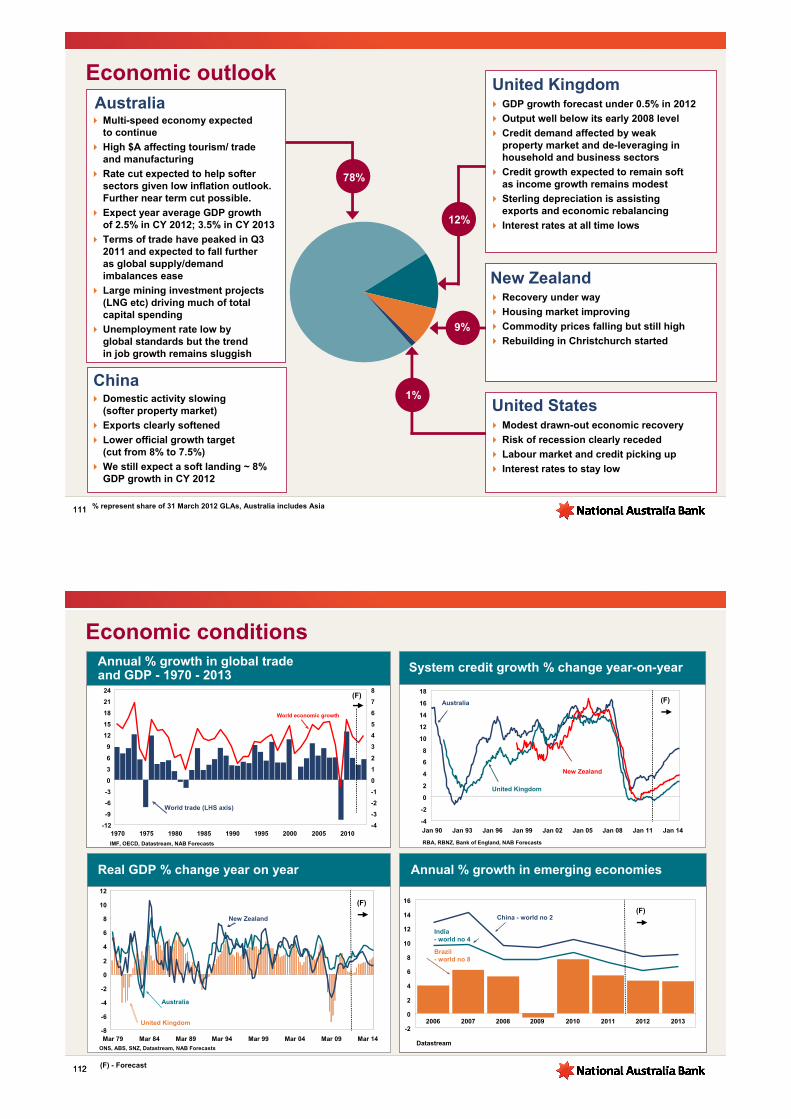
111111
Economic outlook
78%
12%
1%
9%
United Kingdom
New Zealand
United States
% represent share of 31 March 2012 GLAs, Australia includes Asia
AustraliaMulti-speed economy expected to continue
High $A affecting tourism/ trade and manufacturing
Rate cut expected to help softer sectors given low inflation outlook. Further near term cut possible.
Expect year average GDP growth of 2.5% in CY 2012; 3.5% in CY 2013
Terms of trade have peaked in Q3 2011 and expected to fall further as global supply/demand imbalances ease
Large mining investment projects (LNG etc) driving much of total capital spending
Unemployment rate low by global standards but the trend in job growth remains sluggish
ChinaDomestic activity slowing (softer property market)
Exports clearly softened
Lower official growth target (cut from 8% to 7.5%)
We still expect a soft landing ~ 8% GDP growth in CY 2012
GDP growth forecast under 0.5% in 2012
Output well below its early 2008 level
Credit demand affected by weak property market and de-leveraging in household and business sectors
Credit growth expected to remain soft as income growth remains modest
Sterling depreciation is assisting exports and economic rebalancing
Interest rates at all time lows
Recovery under way
Housing market improving
Commodity prices falling but still high
Rebuilding in Christchurch started
Modest drawn-out economic recovery
Risk of recession clearly receded
Labour market and credit picking up
Interest rates to stay low
112112
Economic conditions
(F) - Forecast
Annual % growth in global trade and GDP - 1970 - 2013
Real GDP % change year on year Annual % growth in emerging economies
ONS, ABS, SNZ, Datastream, NAB Forecasts
-12
-9
-6
-3
0
3
6
9
12
15
18
21
24
1970 1975 1980 1985 1990 1995 2000 2005 2010-4
-3
-2
-1
0
1
2
3
4
5
6
7
8
World economic growth
(F)
World trade (LHS axis)
-8
-6
-4
-2
0
2
4
6
8
10
12
Mar 79 Mar 84 Mar 89 Mar 94 Mar 99 Mar 04 Mar 09 Mar 14
Australia
United Kingdom
New Zealand
(F)
IMF, OECD, Datastream, NAB Forecasts
Datastream
-2
0
2
4
6
8
10
12
14
16
2006 2007 2008 2009 2010 2011 2012 2013
China - world no 2
India - world no 4
Brazil - world no 8
(F)
System credit growth % change year-on-year
-4
-2
0
2
4
6
8
10
12
14
16
18
Jan 90 Jan 93 Jan 96 Jan 99 Jan 02 Jan 05 Jan 08 Jan 11 Jan 14
Australia
New Zealand
United Kingdom
(F)
RBA, RBNZ, Bank of England, NAB Forecasts
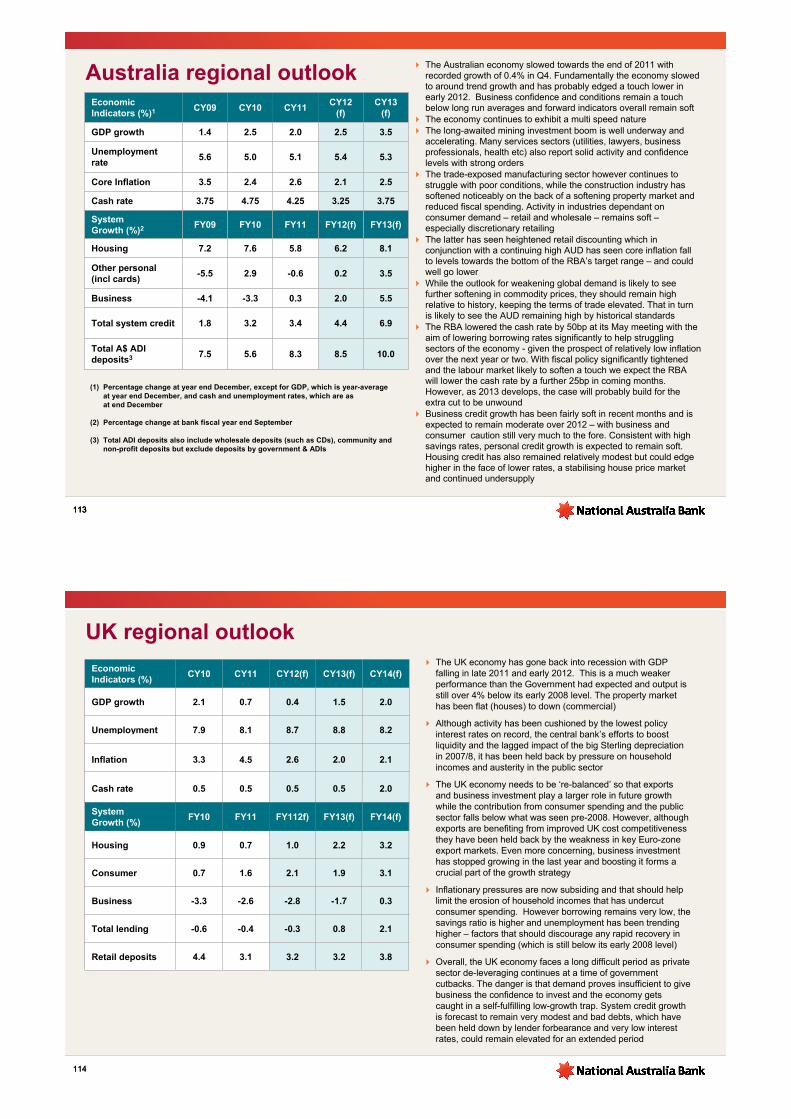
113113113
Australia regional outlook
(1) Percentage change at year end December, except for GDP, which is year-average at year end December, and cash and unemployment rates, which are as at end December
(2) Percentage change at bank fiscal year end September
(3) Total ADI deposits also include wholesale deposits (such as CDs), community andnon-profit deposits but exclude deposits by government & ADIs
The Australian economy slowed towards the end of 2011 with recorded growth of 0.4% in Q4. Fundamentally the economy slowed to around trend growth and has probably edged a touch lower in early 2012. Business confidence and conditions remain a touch below long run averages and forward indicators overall remain soft The economy continues to exhibit a multi speed natureThe long-awaited mining investment boom is well underway and accelerating. Many services sectors (utilities, lawyers, business professionals, health etc) also report solid activity and confidence levels with strong ordersThe trade-exposed manufacturing sector however continues to struggle with poor conditions, while the construction industry has softened noticeably on the back of a softening property market and reduced fiscal spending. Activity in industries dependant on consumer demand – retail and wholesale – remains soft –especially discretionary retailing The latter has seen heightened retail discounting which in conjunction with a continuing high AUD has seen core inflation fall to levels towards the bottom of the RBA’s target range – and could well go lower While the outlook for weakening global demand is likely to see further softening in commodity prices, they should remain high relative to history, keeping the terms of trade elevated. That in turn is likely to see the AUD remaining high by historical standardsThe RBA lowered the cash rate by 50bp at its May meeting with the aim of lowering borrowing rates significantly to help strugglingsectors of the economy - given the prospect of relatively low inflation over the next year or two. With fiscal policy significantly tightened and the labour market likely to soften a touch we expect the RBAwill lower the cash rate by a further 25bp in coming months. However, as 2013 develops, the case will probably build for the extra cut to be unwound Business credit growth has been fairly soft in recent months and is expected to remain moderate over 2012 – with business and consumer caution still very much to the fore. Consistent with high savings rates, personal credit growth is expected to remain soft. Housing credit has also remained relatively modest but could edge higher in the face of lower rates, a stabilising house price market and continued undersupply
Economic Indicators (%)1 CY09 CY10 CY11
CY12 (f)
CY13 (f)
GDP growth 1.4 2.5 2.0 2.5 3.5
Unemployment rate
5.6 5.0 5.1 5.4 5.3
Core Inflation 3.5 2.4 2.6 2.1 2.5
Cash rate 3.75 4.75 4.25 3.25 3.75
System Growth (%)2 FY09 FY10 FY11 FY12(f) FY13(f)
Housing 7.2 7.6 5.8 6.2 8.1
Other personal (incl cards)
-5.5 2.9 -0.6 0.2 3.5
Business -4.1 -3.3 0.3 2.0 5.5
Total system credit 1.8 3.2 3.4 4.4 6.9
Total A$ ADI deposits3 7.5 5.6 8.3 8.5 10.0
114114
UK regional outlookThe UK economy has gone back into recession with GDP falling in late 2011 and early 2012. This is a much weaker performance than the Government had expected and output is still over 4% below its early 2008 level. The property market has been flat (houses) to down (commercial)
Although activity has been cushioned by the lowest policy interest rates on record, the central bank’s efforts to boost liquidity and the lagged impact of the big Sterling depreciationin 2007/8, it has been held back by pressure on household incomes and austerity in the public sector
The UK economy needs to be ‘re-balanced’ so that exports and business investment play a larger role in future growth while the contribution from consumer spending and the public sector falls below what was seen pre-2008. However, although exports are benefiting from improved UK cost competitiveness they have been held back by the weakness in key Euro-zone export markets. Even more concerning, business investment has stopped growing in the last year and boosting it forms a crucial part of the growth strategy
Inflationary pressures are now subsiding and that should help limit the erosion of household incomes that has undercut consumer spending. However borrowing remains very low, the savings ratio is higher and unemployment has been trending higher – factors that should discourage any rapid recovery in consumer spending (which is still below its early 2008 level)
Overall, the UK economy faces a long difficult period as privatesector de-leveraging continues at a time of government cutbacks. The danger is that demand proves insufficient to give business the confidence to invest and the economy gets caught in a self-fulfilling low-growth trap. System credit growth is forecast to remain very modest and bad debts, which have been held down by lender forbearance and very low interest rates, could remain elevated for an extended period
Economic Indicators (%)
CY10 CY11 CY12(f) CY13(f) CY14(f)
GDP growth 2.1 0.7 0.4 1.5 2.0
Unemployment 7.9 8.1 8.7 8.8 8.2
Inflation 3.3 4.5 2.6 2.0 2.1
Cash rate 0.5 0.5 0.5 0.5 2.0
Housing 0.9 0.7 1.0 2.2 3.2
Consumer 0.7 1.6 2.1 1.9 3.1
Business -3.3 -2.6 -2.8 -1.7 0.3
Total lending -0.6 -0.4 -0.3 0.8 2.1
Retail deposits 4.4 3.1 3.2 3.2 3.8
System Growth (%)
FY10 FY11 FY112f) FY13(f) FY14(f)

115115
NZ regional outlookThe latest business surveys are consistent with the moderate recovery we are forecasting for New Zealand. Although the rebuilding in Christchurch will drive a lot of construction through the next year, there is still quite a broad-based upturn in demand
This upturn follows years of restrained retail spending and a sluggish housing market. House prices have plateaued since 2007 but have more recently begun to edge up. Households have lifted their savings effort, building up their bank deposits. This process suppressed consumer spending for a long time but retail sales growth improved in the latter half of 2011 and the surveys show that continuing
The household sector has been gradually strengthening its balance sheet through very low borrowing, restrained spending and improved saving. Debt to income ratios are falling, liquid assets are building up. While it continues, this slow process should hold down economic growth but lay the foundations for a more sustainable economy later on
Activity has been boosted by very high commodity export prices which have taken the terms of trade to levels not seen since the early 1970s boom. Commodity prices are now falling and the terms of trade are off their mid-2011 peak, but prices are still high by historical standards, supporting farm incomes
We expect only a modest recovery in system credit growth as de-leveraging continues. Asset quality has deteriorated through the long period of sluggish economic performance but the system impaired loan ratio remains very low (around 1.4% at end 2011)
Economic Indicators (%)
CY10 CY11 CY12(f) CY13(f) CY14(f)
GDP growth 1.2 1.4 2.1 2.9 1.4
Unemployment 6.7 6.4 6.2 5.6 5.4
Inflation 4.0 1.8 2.3 2.6 3.2
Cash rate (end period)
3.0 2.5 2.75 3.75 4.25
System Growth (%)
FY10 FY11 FY12(f) FY13(f) FY14(f)
Housing 3.1 1.6 1.4 2.4 3.4
Personal -3.3 -1.0 0 1.5 2.8
Business -3.0 -0.8 1.3 2.5 3.3
Total lending 0.4 0.5 1.3 2.4 3.3
Household retail deposits
2.8 7.2 8.3 7.5 6.9
Australian housing prices and debt
House prices have fallen from their peak in mid-2010, though remain at relatively high levels
House price growth was most marked from mid 1990s to 2004, and also accelerated sharply through 2009 and the first half of 2010
Expectations are now for a stabilisation of prices in coming months followed by only marginal appreciation into the medium term
Housing affordability and the debt service burden have improved in the face of lower mortgage rates (with recent cuts to help further) and household deleveraging. That said, the debt burden remains at historically high levels
Note: Income is disposable income after tax and before interest payments Household sector excludes unincorporated enterprises116
Housing affordability
Household debt-to-income ratio
Real dwelling prices 1993 = 100
50
100
150
200
1986 1990 1994 1998 2002 2006 2010
50
100
150
200
Capital cities
Index
Source: ABS, deflated by private household consumption deflator
Index
0
10
20
30
40
50
1986 1990 1994 1998 2002 2006 20100
10
20
30
40
50
Australia
Index
Source: REIA
Index
Index
0
30
60
90
120
150
1986 1990 1994 1998 2002 2006 20100
10
20
30
40
50
Total (LHS)
Sources: ABS; NAB; RBA
%
Housing (LHS)
Household debt to housing assets (RHS)

Solid population growth combined with an insufficient expansion in Australia’s dwelling stock has led to a broad-based undersupply of housing in most locations
The latest NAB Australian Property Survey indicates that overall demand for existing property improved slightly in the March quarter. Resident owner occupiers continue to dominate the market for existing properties – with investors shying away in the more difficult economic climate – although there was a small decrease in first home buyer activity in the first quarter of 2012. Access to credit, employment security and interest rate uncertainty continue to be the biggest impediments to demand side housing credit growth
Around 80% of Australian mortgages are at variable rates, making the most common mortgage rate very sensitive to changes in monetary policy
117
Ratio of Dwellings to Resident Population State average = 100
Most common mortgage interest rates
96
98
100
102
1996 2002 2009 2000 2006
96
98
100
102
Sources: ABS; NAB
Index Index
Queensland
New South Wales
Victoria
Western Australia
South Australia
Tasmania
2001 2005 2009
Australian standard variable rate
0
2
4
6
8
%
Sources: RBA; US Federal Reserve
0
2
4
6
8
%
US 30-year fixed interest rate
Characteristics of the Australian Mortgage Market