supplemental earnings information - zayo...
TRANSCRIPT

SUPPLEMENTAL EARNINGS
INFORMATION
Fiscal Year 2018 Q2
NYSE: ZAYO
@ZayoGroup

22
Information contained in this supplemental presentation that is not historical by nature constitutes “forward-looking statements” which can be identified by the use of forward-looking terminology such as “believes,” “expects,” “plans,” “intends,” “estimates,” “projects,” “could,” “may,” “will,” “should,” or “anticipates” or the negatives thereof, other variations thereon or comparable terminology, or by discussions of strategy. No assurance can be given that future results expressed or implied by the forward-looking statements will be achieved and actual results may differ materially from those contemplated by the forward-looking statements. Such statements are based on management’s current expectations and beliefs and are subject to a number of risks and uncertainties that could cause actual results to differ materially from those expressed or implied by the forward-looking statements. These risks and uncertainties include, but are not limited to, those relating to Zayo Group Holdings, Inc.’s (“the Company” or “ZGH”) financial and operating prospects, current economic trends, future opportunities, ability to retain existing customers and attract new ones, outlook of customers, and strength of competition and pricing. In addition, there is risk and uncertainty in the Company’s acquisition strategy including our ability to integrate acquired companies and assets. Specifically there is a risk associated with our recent acquisitions, and the benefits thereof, including financial and operating results and synergy benefits that may be realized from these acquisitions and the timeframe for realizing these benefits. Other factors and risks that may affect our business and future financial results are detailed in the “Risk Factors” section of our annual report on Form 10-K and most recent Form 10-Q filed with the Securities and Exchange Commission. We caution you not to place undue reliance on these forward-looking statements, which speak only as of their respective dates. We undertake no obligation to publicly update or revise forward-looking statements to reflect events or circumstances after releasing this supplemental information or to reflect the occurrence of unanticipated events, except as required by law.
Forward-Looking Statements
Acquisitions have been, and are expected to continue to be, a component of the Company’s strategy. In this Supplemental Earnings Information under “Foreign Exchange Impact & Exposure,” the Company sets forth its pro-forma annualized revenue growth rate and pro-forma annualized Adjusted EBITDA growth rates for the current fiscal quarter. The adjustments reflected in our pro-forma amounts have not been prepared with a view towards complying with Article 11 of Regulation S-X. These pro-forma measures are intended to provide additional information regarding such rates of growth on a more comparable basis than would be provided without such pro-forma adjustments and are not presented as a measure of our pro-forma financial performance.
Presentation of Certain Consolidated Pro-forma Financial Data
Non-GAAP Financial MeasuresThe Company provides financial measures that are not defined under generally accepted accounting principles in the United States, or GAAP, including Adjusted EBITDA, Adjusted EBITDA Margin, unlevered free cash flow, adjusted unlevered free cash flow, levered free cash flow, adjusted funds from operations, and net adjusted funds from operations.
Adjusted EBITDA, as defined below and in our Segment Reporting note to our consolidated financial statements and notes thereto, is the primary measure used by our Chief Operating decision maker to evaluate segment operating performance. Adjusted EBITDA is defined as earnings/(loss) from operations before interest, income taxes, depreciation, and amortization (“EBITDA”) adjusted to exclude acquisition or disposal-related transaction costs, losses on extinguishment of debt, stock-based compensation, unrealized foreign currency gains/ (losses) on intercompany loans, and non-cash income/(loss) on equity and cost method investments. Adjusted EBITDA Margin is defined as Adjusted EBITDA divided by revenue. Unlevered free cash flow is defined as Adjusted EBITDA less purchases of property and equipment, net of stimulus grants. Adjusted unlevered free cash flow is defined as Adjusted EBITDA less purchases of property and equipment, net of stimulus grants, plus additions to deferred revenue, less non-cash monthly amortized revenue. Levered free cash flow is defined as net cash provided by operating activities less purchases of property and equipment, net of stimulus grants. Adjusted funds from operations (“AFFO”) is defined as earnings/(loss) from operations before depreciation and amortization, unrealized foreign currency gains/(losses) on intercompany loans, stock-based compensation, acquisition or disposal-related transaction costs, losses on extinguishment of debt, non-cash income/(loss) on equity and cost investments, non-cash monthly amortized revenue, less cash payments related to maintenance capital expenditures. Net AFFO is defined as AFFO plus upfront customer payments from less than twelve month payback on net new sales less cash payments related to capital expenditures for (i) less than twelve month payback on net new sales and (ii) network capacity. These measures are not measurements of our financial performance under GAAP and should not be considered in isolation or as alternatives to net income, net cash flows provided by operating activities, total net cash flows or any other performance measures derived in accordance with GAAP or as alternatives to net cash flows from operating activities or total net cash flows as measures of our liquidity.
We use Adjusted EBITDA to evaluate our operating performance. In addition to Adjusted EBITDA, management uses unlevered free cash flow, which measures the ability of Adjusted EBITDA to covercapital expenditures. Adjusted EBITDA is a performance rather than cash flow measure. Correlating our capital expenditures to our Adjusted EBITDA does not imply that we will be able to fund such capital expenditures solely with cash from operations. These metrics are among the primary measures used by management for planning and forecasting future periods. We believe the presentation of Adjusted EBITDA is relevant and useful for investors because it allows investors to view results in a manner similar to the method used by management and make it easier to compare our results with the results of other companies that have different financing and capital structures. We believe that the presentation of levered free cash flow is relevant and useful to investors because it provides a measure of cash available to pay the principal on our debt and pursue acquisitions of businesses or other strategic investments or uses of capital. We believe the presentation of AFFO and Net AFFO is useful to investors by providing measures presented by certain datacenter and cellular tower REITs (and some non-REITs) with which we are sometimes compared.

33
Non-GAAP Financial Measures (continued)We also monitor Adjusted EBITDA because our subsidiaries have debt covenants that restrict their borrowing capacity that are based on a leverage ratio, which utilizes a modified EBITDA, as defined in our credit agreement and the indentures governing our notes. The modified EBITDA is consistent with our definition of Adjusted EBITDA; however, it includes the pro forma Adjusted EBITDA of and expected cost synergies from the companies acquired by us during the quarter for which the debt compliance certification is due. Adjusted EBITDA results, along with the quantitative and qualitative information, are also utilized by management and our Compensation Committee, as an input for determining incentive payments to employees.
Adjusted EBITDA has limitations as an analytical tool and should not be considered in isolation from, or as a substitute for, analysis of our results of operations and operating cash flows as reported under GAAP. For example, Adjusted EBITDA:
does not reflect capital expenditures, or future requirements for capital and major maintenance expenditures or contractual commitments; does not reflect changes in, or cash requirements for, our working capital needs; does not reflect the interest expense, or the cash requirements necessary to service the interest payments, on our debt; and does not reflect cash required to pay income taxes.
Unlevered free cash flow and adjusted unlevered free cash flow have limitations as analytical tools and should not be considered in isolation from, or as a substitute for, analysis of our results as reported under GAAP. For example, unlevered free cash flow:
does not reflect changes in, or cash requirements for, our working capital needs; does not reflect the interest expense, or the cash requirements necessary to service the interest payments, on our debt; and does not reflect cash required to pay income taxes.
Levered free cash flow, AFFO, and Net AFFO have limitations as an analytical tool and should not be considered in isolation from, or as a substitute for, analysis of our results as reported under GAAP. For example, levered free cash flow, AFFO, and Net AFFO:
does not reflect principal payments on debt; does not reflect principal payments on capital lease obligations; does not reflect dividend payments, if any; and does not reflect the cost of acquisitions.
Our computation of Adjusted EBITDA, unlevered free cash flow, adjusted unlevered free cash flow, levered free cash flow, AFFO, and Net AFFO may not be comparable to other similarly titled measures computed by other companies because all companies do not calculate these measures in the same fashion.
Because we have acquired numerous entities since our inception and incurred transaction costs in connection with each acquisition, borrowed money in order to finance our operations and acquisitions, and used capital and intangible assets in our business, and because the payment of income taxes is necessary if we generate taxable income after the utilization of our net operating loss carryforwards, any measure that excludes these items has material limitations. As a result of these limitations, these measures should not be considered as a measure of discretionary cash available to us to invest in the growth of our business or as a measure of our liquidity. See “Historical Financial data & Reconciliation” for a quantitative reconciliation of Adjusted EBITDA, AFFO, and Net AFFO to net income/(loss) and for a quantitative reconciliation of unlevered free cash flow, adjusted unlevered free cash flow and levered free cash flow to net cash provided by operating activities.
Annualized revenue and annualized Adjusted EBITDA are derived by multiplying the total revenue and Adjusted EBITDA, respectively, for the most recent quarterly period by four. Our computations of annualized revenue and annualized Adjusted EBITDA may not be representative of our actual annual results.
Measures referred to as being calculated on a constant currency basis are intended to present the relevant information assuming a constant exchange rate between the two periods being compared. Such metrics are calculated by applying the currency exchange rates used in the preparation of the prior period financial results to the subsequent period results.
Tables reconciling such non-GAAP measures are included in the Historical Financial Data & Reconciliations section of this presentation. A glossary of terms used throughout is available under the investor section of the Company’s website at http://www.zayo.com/investors/.
Other NotesComponents may not sum due to rounding. Metrics throughout this supplemental earnings information presentation exclude Allstream unless specifically labeled.

FINANCIAL AND
OPERATIONAL HIGHLIGHTS

Zayo at a Glance
10,881,093 fiber miles
126,990 route miles
3,611 employees
277 QBHC1
Customers 1
8.9k customers
55% of rev from enterprise & content
45% of rev from carriers & wireless
Products1
38% Fiber Solutions
11% Colocation
22% Transport
28% Enterprise Networks
International Network Unique Metro Fiber Datacenters
Leading Fiber &
Data Center Consolidator
41 acquisitions5
Growth
5
Ou
r assets
Wh
at
we d
oTra
ck
reco
rd
50 zColo data centers
915k billable sf
People
Financial2
$
1 Excludes Allstream segment; QBHC figure also includes Business Development employees in Fiber Solutions and Colocation segments as well as Inside Sales2 Dec17q annualized3 every quarter since becoming a public filer inclusive of Zayo Group, LLC operating subsidiary. excludes Allstream4 based on average closing price for month of Dec17q5 As of December 31st, 2017
32,793 buildings
141 avg metro fiber count
~$2.6B revenue
~$1.3B adjusted EBITDA
Value Creation
33 consecutive quarters of
sequential revenue growth3
$1.1B invested equity since
2007 inception
$8.9B equity value4
>8x return

6
$125.8 $127.8 $129.4 $131.3 $164.3 $167.7 $170.4 $171.8
$0
$100
$200
$300
$400
$500
$600
Mar16q Jun16q Sep16q Dec16q Mar17q Jun17q Sep17q Dec17q
$347.0 $354.6 $357.3 $360.7 $430.7 $464.4
$474.5 $476.1
$6.5 $6.6 $6.4 $6.0
$7.0 $6.4
$6.1 $6.1
$23.8 $24.6 $25.9 $26.5
$29.6 $31.7 $32.4 $33.3
$4.5 $4.4 $3.0 $5.6
$3.7
$6.6 $2.7 $14.5
$381.9 $390.1 $392.7 $398.8
$470.9
$509.1 $515.8 $530.0
$0
$100
$200
$300
$400
$500
$600
Mar16q Jun16q Sep16q Dec16q Mar17q Jun17q Sep17q Dec17q
MRR Usage MAR Other Revenue
Stratification of Revenue
$23.8 $24.6 $25.9 $26.5 $29.6 $31.7 $32.4 $33.3
$0
$10
$20
$30
$40
$50
$60
Mar16q Jun16q Sep16q Dec16q Mar17q Jun17q Sep17q Dec17q
MAR
$52.6
$35.9
$51.4 $49.8
$36.8$41.4 $40.9 $40.4
$0
$10
$20
$30
$40
$50
$60
Mar16q Jun16q Sep16q Dec16q Mar17q Jun17q Sep17q Dec17q
IRU and Upfront Charges
$4.5 $4.4 $3.0 $5.6 $3.7 $6.6 $2.7 $14.5 $0
$10
$20
$30
$40
$50
$60
Mar16q Jun16q Sep16q Dec16q Mar17q Jun17q Sep17q Dec17q
Other Revenue
millions
millionsmillions millions
MRR and MAR on the Last Day of the
Quarter1millions
Revenue Stratification
1 The change in MRR and MAR on the last day of the quarter is equal to the net installations in the period plus or minus any effects of fluctuations in foreign exchange rates
2 Sep17q restated due to impacts from exchange rate changes not reflected in previous amounts
EXCLUDES ALLSTREAM
2
7
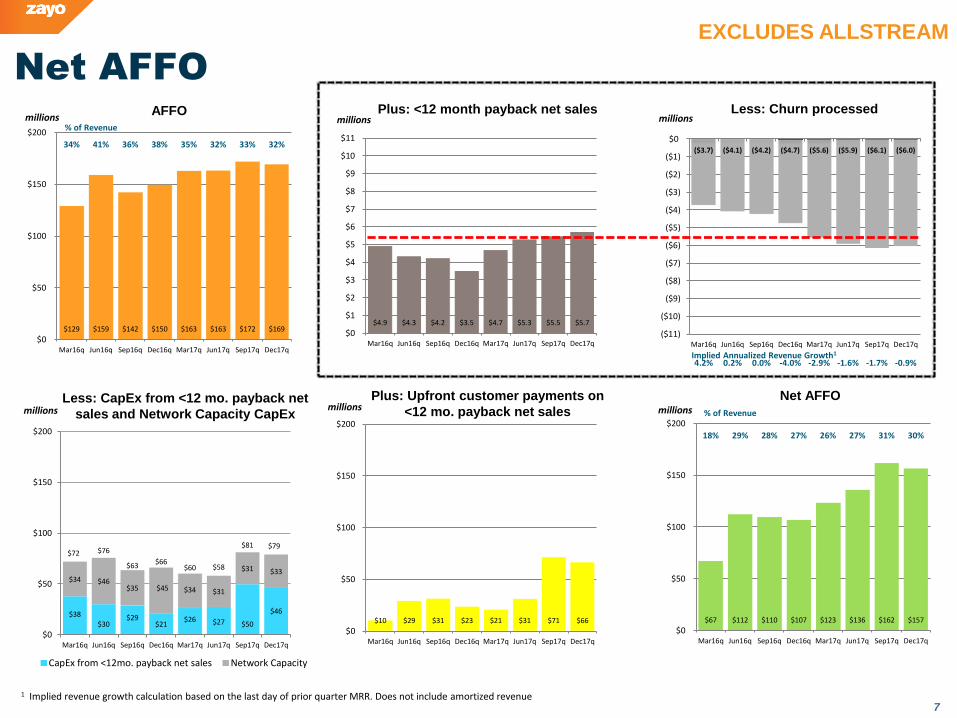
Net AFFO
$4.9 $4.3 $4.2 $3.5 $4.7 $5.3 $5.5 $5.7
$0
$1
$2
$3
$4
$5
$6
$7
$8
$9
$10
$11
Mar16q Jun16q Sep16q Dec16q Mar17q Jun17q Sep17q Dec17q
millionsPlus: <12 month payback net sales
millions
($3.7) ($4.1) ($4.2) ($4.7) ($5.6) ($5.9) ($6.1) ($6.0)
4.2% 0.2% 0.0% -4.0% -2.9% -1.6% -1.7% -0.9%
($11)
($10)
($9)
($8)
($7)
($6)
($5)
($4)
($3)
($2)
($1)
$0
Mar16q Jun16q Sep16q Dec16q Mar17q Jun17q Sep17q Dec17q
millionsLess: Churn processed
$10 $29 $31 $23 $21 $31 $71 $66
$0
$50
$100
$150
$200
Mar16q Jun16q Sep16q Dec16q Mar17q Jun17q Sep17q Dec17q
millionsPlus: Upfront customer payments on
<12 mo. payback net salesmillions millionsNet AFFO
$67 $112 $110 $107 $123 $136 $162 $157
18% 29% 28% 27% 26% 27% 31% 30%
$0
$50
$100
$150
$200
Mar16q Jun16q Sep16q Dec16q Mar17q Jun17q Sep17q Dec17q
% of Revenue
$38$30
$29$21
$26 $27 $50
$46
$34 $46$35 $45 $34 $31
$31 $33
$72 $76
$63 $66$60 $58
$81 $79
$0
$50
$100
$150
$200
Mar16q Jun16q Sep16q Dec16q Mar17q Jun17q Sep17q Dec17q
CapEx from <12mo. payback net sales Network Capacity
Less: CapEx from <12 mo. payback net
sales and Network Capacity CapEx
$129 $159 $142 $150 $163 $163 $172 $169
34% 41% 36% 38% 35% 32% 33% 32%
$0
$50
$100
$150
$200
Mar16q Jun16q Sep16q Dec16q Mar17q Jun17q Sep17q Dec17q
AFFO% of Revenue
1 Implied revenue growth calculation based on the last day of prior quarter MRR. Does not include amortized revenue
Implied Annualized Revenue Growth1
EXCLUDES ALLSTREAM

8
Service Activation
Service Activation
Service Activation Pipelinemillions
$15.6 $15.5 $16.2 $14.6$16.4 $16.8 $17.1 $17.5
109 102 105 96 99 98 100 99
$0
$4
$8
$12
$16
$20
Mar16q Jun16q Sep16q Dec16q Mar17q Jun17q Sep17q Dec17q
Implied Avg days to Install =M
RR
an
d M
AR
EXCLUDES ALLSTREAM
9
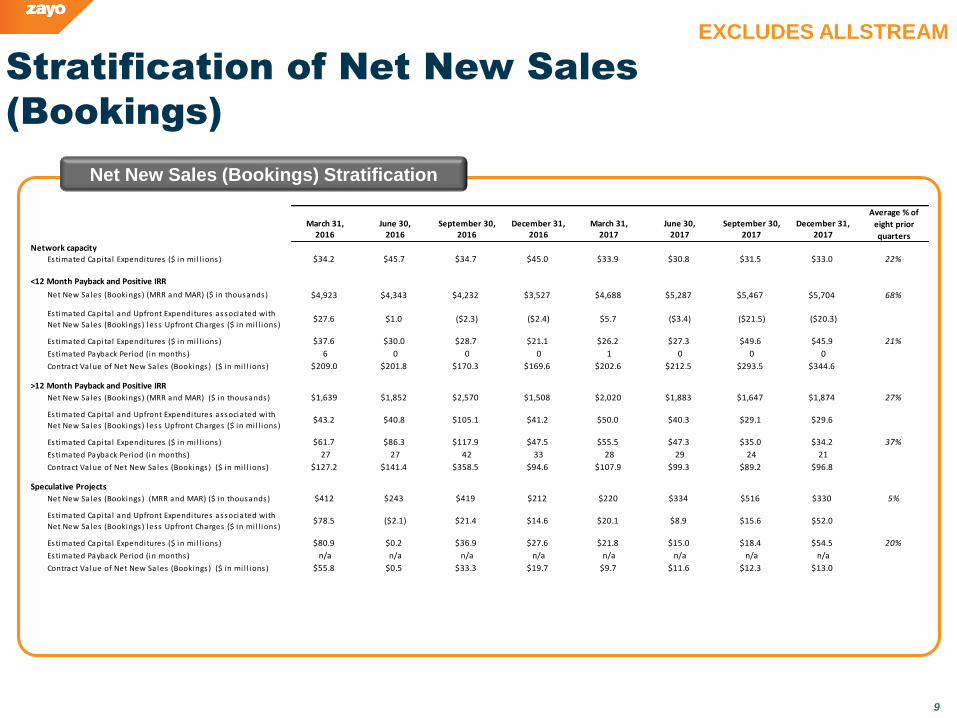
Stratification of Net New Sales
(Bookings)
Net New Sales (Bookings) Stratification
EXCLUDES ALLSTREAM
March 31, June 30, September 30, December 31, March 31, June 30, September 30, December 31,2016 2016 2016 2016 2017 2017 2017 2017
Network capacityEstimated Capita l Expenditures ($ in mi l l ions) $34.2 $45.7 $34.7 $45.0 $33.9 $30.8 $31.5 $33.0 22%
<12 Month Payback and Positive IRR
Net New Sales (Bookings) (MRR and MAR) ($ in thousands) $4,923 $4,343 $4,232 $3,527 $4,688 $5,287 $5,467 $5,704 68%
Estimated Capita l and Upfront Expenditures associated with
Net New Sales (Bookings) less Upfront Charges ($ in mi l l ions)$27.6 $1.0 ($2.3) ($2.4) $5.7 ($3.4) ($21.5) ($20.3)
Estimated Capita l Expenditures ($ in mi l l ions) $37.6 $30.0 $28.7 $21.1 $26.2 $27.3 $49.6 $45.9 21%
Estimated Payback Period (in months) 6 0 0 0 1 0 0 0
Contract Value of Net New Sales (Bookings) ($ in mi l l ions) $209.0 $201.8 $170.3 $169.6 $202.6 $212.5 $293.5 $344.6
>12 Month Payback and Positive IRR
Net New Sales (Bookings) (MRR and MAR) ($ in thousands) $1,639 $1,852 $2,570 $1,508 $2,020 $1,883 $1,647 $1,874 27%
Estimated Capita l and Upfront Expenditures associated with
Net New Sales (Bookings) less Upfront Charges ($ in mi l l ions)$43.2 $40.8 $105.1 $41.2 $50.0 $40.3 $29.1 $29.6
Estimated Capita l Expenditures ($ in mi l l ions) $61.7 $86.3 $117.9 $47.5 $55.5 $47.3 $35.0 $34.2 37%
Estimated Payback Period (in months) 27 27 42 33 28 29 24 21
Contract Value of Net New Sales (Bookings) ($ in mi l l ions) $127.2 $141.4 $358.5 $94.6 $107.9 $99.3 $89.2 $96.8
Speculative Projects
Net New Sales (Bookings) (MRR and MAR) ($ in thousands) $412 $243 $419 $212 $220 $334 $516 $330 5%
Estimated Capita l and Upfront Expenditures associated with
Net New Sales (Bookings) less Upfront Charges ($ in mi l l ions)$78.5 ($2.1) $21.4 $14.6 $20.1 $8.9 $15.6 $52.0
Estimated Capita l Expenditures ($ in mi l l ions) $80.9 $0.2 $36.9 $27.6 $21.8 $15.0 $18.4 $54.5 20%
Estimated Payback Period (in months) n/a n/a n/a n/a n/a n/a n/a n/a
Contract Value of Net New Sales (Bookings) ($ in mi l l ions) $55.8 $0.5 $33.3 $19.7 $9.7 $11.6 $12.3 $13.0
Average % of
eight prior
quarters
1010
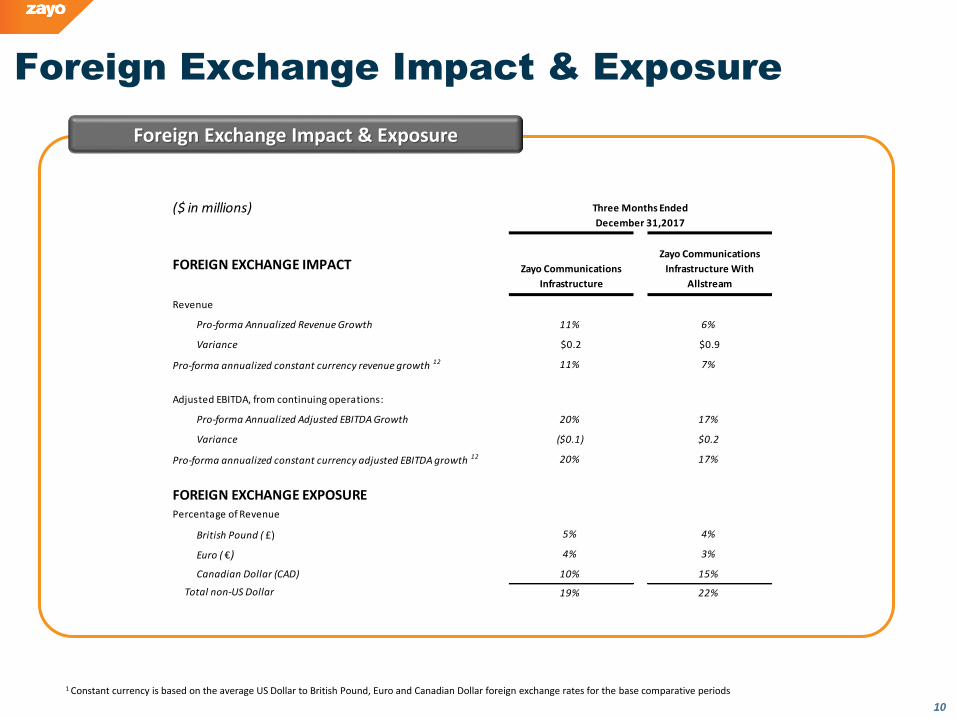
Foreign Exchange Impact & Exposure
Foreign Exchange Impact & Exposure
1 Constant currency is based on the average US Dollar to British Pound, Euro and Canadian Dollar foreign exchange rates for the base comparative periods
($ in millions)
FOREIGN EXCHANGE IMPACT Zayo Communications
Infrastructure
Zayo Communications
Infrastructure With
Allstream
Revenue
Pro-forma Annualized Revenue Growth 11% 6%
Variance $0.2 $0.9
Pro-forma annualized constant currency revenue growth 12 11% 7%
Adjusted EBITDA, from continuing operations:
Pro-forma Annualized Adjusted EBITDA Growth 20% 17%
Variance ($0.1) $0.2
Pro-forma annualized constant currency adjusted EBITDA growth 12 20% 17%
FOREIGN EXCHANGE EXPOSUREPercentage of Revenue
British Pound ( £) 5% 4%
Euro ( €) 4% 3%
Canadian Dollar (CAD) 10% 15%
Total non-US Dollar 19% 22%
Three Months Ended
December 31,2017

INORGANIC ACTIVITY

12
9.1x Pre-Synergy and 6.5x Post Synergy
ZGH Acquisition History
(in millions unless noted)
# of Transactions Close Date Purchase PriceEstimated
Revenue LQA1
Estimated Adjusted
EBITDA LQA1
Pre-Synergy
Multiple
Planned
Synergies
Post Synergy
Multiple
2007 - 2009 13 $329.5 $177.9 $35.0 9.4x $24.7 5.5x
2010 - 2012 11 3,025.5 723.9 331.1 9.1x 108.9 6.9x
2013 - 2015 12 1,387.4 269.1 96.6 14.4x 40.0 10.2x
2016 - December 31st, 2017 5 1,782.8 1,018.5 257.3 6.9x 103.9 4.9x
Allstream Jan-16 320.1 450.0 72.1 4.4x 60.0 2.4x
Clearview Apr-16 18.9 9.0 2.8 6.7x 1.3 4.6x
Santa Clara Data Center Oct-16 12.8 5.8 1.2 11.1x 0.0 11.1x
Electric Lightwave Mar-17 1,419.0 538.0 180.0 7.9x 40.0 6.5x
Kio Networks' San Diego Data Center May-17 12.0 15.7 1.3 9.2x 2.6 3.1x
$6,525.2 $2,189.4 $720.0 9.1x $277.4 6.5xSum/Weighted Avg
2 2
1 Revenue and Adjusted EBITDA (adjusted for estimated purchase accounting adjustments) recognized by the acquired entity during the last quarterly period immediately preceding the respective acquisition date multiplied by 4
2 Allstream reflects CAD-USD FX rate of 0.73

SEGMENT – LEVEL RESULTS

14
$2,165
$2,446 $2,559
0
500
1000
1500
2000
2500
3000
3500
4000
4500
Sep16q Dec16q Mar17q Jun17q Sep17q Dec17q
$150.9 $151.8 $155.4 $162.1 $165.5 $168.3
$0.1 $0.2 $0.2 $0.2 $0.1 $0.2 $21.2 $21.9
$23.4 $25.4 $26.2 $27.0 $1.8 $3.6 $0.7 $3.1 $3.6 $5.1
$174.1 $177.5 $179.6 $190.9
$195.5 $200.5
$0
$25
$50
$75
$100
$125
$150
$175
$200
$225
Sep16q Dec16q Mar17q Jun17q Sep17q Dec17q
MRR Usage MAR Other Revenue
millions
Revenue Stratification
$15
($16)
$34
-$25
$0
$25
$50
$75
$100
$125
$150
$175
$200
Sep16q Dec16q Mar17q Jun17q Sep17q Dec-17
Estimated Capital and Upfront
Expenditures associated with Net
New Sales (Bookings) less Upfront
Chargesmillions
Zayo Fiber Solutions revenue stratification & operational data
thousands
($1,102) ($1,168) ($1,084)
-0.6% -0.6% -0.6%-4500
-4000
-3500
-3000
-2500
-2000
-1500
-1000
-500
0
Sep16q Dec16q Mar17q Jun17q Sep17q Dec17q
Churn ProcessedGross Installations
MR
R a
nd
MA
R
MR
R a
nd
MA
R
thousands
$1,063 $1,278
$1,475
7% 8% 9%
0
500
1000
1500
2000
2500
3000
3500
4000
4500
Sep16q Dec16q Mar17q Jun17q Sep17q Dec17q
Implied Recurring Revenue Growth1=
Net Installationsthousands
MR
R a
nd
MA
RChurn % =
$1,791 $2,077 $2,371
$547 $473
$539 $2,339
$2,551 $2,910
$166M $258M $299M
$0
$500
$1,000
$1,500
$2,000
$2,500
$3,000
$3,500
$4,000
$4,500
Sep16q Dec16q Mar17q Jun17q Sep17q Dec17q
Net Sales - MRR
Net Sales - MAR
Contract Value =
Net New Sales (Bookings)
thousands
MR
R a
nd
MA
R
Segment Information
1 Calculated as Net Installs annualized, divided by beginning quarter MRR+MAR run-rate
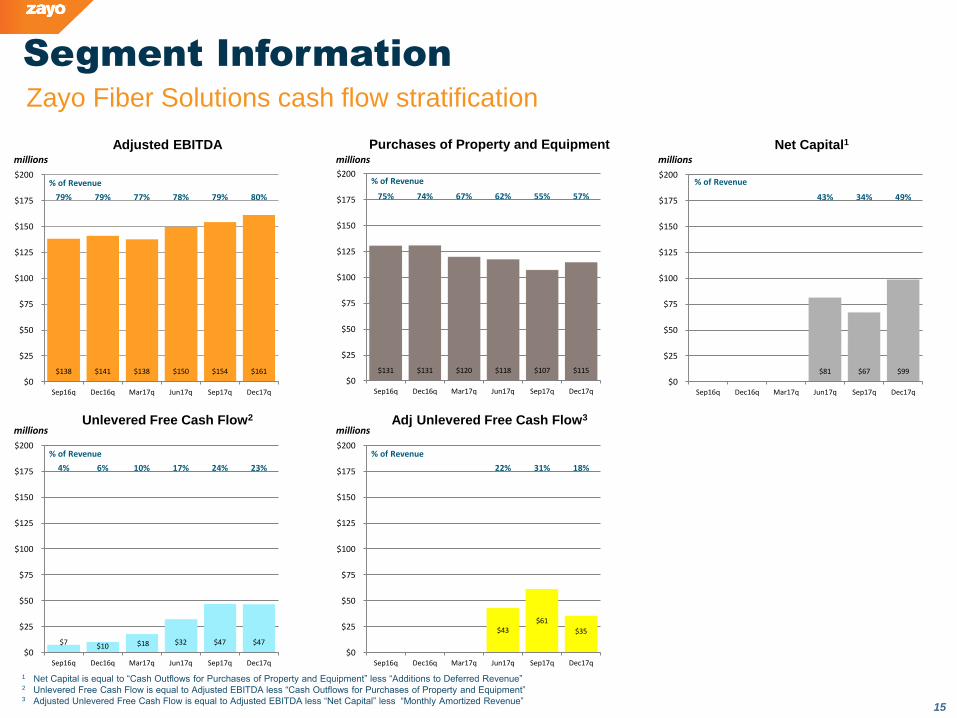
15
$131 $131 $120 $118 $107 $115
75% 74% 67% 62% 55% 57%
$0
$25
$50
$75
$100
$125
$150
$175
$200
Sep16q Dec16q Mar17q Jun17q Sep17q Dec17q
% of Revenue
millions
Purchases of Property and Equipment
$138 $141 $138 $150 $154 $161
79% 79% 77% 78% 79% 80%
$0
$25
$50
$75
$100
$125
$150
$175
$200
Sep16q Dec16q Mar17q Jun17q Sep17q Dec17q
% of Revenue
millions
Adjusted EBITDA
$81 $67 $99
43% 34% 49%
$0
$25
$50
$75
$100
$125
$150
$175
$200
Sep16q Dec16q Mar17q Jun17q Sep17q Dec17q
% of Revenue
millions
Net Capital1
$43 $61
$35
22% 31% 18%
$0
$25
$50
$75
$100
$125
$150
$175
$200
Sep16q Dec16q Mar17q Jun17q Sep17q Dec17q
% of Revenue
millionsAdj Unlevered Free Cash Flow3
$7 $10 $18 $32 $47 $47
4% 6% 10% 17% 24% 23%
$0
$25
$50
$75
$100
$125
$150
$175
$200
Sep16q Dec16q Mar17q Jun17q Sep17q Dec17q
% of Revenue
millionsUnlevered Free Cash Flow2
1 Net Capital is equal to “Cash Outflows for Purchases of Property and Equipment” less “Additions to Deferred Revenue”2 Unlevered Free Cash Flow is equal to Adjusted EBITDA less “Cash Outflows for Purchases of Property and Equipment”3 Adjusted Unlevered Free Cash Flow is equal to Adjusted EBITDA less “Net Capital” less “Monthly Amortized Revenue”
Zayo Fiber Solutions cash flow stratification
Segment Information

16
$734 $788 $777
0
250
500
750
1000
1250
1500
Sep16q Dec16q Mar17q Jun17q Sep17q Dec17q
$47.5 $48.5 $49.1 $52.6 $54.2 $55.2
$2.5 $2.0 $1.8 $1.8 $1.8 $2.1 $1.1 $1.2 $1.3 $1.4 $1.3 $1.3
$0.2 $0.9 $1.3 $0.9 $1.1 $1.3
$51.2 $52.5 $53.6 $56.7 $58.4 $59.9
$0
$20
$40
$60
$80
$100
Sep16q Dec16q Mar17q Jun17q Sep17q Dec17q
MRR Usage MAR Other Revenue
millions
Revenue Stratification
$8 $20 $11
0
20
40
60
80
100
Sep16q Dec16q Mar17q Jun17q Sep17q Dec17q
Estimated Capital and Upfront
Expenditures associated with Net
New Sales (Bookings) less Upfront
Chargesmillions
thousands
($517) ($519) ($553)
-1.0% -0.9% -1.0%-1500
-1250
-1000
-750
-500
-250
0
Sep16q Dec16q Mar17q Jun17q Sep17q Dec17q
Churn ProcessedGross Installations
MR
R a
nd
MA
R
MR
R a
nd
MA
R
thousands
$217 $269
$224
5% 6% 5%
0
250
500
750
1000
1250
1500
Sep16q Dec16q Mar17q Jun17q Sep17q Dec17q
Net Installationsthousands
MR
R a
nd
MA
R
Churn % =
$663 $719 $942
$38 $103
$71
$702
$823
$1,013
$28M $34M $35M
0
250
500
750
1000
1250
1500
Sep16q Dec16q Mar17q Jun17q Sep17q Dec17q
Net Sales - MRR
Net Sales - MAR
Contract Value =
Net New Sales (Bookings)
thousands
MR
R a
nd
MA
R
Zayo Colocation revenue stratification & operational data
Implied Recurring Revenue Growth1=
1 Calculated as Net Installs annualized, divided by beginning quarter MRR+MAR run-rate
Segment Information

17
$23 $23 $24 $22 $28 $25
45% 44% 44% 38% 48% 41%
$0
$20
$40
$60
$80
Sep16q Dec16q Mar17q Jun17q Sep17q Dec17q
% of Revenue
millions
Purchases of Property and Equipment
$26 $28 $29 $29 $29 $32
51% 52% 54% 52% 50% 53%
$0
$20
$40
$60
$80
Sep16q Dec16q Mar17q Jun17q Sep17q Dec17q
% of Revenue
millions
Adjusted EBITDA
$19 $27 $24
34% 47% 40%
$0
$20
$40
$60
$80
Sep16q Dec16q Mar17q Jun17q Sep17q Dec17q
% of Revenue
millions
Net Capital1
$9 $1 $7
15% 1% 11%
$0
$20
$40
$60
$80
Sep16q Dec16q Mar17q Jun17q Sep17q Dec17q
% of Revenue
millionsAdj Unlevered Free Cash Flow3
$3 $4 $5 $8 $2 $7
7% 8% 9% 14% 3% 11%
$0
$20
$40
$60
$80
Sep16q Dec16q Mar17q Jun17q Sep17q Dec17q
% of Revenue
millionsUnlevered Free Cash Flow2
1 Net Capital is equal to “Cash Outflows for Purchases of Property and Equipment” less “Additions to Deferred Revenue”2 Unlevered Free Cash Flow is equal to Adjusted EBITDA less “Cash Outflows for Purchases of Property and Equipment”3 Adjusted Unlevered Free Cash Flow is equal to Adjusted EBITDA less “Net Capital” less “Monthly Amortized Revenue”
Zayo Colocation cash flow stratification
Segment Information
18
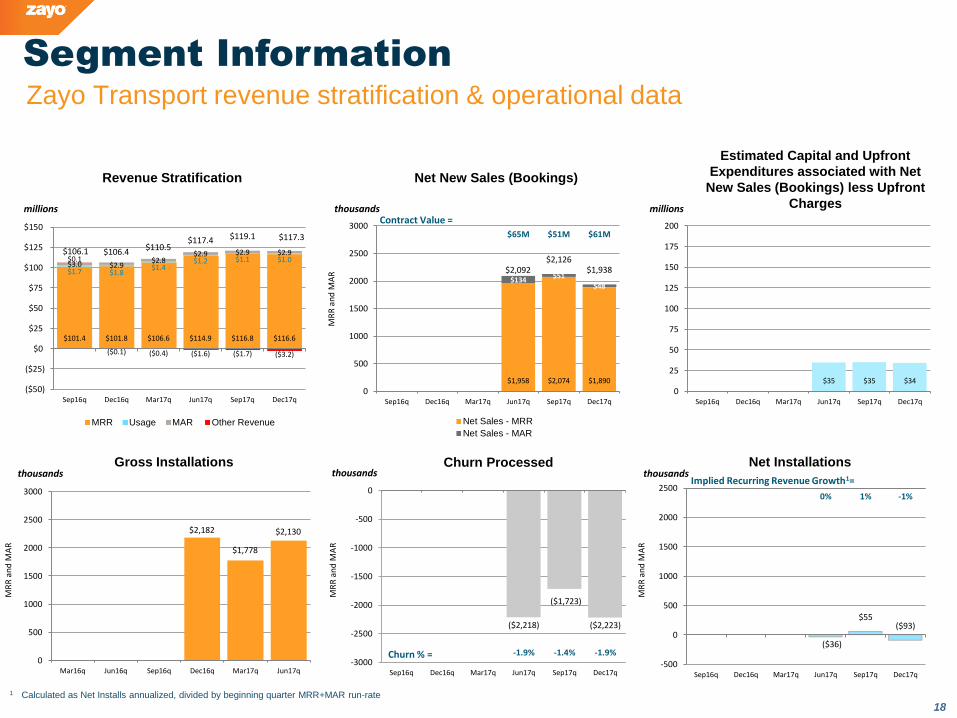
$2,182
$1,778
$2,130
0
500
1000
1500
2000
2500
3000
Mar16q Jun16q Sep16q Dec16q Mar17q Jun17q
$101.4 $101.8 $106.6 $114.9 $116.8 $116.6
$1.7 $1.8 $1.4
$1.2 $1.1 $1.0 $3.0 $2.9
$2.8 $2.9 $2.9 $2.9
$0.1
($0.1) ($0.4) ($1.6) ($1.7) ($3.2)
$106.1 $106.4 $110.5
$117.4 $119.1 $117.3
($50)
($25)
$0
$25
$50
$75
$100
$125
$150
Sep16q Dec16q Mar17q Jun17q Sep17q Dec17q
MRR Usage MAR Other Revenue
millions
Revenue Stratification
$35 $35 $34
0
25
50
75
100
125
150
175
200
Sep16q Dec16q Mar17q Jun17q Sep17q Dec17q
Estimated Capital and Upfront
Expenditures associated with Net
New Sales (Bookings) less Upfront
Chargesmillions
Zayo Transport revenue stratification & operational data
thousands
($2,218)
($1,723)
($2,223)
-1.9% -1.4% -1.9%-3000
-2500
-2000
-1500
-1000
-500
0
Sep16q Dec16q Mar17q Jun17q Sep17q Dec17q
Churn ProcessedGross Installations
MR
R a
nd
MA
R
MR
R a
nd
MA
R
thousands
($36)
$55 ($93)
0% 1% -1%
-500
0
500
1000
1500
2000
2500
Sep16q Dec16q Mar17q Jun17q Sep17q Dec17q
Implied Recurring Revenue Growth1=
Net Installationsthousands
MR
R a
nd
MA
R
Churn % =
$1,958 $2,074 $1,890
$134 $51
$48
$2,092 $2,126
$1,938
$65M $51M $61M
0
500
1000
1500
2000
2500
3000
Sep16q Dec16q Mar17q Jun17q Sep17q Dec17q
Net Sales - MRR
Net Sales - MAR
Contract Value =
Net New Sales (Bookings)
thousands
MR
R a
nd
MA
R
Segment Information
1 Calculated as Net Installs annualized, divided by beginning quarter MRR+MAR run-rate

19
$34 $37 $40 $36 $34 $32
32% 35% 36% 31% 28% 27%
$0
$25
$50
$75
$100
Sep16q Dec16q Mar17q Jun17q Sep17q Dec17q
% of Revenue
millions
Purchases of Property and Equipment
$45 $45 $46 $49 $52 $49
42% 42% 41% 42% 43% 42%
$0
$25
$50
$75
$100
Sep16q Dec16q Mar17q Jun17q Sep17q Dec17q
% of Revenue
millions
Adjusted EBITDA
$31 $33 $28
27% 28% 24%
$0
$25
$50
$75
$100
Sep16q Dec16q Mar17q Jun17q Sep17q Dec17q
% of Revenue
millions
Net Capital1
$15 $16 $18
13% 13% 16%
$0
$25
$50
$75
$100
Sep16q Dec16q Mar17q Jun17q Sep17q Dec17q
% of Revenue
millionsAdj Unlevered Free Cash Flow3
$11 $7 $6 $13 $18 $17
10% 7% 5% 11% 15% 15%
$0
$25
$50
$75
$100
Sep16q Dec16q Mar17q Jun17q Sep17q Dec17q
% of Revenue
millionsUnlevered Free Cash Flow2
1 Net Capital is equal to “Cash Outflows for Purchases of Property and Equipment” less “Additions to Deferred Revenue”2 Unlevered Free Cash Flow is equal to Adjusted EBITDA less “Cash Outflows for Purchases of Property and Equipment”3 Adjusted Unlevered Free Cash Flow is equal to Adjusted EBITDA less “Net Capital” less “Monthly Amortized Revenue”
Zayo Transport cash flow stratification
Segment Information

20
$2,194 $2,242
$2,097
0
500
1000
1500
2000
2500
3000
Sep16q Dec16q Mar17q Jun17q Sep17q Dec17q
$109.5 $109.4 $117.5 $132.7 $135.9 $133.9
$1.6 $1.6 $1.6
$1.3 $1.2 $1.1
$1.9 $1.9 $1.9
$1.9 $1.9 $2.0
$1.4 $1.9 $0.8
$0.7
($1.3)
$8.9
$114.4 $114.7 $121.7
$136.6 $137.7 $145.9
($25)
$0
$25
$50
$75
$100
$125
$150
$175
Sep16q Dec16q Mar17q Jun17q Sep17q Dec17q
MRR Usage MAR Other Revenue
millions
Revenue Stratification
$18 $16 $15
0
25
50
75
100
125
150
Sep16q Dec16q Mar17q Jun17q Sep17q Dec17q
Estimated Capital and Upfront
Expenditures associated with Net
New Sales (Bookings) less Upfront
Chargesmillions
Zayo Enterprise Networks revenue stratification & operational data
thousands
($2,024)
($2,693)($2,146)
-1.5% -2.0% -1.6%-3000
-2500
-2000
-1500
-1000
-500
0
Sep16q Dec16q Mar17q Jun17q Sep17q Dec17q
Churn ProcessedGross Installations
MR
R a
nd
MA
R
MR
R a
nd
MA
R
thousands
$170
($451) ($49)
2% -4% 0%
-500
0
500
1000
1500
2000
2500
Sep16q Dec16q Mar17q Jun17q Sep17q Dec17q
Implied Recurring Revenue Growth1=
Net Installationsthousands
MR
R a
nd
MA
R
Churn % =
$2,264 $1,986 $1,930
$65
$99 $81
$2,329
$2,085 $2,011
$64M $51M $60M
0
500
1000
1500
2000
2500
3000
Sep16q Dec16q Mar17q Jun17q Sep17q Dec17q
Net Sales - MRR
Net Sales - MAR
Contract Value =
Net New Sales (Bookings)
thousands
MR
R a
nd
MA
R
Segment Information
1 Calculated as Net Installs annualized, divided by beginning quarter MRR+MAR run-rate
21
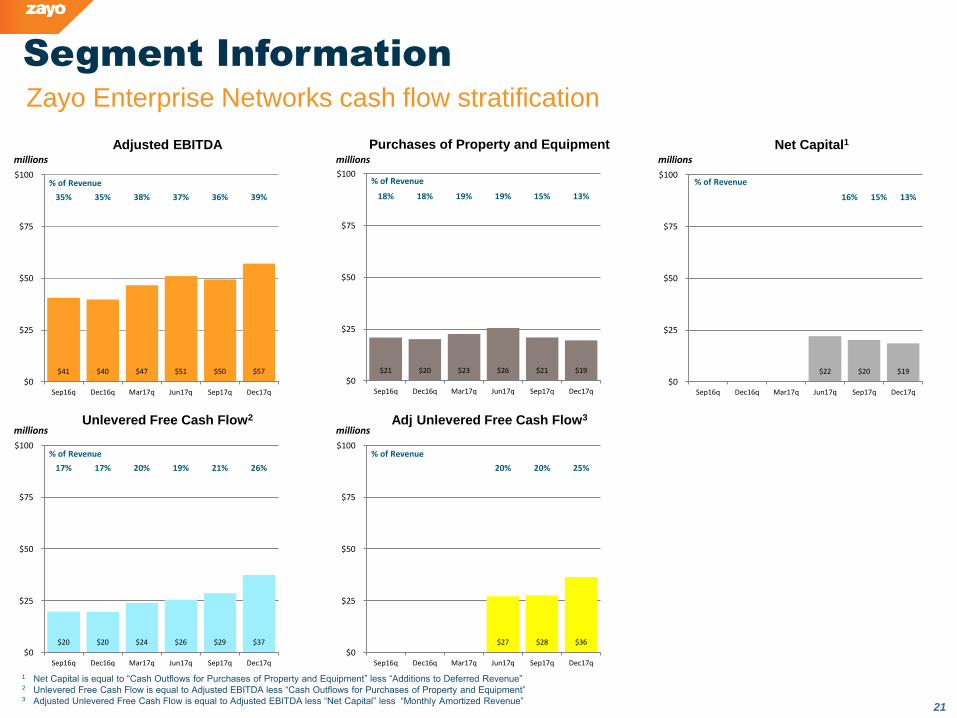
$21 $20 $23 $26 $21 $19
18% 18% 19% 19% 15% 13%
$0
$25
$50
$75
$100
Sep16q Dec16q Mar17q Jun17q Sep17q Dec17q
% of Revenue
millions
Purchases of Property and Equipment
$41 $40 $47 $51 $50 $57
35% 35% 38% 37% 36% 39%
$0
$25
$50
$75
$100
Sep16q Dec16q Mar17q Jun17q Sep17q Dec17q
% of Revenue
millions
Adjusted EBITDA
$22 $20 $19
16% 15% 13%
$0
$25
$50
$75
$100
Sep16q Dec16q Mar17q Jun17q Sep17q Dec17q
% of Revenue
millions
Net Capital1
$27 $28 $36
20% 20% 25%
$0
$25
$50
$75
$100
Sep16q Dec16q Mar17q Jun17q Sep17q Dec17q
% of Revenue
millionsAdj Unlevered Free Cash Flow3
$20 $20 $24 $26 $29 $37
17% 17% 20% 19% 21% 26%
$0
$25
$50
$75
$100
Sep16q Dec16q Mar17q Jun17q Sep17q Dec17q
% of Revenue
millionsUnlevered Free Cash Flow2
1 Net Capital is equal to “Cash Outflows for Purchases of Property and Equipment” less “Additions to Deferred Revenue”2 Unlevered Free Cash Flow is equal to Adjusted EBITDA less “Cash Outflows for Purchases of Property and Equipment”3 Adjusted Unlevered Free Cash Flow is equal to Adjusted EBITDA less “Net Capital” less “Monthly Amortized Revenue”
Zayo Enterprise Networks cash flow stratification
Segment Information

HISTORICAL FINANCIAL DATA
& RECONCILIATIONS
2323
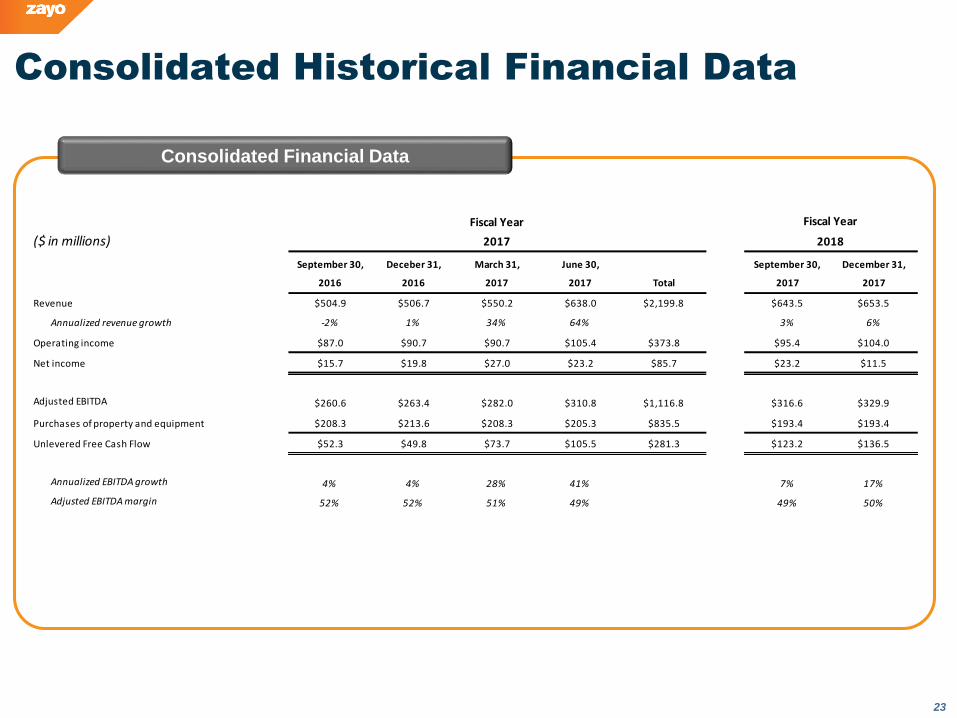
Consolidated Historical Financial Data
Consolidated Financial Data
($ in millions)
September 30, Deceber 31, March 31, June 30, September 30, December 31,
2016 2016 2017 2017 Total 2017 2017
Revenue $504.9 $506.7 $550.2 $638.0 $2,199.8 $643.5 $653.5
Annualized revenue growth -2% 1% 34% 64% 3% 6%
Operating income $87.0 $90.7 $90.7 $105.4 $373.8 $95.4 $104.0
Net income $15.7 $19.8 $27.0 $23.2 $85.7 $23.2 $11.5
Adjusted EBITDA $260.6 $263.4 $282.0 $310.8 $1,116.8 $316.6 $329.9
Purchases of property and equipment $208.3 $213.6 $208.3 $205.3 $835.5 $193.4 $193.4
Unlevered Free Cash Flow $52.3 $49.8 $73.7 $105.5 $281.3 $123.2 $136.5
Annualized EBITDA growth 4% 4% 28% 41% 7% 17%
Adjusted EBITDA margin 52% 52% 51% 49% 49% 50%
Fiscal Year
20182017
Fiscal Year

2424
Consolidated Historical Financial Data –
Without AllstreamConsolidated Financial Data
($ in millions)
Consolidated Allstream
Consolidated
Excluding
Allstream
Revenue $653.5 $123.5 $530.0
Annualized revenue growth 6% 11%
Operating income $104.0 $4.1 $99.9
Net income $11.5 $0.9 $10.6
Adjusted EBITDA $329.9 $29.9 $300.0
Purchases of property and equipment 193.4 2.9 190.5
Unlevered Free Cash Flow $136.5 $27.0 $109.5
Annualized EBITDA growth 17% 20%
Adjusted EBITDA margin 50% 57%
December 31,
2017
2525
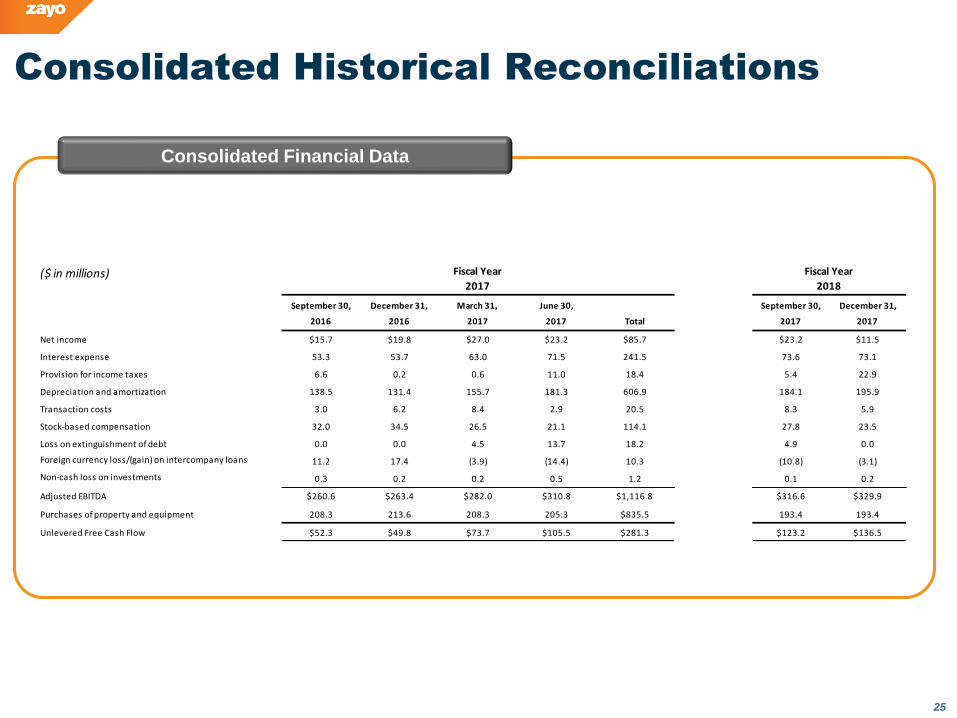
Consolidated Historical Reconciliations
Consolidated Financial Data
($ in millions)
September 30, December 31, March 31, June 30, September 30, December 31,
2016 2016 2017 2017 Total 2017 2017
Net income $15.7 $19.8 $27.0 $23.2 $85.7 $23.2 $11.5
Interest expense 53.3 53.7 63.0 71.5 241.5 73.6 73.1
Provision for income taxes 6.6 0.2 0.6 11.0 18.4 5.4 22.9
Depreciation and amortization 138.5 131.4 155.7 181.3 606.9 184.1 195.9
Transaction costs 3.0 6.2 8.4 2.9 20.5 8.3 5.9
Stock-based compensation 32.0 34.5 26.5 21.1 114.1 27.8 23.5
Loss on extinguishment of debt 0.0 0.0 4.5 13.7 18.2 4.9 0.0
Foreign currency loss/(gain) on intercompany loans 11.2 17.4 (3.9) (14.4) 10.3 (10.8) (3.1)
Non-cash loss on investments 0.3 0.2 0.2 0.5 1.2 0.1 0.2
Adjusted EBITDA $260.6 $263.4 $282.0 $310.8 $1,116.8 $316.6 $329.9
Purchases of property and equipment 208.3 213.6 208.3 205.3 $835.5 193.4 193.4
Unlevered Free Cash Flow $52.3 $49.8 $73.7 $105.5 $281.3 $123.2 $136.5
Fiscal Year
2018
Fiscal Year
2017

2626
Consolidated Historical Reconciliations –
Without AllstreamConsolidated Financial Data
($ in millions)
Consolidated Allstream
Consolidated
Excluding
Allstream
Net income $11.5 $0.9 $10.6
Interest expense $73.1 3.9 69.2
Provision for income taxes $22.9 0.0 22.9
Depreciation and amortization $195.9 19.5 176.4
Transaction costs $5.9 2.2 3.7
Stock-based compensation $23.5 3.4 20.1
Foreign currency gain on intercompany loans ($3.1) 0.0 (3.1)
Non-cash loss on investments $0.2 0.0 0.2
Adjusted EBITDA $329.9 $29.9 $300.0
Purchases of property and equipment 193.4 2.9 190.5
Unlevered Free Cash Flow $136.5 $27.0 $109.5
December 31,
2017

2727
Segment Data Reconciliation:
Net (Loss)/Earnings to Adjusted EBITDASegment Data Reconciliation1
1 A reconciliation of previous quarters’ legacy segment information can be found in our historical earnings supplements found on our website at http://investors.zayo.com/earnings-releases
($ in millions)
Fiber Solutions zColo Transport
Enterprise
Networks Allstream
Corporate/Interco
mpany Elimination
Zayo Group
Holdings
Net income/(loss) $9.6 ($2.5) $4.8 $17.7 $0.9 (19.0) $11.5
Interest expense/(income) 42.1 7.7 8.9 10.7 3.9 (0.2) 73.1
Provision for income taxes 0.0 0.0 0.0 0.0 0.0 22.9 22.9
Depreciation and amortization 99.9 22.8 31.4 21.9 19.5 0.4 195.9
Transaction costs 1.4 0.5 0.7 1.0 2.2 0.1 5.9
Stock-based compensation 7.7 3.0 3.4 5.8 3.4 0.2 23.5
Foreign currency gain on intercompany loans 0.0 0.0 0.0 0.0 0.0 (3.1) (3.1)
Non-cash loss on investments 0.3 0.0 0.0 (0.1) 0.0 0.0 0.2
Adjusted EBITDA $161.0 $31.5 $49.2 $57.0 $29.9 $1.3 $329.9
Three months ended December 31, 2017
2828
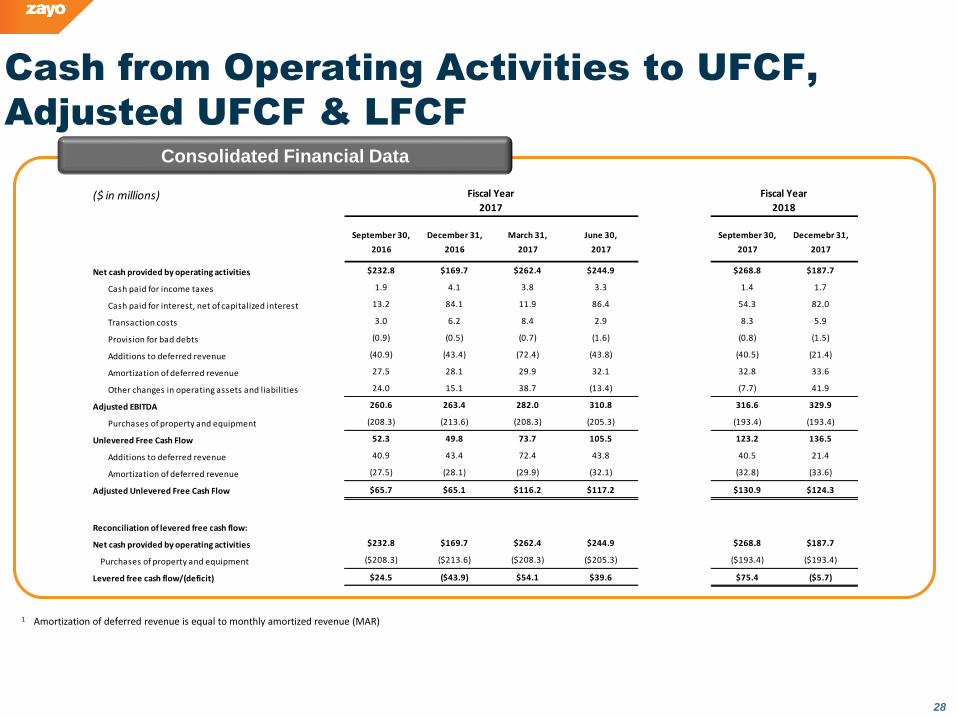
Cash from Operating Activities to UFCF,
Adjusted UFCF & LFCFConsolidated Financial Data
1
1 Amortization of deferred revenue is equal to monthly amortized revenue (MAR)
($ in millions)
September 30, December 31, March 31, June 30, September 30, Decemebr 31,
2016 2016 2017 2017 2017 2017
Net cash provided by operating activities $232.8 $169.7 $262.4 $244.9 $268.8 $187.7
Cash paid for income taxes 1.9 4.1 3.8 3.3 1.4 1.7
Cash paid for interest, net of capitalized interest 13.2 84.1 11.9 86.4 54.3 82.0
Transaction costs 3.0 6.2 8.4 2.9 8.3 5.9
Provision for bad debts (0.9) (0.5) (0.7) (1.6) (0.8) (1.5)
Additions to deferred revenue (40.9) (43.4) (72.4) (43.8) (40.5) (21.4)
Amortization of deferred revenue 27.5 28.1 29.9 32.1 32.8 33.6
Other changes in operating assets and liabilities 24.0 15.1 38.7 (13.4) (7.7) 41.9
Adjusted EBITDA 260.6 263.4 282.0 310.8 316.6 329.9
Purchases of property and equipment (208.3) (213.6) (208.3) (205.3) (193.4) (193.4)
Unlevered Free Cash Flow 52.3 49.8 73.7 105.5 123.2 136.5
Additions to deferred revenue 40.9 43.4 72.4 43.8 40.5 21.4
Amortization of deferred revenue (27.5) (28.1) (29.9) (32.1) (32.8) (33.6)
Adjusted Unlevered Free Cash Flow $65.7 $65.1 $116.2 $117.2 $130.9 $124.3
Reconciliation of levered free cash flow:
Net cash provided by operating activities $232.8 $169.7 $262.4 $244.9 $268.8 $187.7
Purchases of property and equipment ($208.3) ($213.6) ($208.3) ($205.3) ($193.4) ($193.4)
Levered free cash flow/(deficit) $24.5 ($43.9) $54.1 $39.6 $75.4 ($5.7)
Fiscal Year
2018
Fiscal Year
2017
2929
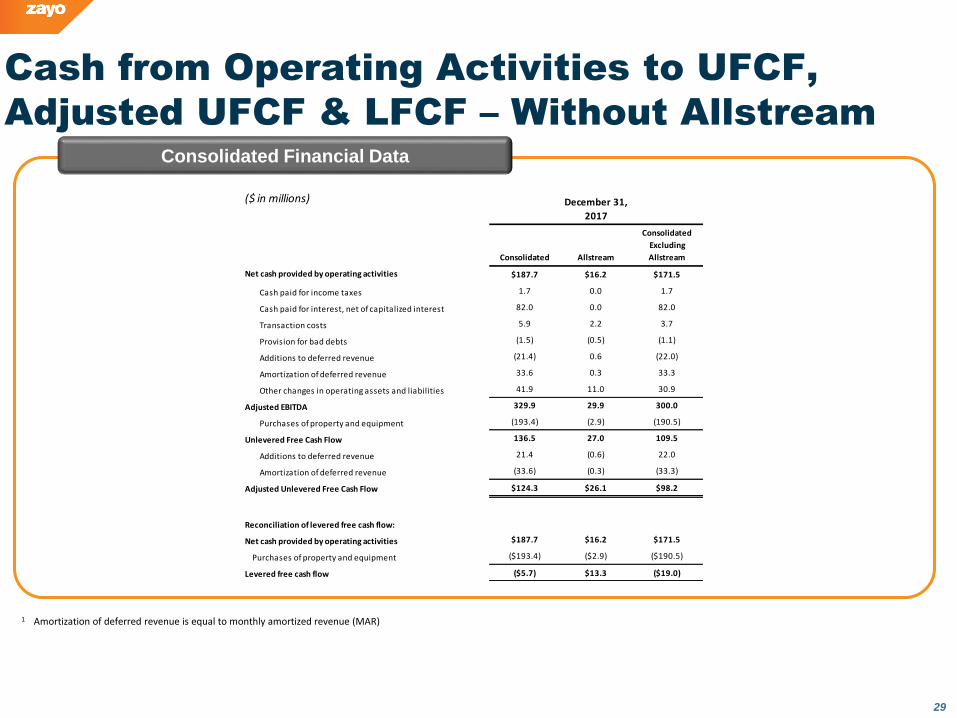
Cash from Operating Activities to UFCF,
Adjusted UFCF & LFCF – Without AllstreamConsolidated Financial Data
1
1 Amortization of deferred revenue is equal to monthly amortized revenue (MAR)
($ in millions)
Consolidated Allstream
Consolidated
Excluding
Allstream
Net cash provided by operating activities $187.7 $16.2 $171.5
Cash paid for income taxes 1.7 0.0 1.7
Cash paid for interest, net of capitalized interest 82.0 0.0 82.0
Transaction costs 5.9 2.2 3.7
Provision for bad debts (1.5) (0.5) (1.1)
Additions to deferred revenue (21.4) 0.6 (22.0)
Amortization of deferred revenue 33.6 0.3 33.3
Other changes in operating assets and liabilities 41.9 11.0 30.9
Adjusted EBITDA 329.9 29.9 300.0
Purchases of property and equipment (193.4) (2.9) (190.5)
Unlevered Free Cash Flow 136.5 27.0 109.5
Additions to deferred revenue 21.4 (0.6) 22.0
Amortization of deferred revenue (33.6) (0.3) (33.3)
Adjusted Unlevered Free Cash Flow $124.3 $26.1 $98.2
Reconciliation of levered free cash flow:
Net cash provided by operating activities $187.7 $16.2 $171.5
Purchases of property and equipment ($193.4) ($2.9) ($190.5)
Levered free cash flow ($5.7) $13.3 ($19.0)
December 31,
2017

3030
AFFO & Net AFFO Reconciliation
AFFO & Net AFFO Reconciliation
September 30, December 31, March 31, June 30, September 30, December 31,
2016 2016 2017 2017 2017 2017
Net income $15.7 $19.8 $27.0 $23.2 $23.2 $11.5
Depreciation and Amortization Expense 138.5 131.4 155.7 181.3 184.1 195.9
Foreign currency loss/(gain) on intercompany loans 11.2 17.4 (3.9) (14.4) (10.8) (3.1)
Stock-based compensation 32.0 34.5 26.5 21.1 27.8 23.5
Transaction costs 3.0 6.2 8.4 2.9 8.3 5.9
Loss on extinguishment of debt 0.0 0.0 4.5 13.7 4.9 0.0
Non-cash loss on investments 0.3 0.2 0.2 0.5 0.1 0.2
Amortization of deferred revenue (27.5) (28.1) (29.9) (32.1) (32.8) (33.6)
Maintenance capital expenditures (7.1) (7.5) (7.2) (7.1) (6.6) (5.4)
AFFO $166.1 $173.9 $181.3 $189.1 $198.2 $194.9
Upfront customer payments on <12 mo payback of new sales 32.1 24.0 20.7 31.0 71.4 66.6
Capital expenditures for <12 mo payback net new sales (34.4) (23.7) (27.4) (29.1) (51.5) (48.0)
Capital expenditures for network capacity (37.7) (47.8) (34.5) (30.8) (31.5) (33.0)
Net AFFO $126.1 $126.4 $140.1 $160.2 $186.6 $180.6
2017
Fiscal Year
2018
Fiscal Year

3131
AFFO & Net AFFO Reconciliation – Without
AllstreamAFFO & Net AFFO Reconciliation
($ in millions)
Consolidated Allstream
Consolidated
Excluding
Allstream
Net income $11.5 $0.9 $10.6
Depreciation and Amortization Expense 195.9 19.5 176.4
Foreign currency gain on intercompany loans (3.1) 0.0 (3.1)
Stock-based compensation 23.5 3.4 20.1
Transaction costs 5.9 2.2 3.7
Non-cash loss on investments 0.2 0.0 0.2
Amortization of deferred revenue (33.6) (0.3) (33.3)
Maintenance capital expenditures (5.4) 0.0 (5.4)
AFFO 194.9 25.7 169.2
Upfront customer payments on <12 mo payback of new sales 66.6 0.4 66.3
Capital expenditures for <12 mo payback net new sales (48.0) (2.1) (45.9)
Capital expenditures for network capacity (33.0) 0.0 (33.0)
Net AFFO $180.6 $24.0 $156.6
December 31, 2017